Annual Report 2013: In Brief
ISSN: 2291-7322
Catalogue number: H78-1/2013E-PDF
PDF version
Full Annual Report 2013
The mandate of the Patented Medicine Prices Review Board is to ensure that prices at which patentees sell their patented medicines in Canada are not excessive; and to report on pharmaceutical trends of all medicines and on R&D spending by patentees.
The PMPRB Annual Report includes a review of the PMPRB's major activities, analyses of the prices of patented medicines and of the price trends of all drugs, and reports on the R&D expenditures as reported by patentees.
The PMPRB Annual Report: In Brief provides stakeholders/subscribers with all of the pertinent information contained within the Annual Report in a condensed format.
May 30, 2014
The Honourable Rona Ambrose, P.C., M.P.
Minister of Health
House of Commons
Ottawa, Ontario
K1A 0A6
Dear Minister:
I have the pleasure to present to you, in accordance with sections 89 and 100 of the Patent Act, the Annual Report of the Patented Medicine Prices Review Board for the year ended December 31, 2013.
Yours very truly,
Mary Catherine Lindberg
Chairperson
About the Patented Medicine Prices Review Board
The Patented Medicine Prices Review Board (PMPRB) is an independent, quasi-judicial body established by Parliament in 1987 under the Patent Act.
The PMPRB has a dual role:
- to ensure that prices at which patentees sell their patented medicines in Canada are not excessive
- to report on pharmaceutical trends of all medicines and on R&D spending by patentees
The PMPRB has no authority to regulate the prices of nonpatented drugs and does not have jurisdiction over prices charged by wholesalers or pharmacies, or over pharmacists' professional fees.
As a reliable, impartial source of comprehensive information on drug prices, the PMPRB is committed to transparency, accessibility and stakeholder engagement.
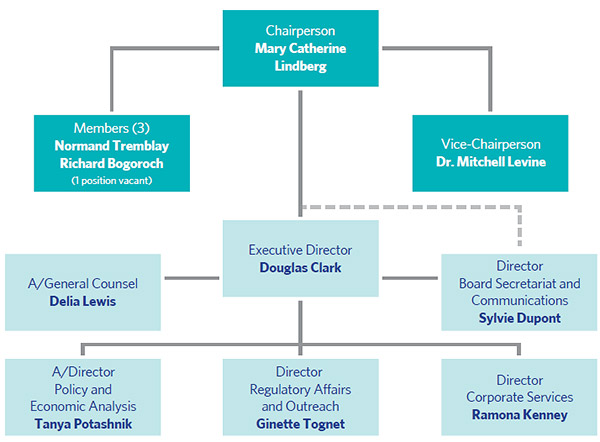
Governance
The Board consists of up to five members who serve on a part-time basis. Members, including a Chairperson and a Vice-Chairperson, are appointed by the Governor-in-Council. The Chairperson is designated under the Act as the Chief Executive Officer of the PMPRB with the authority and responsibility to supervise and direct its work.
Budget
In 2013/14, the PMPRB had a budget of $10.944 million and an approved staff level of 74 full-time equivalent employees. $2.47 million of the total budget resided in a Special Purpose Allotment (SPA) reserved for public hearings. Unspent SPA funds were returned to the Consolidated Revenue Fund.
Organizational Structure and Staff
Regulatory Burden Reduction
In alignment with the Government's Red Tape Reduction Plan and the Economic Action Plan, the PMPRB committed to examining its price review process to identify possible ways to reduce the regulatory burden on patentees while protecting its core mandate of consumer protection.
To date, the review has focused on two initiatives:
1. Modification to the PMPRB's Consumer Price Index (CPI) Adjustment Methodology
After consultation, the Board approved a new lagged CPI Adjustment Methodology, which will come into effect in 2015. The new approach will use the actual 2013 CPI to determine the CPI-Based Price-Adjustment Factors for 2015.
2. The feasibility of changing the frequency of filing for patented medicines
Following an informal consultation on proposed amendments, the PMPRB has announced its plan for regulatory amendments.
In addition, the PMPRB posted the following new service standards to clarify expectations and increase predictability in the federal regulatory system:
- Service standards for the scientific review of new patented drug products
- Service standards for the price review of new patented drug products
- Service standards for the price review of existing patented drug products
Communications and Outreach
The PMPRB regularly informs its stakeholders of its activities through publications, such as the quarterly NEWSletter and the Annual Report. We also publish the results of NPDUIS analytical research studies.
To reduce costs and decrease the environmental impact of printing, our publications are now only available as electronic documents. In addition, we are placing a greater reliance on our website and social media for collaboration with stakeholders.
Both industry and non-industry stakeholders are regularly consulted and updated by the PMPRB. Industry stakeholders are promptly informed of changes in the operating environment and/or the regulatory process. To facilitate patentees' access to information, the Regulatory Affairs and Outreach Branch conducts outreach sessions with patentees.
In 2013, the PMPRB continued to enhance its non-industry stakeholder engagement through bi-lateral exchanges with federal/provincial/territorial health representatives, third-party payers and other groups.
Regulating the Prices of Patented Medicines
The PMPRB is responsible for regulating the prices that patentees charge for patented drug products sold in Canada to ensure that they are not excessive.
Patentees are required by law to file information pertaining to the sale of their drug products in Canada. The Patent Act (Act) along with the Patented Medicines Regulations (Regulations) set out the filing requirements, and Board Staff reviews the pricing information on an ongoing basis. The price of a patented drug product is under the PMPRB's jurisdiction until the patent expires.
Although patentees are not required to obtain approval of the price prior to selling the patented drug product, they are required to ensure that the price is not excessive.
Board Staff reviews the prices of each strength of an individual dosage form of each patented medicine sold in Canada. There are several factors used for determining whether a drug product is excessively priced, as outlined in section 85 of the Act. The Compendium of Policies, Guidelines and Procedures (Guidelines) details the various price tests used by Board Staff to determine whether a price charged by a patentee falls within the maximum allowable price.
When it finds that the price of a patented drug product appears to exceed the Guidelines, and the circumstances meet the criteria for commencing an investigation, Board Staff will conduct an investigation. An investigation could result in one of the following:
- its closure where it is concluded that the price was within the Guidelines
- a Voluntary Compliance Undertaking (VCU) by the patentee to reduce the price of the patented drug product to a non-excessive level and offset excess revenues obtained as a result of excessive price through a payment and/or an additional price reduction, or the price reduction of another patented drug product
- a recommendation from Board Staff to the Chairperson to issue a Notice of Hearing to hold a public hearing into the price of a patented medicine
Price Review of Patented Drug Products Reported to the PMPRB
The total number of patented drug products for human use in 2013 was 1,343. The table below provides a breakdown in terms of new and existing patented drug products as well as a summary of the status of the price review.
Patented Drug Products for Human Use Sold in 2013 — Status of Price Review as of March 31, 2014 (Table 4 of the full Annual Report)
|
New drug products introduced in 2013 |
Existing drug products |
Total |
| Total |
115 |
1,228 |
1,343 |
| Within Guidelines |
93 |
1,005 |
1,098 |
| Under Review |
0 |
2 |
2 |
| Does Not Trigger Investigation |
7 |
157 |
164 |
| Under Investigation |
15 |
51 |
66 |
| Voluntary Compliance Undertakings |
0 |
13 |
13 |
| Price Hearings |
0 |
0 |
0 |
Formal Complaints
The PMPRB received three formal complaints into the prices of Differin, Nexium and Spiriva. Investigations were launched to review the prices of the three patented drug products. The prices of Nexium and Spiriva were found to be within the Guidelines. The investigation into the price of Differin is ongoing.
Voluntary Compliance Undertakings and Hearings
In 2013 and up to May 30, 2014, the Chairperson approved 6 VCUs to reduce the price of patented drug products to a non-excessive level.
In addition to price reductions, excess revenues totaling $10.5 million were offset by way of payments to the Government of Canada through VCUs and Board Orders in 2013 up to May 30, 2014.
In 2013, the Board issued decisions and/or orders effectively completing one matter: Tactuo, on price. In February 2014, the Copaxone matter was also concluded.
Two matters remain before the Board: Apotex Inc. and Apo-Salvent CFC Free. The outcome of these matters will be examined in light of the recent Federal Court decisions into three other matters: ratio-Salbutamol HFA, ratiopharm and Sandoz, on the Board's jurisdiction over the prices of patented or licensed generic drugs.
Matters before the Federal Court
The Federal Court heard the Copaxone Redetermination case on February 5, 2013. The Court released its decision on April 30, 2013, allowing the Teva application, quashing the Board's February 23, 2012, decision and returning the matter to a different hearing panel of the Board for redetermination. The new panel received a joint submission from the parties and accepted a Voluntary Compliance Undertaking to offset excess revenues. An Order concluding this matter was issued on February 14, 2014.
Three other Board decisions had been subject to judicial review by the Federal Court: ratio-Salbutamol HFA (T-1058-11; T-1825-11); ratiopharm Inc. (now Teva Canada) (T-1252-11); and Sandoz Canada Inc. (T-1616-12). The Court heard these matters in November 2013 and released its decisions on May 27, 2014. The Federal Court allowed the applications for judicial review and referred the matters back to the Board with a direction that it find that ratiopharm Inc. and Sandoz Canada Inc. are not patentees.
Since 1993, a total of 95 VCUs have been approved and 26 public hearings have been initiated. Approximately $147 million have been collected through VCUs and Board Orders by way of payments to the Government of Canada and/or to customers such as hospitals and clinics.
Key Pharmaceutical Trends
Trends in Sales of Patented Drug Products
In 2013, sales of patented drug products increased to $13.6 billion from $12.8 billion in 2012, an increase of 6.5%. By comparison, the annual growth in sales stood at 27.0% in 1999 and remained in double-digits until 2003.
Throughout the latter part of the 1990s, sales growth was largely driven by a succession of new “blockbuster” products that achieved very high sales volumes. Since that time, changes in the Canadian pharmaceutical environment, along with a reduction in the rate of introduction of new high-volume products, has resulted in decreased sales growth of patented drug products.
The increase in sales that occurred between 2012 and 2013 was the result of underlying increases in the quantities of existing and new drug products sold. The volume effect alone was large enough to offset the negative effect of other factors.
In 2003, patented drug products as a share of all drug sales was 72.7%. The share gradually declined to 56.0% in 2010, implying that sales of generic and non-patented branded drug products grew faster than sales of patented drug products. In the last three years, the share has increased slightly to 61.8% in 2013.
Drugs in the cardiovascular system and the genito-urinary system and sex hormones therapeutic classes accounted for the greatest decrease in patented sales, while those in the antineoplastic and immunomodulating agents class accounted for the greatest increase.
Price Trends
The PMPRB uses the Patented Medicines Price Index (PMPI) to monitor trends in prices of patented drug products sold in Canada. The PMPI measures the average year-over-year change in the ex-factory prices using a formula that takes a Canadian sales-weighted average of price changes observed at the level of individual products, similar to the approach used to calculate the Consumer Price Index (CPI). The PMPI has been consistently below the CPI.
As measured by the PMPI, prices of patented drug products increased slightly, on average, by 0.5% between 2012 and 2013. The CPI for the same period was 0.9%.
The average rates of price change by class of customer were obtained by applying the PMPI methodology separately to sales data for hospital, pharmacy and wholesale customers. The 2013 rates of price change for these classes were, respectively, -0.6%, 0.4% and 1.4%.
Annual Rate of Change, Patented Medicines Price Index (PMPI) and Consumer Price Index (CPI), 1988–2013 (Figure 4 of the full Annual Report)
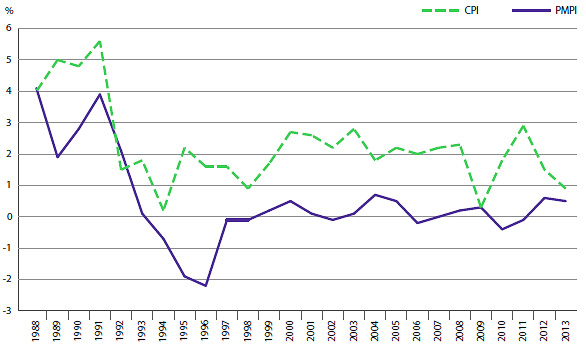
Source: PMPRB; Statistics Canada
International Comparisons
The Act and Regulations require patentees to report publicly available ex-factory prices of their patented drug products for seven foreign comparator countries: France, Germany, Italy, Sweden, Switzerland, the United Kingdom, and the United States. The PMPRB uses this information to conduct its international price comparison tests and reports on trends.
Price Change by Country
In 2013, the United States saw ex-factory gate prices rise on average at a rate of 11.2%. The UK saw a much more modest average price increase of 0.7%, while Germany saw no change. Prices in France, Italy, Sweden and Switzerland declined (-4.9%, -1.6%, -5.0% and -4.9%, respectively).
Price Level by Country
On an annual basis, the PMPRB conducts bilateral and multilateral price comparisons for each of the seven comparator countries using market exchange rates for currency conversion.
As in previous years, in 2013, Canadian prices were typically within the range of prices observed among the comparator countries. Prices in France, the United Kingdom, Italy, Sweden and Switzerland (28%, 21%, 22%, 10% and 5%, respectively) were lower than Canadian prices, while those in Germany were slightly higher (4%). As in previous years, prices reported for the United States were appreciably higher than in Canada (107%).
Average Foreign-to-Canadian Price Ratios: 2005, 2013 (Figure 9 of the full Annual Report)
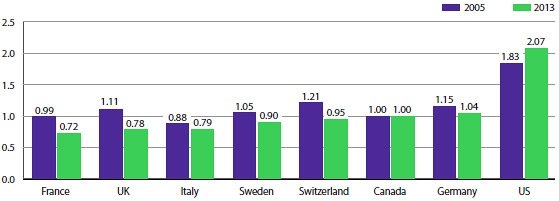
Source: PMPRB
The median international price (MIP), the median of prices observed among the seven comparator countries, is one of the measures used in multilateral price comparisons. The average MIP-to-Canadian price ratio stood at 1.06 in 2013. This indicates that the median price of patented drug products in the seven comparator countries was 6% higher than Canadian prices last year. Since 2006, the ratio has remained somewhat consistent, ranging between 1.03 and 1.07.
Canadian Drug Expenditures in the Global Context
Based on global sales data from MIDAS©, 2005–20131, the Canadian market accounted for 2.5% of the global market in 2012. The Canadian share has remained between 2.4% and 2.7% from 2005 to 2013.
During that same time period, drug sales in Canada rose at an annual average rate of approximately 3.8%, in line with the average annual rate of growth in the comparator countries.
Distribution of Drug Sales Among Major National Markets, 2013 (Figure 13 of the full Annual Report)
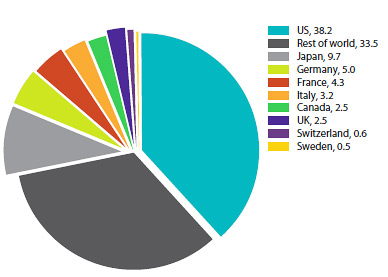
Source: MIDAS©, 2005–20131
R&D Expenditures
Patentees reported total 2013 sales revenues of $16.8 billion, an increase of 0.4% from 2012. Sales revenues reported by Rx&D members were $12.2 billion, accounting for 72.3% of the total.
Patentees reported R&D expenditures of $752.8 million in 2013, a decrease of 15.9% over 2012. Rx&D members reported R&D expenditures of $652.0 million in 2012, a decrease of 16.7% over last year. Rx&D members accounted for 86.6% of all reported R&D expenditures in 2013.
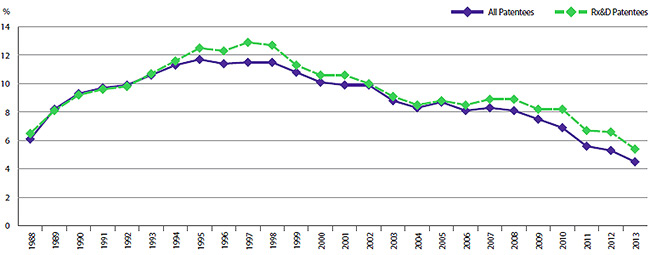
When the Act was amended in 1987, Rx&D members made a public commitment to increase their annual research and development expenditures to 10% of sales revenues by 1996. This level of R&D expenditure was obtained by 1993. However, since 2003, R&D-to-sales ratios for all patentees and for Rx&D members have been declining. In 2013, the ratio of R&D expenditures to sales revenues for all patentees was 4.5%, down from 5.3% in 2012. These values are close to figures last observed in 1988. The overall R&D-to-sales ratio has been less than 10% for the past 13 consecutive years. The ratio for members of Rx&D was 5.4%, down from 6.6% in 2012. This is the lowest value recorded since a ratio of 6.5% was recorded in 1988, the first year the PMPRB began reporting on these figures. The Rx&D ratio has been less than 10% for the past 11 consecutive years.
Patentees reported spending $67.6 million on basic research in 2013, representing 9.3% of current R&D expenditures and a decline of 41.0% over the previous year. Patentees reported spending $487.8 million on applied research, representing 66.9% of current R&D expenditures. Clinical trials accounted for 68.5% of applied research expenditures.
Compared to the PMPRB's seven comparator countries, in 2010 Canada's R&D-to-sales ratio was the lowest at 5.6%. With the exception of Italy (at 6.2%), ratios in all other comparator countries were well above Canada's. On average, the R&D-to-sales ratio for all comparator countries was 21.7%.
R&D-to-Sales Ratio, Pharmaceutical Patentees, 1988–2013 (Figure 18 of the full Annual Report)
Source: PMPRB
R&D-to-Sales Ratios, Canada and Comparator Countries (Figure 20 of the full Annual Report)
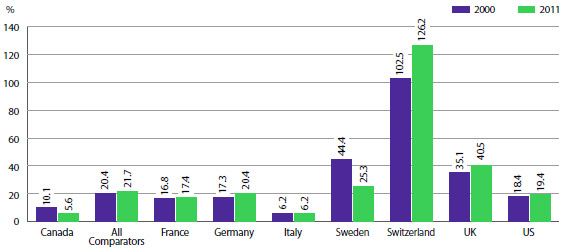
Source: PMPRB; European Federation of Pharmaceutical Industries and Associations (EFPIA): The Pharmaceutical Industry in Figures 2013, PhRMA 2013 profile
As noted in last year's report, there are a multitude of factors that drive the location of pharmaceutical R&D. These include where companies can find the best science base at reasonable cost and ready access to a quality clinical trials infrastructure. Although price levels are often cited as an important policy lever for attracting R&D, the data has not supported this link domestically or internationally.
National Prescription Drug Utilization Information System
Through the National Prescription Drug Utilization Information System (NPDUIS), the PMPRB and the Canadian Institute for Health Information work with their federal/provincial/ territorial government partners to provide critical analyses of price, utilization and cost trends in support of drug plan policy decision making.
The PMPRB through the NPDUIS published four analytical studies in 2013/14:
- New Drug Pipeline Monitor – 5th Edition
- The Drivers of Prescription Drug Expenditures – A Methodological Report
- Analytical Snapshot: International Generic Price Comparison, Early 2011
- Utilization of Prescription Opioids in Canada's Public Drug Plans, 2006/07 to 2012/13
Additional studies currently under development are summarized in the NPDUIS Research Agenda.
1 IMS Health Incorporated or its affiliates. All rights reserved.
Although based in part on data obtained under license from the MIDAS IMS database, the statements, findings, conclusions, views and opinions expressed in this Annual Report are exclusively those of the PMPRB and are not attributable to IMS AG.