ISSN: 1495-0561
Catalogue number: H78-2013E-PDF
PDF version
The mandate of the Patented Medicine Prices Review Board is to ensure that prices at which patentees sell their patented medicines in Canada are not excessive; and to report on pharmaceutical trends of all medicines and on R&D spending by patentees.
Statistical Highlights 2013
Regulatory Mandate
Compliance
- 115 new patented drug products for human use were reported to the PMPRB
- 93 were within the Guidelines
- In total, 1,343 patented drug products for human use were under the PMPRB's jurisdiction
Enforcement
Up to May 30, 2014:
- 6 Voluntary Compliance Undertakings were accepted resulting in price reductions and a total of $10.5 million in excess revenues offset by way of payment to the Government of Canada
- Two hearings were completed: Copaxone (redetermination) and Tactuo, both on price
- There are no Board decisions pending
- Two matters remain before the Board: Apotex Inc. and Apo-Salvent CFC Free
- Federal Court decisions were issued in three matters: ratio- Salbutamol HFA, ratiopharm Inc. and Sandoz Canada Inc.
Reporting Mandate
Sales Trends
- Sales of patented drug products increased by 6.5% to $13.6 billion
- The share of patented drug products as a percentage of total sales rose from 59.3% in 2012 to 61.8% in 2013
- Antineoplastics and immunomodulating agents made the largest positive contribution to sales growth
Patented Drug Price Trends
- Prices of patented drug products sold by patentees, as measured by the Patented Medicines Price Index, increased, on average, by 0.5% and the Consumer Price Index rose by 0.9%.
- Canadian prices were the 3rd highest among the seven comparator countries, lower than prices in Germany and the US.
Research and Development
- Patentees reported total R&D expenditures of $752.8 million, a decrease of 15.9% over 2012
- Rx&D members reported $652.0 million in R&D expenditures, a decrease of 16.7% over 2012
- R&D-to-sales ratios decreased in 2013:
- all patentees, from 5.3% in 2012 to 4.5%
- Rx&D members, from 6.6% in 2012 to 5.4%
Letter to the Minister
May 30, 2014
The Honourable Rona Ambrose, P.C., M.P.
Minister of Health
House of Commons
Ottawa, Ontario
K1A 0A6
Dear Minister:
I have the pleasure to present to you, in accordance with sections 89 and 100 of the Patent Act, the Annual Report of the Patented Medicine Prices Review Board for the year ended December 31, 2013.
Yours very truly,
Mary Catherine Lindberg
Chairperson
Chairperson's Message
With our 25th anniversary now squarely in the rear-view mirror, this past year marks the dawn of a new era in the PMPRB's reporting history. As the organization looks to the future, there are many challenging developments competing for its attention. Rarely have regulators and stakeholders in the pharmaceutical industry seen such interesting times. Whether this amounts to a privilege or a curse depends on one's point of view of course, but we at the PMPRB take the former view as we look to connect the many disparate dots in our environment and map out our strategic priorities for the coming years.
The last several years have seen very modest growth in prescribed drug spending in Canada, a stark contrast with trends in the late 1990's and early 2000's. In 2012, drug spending grew by only 2.3%, and 1.3% the year before, its lowest rate in decades. Experts agree that this is due mainly to recent provincial joint purchasing initiatives, a number of "blockbuster" drugs going off patent, and a reduction in the rate of introduction of new such drugs. There is less agreement, however, on whether this is a short- or long-term trend, and what impact Canada's aging population and the recent emergence of very high cost medications in certain therapeutic categories will have on the sustainability of both private and public drug plans going forward.
As one would expect, spending on patented drugs has been consistent with this overall stable trend in recent years, although the 6.5% increase in the reporting year under review stands in contrast to the 0.3% decrease of the preceding year. Despite recent stabilizing trends, growth in Canadian patented drug sales continues to outpace growth in the seven comparator countries provided for in our regulations, with the exception of the United States. Similarly, Canadian patented drug prices are now the third highest of the comparator countries, nearly at par with Germany. As prices go up, the R&D ratio has been declining, and now stands at 5.4% for all patentees, its lowest point since prior to the enactment of Bill C-22. Although much is being done in Canada to address prescription drug costs, the same can be said of most of the countries to which we compare ourselves for price and R&D purposes. It is important that we keep a close eye on developments, both at home and abroad, to ensure that our regulations, guidelines and operating procedures remain relevant and effective.
While the above considerations will shape our strategic priorities going forward, over the past year we focused on improving our programs by monitoring the impact of the Guidelines changes and on publishing studies that account for the latest market trends and reflect the immediate interests of both public and private payers. We also pursued our outreach activities, expanded and diversified our exchanges with stakeholders and became more active and involved with our federal, provincial and international partners.
In the spirit of the Government's Red Tape Reduction Action Plan, we concluded consultations on proposed initiatives to reduce regulatory burden. As a result, we have simplified the Consumer Price Index (CPI) Adjustment Methodology. The simplified methodology will be implemented in 2015. As well, we proposed amendments to the Patented Medicines Regulations to move from twice to once a year filings, and we are moving to pre-publishing the proposed amendments in Part I of the Canada Gazette for formal consultation this year.
On the eve of sending this year's report to press, we learned of the Federal Court of Canada's issuance of its decisions in the ratiopharm and Sandoz matters. As is always the case when new jurisprudence issues, we will carefully consider the impact these decisions may have on the Board's jurisdiction and mandate and continue to work closely with office of the Attorney General in the event of an appeal.
Despite these new challenges and emerging issues, we continue to put the protection of consumer interests first, while recognizing the value that innovative medicines offer to patients. This is only made possible through the collaborative efforts and dedication of Board Members and Staff.
Lastly, it would be remiss of me if I did not take a moment to acknowledge the flurry of departures and retirements of key senior PMPRB personnel this past year, including Martine Richard, our Senior General Counsel, and Catherine Lombardo, Béatrice Mullington and Anna Chodos, from our Regulatory Affairs and Outreach Branch. These individuals were public servants in the truest sense of the word, and none of them more so than Sylvie Dupont, our longtime Director of the Board Secretariat and Communications, who has been with the PMPRB almost since inception. A consummate professional to the end, Sylvie dutifully but unsuccessfully sought to dissuade me from mentioning her in this year's report because doing so would be "unprecedented". I am exercising my prerogative as Chair to set aside precedent this one time in order to express our heartfelt gratitude to Sylvie for her dedication and all the excellent advice she has provided me and my predecessors over these many years. You will be missed. To all of you, thank you for your many years of devoted service and we wish you a long, happy and well deserved retirement.
On behalf of my colleagues, I reiterate our commitment to continue to effectively deliver the PMRPB mandate of serving Canadians.
Mary Catherine Lindberg
About the Patented Medicine Prices Review Board
The Patented Medicine Prices Review Board (PMPRB) is an independent, quasi-judicial body established by Parliament in 1987 under the Patent Act.
The PMPRB protects the interests of Canadian consumers by ensuring that the prices of patented medicines sold in Canada are not excessive. It does this by reviewing the prices that patentees charge for individual patented drug products in Canadian markets. If a price appears to be excessive, the Board can hold public hearings and order price reductions and/or the offset of excess revenues. The PMPRB is also responsible for reporting on trends in pharmaceutical sales and pricing for all medicines and for reporting research and development (R&D) spending by patentees.
The Minister of Health is responsible for the pharmaceutical provisions of the Patent Act (Act) as set out in sections 79 to 103. The PMPRB is part of the Health Portfolio, which also includes Health Canada, the Public Health Agency of Canada, the Canadian Institutes of Health Research and the Canadian Food Inspection Agency. The Health Portfolio supports the Minister of Health in maintaining and improving the health of Canadians.
Although part of the Health Portfolio, the PMPRB carries out its mandate at arm's length from the Minister of Health. It also operates independently of other bodies such as Health Canada, which authorizes the sale of drugs in Canada after their assessment for safety, efficacy and quality; federal, provincial and territorial public drug plans, which are responsible for listing reimbursement decisions for their respective plans; and the Common Drug Review, administered by the Canadian Agency for Drugs and Technologies in Health, which provides listing recommendations to participating public drug plans based on cost-effectiveness.
Jurisdiction
Regulatory
The PMPRB is responsible for regulating the prices that patentees charge for prescription and non-prescription patented drugs sold in Canada to ensure that they are not excessive. This includes sales to wholesalers, hospitals, pharmacies or others for both human and veterinary use. The PMPRB regulates the price of each patented drug product. This includes each strength of an individual, final dosage form of a medicine.
The Board's jurisdiction is not limited to drug products for which the patent is on the active ingredient. Rather, the Board's jurisdiction also covers drugs for which the patents relate to, but are not limited to, the processes of manufacture, the delivery system or dosage form, the indication/use and any formulations.
Patented drug products are not limited to brand-name products. A number of generic companies fall under the Board's jurisdiction by virtue of being licensees selling the same drug product as the brand company or because of manufacturing or processing patents, which various generic companies also hold.
The PMPRB has no authority to regulate the prices of nonpatented drugs and does not have jurisdiction over prices charged by wholesalers or pharmacies, or over pharmacists' professional fees. Also, matters such as whether medicines are reimbursed by public drug plans, their distribution and prescribing are outside the purview of the PMPRB.
Under the Act, patentees are required to inform the PMPRB of their intention to sell a new patented drug product. Upon the sale of such a patented drug product, patentees are required to file price and sales information at introduction and, thereafter, twice a year for each strength of each dosage form of each patented drug product sold in Canada.
Although patentees are not required to obtain approval of the price before a drug is sold, they are required to comply with the Act to ensure that the prices of patented drug products sold in Canada are not excessive. In the event that the Board finds, after a public hearing, that a price is or was excessive in any market, it may order the patentee to reduce the price and take measures to offset any excess revenues it may have received.
Reporting
The PMPRB reports annually to Parliament through the Minister of Health on its activities, on trends relating to the sales and prices of medicines, and on R&D spending by patentees.
Through the National Prescription Drug Utilization Information System (NPDUIS) initiative, the PMPRB provides critical analyses of price, utilization and cost trends in Canada to support decision making by participating federal, provincial and territorial public drug plans.
Governance
The Board consists of up to five members who serve on a part-time basis. Board Members, including a Chairperson and a Vice-Chairperson, are appointed by the Governor-in-Council. The Chairperson is designated under the Act as the Chief Executive Officer of the PMPRB, with the authority and responsibility to supervise and direct its work.
The Members of the Board, including the Chairperson, are collectively responsible for the implementation of the applicable provisions of the Act. Together, they establish the guidelines, rules and other policies of the Board as provided by the Act and consult, as necessary, with stakeholders including the provincial and territorial Ministers of Health and representatives of consumer groups, the pharmaceutical industry and others.
As of May 30, 2014, there was one vacancy on the Board.
Members of the Board

Chairperson
Mary Catherine Lindberg, BSP
Mary Catherine Lindberg was first appointed Member and Vice-Chairperson of the Board in June 2006. On May 19, 2010, Ms. Lindberg assumed the powers and functions of the Chairperson while the office was vacant. She was officially appointed Chairperson of the Board on March 3, 2011.
From 2002 to 2009, Ms. Lindberg was Executive Director of the Ontario Council of Academic Hospitals, an organization of 25 Academic Hospitals that are fully affiliated with a university and its Faculty of Medicine. Previously, she was the Assistant Deputy Minister, Health Services, with the Ontario Ministry of Health and Long-Term Care. Her responsibilities included the Ontario Health Insurance Plan (OHIP) and the Ontario Drug Programs.
Ms. Lindberg has a degree in pharmacy from the University of Saskatchewan and holds a pharmacist license in both Saskatchewan and Ontario.
Vice-Chairperson
Mitchell Levine,
BSc, MSc, MD, FRCPC, FISPE, FACP
Dr. Mitchell Levine was appointed Member and Vice-Chairperson of the Board on March 3, 2011.
Dr. Levine is a professor in the departments of Clinical Epidemiology & Biostatistics and Medicine in the Faculty of Health Sciences at McMaster University in Hamilton, Ontario. He is also Director of the Centre for Evaluation of Medicines at St. Joseph's Healthcare in Hamilton.
Dr. Levine received his medical degree from the University of Calgary in 1979, which was followed by postgraduate training in Internal Medicine (FRCPC) and Clinical Pharmacology at the University of Toronto (1981–1987). He received an MSc degree in Clinical Epidemiology from McMaster University in 1988.
Prior to his appointment to the Board, Dr. Levine had been a member of the PMPRB's Human Drug Advisory Panel. He acts, on an ad hoc basis, as a clinical pharmacology consultant to the Ontario Ministry of Health and Long-Term Care. In addition, he is the Editor-in-Chief of the Journal of Population Therapeutics and Clinical Pharmacology and is an Associate Editor of the ACP Journal Club: Evidence-Based Medicine.
Members
Normand Tremblay,
ASC, MSc, Adm.A, C.M.C
Normand Tremblay was appointed Member of the Board on May 31, 2012.
Mr. Tremblay teaches at the Université du Québec in Trois-Rivières, in the area of strategic management. He brings to the Board a vast experience in strategic and operational planning and organizational development.
Mr. Tremblay served as member of the National Research Council of Canada from 2007 to 2010. He is a member of the Order of Certified Administrators of Québec.
Richard Bogoroch, LL.B.
Richard Bogoroch was appointed Member of the Board on December 13, 2012.
Richard M. Bogoroch is the founder and Managing Partner of Bogoroch & Associates LLP, the successor to Bogoroch and Associates, a Toronto-based law firm established in November 1999 that specializes in civil litigation. Bogoroch & Associates LLP concentrates on serious personal injury litigation, wrongful death litigation, medical malpractice litigation, products liability and disability claims litigation.
Mr. Bogoroch graduated from McGill University with a B.C.L. in 1978 and a LL.B in 1979. He was admitted to the Alberta Bar in 1980 and called to the Ontario Bar in 1983. Richard completed his articles at Thomson Rogers and in 1983 joined the firm upon his call to the Bar. In 1993, he was certified by The Law Society of Upper Canada as a Specialist in Civil Litigation. From 1987 to 1999, he was a partner at Thomson Rogers. Mr. Bogoroch is a past Director of the Ontario Centre for Advocacy Training and a past Director of the Advocates' Society. He is also a past Chairman of the Canadian Bar Association – Ontario Provincial Committee on the Judiciary. Mr. Bogoroch has lectured and written extensively on many aspects of personal injury litigation for Continuing Legal Education Programmes organized by The Advocates' Society, The Law Society of Upper Canada, the Ontario Bar Association, the Ontario Trial Lawyers Association, The Canadian Institute, Osgoode Hall Law School's Professional Development Programme, Insight and others. Since 1999 he has also been a guest instructor at the Intensive Trial Advocacy Workshop at Osgoode Hall Law School. From 2011 to 2014, he has chaired or co-chaired Osgoode Professional Development's annual programme on personal injury litigation. Since 2011, he has co-chaired the Advocates' Society "Tricks of the Trade Programme", its annual continuing legal education programme on personal injury litigation.
Mr. Bogoroch has been recognized by LEXPERT as a Leading Practitioner in Personal Injury Law and was listed in "Best Lawyers" for Personal Injury Litigation.
Organizational Structure and Staff
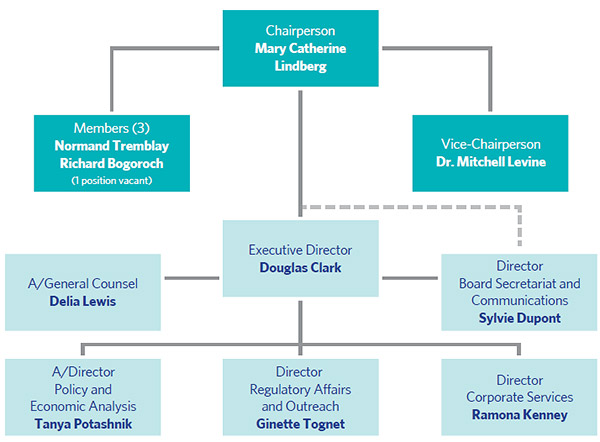
Executive Director
The Executive Director is responsible for advising the Board and for the leadership and management of the Staff.
Regulatory Affairs and Outreach
The Regulatory Affairs and Outreach Branch reviews the prices of patented drug products sold in Canada to ensure that they are not excessive; encourages patentees to comply voluntarily with the Board's Guidelines; implements related compliance policies; and investigates complaints into the prices of patented medicines. This Branch also informs and educates patentees on the Board's Guidelines and filing requirements.
Policy and Economic Analysis
The Policy and Economic Analysis Branch develops policy advice and recommendations on possible changes to the Board's Guidelines and on other policy issues, as required; conducts research and economic analysis on pharmaceutical trends; and prepares reports. It conducts studies in support of both compliance and enforcement, and undertakes other analyses, as directed by the Minister of Health.
Corporate Services
The Corporate Services Branch provides advice and services in relation to human resources management; facilities; health, safety and security; information technology; and information management. It is also responsible for strategic and financial planning and reporting, audit and evaluation, and liaising with federal central agencies on these topics.
Board Secretariat and Communications
The Board Secretariat and Communications Branch develops and manages the PMPRB's communications program, media relations, public enquiries and the formal complaints process; manages the Board's meeting and hearing processes, including the official record of proceedings; and coordinates activities pursuant to the administration of the Access to Information Act and the Privacy Act.
General Counsel
The General Counsel advises the PMPRB on legal matters and leads the prosecution team in proceedings before the Board.
Budget
In 2013/14, the PMPRB had a budget of $10.944 million and an approved staff level of 74 full-time equivalent employees.
TABLE 1 Budget and Staffing
| |
2012/13 |
2013/14 |
2014/15 |
| * The Special Purpose Allotment is reserved strictly for external costs of public hearings (legal counsel, expert witnesses, etc.). Any unspent funds are returned to the Consolidated Revenue Fund. |
| Budget |
$11.058 M |
$10.944 M |
$10.927 M |
| Salaries |
$7.034 M |
$6.920 M |
$6.903 M |
| Operating |
$1.554 M |
$1.554 M |
$1.554 M |
| Special Purpose Allotment* |
$2.470 M |
$2.470 M |
$2.470 M |
| Full Time Employees (FTEs) |
76 |
74 |
73 |
Communications and Outreach
The Communications Program is responsible for planning and managing the PMPRB's external communications activities, as well as raising the organization's visibility and engaging with stakeholders. Information is exchanged in different forms, and through a variety of media, with consumers, provincial/territorial partners, industry and other stakeholders. The program's main activities include media relations; responding to public inquiries; and informing the public through publishing updates of Board proceedings and decisions, and research results.
The Communications Group focuses on adapting to the changing requirements of the PMPRB's operating environment by evaluating its effectiveness and constantly exploring alternate communications products.
As a reliable, impartial source of comprehensive, accurate information on drug prices, the PMPRB is committed to developing and maintaining on-going collaboration with its stakeholders.
Industry stakeholders are consulted and informed of changes in the operating environment and are promptly informed of any updates to the regulatory process. To facilitate patentees' access to information, the Regulatory Affairs and Outreach Branch conducts regular outreach sessions.
Publications
In addition to regular publications, including the Annual Report and the quarterly NEWSletter, the PMPRB publishes NPDUIS research reports in response to program and corporate requirements. The PMPRB publishes in electronic-only formats to reduce costs and decrease the environmental impact of printing. It is placing a greater reliance on its website and social media for collaboration with its stakeholders. The PMPRB remains committed to meeting its objectives with openness and transparency.
Regulating Prices of Patented Medicines
The PMPRB protects the interests of Canadian consumers by ensuring that the prices of patented medicines sold in Canada are not excessive. It does this by reviewing the prices that patentees charge for each individual patented drug product to wholesalers, hospitals and pharmacies.
Reporting Requirements
Patentees are required by law to file information pertaining to the sale of their drug products in Canada. The Patent Act (Act) along with the Patented Medicines Regulations (Regulations) set out the filing requirements, and Board Staff reviews the pricing information on an ongoing basis to ensure that the prices are not excessive until all patents pertaining have expired.
There are several factors used for determining whether a drug product is excessively priced, as outlined in section 85 of the Act. The Compendium of Policies, Guidelines and Procedures (Guidelines) details the price tests used by Board Staff to determine whether the price charged by a patentee falls within the maximum allowable price. The Guidelines were developed in consultation with stakeholders including the provincial and territorial Ministers of Health, consumer groups, and the pharmaceutical industry. When an investigation determines that there is a problem with the price of a patented drug product, the patentee is offered the opportunity to voluntarily lower its price and/or refund its excess revenues through a Voluntary Compliance Undertaking (VCU). If the patentee disagrees with the results of the investigation and chooses not to submit a VCU, the Chairperson of the Board may issue a Notice of Hearing (NOH). After hearing the evidence, if the Board finds that the price is excessive, it can issue an Order to reduce the price and/or refund the excess revenues. A patentee also has the option of submitting a VCU to resolve the matter after the NOH has issued. Copies of the Act, the Regulations, the Guidelines and the Patentee's Guide to Reporting are posted on the PMPRB's website.
Failure to Report
The PMPRB relies on the patentees' full and timely disclosure of any and all patented drug products being sold in Canada to which a patent pertains. In 2013, five drug products were reported to the PMPRB for the first time even though they were patented and sold prior to 2013. In addition, three drug products previously reported to the PMPRB and for which the patent had expired, were reported again as having another patent pertaining.
Table 2 lists the drug products that were patented and sold in Canada prior to being reported to the PMPRB.
TABLE 2 Failure to Report the Sale of Patented Drugs
| Currently sold by |
Brand name |
Generic name |
Year medicine came under PMPRB's jurisdiction |
Year medicine came under PMPRB's jurisdiction with subsequent patent |
| Alcon Canada Inc. |
Triesence |
Triamcinolone acetonide |
2012 |
|
| CSL Behring |
Fibrogammin |
Factor XIII (Human) |
1997 |
|
| GlaxoSmithKline Inc. |
Arixtra |
Fondaparinux |
|
2007 |
| Novartis Pharmaceuticals Canada Inc. |
Lamisil |
Terbinafine hydrochloride |
|
2005 |
| Paladin Laboratories Inc. |
GlucaGen |
Glucagon |
2010 |
|
| Paladin Laboratories Inc. |
GlucaGen HypoKit |
Glucagon |
2010 |
|
| Sanofi-aventis Canada Inc. |
Deflazacort |
Deflazacort |
2006 |
|
| Sanofi pasteur Limited |
Adacel-Polio |
DaPT-IPV vaccine |
|
2011 |
Failure to File Price and Sales Data (Form 2)
Failure to file refers to the complete or partial failure of a patentee to comply with the regulatory filing requirements outlined in the Act and the Regulations. There were no Board Orders issued for failure to file in 2013.
Scientific Review
Human Drug Advisory Panel
All new patented drug products reported to the PMPRB are subject to a scientific evaluation as part of the price review process. The Human Drug Advisory Panel (HDAP) was established by the Board to provide independent expertise and advice to Board Staff. HDAP conducts a review when a patentee makes a claim regarding therapeutic improvement. Panel members review and evaluate available, appropriate scientific information, including any submission by a patentee with respect to the proposed level of therapeutic improvement, the selection of drug products to be used for comparison purposes and comparable dosage regimens.
Price Review
The PMPRB reviews the average price of each strength of an individual dosage form of each patented medicine. In most cases, this unit is consistent with the Drug Identification Number (DIN) assigned by Health Canada at the time the drug is approved for sale in Canada.
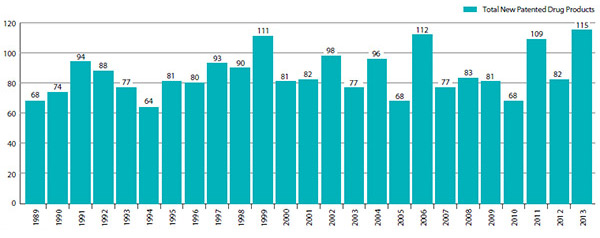
New Patented Drug Products Reported to the PMPRB in 2013
For the purpose of this report, a new patented drug product in 2013 is defined as any patented drug product first sold in Canada, or previously sold but first patented, between December 1, 2012, and November 30, 2013.
There were 115 new patented drug products for human use reported as sold in 2013. Some are one or more strengths of a new active substance and others are new presentations of existing medicines. Of the 115 new patented drug products, 10 (8.7%) were being sold in Canada prior to the issuance of the Canadian patent that brought them under the PMPRB's jurisdiction. Table 3 shows the year of first sale for these drug products.
TABLE 3 Number of New Patented Drug Products for Human Use in 2013 by Year First Sold
| Year first sold |
No. of drug products |
| 2013 |
105 |
| 2012 |
4 |
| 2011 |
2 |
| 2006 |
1 |
| 2000 |
3 |
| Total |
115 |
The list of New Patented Medicines Reported to the PMPRB is available on the website under Regulating Prices. This list includes information on the status of the review (e.g., whether the medicine is under review, within the Guidelines, under investigation, or subject to a VCU or Notice of Hearing).
Figure 1 illustrates the number of new patented drug products for human use reported to the PMPRB from 1989 to 2013.
Of the 115 new patented drug products:
- all of the prices have been reviewed:
- 93 were found to be within the Guidelines
- 7 were at levels that appeared to exceed the Guidelines by an amount that did not trigger the investigation criteria
- 15 were priced at levels that appeared to exceed the Guidelines and investigations were commenced
For a complete list of the 115 new patented drug products and their price review status, see Appendix 2.
FIGURE 1 New Patented Drug Products for Human Use
Source: PMPRB
Price Review of Existing Patented Drug Products for Human Use in 2013
For the purpose of this report, existing patented drug products include all patented drug products that were first sold and reported to the PMPRB prior to December 1, 2012.
At the time of this report, there were 1228 existing patented drug products:
- 1,005 were priced within the Guidelines
- 157 exceeded the Guidelines by an amount that did not trigger the investigation criteria
- 51 were the subject of investigations:
- 9 was opened as the result of introductory pricing in 2012
- 42 were opened on the basis of year-over-year prices
- 2 were under review
- 13 drug products were the subject of Voluntary Compliance Undertakings
- 1 additional drug product remains the subject of a hearing although no longer patented in 2013
A summary of the status of the price review of the new and existing patented drug products for human use in 2013 is provided in Table 4.
TABLE 4 Patented Drug Products for Human Use Sold in 2013 – Status of Price Review as of March 31, 2014
|
New drug products introduced in 2013 |
Existing drug products |
Total |
| Total |
115 |
1,228 |
1,343 |
| Within Guidelines |
93 |
1,005 |
1,098 |
| Under Review |
0 |
2 |
2 |
| Does Not Trigger Investigation |
7 |
157 |
164 |
| Under Investigation |
15 |
51 |
66 |
| Voluntary Compliance Undertakings |
0 |
13 |
13 |
| Price Hearings |
0 |
0 |
0 |
Update from the 2012 Annual Report
- Reviews of all drug products for human use reported as Under Review in the 2012 Annual Report have been completed.
- 39 of the 59 investigations reported in the 2012 Annual Report resulted in one of the following:
- the closure of the investigation where it was concluded that the price was within the Guidelines
- a Voluntary Compliance Undertaking (VCU) by the patentee to reduce the price and offset excess revenues through a payment and/or a reduction in the price of another patented drug product (see Voluntary Compliance Undertakings)
- a public hearing to determine whether the price was excessive, including any remedial Order determined by the Board (see Hearings)
Patented Over-the-Counter Drug Products and Patented Drug Products for Veterinary Use
Board Staff reviews the price of a patented over-the-counter drug product or a patented veterinary drug product when a complaint has been received. One complaint was received regarding the price of Vetoryl sold in Canada by Vetoquinol Canada Inc.
As per the Patented Medicines Regulations (Regulations), the patentee filed the price and sales data back to the date of first sale in 2009. The prices of the three strengths of Vetoryl (10 mg, 30 mg and 60 mg) were within the Guidelines when first sold in 2009. The prices remained within the Guidelines at the end of 2013. As per the Regulations, the patentee will file price and sales data for two years until the end of 2015. A summary table of the price review is available on the PMPRB website.
Inquiries and Formal Complaints
The PMPRB received numerous inquiries in 2013 regarding the compliance status of drug products. Board Staff was able to confirm that the patented medicines in question were within the Guidelines. Had the price of the patented drug products been outside the Guidelines, Board Staff would have initiated an investigation.
The PMPRB also received three formal complaints into the prices of Differin, Nexium and Spiriva. Investigations were launched to review the prices of the three patented drug products. The prices of Nexium and Spiriva were found to be within the Guidelines. The investigation into the price of Differin is ongoing.
If the price of a drug product is found to be outside the Guidelines, the patentee may submit a VCU for the Chairperson's approval or the Chairperson may determine that it is in the public interest to hold a public hearing. Once a determination has been made in either case, the outcome is reported on the PMPRB website.
Voluntary Compliance Undertakings and Hearings
Voluntary Compliance Undertakings
A VCU is a written undertaking by a patentee to adjust its price to conform to the Board's Guidelines. Under the Guidelines, patentees are given an opportunity to submit a VCU when Board Staff concludes, following an investigation, that the price set forth by the patentee for a patented drug product sold in Canada appears to have exceeded the Guidelines. A VCU can also be submitted by a patentee after a Notice of Hearing is issued.
In 2013, five VCUs covering 14 drug products were accepted. In addition to price reductions for certain drug products, excess revenues totalling $10,281,679.63 were offset by way of payments to the Government of Canada.
In 2014, to date, one VCU was approved by the Hearing Panel in the Copaxone matter, concluding this proceeding.
Patentees are to ensure that the prices of their patented drug products are within the Board's Guidelines during all periods in which the drug products are under the PMPRB's jurisdiction.
TABLE 5 Voluntary Compliance Undertakings in 2013 up to May 30, 2014
| Patented drug product |
Therapeutic use |
Patentee |
Date of approval |
Offset of excessive revenues |
| Price reduction |
Payment to the government |
|
1 The patent on this drug has expired.
2 During fiscal year 2013/14, the PMPRB reimbursed Teva Canada Innovation the sum of $2,801,285.00 (plus interests) as ordered by the Federal Court in its May 14, 2013, decision.
|
| VCUs in 2013 |
| Novolin® (8 drug products) |
Diabetes mellitus |
Novo Nordisk Canada Inc. |
April |
✓ |
$6,503,426.81 |
| Mavik (1 drug product) |
Hypertension |
Abbott Laboratories Limited |
April |
✓ |
$118,168.48 |
| Airomir1 (1 drug product) |
Asthma |
Graceway Canada Inc. |
April |
|
$206,583.48 |
| Tactuo (1 drug product) |
Acne |
Galderma Canada Inc. |
April |
|
Board Order: $419,468.12 |
| Elocom (3 drug products) |
Psoriasis and atopic dermatitis |
Merck Canada Inc. |
July |
✓ |
$3,034,032.74 |
| Total |
|
|
|
|
$10,281,679.63 |
| VCUs in 2014, up to May 30 |
| Copaxone2 (1 drug product) |
Multiple sclerosis |
Teva Canada Innovation G.P.-S.E.N.C. |
February |
|
Board Order: $248,222.32 |
| Overall total |
|
|
|
|
$10,529,901.95 |
Hearings
In the event that the price of a patented medicine appears to be excessive, the Board can hold a public hearing. If it finds that the price is excessive, it may issue an order to reduce the price and to offset revenues received as a result of the excessive price. Board decisions may be subject to judicial review in the Federal Court of Canada.
In 2013, the Board issued decisions and/or orders effectively completing one matter: Tactuo, on price. In February 2014, the Copaxone matter was also concluded.
Two matters remain before the Board: Apotex Inc. and Apo-Salvent CFC Free. The outcome of these matters will be examined in light of the Federal Court decisions into three other matters: ratio-Salbutamol HFA, ratiopharm and Sandoz on the Board's jurisdiction.
Summary
Excess revenues totalling $10,529,901.95 were offset by way of payments to the Government of Canada through VCUs and Board Orders in 2013 up to May 30, 2014.
Since 1993, a total of 95 VCUs have been approved and 26 public hearings initiated. These measures resulted in price reductions and the offset of excess revenues by way of additional price reductions and/or payments to the Government of Canada. Over $147 million have been collected through VCUs and Board Orders by way of payments to the Government of Canada and/or to customers such as hospitals and clinics.
Matters before the Federal Court
The Federal Court heard the Copaxone Redetermination (T-586-12) case on February 5, 2013. The Court released its decision on April 30, 2013, allowing the Teva application, quashing the Board's February 23, 2012, decision and returning the matter to a different hearing panel of the Board for redetermination. The new panel received a joint submission from the parties and accepted a Voluntary Compliance Undertaking to offset excess revenues. An Order concluding this matter was issued on February 14, 2014.
Three other Board decisions had been subject to judicial review by the Federal Court: ratio-Salbutamol HFA (T-1058-11; T-1825-11); ratiopharm Inc. (now Teva Canada) (T-1252-11); and Sandoz Canada Inc. (T-1616-12). The Court heard these matters in November 2013 and released its decisions on May 27, 2014. The Federal Court allowed the applications for judicial review and referred the matters back to the Board with a direction that it find that ratiopharm Inc. and Sandoz Canada Inc. are not patentees.
TABLE 6 Status of Board Proceedings in 2013 up to May 30, 2014
| Patented drug product |
Therapeutic use |
Patentee |
Issuance of notice of hearing |
Status |
| Apo-Salvent CFC-Free |
Asthma |
Apotex Inc. |
July 8, 2008 |
Ongoing |
| Copaxone –Redetermination |
Multiple sclerosis |
Teva Canada |
February 2010: New panel struck |
Federal Court decision: April 30, 2013
Matter returned to new panel for redetermination
Board Order: February 14, 2014
Hearing concluded with the acceptance of a VCU – Payment of excess revenues: $248,222.32
|
| ratio-Salbutamol HFA |
Asthma |
ratiopharm Inc. (now Teva Canada) |
July 18, 2008 |
Board decision: May 27, 2011
Board Order: October 17, 2011
Judicial review heard by the Federal Court Nov. 4–6, 2013; decision issued May 27, 2014
|
| Tactuo |
Acne |
Galderma Canada Inc. |
Sept. 26, 2012 |
Board Order: April 24, 2013
Hearing concluded with the acceptance of a VCU – Payment of excess revenues: $419,468.12 |
| Patentee |
Issue |
Date of Notice of Application |
Status |
| Apotex Inc. |
Failure to file (jurisdiction) |
March 3, 2008 |
Ongoing |
| ratiopharm Inc. (now Teva Canada) |
Failure to file (jurisdiction) |
August 28, 2008 |
Board Order: June 30, 2011; amended: October 17, 2011
Judicial review heard by the Federal Court Nov. 4–6, 2013; decision issued May 27, 2014
|
| Sandoz Canada Inc. |
Failure to file (jurisdiction) |
March 8, 2010 |
Board Order: August 1, 2012; re-issued October 1, 2012
Judicial review heard by the Federal Court Nov. 19–20, 2013; decision issued May 27, 2014
|
Regulatory Burden Reduction
In alignment with the Government's Red Tape Reduction Plan, the PMPRB committed to examining its price review process to identify possible ways to find efficiencies and reduce the regulatory burden on patentees without adversely affecting its mandate to protect consumers.
To date, the review has focused on two initiatives:
- The PMPRB's Consumer Price Index (CPI) Adjustment Methodology
- The feasibility of changing to one regulatory filing for existing patented medicines by patentees per year.
After consultation, the Board approved moving forward on implementing a new lagged CPI Adjustment Methodology effective 2015. The new approach will utilize actual 2013 CPI to determine the CPI-Based Price-Adjustment Factors for 2015. The maximum allowed price increase will be announced annually in the January issue of the NEWSletter.
The change will be reflected in the June 2014 update of the Compendium of Policies, Guidelines and Procedures once it comes into effect.
Following feedback received from stakeholders regarding the proposed amendments to the Patented Medicines Regulations pertaining to the frequency of filing price and sales information, a formal consultation as per the Federal Regulatory Development Process through Cabinet and publication in the Canada Gazette has been announced.
In addition, the PMPRB developed and publicly posted new service standards that clarify expectations and increase predictability in the federal regulatory system. The following service standards have been developed and posted on the PMPRB's website:
- Service standards for the scientific review of new patented drug products
- Service standards for the price review of new patented drug products
- Service standards for the price review of existing patented drug products
These measures and proposed amendments are aimed at decreasing the patentees' regulatory burden and increasing the efficiency of the price review process while protecting the PMPRB's core mandate of consumer protection.
Trends in Sales of Patented Drug Products
The PMPRB is responsible for reporting on trends in pharmaceutical sales and pricing for all medicines and for reporting research and development spending by patentees. In addition, the PMPRB undertakes studies and conducts analysis on a variety of topics related to pharmaceutical pricing and costs.
Patentees are required under the Patented Medicines Regulations (Regulations) to submit detailed information on their sales of patented drug products, including quantities sold and net revenues received for each product by class of customer in each province/territory. The PMPRB uses this information to analyze trends in sales, prices and utilization of patented drug products.1 This section provides key statistical results from this analysis.
Sales and Prices
Canadians spend much more today on patented drug products than they did a decade ago, but it is important to understand that an increase in drug spending does not in itself imply rising drug prices. For example, the PMPRB's Annual Reports from 1995 through 2003 noted that sales of patented drug products grew at annual rates consistently exceeding 10%, while average annual rates of change for prices were less than 1%. In these instances, sales growth was driven by changes in the volume and composition of drug utilization.
A variety of factors can produce such changes. These include:
- increases in total population
- changes in the demographic composition of the population (for example, shifts in the age distribution toward older persons with more health problems)
- increases in the incidence of health problems requiring drug therapy
- changes in the prescribing practices of physicians (for example, a shift away from older, less expensive drug products to newer, more expensive medications, or a shift toward higher, more frequent dosages)
- increases in the use of drug therapy instead of other forms of treatment
- the use of new drug products to treat conditions for which no effective treatment existed previously
Sales Trends
Table 7 reports patentees' total sales of patented drug products in Canada for 1990 through 2013. In 2013, sales of patented drug products increased to $13.6 billion from $12.8 billion in 2012, an increase of 6.5 %. By comparison, the annual growth in sales was 27.0% in 1999 and remained in double-digits until 2003.
The last column of Table 7 gives sales of patented drug products as a share of overall drug sales. This share rose from 43.2% in 1990 to a peak of 72.7% in 2003. It has generally declined since 2003, with a slight reversal in the trend in the last three years, implying that sales of non-patented brand and generic drug products have grown faster than sales of patented drug products in recent years.
TABLE 7 Sales of Patented Drug Products, 1990–2013
| Year |
Patented drug products |
Sales of patented drug products as a share of all drug sales (%)* |
| Sales ($billions) |
Change (%) |
|
* The denominator in this ratio comprises sales of patented, non-patented brand and generic drug products. Starting with the estimate for 2005, this value is derived from data contained in IMS Health's MIDAS database. In previous years, IMS data were used to calculate sales of generic drug products only, while sales of non-patented brand products were estimated from data submitted by patentees. This approach was abandoned because of anomalies related to year-to-year changes in the set of companies reporting to the PMPRB. Ratios reported for years before 2005 likely overstate the patented share, but by only a small amount. This small bias in no way invalidates the strong upward trend evinced by the results for the years 1990 through 2003.
Sources: PMPRB and MIDAS©, 2005–2013, IMS Health Incorporated or its affiliates. All rights reserved.2
|
| 2013 |
13.6
|
6.5
|
61.8
|
| 2012 |
12.8
|
-0.3
|
59.3
|
| 2011 |
12.9
|
4.0
|
58.6
|
| 2010 |
12.4
|
-3.8
|
56.0
|
| 2009 |
12.9
|
2.4
|
59.2
|
| 2008 |
12.6
|
2.4
|
61.7
|
| 2007 |
12.3
|
3.4
|
63.2
|
| 2006 |
11.9
|
3.5
|
67.8
|
| 2005 |
11.5
|
4.5
|
70.6
|
| 2004 |
11.0
|
7.8
|
72.2
|
| 2003 |
10.2
|
14.3
|
72.7
|
| 2002 |
8.9
|
17.5
|
67.4
|
| 2001 |
7.6
|
18.9
|
65.0
|
| 2000 |
6.3
|
16.7
|
63.0
|
| 1999 |
5.4
|
27.0
|
61.0
|
| 1998 |
4.3
|
18.9
|
55.1
|
| 1997 |
3.7
|
22.6
|
52.3
|
| 1996 |
3.0
|
12.8
|
45.0
|
| 1995 |
2.6
|
10.8
|
43.9
|
| 1994 |
2.4
|
-2.1
|
40.7
|
| 1993 |
2.4
|
9.4
|
44.4
|
| 1992 |
2.2
|
14.0
|
43.8
|
| 1991 |
2.0
|
13.1
|
43.2
|
| 1990 |
1.7
|
—
|
43.2
|
Drivers of Sales Growth
Table 8 decomposes the sales growth that occurred between 2012 and 2013 into distinct elements reflecting the impacts of:
- previously patented drug products that have gone offpatent or left the Canadian market (“exiting drug effect”)
- patented drug products introduced to the Canadian market in 2013 (“new drug effect”)
- changes in prices among patented drug products with sales in Canada in both 2012 and 2013 (“price effect”)
- differences in the quantities of such drug products sold in the two years (“volume effect”)
- interactions of price and quantity changes (“cross effect”)
The first row of Table 8 gives these impacts as dollar amounts. The second row expresses the impacts as proportions of the overall change in sales between 2012 and 2013. For the sake of comparison, the third row provides average year-over-year proportionate impacts for 2008 through 2012.3
The results in this table show that the increase in sales that occurred between 2012 and 2013 was the result of underlying increases in the quantities of existing and new drug products sold. The volume effect alone was large enough to compensate for a large exiting drug effect.
TABLE 8 Decomposition of Changes in Sales of Patented Drug Products
| |
Total change |
Exiting drug effect |
New drug effect |
Price effect |
Volume effect |
Cross effect |
| Source: PMPRB |
| Sales impact, 2013/2012 ($millions) |
859.81 |
-268.20 |
285.86 |
149.87 |
790.12 |
-97.84 |
| Proportion of total change, 2013/2012 (%) |
100.00 |
-31.19 |
33.25 |
17.43 |
91.90 |
-11.38 |
| Average proportion of total change, 2008–2012 (%) |
100.00 |
180.69 |
-136.98 |
-20.49 |
33.18 |
43.61 |
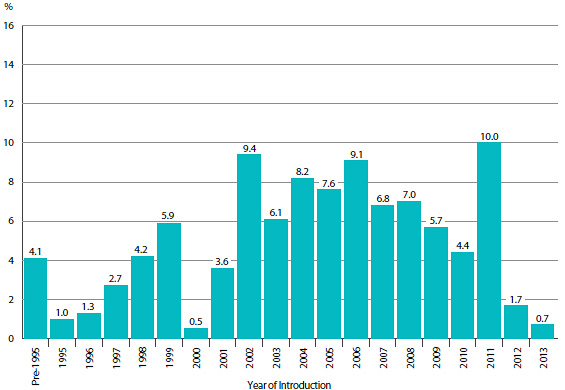
Figure 2 breaks down 2013 sales of patented drug products according to the year in which the product was first sold in Canada. Throughout the latter part of the 1990s and early 2000s, sales growth was largely driven by a succession of new “blockbuster” products that ultimately achieved very high sales volumes. Despite the recent patent expiries (patent cliff), these products still accounted for a substantial share of sales in 2013. Since the beginning of the 2000s, changes in the Canadian pharmaceutical environment, along with a reduction in the rate of introduction of new high-volume products, has resulted in dampened growth.
FIGURE 2 Share of 2013 Sales of Patented Drug Products by Year of Introduction
Source: PMPRB
Sales by Therapeutic Class
The PMPRB classifies drug products according to the World Health Organization's (WHO) Anatomical Therapeutic Chemical (ATC) system when it conducts analyses at the level of therapeutic class. This is a hierarchical system that classifies drug products according to their principal therapeutic use and chemical composition. At its first level of aggregation (Level 1), the ATC system classifies drug products according to the element of human anatomy with which they are primarily associated.
Table 9 breaks out sales of patented drug products in Canada in 2013 by major therapeutic class, defined by ATC Level 1. The table gives the 2013 sales for each class, the share of the total sales this represents and the rate at which sales grew relative to 2012. Values in the last column represent the component of overall sales growth attributable to drug products in the corresponding therapeutic class.4 By this measure, antineoplastics and immunomodulating agents made the largest positive contribution to sales growth. The large decline in sales of drugs related to the cardiovascular system and, secondarily, the genito-urinary system and sex hormones should be noted.
TABLE 9 Sales of Patented Drug Products by Major Therapeutic Class, 2013
| Therapeutic class |
2013 sales
($millions) |
Share: 2013 sales
(%) |
Growth: 2013/2012
($millions) |
Growth: 2013/2012
(%) |
Impact on change in expenditure
(%) |
|
* These groups have been combined for reasons of confidentiality.
Source: PMPRB
|
| A: Alimentary tract and metabolism |
1,425.0 |
10.4 |
160.8 |
12.7 |
19.3 |
| B: Blood and blood forming organs |
784.3 |
5.7 |
-7.3 |
-0.9 |
-0.9 |
| C: Cardiovascular system |
1,023.8 |
7.5 |
-319.0 |
-23.8 |
-38.4 |
| D: Dermatologicals |
130.0 |
1.0 |
15.2 |
13.2 |
1.8 |
| G: Genito-urinary system and sex hormones |
509.7 |
3.7 |
-63.3 |
-11.0 |
-7.6 |
| H: Systemic hormonal preparations |
62.4 |
0.5 |
7.1 |
12.7 |
0.8 |
J: General antiinfectives for systemic use; and
P: Antiparasitic products* |
1,515.6 |
11.1 |
57.1 |
3.9 |
6.9 |
| L: Antineoplastics and immunomodulating agents |
3,947.6 |
28.9 |
646.0 |
19.6 |
77.7 |
| M: Musculo-skeletal system |
431.4 |
3.2 |
11.0 |
2.6 |
1.3 |
| N: Nervous system |
1,853.8 |
13.6 |
-46.5 |
-2.4 |
-5.6 |
| R: Respiratory system |
1,274.9 |
9.3 |
212.1 |
20.0 |
25.5 |
| S: Sensory organs |
643.1 |
4.7 |
137.8 |
27.3 |
16.6 |
| V: Various |
75.1 |
0.5 |
20.3 |
36.9 |
2.4 |
| All therapeutic classes |
13,676.5 |
100.0 |
831.1 |
6.5 |
100.0 |
Price Trends
The PMPRB uses the Patented Medicines Price Index (PMPI) to monitor trends in prices of patented drug products. The PMPI measures the average year-over-year change in the ex-factory prices of patented drug products sold in Canada. The index is constructed using a formula that takes a sales-weighted average of price changes observed at the level of individual drug products.5 This is similar to the approach Statistics Canada uses to construct the Consumer Price Index (CPI). The PMPI is based on an average transaction price and sales information for a six-month period submitted by patentees.
It is important to understand the conceptual relationship between the PMPI and drug costs. The PMPI does not measure changes in the utilization of patented drug products; a quantity index, the PMQI, is calculated for this purpose (see Utilization of Patented Drug Products). The PMPI does not measure the cost impact of changes in prescribing patterns or the introduction of new medicines. By design, the PMPI isolates the component of sales growth attributable to changes in prices.
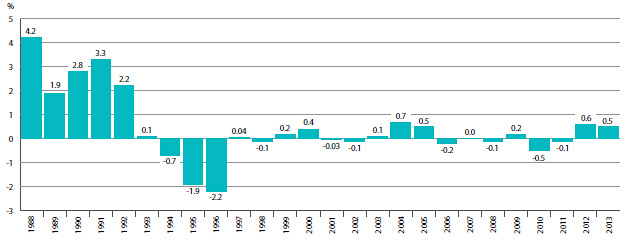
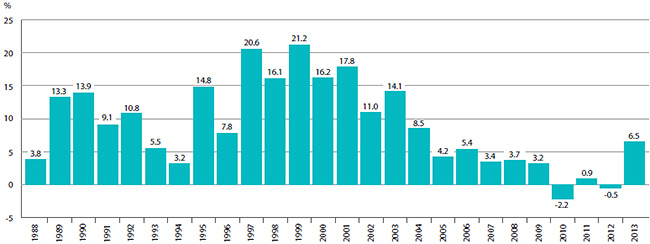
Figure 3 provides year-over-year changes in the PMPI for the years 1988 through 2013. As measured by the PMPI, prices of patented drug products increased, on average, by 0.5% between 2012 and 2013.
FIGURE 3 Annual Rates of Change, Patented Medicines Price Index (PMPI), 1988–2013
Source: PMPRB
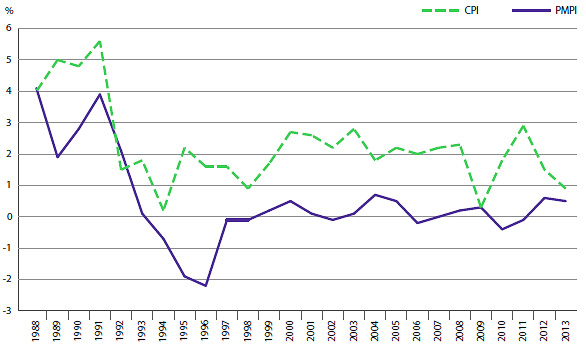
The Patent Act requires the PMPRB to consider changes in the CPI, among other factors, in determining whether the price of a patented drug product is excessive. Figure 4 plots year-over-year rates of change in the PMPI against corresponding changes in the CPI. General price inflation, as measured by the CPI, has exceeded the average increase in patented drug prices almost every year since 1988. In 2013, the CPI rose by 0.9%, while the PMPI on average increased slightly by 0.5%.
FIGURE 4 Annual Rate of Change, Patented Medicines Price Index (PMPI) and Consumer Price Index (CPI), 1988–2013
Source: PMPRB; Statistics Canada
It is not surprising that the PMPI has seldom kept pace with the CPI. The PMPRB's Guidelines allow the price of a patented drug product to rise by no more than the CPI over any three-year period. (The Guidelines also impose a cap on year-over-year price increases equal to one and one-half times the current year rate of CPI inflation.) This effectively establishes CPI inflation as an upper bound on the amount by which individual prices may rise over any three-year period.6 Increases in the PMPI normally do not reach this upper bound because many patentees do not raise their prices by the full amount permitted under the Guidelines, or choose to reduce their prices.
Price Change by Therapeutic Class
Table 10 provides average rates of price change among patented drug products at the level of major therapeutic classes. Results in this table were obtained by applying the PMPI methodology to data segregated by their ATC Level 1 class. The last column provides a decomposition of overall PMPI change, with each entry representing the component of the overall change attributable to drug products in the corresponding therapeutic class. By this measure, the slight increase in PMPI (0.5%) reflects a general state of price stability across therapeutic classes. Note that all of the therapeutic classes saw an average rate of price change below the rate of CPI inflation.7
TABLE 10 Change in the Patented Medicines Price Index (PMPI), by Major Therapeutic Class, 2013
| Therapeutic class |
Share: 2013 sales (%) |
Price change: 2012 to 2013 (%) |
Contribution: change in PMPI (%) |
|
* These groups have been combined for reasons of confidentiality.
** Values in this column may not add to 100.0 due to rounding.
Source: PMPRB
|
| A: Alimentary tract and metabolism |
10.4 |
5.5 |
0.6 |
| B: Blood and blood forming organs |
5.7 |
-5.6 |
-0.3 |
| C :Cardiovascular system |
7.5 |
0.6 |
0.0 |
| D: Dermatologicals |
1.0 |
0.0 |
0.0 |
| G: Genito-urinary system and sex hormones |
3.7 |
-2.2 |
-0.1 |
| H: Systemic hormonal preparations |
0.5 |
2.0 |
0.0 |
J: General antiinfectives for systemic use; and
P: Antiparasitic products* |
11.1 |
-0.9 |
-0.1 |
| L: Antineoplastics and immunomodulating agents |
28.9 |
0.3 |
0.1 |
| M: Musculo-skeletal system |
3.2 |
2.4 |
0.1 |
| N: Nervous system |
13.6 |
1.0 |
0.1 |
| R: Respiratory system |
9.3 |
0.8 |
0.1 |
| S: Sensory organs |
4.7 |
1.1 |
0.1 |
| V: Various |
0.5 |
-0.6 |
0.0 |
| All therapeutic classes |
100.0** |
0.5 |
0.5 |
Price Change by Class of Customer
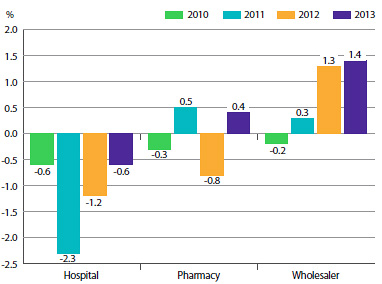
Figure 5 presents average rates of price change by class of customer.8 These results were obtained by applying the PMPI methodology separately to sales data for hospital, pharmacy and wholesale customers.9 The 2013 rates of price change for these classes were, respectively, -0.6%, 0.4% and 1.4%.
FIGURE 5 Annual Rate of Change, Patented Medicines Price Index (PMPI), by Class of Customer, 2010–2013
Source: PMPRB
Price Change by Province/Territory
Figure 6 presents average annual rates of price change by province/territory, obtained by applying the PMPI methodology to sales data segregated by the province/territory in which the sale occurred. These results indicate that, between 2012 and 2013, prices of patented drug products in the NWT fell on average. The largest average price increase occurred in New Brunswick (3.6%).
FIGURE 6 Annual Rate of Price Change, by Province/Territory* and Class of Customer**, 2013
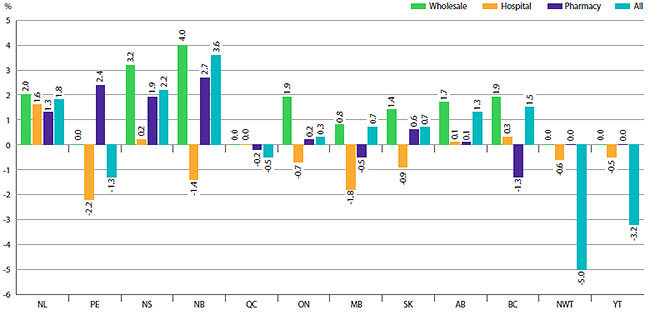
* Values for Nunavut are included in the Northwest Territories (NWT).
** Results for “All” in Figure 6 include the class of customer “other”.
Source: PMPRB
Price Behaviour after Introduction
Does the price of a typical patented drug product change much in the years after it enters the Canadian market? To answer this question, Figure 7 provides the average ratio of the 2013 price to introductory price (the price at which the drug product was sold in its first year on the Canadian market).
The results in Figure 7 imply no consistent tendency for prices to either rise or fall substantially after introduction, with the average 2013 price of a typical patented drug product being within a few percentage points of its introductory price, regardless of when it was introduced to the Canadian market.10
FIGURE 7 Average Ratio of 2013 Price to Introductory Price, by Year of Introduction
Source: PMPRB
Price Change by Country
In accordance with the Act and the Regulations, patentees must report publicly available prices of patented drug products for seven foreign comparator countries: France, Germany, Italy, Sweden, Switzerland, the United Kingdom and the United States.
The PMPRB uses this information to
- conduct the international price comparison tests specified in its Guidelines
- compare the Canadian prices of patented drug products to those prevailing in other countries
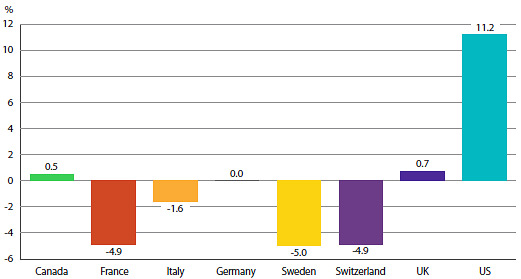
Figure 8 gives the average annual rates of price change for Canada and each of the seven comparator countries. These results were obtained by applying the PMPI methodology (with weights based on Canadian sales patterns) to the international price data that patentees have submitted to the PMPRB. Note that results for the United States are based on prices that incorporate prices from the US Federal Supply Schedule (FSS).11
The results in Figure 8 indicate that in 2013, the United States saw prices rise on average at a rate of 11.2%. United Kingdom saw much more modest average price increases, while prices in France, Italy, Switzerland and Sweden declined.
FIGURE 8 Annual Average Rates of Price Change, Canada and Comparator Countries, 2013
Source: PMPRB
Comparison of Canadian Prices to Foreign Prices
Tables 11 and 12 provide detailed statistics comparing the foreign prices of patented drug products to their Canadian prices. Each table provides two sets of average price ratios. These are differentiated according to the method by which foreign prices were converted to their Canadian dollar equivalents. The tables also give the numbers of drug products (DINs) and the volume of sales encompassed by each reported price ratio.12
The average price ratios given in Tables 11 and 12 are salesweighted arithmetic means of price ratios obtained for individual drug products, with weights based on Canadian sales patterns. Average price ratios constructed in this way provide exact answers to questions of the following type:
How much more/less would Canadians have paid for the patented drug products they purchased in 2013 had they paid Country X prices rather than Canadian prices?
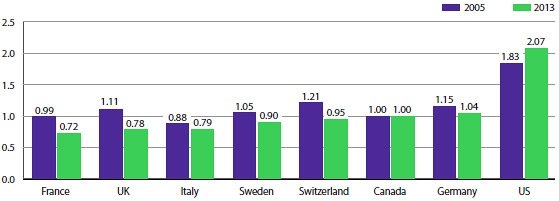
For example, Table 11 states that the 2013 average French-to-Canadian price ratio was 0.72. This means Canadians would have paid 28% less for the patented drug products they purchased in 2013 had they bought these products at French prices.
For many years, the PMPRB has reported average foreign-to-Canadian price ratios with foreign prices converted to their Canadian dollar equivalents by means of market exchange rates. (More exactly, the 36-month moving averages of market rates the PMPRB normally uses in applying its Guidelines.) Table 11 also reports foreign-to-Canadian price ratios with currency conversion at purchasing power parity (PPP). The PPP between any two countries measures their relative costs of living expressed in units of their own currencies. In practice, cost of living is determined by pricing out a standard “basket” of goods and services at the prices prevailing in each country.
Because PPPs are designed to represent relative costs of living, they offer a simple way to account for differences in overall national price levels when comparing individual prices, incomes and other monetary values across countries. When applied to the calculation of average foreign-to-Canadian price ratios they produce statistics answering questions of this type:
How much more/less consumption of other goods and services would Canadians have sacrificed for the patented drug products they purchased in 2013 had they lived in Country X?
Questions of this type cannot be answered by simply comparing drug prices. Rather, one must first calculate what each price represents in terms of goods and services foregone. PPPs are designed for such purposes.
Bilateral Comparisons
Table 11 provides bilateral comparisons of prices in each of the PMPRB's seven comparator countries to corresponding Canadian prices. Focusing on the results with currency conversion at market exchange rates, it appears that, as in previous years, Canadian prices were typically within the range of prices observed among the comparator countries. Prices in France, Italy, United Kingdom, Sweden and Switzerland were appreciably lower than Canadian prices, while those in Germany were slightly higher. As in previous years, prices reported for the United States were much higher than prices in Canada or any other comparator country.
TABLE 11 Average Foreign-to-Canadian Price Ratios, Bilateral Comparisons, 2013
| |
Canada |
France |
Italy |
Germany |
Sweden |
Switzerland |
United Kingdom |
United States |
| Source: PMPRB |
| At Market Exchange Rates |
| Average price ratio 2013 |
1.00 |
0.72 |
0.79 |
1.04 |
0.90 |
0.95 |
0.77 |
2.07 |
| Average price ratio 2012 |
1.00 |
0.76 |
0.80 |
1.11 |
0.90 |
1.01 |
0.78 |
2.02 |
| At Purchasing Power Parities |
| Average price ratio 2013 |
1.00 |
0.78 |
0.97 |
1.23 |
0.85 |
0.78 |
0.86 |
2.53 |
| Average price ratio 2012 |
1.00 |
0.79 |
0.91 |
1.24 |
0.84 |
0.82 |
0.89 |
2.42 |
| Number of patented drug products |
1,306 |
760 |
772 |
919 |
903 |
847 |
913 |
1,088 |
| Sales ($millions) |
13,676.49 |
11,062.06 |
10,704.40 |
11,832.60 |
11,575.50 |
11,446.00 |
11,596.30 |
12,811.50 |
It is important to note that it is not always possible to find a matching foreign price for each and every patented drug product sold in Canada. Table 11 displays how often an international price comparison was available for each of the comparator countries. For example, out of 1,306 patented drug products under the PMPRB's jurisdiction in 2013, a publicly available ex-factory gate price for France was available only 58% of the time, whereas for the US the number was 83%, by far the highest. Given the integrated nature of the Canadian and US supply chain, it is not uncommon for the US to be the only other country for which a comparator price to a product sold in Canada is available, in which case it is deemed to constitute the international median price as per the PMPRB's methodology.
Average price ratios obtained with currency conversion at PPPs tell a somewhat different story. When international differences in cost of living are accounted for, it appears Canadians incurred a larger consumption cost for the patented drug products they purchased in 2013 than did residents of every other comparator country except Germany and the United States.
Figure 9 puts these results in historical perspective. In 2005, Canadian prices were, on average, approximately equal to or below corresponding prices in all comparators other than Italy. By 2013, Canadian prices were decidedly above prices in the United Kingdom, France, and Italy and somewhat higher than prices in Sweden and Switzerland.
FIGURE 9 Average Foreign-to-Canadian Price Ratios: 2005, 2013
Source: PMPRB
Multilateral Price Comparisons
Table 12 provides average foreign-to-Canadian price ratios using several multilateral measures of foreign prices. The median international price (MIP) is the median of prices observed among the seven comparator countries. Other multilateral price ratios compare the minimum, maximum and simple mean of foreign prices to their Canadian counterparts.
TABLE 12 Average Foreign-to-Canadian Price Ratios, Multilateral Comparisons, 2013
| |
Median |
Minimum |
Maximum |
Mean |
| Source: PMPRB |
| Average price ratio at market exchange rates |
1.06 |
0.82 |
2.10 |
1.19 |
| Average price ratio at purchasing power parities |
1.11 |
0.88 |
2.54 |
1.34 |
| Number of patented drug products |
1,227 |
1,227 |
1,227 |
1,227 |
| Sales ($millions) |
13,418.5 |
13,418.5 |
13,418.5 |
13,418.5 |
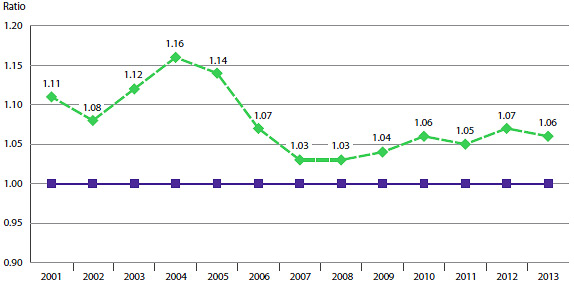
Focusing again on results at market exchange rates, the average MIP-to-Canadian price ratio stood at 1.06 in 2013. (The corresponding value for 2012 was 1.07.) Note that mean foreign prices produce higher foreign-to-Canadian price ratios than do MIPs. This is explained by the influence of US prices, which are typically much higher than prices elsewhere. Although US prices nearly always figure importantly in determining mean foreign price, that is less so when it comes to median international prices. Nevertheless, the US does exercise a significant influence over the average ratio of median international prices relative to Canadian prices because of the not infrequent phenomenon mentioned in the previous section whereby the US is the only country for which an ex-factory gate price for a patented drug product sold in Canada is available.
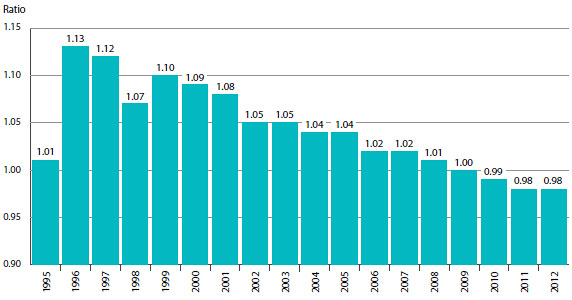
Figure 10 puts these results in historical perspective, giving a history of the average MIP-to-Canadian price ratios from 2001 to 2013. Although there has been considerable movement in the ratio over this period, it has remained above parity.
FIGURE 10 Average Ratio of Median International Price (MIP) to Canadian Price, At Market Exchange Rates, 2001–2013
Source: PMPRB
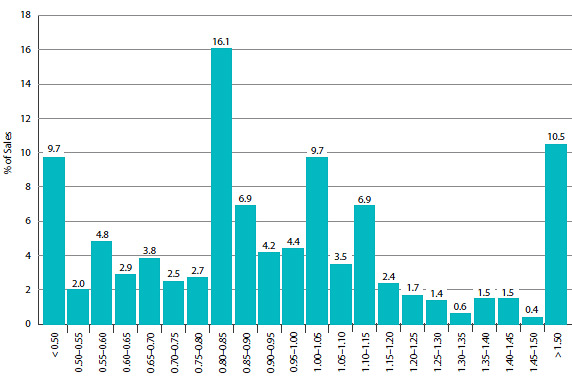
Figure 11 offers more detail on the product-level MIP-to-Canadian ratios underlying the averages reported in Table 12. This figure distributes the 2013 sales of each patented drug product according to the value of its MIP-to-Canadian price ratio (more exactly, according to the range into which the ratio fell).13 These results show substantial dispersion in product-level price ratios: while patented drug products with MIP-to-Canadian price ratios between 0.90 and 1.10 accounted for 21.8% of sales, those with ratios less than 0.90 accounted for 51.4% of sales, and products with ratios exceeding 1.10 accounted for 26.9%.
FIGURE 11 Range Distribution, Sales, by MIP-to-Canadian Price Ratio, 2013
Source: PMPRB
Utilization of Patented Drug Products
The price and sales data used to calculate the PMPI also allow the PMPRB to examine trends in the quantities of patented drug products sold in Canada. The PMPRB maintains the Patented Medicines Quantity Index (PMQI) for this purpose. Figure 12 provides average rates of utilization growth, as measured by the PMQI, from 1988 through 2013. These results confirm that in recent years, growth in the utilization of patented drug products has been the primary source of rising sales, with rates of utilization growth roughly tracking sales growth. This tracking pattern continued in 2013, with the utilization of patented drug products, on average, increasing by 6.5 between 2012 and 2013 and sales increasing by 6.5%.
FIGURE 12 Annual Rate of Change, Patented Medicines Quantity Index (PMQI), 1988–2013
Source: PMPRB
Utilization Growth by Therapeutic Class
Table 13 provides average rates of utilization growth among patented drug products at the level of major therapeutic classes. The results in this table were obtained by applying the PMQI methodology to data segregated by ATC Level I class. As in Table 10, the last column provides an approximate decomposition of overall PMQI change into contributions attributable to each therapeutic class.
In 2013, levels of utilization increased in eight therapeutic classes. Modest growth in alimentary tract and metabolism, antineoplastics and immunomodulating agents, respiratory system and sensory organs products accounted for most of the growth in overall utilization. Utilization of drug products in the cardiovascular system, genito-urinary system and sex hormones and nervous system classes declined.
TABLE 13 Change in the Patented Medicines Quantity Index (PMQI), by Major Therapeutic Class, 2013
| Therapeutic class |
Share:
2013 sales (%) |
Quantity change:
2012 to 2013 (%) |
Contribution:
Change in PMQI (%) |
|
* These groups have been combined for reasons of confidentiality.
** Values in this column may not add to 100.0 due to rounding.
Source: PMPRB
|
| A: Alimentary tract and metabolism |
10.4 |
11.9 |
1.2 |
| B: Blood and blood forming organs |
5.7 |
3.4 |
0.2 |
| C: Cardiovascular system |
7.5 |
-20.7 |
-1.6 |
| D: Dermatologicals |
1.0 |
2.3 |
0.0 |
| G: Genito-urinary system and sex hormones |
3.7 |
-3.0 |
-0.1 |
| H: Systemic hormonal preparations |
0.5 |
14.8 |
0.1 |
J: General antiinfectives for systemic use and
P: Antiparasitic products* |
11.1 |
4.7 |
0.5 |
| L: Antineoplastics and immunomodulating agents |
28.9 |
18.2 |
5.3 |
| M: Musculo-skeletal system |
3.2 |
0.8 |
0.0 |
| N: Nervous system |
13.6 |
-1.5 |
-0.2 |
| R: Respiratory system |
9.3 |
12.7 |
1.2 |
| S: Sensory organs |
4.7 |
26.5 |
1.2 |
| V: Various |
0.5 |
16.1 |
0.1 |
| All therapeutic classes |
100.0** |
6.5 |
6.5 |
Canadian Drug Expenditures in the Global Context
IMS Health14 regularly reports on drug sales across a large number of countries. Based on sales data from this source, Figure 13 provides shares of global sales for Canada and each of the seven comparator countries that the PMPRB considers in conducting its price reviews.15 The Canadian market accounted for 2.5% of the global market in 2013.
FIGURE 13 Distribution of Drug Sales Among Major National Markets, 2013
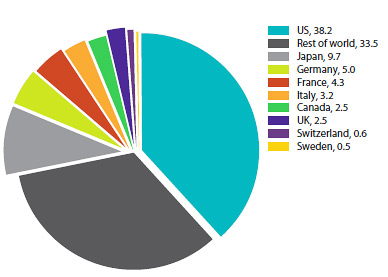
Source: MIDAS©, 2005–2013, IMS Health Incorporated or its affiliates. All rights reserved.16
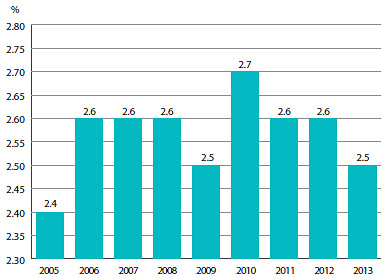
Figure 14 provides Canada's share of global sales for 2005 to 2013. The Canadian share has remained between 2.4% and 2.7% throughout this period.
FIGURE 14 Canada's Share of Drug Sales, 2005–2013
Source: MIDAS©, 2005–2013, IMS Health Incorporated or its affiliates. All rights reserved.16
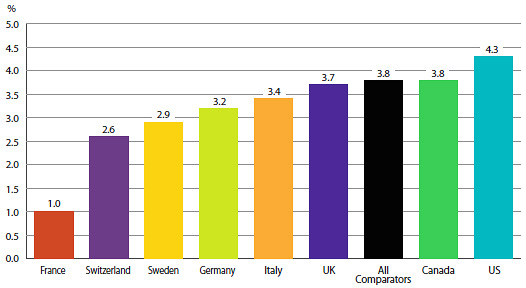
Figure 15 gives the average annual rate of growth in total drug sales for Canada and the seven comparator countries, individually and collectively. From 2005 to 2013, drug sales in Canada rose at an average annual rate of approximately 3.8%. This is equal to the average rate of growth in drug sales among the seven comparator countries over the same period.
FIGURE 15 Average Rate of Growth, Drug Sales, at Constant 2013 Market Exchange Rates, by Country, 2005–2013
Source: MIDAS©, 2005–2013, IMS Health Incorporated or its affiliates. All rights reserved.16
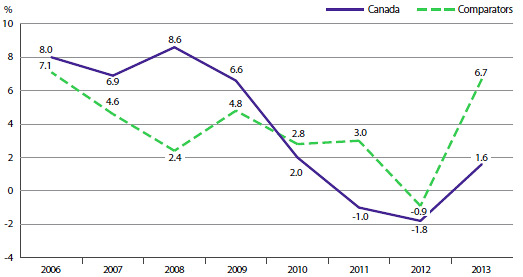
Figure 16 compares rates of year-over-year growth in drug sales in Canada and the comparator countries combined. In 2013, for the fourth consecutive year, sales grew at a slower rate in Canada than in the comparator countries.
FIGURE 16 Average Annual Rate of Change in Drug Sales, at Constant 2013 Market Exchange Rates, Canada and Comparator Countries, 2006–2013
Source: MIDAS©, 2005–2013, IMS Health Incorporated or its affiliates. All rights reserved.16
The proportion of national income allocated to the purchase of drug products provides another way to compare drug costs across countries.17 Figure 17 gives drug expenditures as a share of Gross Domestic Product (GDP) for Canada and the seven comparator countries based on data for 2011. Drug expenditures absorbed between 1.0% and 2.1% of the GDP in the seven comparators. The Canadian value (1.9%) lies near the upper end of this range.
FIGURE 17 Pharmaceutical Expenditure as a Share of GDP, 2011
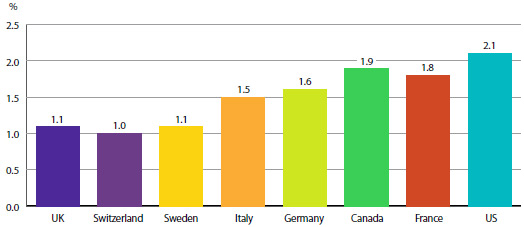
Source: OECD
Table 14 provides historical perspective on the expendituresto- GDP ratio. Between 2000 and 2011 drug expenditures in Canada grew at a rate only second to the United States, at close to twice the rate of GDP growth.
TABLE 14 Drug Expenditures as a Share of GDP, 2011
| |
Share:
Drug expenditures/GDP, 2011 (%) |
Share:
Drug expenditures/GDP, 2000 (%) |
Growth: Drug expenditures
2000–2011 (%) |
Growth: GDP
2000–2011 (%) |
| Source: OECD |
| Canada |
1.86 |
1.42 |
160.38 |
98.87 |
| France |
1.81 |
1.81 |
81.07 |
81.11 |
| Germany |
1.59 |
1.43 |
99.70 |
79.23 |
| Italy |
1.49 |
1.74 |
63.91 |
91.36 |
| Sweden |
1.15 |
1.18 |
60.30 |
64.55 |
| Switzerland |
1.03 |
1.11 |
57.48 |
69.05 |
| United Kingdom |
1.07 |
1.14 |
43.90 |
53.09 |
| United States |
2.07 |
1.46 |
125.70 |
59.12 |
Table 15 gives the composition of patentees' sales by therapeutic class for Canada and the seven comparator countries, individually and as an aggregate.18 The results imply a remarkable degree of similarity across countries.
TABLE 15 Distribution of Drug Sales (%) by Major Therapeutic Class for Canada and Comparator Countries, 2013
| Therapeutic class |
Canada |
Comparators |
France |
Italy |
Germany |
Sweden |
Switzerland |
United Kingdom |
United States |
|
* Values in this column may not add to 100.0 due to rounding.
Source: MIDAS©, 2005–2013, IMS Health Incorporated or its affiliates. All rights reserved.16
|
| A: Alimentary tract and metabolism |
12.4 |
12.4 |
10.3 |
11.1 |
11.2 |
9.7 |
11.1 |
10.9 |
13.0 |
| B: Blood and blood-forming organs |
4.1 |
5.1 |
7.5 |
8.2 |
6.1 |
8.0 |
5.2 |
4.4 |
4.4 |
| C: Cardiovascular system |
11.8 |
9.5 |
11.8 |
12.8 |
8.8 |
5.3 |
10.6 |
7.6 |
9.2 |
| D: Dermatologicals |
3.2 |
3.0 |
2.5 |
2.1 |
2.7 |
2.6 |
3.6 |
3.1 |
3.1 |
| G: Genito-urinary system and sex hormones |
5.3 |
5.1 |
3.2 |
4.0 |
3.5 |
4.8 |
4.6 |
4.3 |
5.7 |
| H: Systemic hormonal preparations |
1.3 |
2.2 |
2.0 |
2.1 |
2.1 |
2.6 |
1.6 |
2.4 |
2.2 |
| J: General antiinfectives for systemic use |
7.5 |
10.7 |
12.0 |
13.0 |
9.7 |
7.2 |
10.6 |
10.7 |
10.5 |
| L: Antineoplastics and immunomodulating agents |
17.2 |
17.7 |
18.0 |
17.2 |
22.1 |
23.2 |
21.1 |
17.9 |
17.0 |
| M: Musculo-skeletal system |
3.8 |
3.2 |
3.3 |
3.8 |
3.7 |
3.3 |
4.9 |
2.6 |
3.1 |
| N: Nervous system |
18.3 |
17.2 |
14.5 |
11.8 |
14.4 |
18.1 |
15.2 |
18.4 |
18.2 |
| P: Antiparasitic products |
0.2 |
0.2 |
0.2 |
0.0 |
0.1 |
0.2 |
0.2 |
0.2 |
0.2 |
| R: Respiratory system |
7.4 |
7.4 |
6.2 |
5.7 |
7.0 |
9.0 |
6.4 |
9.8 |
7.5 |
| S: Sensory organs |
3.7 |
2.7 |
3.1 |
2.1 |
2.7 |
2.7 |
3.4 |
3.6 |
2.6 |
| V: Various |
4.0 |
3.8 |
5.3 |
6.0 |
5.8 |
3.3 |
1.7 |
4.1 |
3.2 |
| All therapeutic classes* |
100.0 |
100.0 |
100.0 |
100.0 |
100.0 |
100.0 |
100.0 |
100.0 |
100.0 |
Analysis of Research and Development Expenditures
The Patent Act (Act) mandates the PMPRB to monitor and report on pharmaceutical research and development (R&D) spending (while giving the PMPRB no regulatory authority to consider the amount or type of patentees' research spending in the context of its price regulation). This chapter provides key statistics on the current state of pharmaceutical research investment in Canada.
Data Sources
The statistical results presented in this report were entirely derived from data that patentees submitted to the PMPRB.
The Act requires each patentee to report its total gross revenues from sales of all drugs for human or veterinary use (including revenues from sales of non-patented drug products and from licensing agreements) and R&D expenditures in Canada related to medicines (both patented and nonpatented for human or veterinary use). Patentees transmit this information to the PMPRB by means of its Form 3 (Revenues and Research and Development Expenditures Provided Pursuant to subsection 88(1) of the Patent Act).
The Patented Medicines Regulations (Regulations) require that each submitted Form 3 be accompanied by a certificate stating the information it contains is “true and correct”. The Board does not audit Form 3 submissions, but it does review submitted data for anomalies and inconsistencies, seeking corrections or clarifications from patentees where necessary. To confirm that PMPRB staff has correctly interpreted the data submitted, each patentee is given the opportunity to review and confirm the accuracy of its own R&D-to-sales ratio before that ratio is published.
Failure to File
It is a patentee's responsibility to ensure a complete and accurate Form 3 is filed within the time frame set out in the Regulations. If a patentee fails to meet these filing requirements, the Board may issue an Order demanding compliance. There were no such Board Orders issued for the 2013 reporting period.
Coverage
Note that companies without sales of patented medicines do not need to report their R&D expenditures to the PMPRB. This has two implications.
First, the statistical results reported here should not be taken to cover all pharmaceutical research conducted in Canada. For example, a company may sell only non-patented drug products but may still perform considerable research in Canada. Similarly, a company may conduct research and have no product sales at all.19 The results presented below will not reflect the R&D expenditures of firms in either situation.
Second, as new patented drug products come onto the Canadian market and existing patents expire, the number and identity of companies required to file R&D data may change from year to year. A total of 81 companies reported on their R&D activity in 2013. Of these, 35 were members of Canada's Research-Based Pharmaceutical Companies (Rx&D).
Definition of Sales Revenues
For reporting purposes, sales revenues are defined as total gross revenues from sales in Canada of all drug products and from licensing agreements (e.g., royalties and fees accruing to the patentee related to sales in Canada by licensees).
Definition of R&D Expenditures
Pursuant to section 6 of the Regulations, patentees are required to report R&D expenditures that would have qualified for an investment tax credit in respect to scientific research and experimental development (SR&ED) under the provisions of the Income Tax Act that came into effect on December 1, 1987.20 By this definition, R&D expenditures may include current expenditures, capital equipment costs and allowable depreciation expenses. Market research, sales promotions, quality control or routine testing of materials, devices or products and routine data collection are not eligible for an investment tax credit and, therefore, are not to be included in the R&D expenditures reported by patentees.
Total Sales Revenues and R&D Expenditures
Table 16 provides an overview of reported sales revenues and R&D expenditures over the period 1988 through 2013.
Patentees reported total 2013 sales revenues of $16.8 billion, an increase of 0.4% from 2012. Sales revenues reported by Rx&D members were $12.2 billion, accounting for 72.3% of the total. (Less than 1% of reported sales revenues were generated by licensing agreements.)
Patentees reported R&D expenditures of $752.8 million in 2013, a decrease of 15.9% over 2012. Rx&D members reported R&D expenditures of $652.0 million in 2012, a decrease of 16.7% over last year. Rx&D members accounted for 86.6% of all reported R&D expenditures in 2013.
R&D-to-Sales Ratios
Table 16 and Figure 18 also provide ratios of R&D expenditures to sales revenues. It should be noted in this context that, with the adoption of the 1987 amendments to the Act, Rx&D made a public commitment to increase their annual R&D expenditures to 10% of sales revenues by 1996.21 This level of R&D expenditure was obtained by 1993, with the ratio exceeding 10% in some years. However, since 2003, R&D-to-sales ratios for all patentees and for Rx&D members have declined.
The ratio of R&D expenditures to sales revenues among all patentees was 4.5% in 2013, down from 5.3% in 2012. These values are below figures last observed in 1988. The overall R&D-to-sales ratio has been less than 10% for the past 13 consecutive years.
The corresponding R&D-to-sales ratio for members of Rx&D was 5.4% in 2013, down from 6.6% in 2012.22 These values are close to figures last observed in 1988. The Rx&D ratio has been less than 10% for the past 11 consecutive years.
Table 21 in Appendix 3 provides details on the range of 2013 R&D-to-sales ratios. Of the 81 companies reporting in 2013, 94.8% had R&D-to-sales ratios below 10%.
TABLE 16 Total R&D Expenditures and R&D-to-Sales Ratios of Reporting Companies, 1988–2013
| Year |
All Patentees |
Rx&D |
R&D-to- sales ratio: all patentees (%) |
R&D-to- sales ratio: Rx&D patentees (%) |
| Number of companies reporting |
R&D expenditures by all patentees ($millions) |
Change from previous year (%) |
Sales revenues ($millions) |
Change from previous year (%) |
R&D expenditures by Rx&D patentees ($millions) |
Change from previous year (%) |
Sales revenues by Rx&D patentees ($millions) |
Change from previous year (%) |
| Source: PMPRB |
| 2013 |
81 |
752.8 |
-15.9 |
16,817.9 |
0.4 |
652.0 |
-16.7 |
12,167.6 |
2.3 |
4.5 |
5.4 |
| 2012 |
85 |
894.8 |
-9.8 |
16,754.4 |
-5.8 |
782.8 |
-13.1 |
11,896.1 |
-11.5 |
5.3 |
6.6 |
| 2011 |
79 |
991.7 |
-15.8 |
17,798.8 |
4.7 |
901.2 |
-9.9 |
13,446.1 |
10.7 |
5.6 |
6.7 |
| 2010 |
82 |
1,178.2 |
-7.4 |
17,000.0 |
-0.3 |
1,000.2 |
-11.7 |
12,149.0 |
-11.8 |
6.9 |
8.2 |
| 2009 |
81 |
1,272.0 |
-2.9 |
17,051.9 |
4.5 |
1,132.9 |
-3.4 |
13,780.0 |
4.6 |
7.5 |
8.2 |
| 2008 |
82 |
1,310.7 |
-1.1 |
16,316.7 |
2.0 |
1,172.2 |
-1.0 |
13,178.2 |
-1.4 |
8.1 |
8.9 |
| 2007 |
82 |
1,325.0 |
9.5 |
15,991.0 |
7.3 |
1,184.4 |
24.8 |
13,359.8 |
20.0 |
8.3 |
8.9 |
| 2006 |
72 |
1,210.0 |
-1.9 |
14,902.0 |
4.7 |
949.0 |
-8.8 |
11,131.2 |
-5.8 |
8.1 |
8.5 |
| 2005 |
80 |
1,234.3 |
5.5 |
14,231.3 |
0.5 |
1,040.1 |
3.9 |
11,821.4 |
0.0 |
8.7 |
8.8 |
| 2004 |
84 |
1,170.0 |
-2.0 |
14,168.3 |
4.0 |
1,000.8 |
0.8 |
11,819.0 |
8.8 |
8.3 |
8.5 |
| 2003 |
83 |
1,194.3 |
-0.4 |
13,631.1 |
12.8 |
992.9 |
-3.6 |
10,865.7 |
5.2 |
8.8 |
9.1 |
| 2002 |
79 |
1,198.7 |
13.0 |
12,081.2 |
12.5 |
1,029.6 |
10.1 |
10,323.8 |
16.8 |
9.9 |
10.0 |
| 2001 |
74 |
1,060.1 |
12.6 |
10,732.1 |
15.3 |
935.2 |
14.7 |
8,835.4 |
14.3 |
9.9 |
10.6 |
| 2000 |
79 |
941.8 |
5.3 |
9,309.6 |
12.0 |
815.5 |
4.0 |
7,728.8 |
11.6 |
10.1 |
10.6 |
| 1999 |
78 |
894.6 |
12.0 |
8,315.5 |
19.2 |
784.3 |
9.9 |
6,923.4 |
22.8 |
10.8 |
11.3 |
| 1998 |
74 |
798.9 |
10.2 |
6,975.2 |
10.9 |
713.7 |
8.6 |
5,640.2 |
10.6 |
11.5 |
12.7 |
| 1997 |
75 |
725.1 |
9.0 |
6,288.4 |
7.4 |
657.4 |
10.3 |
5,098.2 |
4.9 |
11.5 |
12.9 |
| 1996 |
72 |
665.3 |
6.4 |
5,857.4 |
9.9 |
595.8 |
6.5 |
4,859.5 |
8.7 |
11.4 |
12.3 |
| 1995 |
71 |
625.5 |
11.5 |
5,330.2 |
7.5 |
559.5 |
9.8 |
4,468.8 |
1.4 |
11.7 |
12.5 |
| 1994 |
73 |
561.1 |
11.4 |
4,957.4 |
4.4 |
509.5 |
10.4 |
4,407.2 |
2.0 |
11.3 |
11.6 |
| 1993 |
70 |
503.5 |
22.1 |
4,747.6 |
14.0 |
461.4 |
24.0 |
4,321.4 |
14.4 |
10.6 |
10.7 |
| 1992 |
71 |
412.4 |
9.6 |
4,164.4 |
6.9 |
372.1 |
9.0 |
3,778.4 |
6.5 |
9.9 |
9.8 |
| 1991 |
65 |
376.4 |
23.2 |
3,894.8 |
18.1 |
341.4 |
24.7 |
3,546.9 |
19.5 |
9.7 |
9.6 |
| 1990 |
65 |
305.5 |
24.8 |
3,298.8 |
11.0 |
273.8 |
25.8 |
2,967.9 |
10.5 |
9.3 |
9.2 |
| 1989 |
66 |
244.8 |
47.4 |
2,973.0 |
9.4 |
217.6 |
34.7 |
2,685.5 |
7.3 |
8.2 |
8.1 |
| 1988 |
66 |
165.7 |
— |
2,718.0 |
— |
161.5 |
— |
2,502.3 |
— |
6.1 |
6.5 |
FIGURE 18 R&D-to-Sales Ratio, Pharmaceutical Patentees, 1988–2013
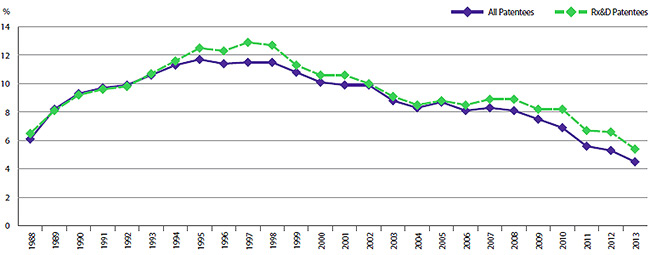
Source: PMPRB
Current Expenditures by Type of Research
Table 17 and Figure 19 (as well as Figure 21 in Appendix 3) provide information on the allocation of 2013 current R&D expenditures23 among basic and applied research and other qualifying R&D.24 Patentees reported spending $67.6 million on basic research in 2013, representing 9.3% of current R&D expenditures and a decline of 41.0% over the previous year. Patentees reported spending $487.8 million on applied research, representing 66.9% of current R&D expenditures. Clinical trials accounted for 68.5% of applied research expenditures.
TABLE 17 Current R&D Expenditures by Type of Research, 2013 and 2012
| Type of research |
Expenditures: 2013 ($millions) |
Share: 2013 (%) |
Expenditures: 2012 ($millions) |
Share: 2012 (%) |
Annual change in expenditures (%) |
| Source: PMPRB |
| Basic |
67.6 |
9.3 |
114.6 |
13.2 |
-41.0 |
| Chemical |
39.2 |
5.4 |
78.3 |
9.1 |
-49.9 |
| Biological |
28.4 |
3.9 |
36.3 |
4.2 |
-21.8 |
| Applied |
487.8 |
66.9 |
520.9 |
60.2 |
-6.4 |
| Manufacturing process |
70.5 |
9.7 |
82.2 |
9.5 |
-14.2 |
| Pre-clinical Trial I |
40.0 |
5.5 |
35.7 |
4.1 |
12.0 |
| Pre-clinical Trial II |
42.9 |
5.9 |
41.5 |
4.8 |
3.4 |
| Clinical Trial Phase I |
35.8 |
4.9 |
34.3 |
4.0 |
4.4 |
| Clinical Trial Phase II |
70.1 |
9.6 |
82.1 |
9.5 |
-14.6 |
| Clinical Trial Phase III |
228.5 |
31.3 |
245.1 |
28.3 |
-6.8 |
| Other qualifying R&D |
173.9 |
23.8 |
230.1 |
26.6 |
-24.4 |
| Total |
729.3 |
100.0 |
865.6 |
100.0 |
-15.8 |
FIGURE 19 Current R&D Expenditures by Type of Research, 1988–2013
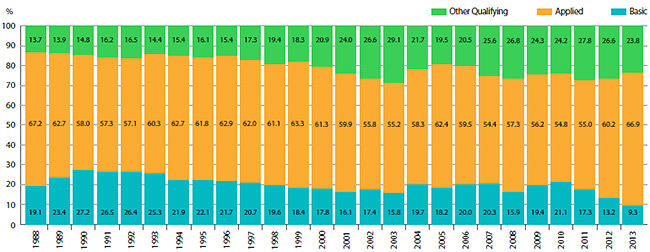
Source: PMPRB
Current R&D Expenditures by Performer
Patentees report expenditures on research they conduct themselves (intramural) and research performed by other establishments, such as universities, hospitals and other manufacturers (extramural). Table 18 shows that 50.0% of 2013 current research expenditures were intramural. Research performed by other companies on behalf of patentees was 11.3% of current expenditures, while research conducted in universities and hospitals accounted for 13.0%.
TABLE 18 Current R&D Expenditures by R&D Performer, 2013 and 2012
| R&D performer |
Expenditures: 2013
($millions) |
Share:
2013 (%) |
Expenditures:
2012
($millions) |
Share:
2012 (%) |
Annual change
in expenditures
(%) |
| Source: PMPRB |
| Intramural |
| Patentees |
364.9 |
50.0 |
425.3 |
49.1 |
-14.2 |
| Extramural |
| Universities and hospitals |
94.7 |
13.0 |
131.0 |
15.1 |
-27.7 |
| Other companies |
187.4 |
25.7 |
218.6 |
25.3 |
-9.3 |
| Others |
82.3 |
11.3 |
90.7 |
10.5 |
-14.3 |
| Total |
729.3 |
100.0 |
865.6 |
100.0 |
-15.8 |
Current R&D Expenditures by Source of Funds
Table 19 provides information on the sources of funds used by patentees to finance their R&D activity. Internal company funds remained by far the single largest source of funding in 2013, accounting for 87.7% of current expenditures. Funds received from government amounted to 1.4% of current expenditures.
TABLE 19 Total R&D Expenditures by Source of Funds, 2013 and 2012
| Source of funds |
Expenditures:
2013
($millions) |
Share:
2013 (%) |
Expenditures:
2012
($millions) |
Share:
2012 (%) |
Annual increase
in expenditures
(%) |
| Source: PMPRB |
| Company funds |
660.5 |
87.7 |
777.1 |
86.8 |
-15.0 |
| Federal/provincial governments |
10.8 |
1.4 |
23.8 |
2.7 |
-55.0 |
| Others |
81.5 |
10.8 |
93.9 |
10.5 |
-13.2 |
| Total |
752.8 |
100.0 |
894.8 |
100.0 |
-15.9 |
Current R&D Expenditures by Region
Table 20 (as well as Table 23 and Table 24 in Appendix 3) show current R&D expenditures by region. As in previous years, current expenditures were heavily concentrated in Ontario and Quebec in 2013, with these provinces accounting for 84.1% of total expenditures. While current R&D expenditures decreased at a year-over-year rate of 20.9% in Western Canada, they also declined in Ontario by 12.7% and in Quebec by 17.7%.
TABLE 20 Current R&D Expenditures by Region, 2013 and 2012
| Region |
Expenditures: 2013
($millions) |
Share: 2013 (%) |
Expenditures: 2012
($millions) |
Share: 2012 (%) |
Annual increase in expenditures (%) |
|
* Values in this column may not add to 100.0 due to rounding.
Source: PMPRB
|
| Atlantic provinces |
20.1 |
2.8 |
21.9 |
2.5 |
-8.2 |
| Quebec |
292.0 |
40.0 |
354.8 |
41.0 |
-17.7 |
| Ontario |
322.0 |
44.1 |
368.6 |
42.6 |
-12.7 |
| Western provinces |
95.2 |
13.1 |
120.3 |
13.9 |
-20.9 |
| Territories |
0.0 |
0.0 |
0.0 |
0.0 |
0.0 |
| Total |
729.3 |
100.0* |
865.6 |
100.0* |
-15.8 |
The Global Context
Figure 20 compares Canadian pharmaceutical R&D-to-sales ratios for the years 2000 and 2011 to those in the PMPRB's seven comparator countries.25 Canada's ratio stood at 10.1% in 2000. Only Italy, at 6.2%, had a lower ratio in that year, while Switzerland had the highest ratio at 102.5%.
In 2011, Canada remained at the bottom of the range at 5.6%, with Italy second lowest at 6.2%. Ratios in all other comparator countries remained well above Canada's ratio. The ratio obtained by aggregating R&D spending and sales across all seven comparator countries was 21.7%, three and a half times the value obtained for Canada.
FIGURE 20 R&D-to-Sales Ratios, Canada and Comparator Countries
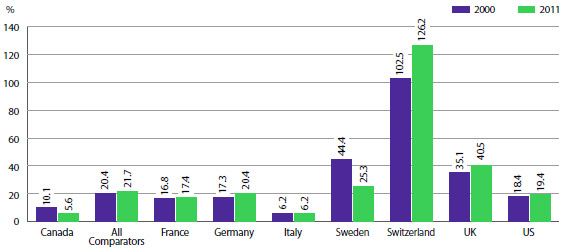
Source: PMPRB; European Federation of Pharmaceutical Industries and Associations (EFPIA): The Pharmaceutical Industry in Figures 2013, PhRMA 2013 profile
The R&D-to-sales ratios represented in Figure 20 may be compared to the average bilateral price ratios reported in Table 11 (see Comparison of Canadian Prices to Foreign Prices section). Several comparator countries, which have patented drug prices that are, on average, substantially less than prices in Canada, have achieved R&D-to-sales ratios well above those in Canada.
As noted in last year's report, there are a multitude of factors that drive the location of pharmaceutical R&D. These include where companies can find the best science base at reasonable cost and ready access to a quality clinical trials infrastructure. Although price levels are often cited as an important policy lever for attracting R&D, the data has not supported this link domestically or internationally.
National Prescription Drug Utilization Information System
Background
The National Prescription Drug Utilization Information System (NPDUIS) is a research initiative established by federal, provincial, and territorial Ministers of Health in September 2001.
Its purpose is to provide policy makers and public drug plan managers with critical analyses of price, utilization and cost trends, so that Canada's health care system has more comprehensive and accurate information on how prescription drugs are being used and on sources of cost increases.
The PMPRB's authority to conduct work under the NPDUIS initiative is based on a formal request by the federal Minister of Health under section 90 of the Patent Act, and is consistent with the PMPRB's mandate to report on pharmaceutical trends.
The NPDUIS Advisory Committee, composed of representatives from public drug plans in British Columbia, Alberta, Saskatchewan, Manitoba, Ontario, New Brunswick, Nova Scotia, Prince Edward Island, Newfoundland and Labrador, Yukon, and Health Canada, advises the PMPRB on its research agenda and on individual studies. The Committee also includes observers from Canadian Institute for Health Information (CIHI) and Canadian Agency for Drugs and Technologies in Health (CADTH).
Highlights
The PMPRB published four NPDUIS reports in 2013/14:
New Drug Pipeline Monitor – 5th Edition
This report identifies drugs currently under development that may have an impact on future public drug plan expenditures.
The Drivers of Prescription Drug Expenditures – A Methodological Report
This methodological study analyzes the drivers of prescription drug expenditures and provides a basic formula that decomposes growth into drivers of drug cost and dispensing fees. Analyzing these drivers and how their contribution changes over time may reveal important changes in drug utilization and cost pressures.
Analytical Snapshot: International Generic Price Comparison, Early 2011
This analytical snapshot compares generic drug prices in Canada with those of other industrialized countries. The report highlights the changes in Canadian generic pricing that occurred between 2008 and the first quarter of 2011. Generic prices from IMS Health's MIDAS™ database and the Ontario formulary were used to conduct price comparisons.
Utilization of Prescription Opioids in Canada's Public Drug Plans, 2006/07 to 2012/13
This study reports on the use of prescription opioids across Canadian jurisdictions between fiscal 2006/07 and 2012/13, in light of emerging public health and safety issues.
Other NPDUIS studies are currently under development and are summarized in the NPDUIS Research Agenda.
The NPDUIS Advisory Committee held its annual meeting in Ottawa in October 2013. The meeting provided an opportunity to share the results of completed and ongoing research studies, and discuss priorities for future research.
Appendix 1: Glossary
For more detailed information and definitions please refer to the Patent Act, the Patented Medicines Regulations, the PMPRB Compendium of Policies, Guidelines and Procedures, and the Food and Drug Regulations, or contact the PMPRB.
- ACTIVE INGREDIENT
-
Chemical or biological substance responsible for the claimed pharmacologic effect of a drug product.
- ADVANCE RULING CERTIFICATE (ARC)
-
A non-binding advance ruling certificate may be issued pursuant to subsection 98(4) of the Patent Act at the request of a patentee when the Board is satisfied that the price or proposed price of the medicine would not exceed the maximum non-excessive price under the Board's Guidelines.
- ATC
-
Anatomical Therapeutic Chemical (ATC) classification system, developed and maintained by the World Health Organization (WHO) Collaborating Centre for Drug Statistics Methodology, divides drugs into different groups according to their site of action and therapeutic and chemical characteristics. This system is used by the PMPRB as a guide for selecting comparable medicines for purposes of price review.
- DEDICATION OF PATENT
-
A practice whereby a patentee notifies the Commissioner of Patents that it has surrendered its rights and entitlements flowing from the patent for the benefit of the public to use and enjoy. NB: As of January 30, 1995, the Board does not recognize dedication of patent as a means to remove the medicine from its jurisdiction.
- DRUG IDENTIFICATION NUMBER (DIN)
-
A registration number (drug identification number) that the Health Products and Food Branch of Health Canada assigns to each prescription and non-prescription drug product marketed under the Food and Drugs Regulations. The DIN is assigned using information in the following areas: manufacturer of the product; active ingredient(s); strength of active ingredient(s); pharmaceutical dosage form; brand/trade name; and route of administration.
- DRUG PRODUCT
-
A particular presentation of a medicine characterized by its pharmaceutical dosage form and the strength of the active ingredient(s).
- FAILURE TO FILE
-
The complete or partial failure of a patentee to comply with regulatory filing requirements pursuant to the Patent Act and the Patented Medicines Regulations
- FAILURE TO REPORT
-
The complete failure of a patentee to have reported a patented drug product being sold in accordance with regulatory filing requirements pursuant to the Patent Act and the Patented Medicines Regulations.
- GENERIC PRODUCT
-
A drug product with the same active ingredient, strength and dosage form of a brand name drug product.
- LICENSE, VOLUNTARY
-
A contractual agreement between a patent holder and a licensee under which the licensee is entitled to enjoy the benefit of the patent or to exercise any rights in relation to the patent for some consideration (i.e., royalties in the form of a share of the licensee's sales).
- MEDICINE
-
Any substance or mixture of substances made by any means, whether produced biologically, chemically, or otherwise, that is applied or administered in vivo in humans or in animals to aid in the diagnosis, treatment, mitigation or prevention of disease, symptoms, disorders, abnormal physical states, or modifying organic functions in humans and or animals, however administered. For greater certainty, this definition includes vaccines, topical preparations, anaesthetics and diagnostic products used in vivo, regardless of delivery mechanism (e.g., transdermal, capsule form, injectable, inhaler, etc.). This definition excludes medical devices, in vitro diagnostic products and disinfectants that are not used in vivo.
- NOTICE OF COMPLIANCE (NOC)
-
Means a notice issued under section C.08.004 or C.08.004.01 of the Food and Drug Regulations. The issuance of an NOC indicates that a drug product meets the required Health Canada standards for use in humans or animals and that the product is approved for sale in Canada.
- PATENT
-
An instrument issued by the Commissioner of Patents in the form of letters patent for an invention that provides its holder with a monopoly limited in time, for the claims made within the patent. A patent gives its holder and its legal representatives, the exclusive right of making, constructing and using the invention and selling it to others to be used.
- PATENTED MEDICINE PRICE INDEX (PMPI)
-
The PMPI was developed by the PMPRB as a measure of average year-over-year change in the transaction prices of patented drug products sold in Canada, based on the price and sales information reported by patentees.
- PATENTEE
-
As defined by subsection 79(1) of the Patent Act, "the person for the time being entitled to the benefit of the patent for that invention and includes, where any other person is entitled to exercise any rights in relation to that patent other than under a license continued by subsection 11(1) of the Patent Act Amendment Act, 1992, that other person in respect of those rights."
- PENDING PATENT
-
An application for a patent that has not yet been issued.
- RESEARCH AND DEVELOPMENT (R&D)
-
Basic or applied research for the purpose of creating new, or improving existing, materials, devices, products or processes (e.g., manufacturing processes).
- RESEARCH AND DEVELOPMENT – APPLIED RESEARCH
-
R&D directed toward a specific practical application, comprising research intended to improve manufacturing processes, pre-clinical trials and clinical trials.
- RESEARCH AND DEVELOPMENT – BASIC RESEARCH
-
R&D directed toward a specific practical application, comprising research intended to improve manufacturing processes, pre-clinical trials and clinical trials.
- RESEARCH AND DEVELOPMENT – OTHER QUALIFYING
-
Includes eligible research and development expenditures that cannot be classified into any of the preceding categories of "type of research and development". It includes drug regulation submissions, bioavailability studies and Phase IV clinical trials.
- RESEARCH AND DEVELOPMENT EXPENDITURES
-
For the purposes of the Patented Medicines Regulations, in particular Sections 5 and 6, research and development includes activities for which expenditures would have qualified for the investment tax credit for scientific research and experimental development under the Income Tax Act as it read on December 1, 1987.
- CURRENT RESEARCH AND DEVELOPMENT EXPENDITURES
-
Consist of the following non-capital expenses that are directly related to research work: (a) wages and salaries, (b) direct material, (c) contractors and subcontractors, (d) other direct costs such as factory overhead, (e) payments to designated institutions, (f) payments to granting councils, and (g) payments to other organizations. These elements are described in greater detail in the Patentees' Guide to Reporting – Form 3, available from the PMPRB website under Regulatory Filings.
- SPECIAL ACCESS PROGRAMME (SAP)
-
A program operated by Health Canada to give practitioners access to drugs that are not approved or otherwise available for sale in Canada.
- VOLUNTARY COMPLIANCE UNDERTAKING (VCU)
-
A written undertaking by a patentee to adjust its price to comply to the Board's Guidelines. The Chairperson may accept a VCU in lieu of issuing a Notice of Hearing if it is in the public interest. A VCU can also be submitted following the issuance of a Notice of Hearing. A VCU submitted at this point must be approved by the Board Hearing Panel struck to hear the matter. The Board reports publicly on all VCUs accepted by the Chairperson or the Board.
Appendix 2: Patented Drug Products First Reported to the PMPRB in 2013
| Brand name |
Company |
DIN |
Status |
Level of therapeutic improvement/category* |
|
* Sold after implementation of new Guidelines in 2010:
SN Slight or No Improvement
MI-S Moderate Improvement - Secondary
MI-P Moderate Improvement - Primary
SI Substantial Improvement
B Breakthrough
Sold prior to implementation of new Guidelines in 2010:
Category 1 An existing or comparable dosage form of an existing medicine
Category 2 A non-comparable dosage form of an existing medicine, or the first DIN of a new chemical entity that is a breakthrough or provides a substantial improvement over comparable existing DINs
Category 3 A non-comparable dosage form of an existing medicine, or the first DIN of a new chemical entity that provides moderate, little or no therapeutic advantage over comparable existing DINs
|
| 1 ACTIMMUNE - 100 mcg/vial |
Vidara Therapeutics Inc. |
|
Within Guidelines |
MI-P |
| 2 ADEMPAS - 0.5 mg/tablet |
Bayer Inc. |
02412764 |
Subject to Investigation |
SN |
| 3 ADEMPAS - 1 mg/tablet |
Bayer Inc. |
02412772 |
Subject to Investigation |
SN |
| 4 ADEMPAS - 1.5 mg/tablet |
Bayer Inc. |
02412799 |
Within Guidelines |
SN |
| 5 ADEMPAS - 2 mg/tablet |
Bayer Inc. |
02412802 |
Within Guidelines |
SN |
| 6 ADEMPAS - 2.5 mg/tablet |
Bayer Inc. |
02412810 |
Within Guidelines |
SN |
| 7 AUBAGIO - 14 mg/tablet |
Genzyme Canada Inc. |
02416328 |
Within Guidelines |
SN |
| 8 AXIRON - 30 mg/dose |
Eli Lilly Canada Inc. |
02382369 |
Within Guidelines |
SN |
| 9 BENEFIX - 3000 unit/vial |
Pfizer Canada Inc. |
02392984 |
Within Guidelines |
SN |
| 10 BREO ELLIPTA 100/25 |
GlaxoSmithKline Inc. |
02408872 |
Within Guidelines |
SN |
| 11 CIPRALEX MELTZ - 10 mg/tablet |
Lundbeck Canada Inc. |
02391449 |
Within Guidelines |
SN |
| 12 CIPRALEX MELTZ - 20 mg/tablet |
Lundbeck Canada Inc. |
02391457 |
Within Guidelines |
SN |
| 13 CLINDOXYL ADV 10/30 |
GlaxoSmithKline Inc. |
02382822 |
Does Not Trigger Investigation |
SN |
| 14 DUODOPA 20/5 |
Abbvie |
02292165 |
Subject to Investigation |
MI-P |
| 15 EDARBYCLOR 40/12.5 |
Takeda Canada Inc. |
02397749 |
Within Guidelines |
SN |
| 16 EDARBYCLOR 40/25 |
Takeda Canada Inc. |
02397765 |
Within Guidelines |
SN |
| 17 EDARBYCLOR 80/12.5 |
Takeda Canada Inc. |
02397757 |
Within Guidelines |
SN |
| 18 ELIQUIS - 5 mg/tablet |
Bristol-Myers Squibb Canada Co. |
02397714 |
Within Guidelines |
SN |
| 19 ERIVEDGE - 150 mg/capsule |
Hoffmann-La Roche Limited, Canada |
02409267 |
Does Not Trigger Investigation |
MI-P |
| 20 FLUAD - 45 mcg/dose |
Novartis Pharmaceuticals Canada Inc. |
02362384 |
Within Guidelines |
SN |
| 21 FYCOMPA - 2 mg/tablet |
Eisai Limited |
02404516 |
Within Guidelines |
SN |
| 22 FYCOMPA - 4 mg/tablet |
Eisai Limited |
02404524 |
Within Guidelines |
SN |
| 23 FYCOMPA - 6 mg/tablet |
Eisai Limited |
02404532 |
Within Guidelines |
SN |
| 24 FYCOMPA - 8 mg/tablet |
Eisai Limited |
02404540 |
Within Guidelines |
SN |
| 25 FYCOMPA - 10 mg/tablet |
Eisai Limited |
02404559 |
Within Guidelines |
SN |
| 26 FYCOMPA - 12 mg/tablet |
Eisai Limited |
02404567 |
Within Guidelines |
SN |
| 27 GALEXOS - 150 mg/capsule |
Janssen Inc. |
02416441 |
Within Guidelines |
MI-P |
| 28 GD-LATANOPROST/TIMOLOL 0.5/5 |
GenMed |
02373068 |
Within Guidelines |
SN |
| 29 GD-PREGABALIN - 25 mg/capsule |
GenMed |
02360136 |
Within Guidelines |
SN |
| 30 GD-PREGABALIN - 50 mg/capsule |
GenMed |
02360144 |
Within Guidelines |
SN |
| 31 GD-PREGABALIN - 75 mg/capsule |
GenMed |
02360152 |
Within Guidelines |
SN |
| 32 GD-PREGABALIN - 150 mg/capsule |
GenMed |
02360179 |
Within Guidelines |
SN |
| 33 GD-PREGABALIN - 225 mg/capsule |
GenMed |
02360195 |
Within Guidelines |
SN |
| 34 GD-PREGABALIN - 300 mg/capsule |
GenMed |
02360209 |
Within Guidelines |
SN |
| 35 GD-SILDENAFIL - 25 mg/tablet |
GenMed |
02291991 |
Within Guidelines |
SN |
| 36 GD-SILDENAFIL - 50 mg/tablet |
GenMed |
02292009 |
Within Guidelines |
SN |
| 37 GD-SILDENAFIL - 100 mg/tablet |
GenMed |
02292017 |
Within Guidelines |
SN |
| 38 GELNIQUE - 100 mg/g |
Actavis Specialty Pharmaceuticals Co. |
02366150 |
Subject to Investigation |
SN |
| 39 GENOTROPIN - 0.6 mg/syringe |
Pfizer Canada Inc. |
02401762 |
Within Guidelines |
SN |
| 40 GENOTROPIN - 0.8 mg/syringe |
Pfizer Canada Inc. |
02401770 |
Within Guidelines |
SN |
| 41 GENOTROPIN - 1 mg/syringe |
Pfizer Canada Inc. |
02401789 |
Within Guidelines |
SN |
| 42 GENOTROPIN - 1.2 mg/syringe |
Pfizer Canada Inc. |
02401797 |
Within Guidelines |
SN |
| 43 GENOTROPIN - 1.4 mg/syringe |
Pfizer Canada Inc. |
02401800 |
Within Guidelines |
SN |
| 44 GENOTROPIN - 1.6 mg/syringe |
Pfizer Canada Inc. |
02401819 |
Within Guidelines |
SN |
| 45 GENOTROPIN - 1.8 mg/syringe |
Pfizer Canada Inc. |
02401827 |
Within Guidelines |
SN |
| 46 GENOTROPIN - 2 mg/syringe |
Pfizer Canada Inc. |
02401835 |
Within Guidelines |
SN |
| 47 GENOTROPIN - 5.3 mg/pen |
Pfizer Canada Inc. |
02401703 |
Does Not Trigger Investigation |
SN |
| 48 GENOTROPIN - 12 mg/pen |
Pfizer Canada Inc. |
02401711 |
Within Guidelines |
SN |
| 49 HUMALOG KWIKPEN - 100 unit/ml |
Eli Lilly Canada Inc. |
02403412 |
Subject to Investigation |
SN |
| 50 INTUNIV XR - 1 mg/tablet |
Shire Canada Inc. |
02409100 |
Within Guidelines |
MI-S |
| 51 INTUNIV XR - 2 mg/tablet |
Shire Canada Inc. |
02409119 |
Within Guidelines |
MI-S |
| 52 INTUNIV XR - 3 mg/tablet |
Shire Canada Inc. |
02409127 |
Subject to Investigation |
MI-S |
| 53 INTUNIV XR - 4 mg/tablet |
Shire Canada Inc. |
02409135 |
Subject to Investigation |
MI-S |
| 54 ISENTRESS - 25 mg/tablet |
Merck Canada Inc. |
02392429 |
Within Guidelines |
SN |
| 55 ISENTRESS - 100 mg/tablet |
Merck Canada Inc. |
02392437 |
Within Guidelines |
SN |
| 56 JAKAVI - 5 mg/tablet |
Novartis Pharmaceuticals Canada Inc. |
02388006 |
Within Guidelines |
MI-P |
| 57 JAKAVI - 15 mg/tablet |
Novartis Pharmaceuticals Canada Inc. |
02388014 |
Within Guidelines |
MI-P |
| 58 JAKAVI - 120 mg/tablet |
Novartis Pharmaceuticals Canada Inc. |
02388022 |
Within Guidelines |
MI-P |
| 59 JAYDESS - 13 mg/unit |
Bayer Inc. |
02408295 |
Within Guidelines |
SN |
| 60 JENTADUETO 2.5/500 |
Boehringer Ingelheim (Canada) Ltd. |
02403250 |
Within Guidelines |
SN |
| 61 JENTADUETO 2.5/850 |
Boehringer Ingelheim (Canada) Ltd. |
02403269 |
Within Guidelines |
SN |
| 62 JENTADUETO 2.5/1000 |
Boehringer Ingelheim (Canada) Ltd. |
02403277 |
Within Guidelines |
SN |
| 63 JETREA - 2.5 mg/ml |
Alcon Canada Inc. |
02410818 |
Within Guidelines |
B |
| 64 KADCYLA - 20 mg/ml |
Hoffmann-La Roche Limited, Canada |
02412365 |
Within Guidelines |
MI-P |
| 65 KALYDECO - 150 mg/tablet |
Vertex Pharmaceuticals Canada Inc. |
02397412 |
Within Guidelines |
SI |
| 66 KOMBOGLYZE 500/2.5 |
Bristol-Myers Squibb Canada Co. |
02389169 |
Subject to Investigation |
SN |
| 67 KOMBOGLYZE 850/2.5 |
Bristol-Myers Squibb Canada Co. |
02389177 |
Subject to Investigation |
SN |
| 68 KOMBOGLYZE 1000/2.5 |
Bristol-Myers Squibb Canada Co. |
02389185 |
Subject to Investigation |
SN |
| 69 LEVEMIR FLEXTOUCH - 100 unit/ml |
Novo Nordisk Canada Inc. |
02412829 |
Does Not Trigger Investigation |
SN |
| 70 MEKINIST - 0.5 mg/tablet |
GlaxoSmithKline Inc. |
02409623 |
Subject to Investigation |
SN |
| 71 MEKINIST - 2 mg/tablet |
GlaxoSmithKline Inc. |
02409658 |
Subject to Investigation |
SN |
| 72 METADOL - 25 mg/tablet |
Paladin Laboratories Inc. |
02247701 |
Subject to Investigation |
SN |
| 73 MYRBETRIQ - 25 mg/tablet |
Astellas Pharma Canada Inc. |
02402874 |
Within Guidelines |
SN |
| 74 MYRBETRIQ - 50 mg/tablet |
Astellas Pharma Canada Inc. |
02402882 |
Within Guidelines |
SN |
| 75 NAGLAZYME - 1 mg/ml |
Biomarin Pharmaceutical Canada Inc. |
02412683 |
Within Guidelines |
Category 2 |
| 76 NEUPRO - 2 mg/patch |
UCB Canada Inc. |
02403900 |
Within Guidelines |
MI-S |
| 77 NEUPRO - 4 mg/patch |
UCB Canada Inc. |
02403927 |
Within Guidelines |
MI-S |
| 78 NEUPRO - 6 mg/patch |
UCB Canada Inc. |
02403935 |
Within Guidelines |
MI-S |
| 79 NEUPRO - 8 mg/patch |
UCB Canada Inc. |
02403943 |
Within Guidelines |
MI-S |
| 80 NIMENRIX - 5 mcg/dose |
GlaxoSmithKline Inc. |
02402904 |
Within Guidelines |
SN |
| 81 NOCDURNA - 25 mcg/tablet |
Ferring Pharmaceuticals Inc. |
02397927 |
Within Guidelines |
SN |
| 82 NUTROPIN AQ NUSPIN 5 |
Hoffmann-La Roche Limited, Canada |
02399091 |
Within Guidelines |
SN |
| 83 NUTROPIN AQ NUSPIN 20 |
Hoffmann-La Roche Limited, Canada |
02399083 |
Within Guidelines |
SN |
| 84 OLUX-E - 0.5 mg/gram |
GlaxoSmithKline Inc. |
02344408 |
Within Guidelines |
SN |
| 85 OMNARIS HFA - 50 mcg/dose |
Takeda Canada Inc. |
02404311 |
Does Not Trigger Investigation |
SN |
| 86 ORENCIA - 125 mg/syringe |
Bristol-Myers Squibb Canada Co. |
02402475 |
Within Guidelines |
MI-P |
| 87 OXY-IR - 5 mg/tablet |
Purdue Pharma |
02231934 |
Within Guidelines |
Category 1 |
| 88 OXY-IR - 10 mg/tablet |
Purdue Pharma |
02240131 |
Within Guidelines |
Category 1 |
| 89 OXY-IR - 20 mg/tablet |
Purdue Pharma |
02240132 |
Within Guidelines |
Category 1 |
| 90 PENTASA - 1 gm/tablet |
Ferring Pharmaceuticals Inc. |
02399466 |
Does Not Trigger Investigation |
SN |
| 91 PERJETA - 420 mg/vial |
Hoffmann-La Roche Limited, Canada |
02405016 |
Within Guidelines |
SI |
| 92 PERJETA-HERCEPTIN 420/440 |
Hoffmann-La Roche Limited, Canada |
02405024 |
Within Guidelines |
SN |
| 93 PICATO 0.15 - 70 mcg/tube |
Leo Pharma Inc. |
02400995 |
Within Guidelines |
MI-S |
| 94 PICATO 0.5 - 235 mcg/tube |
Leo Pharma Inc. |
02400995 |
Within Guidelines |
MI-S |
| 95 PREZISTA - 800 mg/tablet |
Janssen Inc. |
02393050 |
Subject to Investigation |
SN |
| 96 SEEBRI BREEZHALER - 50 mcg/capsule |
Novartis Pharmaceuticals Canada Inc. |
02394936 |
Within Guidelines |
SN |
| 97 SIGNIFOR - 0.3 mg/ml |
Novartis Pharmaceuticals Canada Inc. |
02413299 |
Within Guidelines |
B |
| 98 SIGNIFOR - 0.6 mg/ml |
Novartis Pharmaceuticals Canada Inc. |
02413302 |
Within Guidelines |
B |
| 99 SIGNIFOR - 0.9 mg/ml |
Novartis Pharmaceuticals Canada Inc. |
02413310 |
Within Guidelines |
B |
| 100 SIMPONI - 100 mg/ml |
Janssen Inc. |
02413183 |
Within Guidelines |
SN |
| 101 SIMPONI - 100 mg/syringe |
Janssen Inc. |
02413175 |
Within Guidelines |
SN |
| 102 STELARA - 90 mg/vial |
Janssen Inc. |
02320681 |
Within Guidelines |
SN |
| 103 STIBILD 150/150/200/300 |
Gilead Sciences Inc. |
02397137 |
Within Guidelines |
SN |
| 104 STIVARGA - 40 mg/tablet |
Bayer Inc |
02403390 |
Within Guidelines |
SN |
| 105 SUBLINOX - 5 mg/tablet |
Meda Valeant Pharma Canada Inc. |
02391678 |
Does Not Trigger Investigation |
SN |
| 106 TAFINLAR - 50 mg/capsule |
GlaxoSmithKline Inc. |
02409607 |
Within Guidelines |
SN |
| 107 TAFINLAR - 75 mg/capsule |
GlaxoSmithKline Inc. |
02409615 |
Within Guidelines |
SN |
| 108 TECFIDERA - 120 mg/capsule |
Biogen Idec Canada Inc. |
02404508 |
Within Guidelines |
SN |
| 109 TEFLARO - 600 mg/vial |
Forest Laboratories Canada Inc. |
|
Within Guidelines |
SN |
| 110 TRETTEN - 15 mg/vial |
Novo Nordisk Canada Inc. |
02389975 |
Within Guidelines |
MI-S |
| 111 TUDORZA GENUAIR - 400 mcg/dose |
Almirall Limited |
02409720 |
Within Guidelines |
SN |
| 112 XEOMIN - 50 unit/vial |
Merz Pharma Canada Ltd. |
02371081 |
Within Guidelines |
SN |
| 113 XERESE 50/10 |
Valeant Canada |
02404044 |
Within Guidelines |
SN |
| 114 YAZ PLUS |
Bayer Inc. |
02387433 |
Within Guidelines |
SN |
| 115 ZAXINE - 500 mg/tablet |
Salix Pharmaceuticals Inc. |
02410702 |
Subject to Investigation |
SN |
Appendix 3: Research and Development
TABLE 21 Range of R&D-to-Sales Ratios by Number of Reporting Companies and Total Sales Revenue
Range:
R&D-to-sales ratio |
Number of reporting companies: 2013 |
Sales revenues:2013
($millions) |
Share:2013(%) |
Number of reporting companies: 2012 |
Sales revenues: 2012($millions) |
Share:2012(%) |
|
* Values in this column may not add to 100.0 due to rounding.
Source: PMPRB
|
| 0% |
33 |
2,744.5 |
16.3 |
32 |
1,596.4 |
9.5 |
| £ 10% |
37 |
13,210.3 |
78.5 |
39 |
11,794.4 |
73.2 |
| > 10% |
11 |
863.1 |
5.1 |
14 |
3,363.6 |
17.3 |
| Total |
81 |
16,817.9 |
100.0* |
85 |
16,754.4 |
100.0 |
FIGURE 21 Current R&D Expenditures by Type of Research, 1988-2013
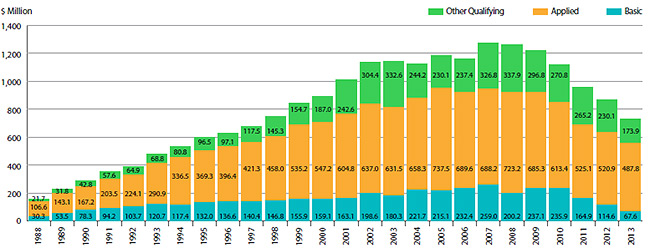
Source: PMPRB
TABLE 22 Ratios of R&D Expenditures to Sales Revenue by Reporting Patentee1, 2013 and 2012
| Company |
R&D-to-sales ratio (%)
2013 |
R&D-to-sales ratio (%)
2012 |
|
1 To avoid double counting of sales revenues, revenues from royalties are included in calculating each company's ratio but not included in calculating industry-wide ratios. Federal and provincial government grants are subtracted from the R&D expenditure in calculating individual R&D-to-sales ratios but are included in calculating industry-wide ratios. Differences between the list of firms filing data on prices and those filing R&D data are due to differences in reporting practices of patentees and their affiliates or licensees. Note as well that some veterinary patentees (i.e., those without revenue from sales of products for human use) are required to file information on R&D expenditure but not price and sales information.
2 Member of Rx&D.
3 Member of BIOTECanada.
4 Spin off of Abbott's proprietary products division into a separate legal entity effective Oct. 31, 2012.
5 Not a patentee in 2012.
6 Formerly known as Fujisawa Canada Inc.
7 Formerly known as Aventis Pasteur Ltd.
8 Formerly known as Aventis Pharma Inc.
9 Formerly known as ICN Canada Ltd.
|
| Abbott Laboratories, Ltd.2,3 |
0.0 |
1.0 |
| AbbVie Corporation2,3,4 |
2.2 |
1.9 |
| Actavis Specialty Pharmaceuticals Co. (Watson Pharma Co.) |
0.0 |
0.0 |
| Actelion Pharmaceutiques Canada Inc.2 |
4.2 |
4.4 |
| Alcon Canada Inc. |
0.1 |
0.1 |
| Alexion Pharmaceuticals Inc.3 |
0.0 |
0.0 |
| Allergan Inc. |
3.8 |
5.3 |
| Almirall Limited2,5 |
59.2 |
– |
| Alveda Pharmaceuticals Inc. |
0.0 |
0.0 |
| Amgen Canada Inc.2,3 |
7.0 |
6.9 |
| Astellas Pharma Canada Inc.2,6 |
3.3 |
5.3 |
| AstraZeneca Canada Inc.2,3 |
1.8 |
1.8 |
| Baxter Corporation3 |
0.4 |
0.2 |
| Bayer Inc., Healthcare Division2 |
4.3 |
4.4 |
| Biogen Idec Canada Inc.3 |
10.3 |
12.5 |
| BioMarin Canada Inc.3 |
19.2 |
52.3 |
| Biovitrum AB |
0.0 |
0.0 |
| Boehringer Ingelheim (Canada) Ltd.2 |
5.8 |
11.3 |
| Bracco Diagnostics Canada Inc. |
0.0 |
0.0 |
| Bristol-Myers Squibb Pharmaceutical Group2,3 |
12.0 |
13.1 |
| Celgene Canada3 |
1.2 |
1.8 |
| CSL Behring Canada Inc. |
0.8 |
0.8 |
| Cubist Pharmaceuticals Canada, Inc. (Optimer Pharmaceuticals Canada Inc.) |
0.0 |
0.0 |
| Duchesnay Inc. |
9.4 |
6.4 |
| Eisai Limited2,3 |
12.3 |
172.5 |
| Eli Lilly Canada Inc. (includes Provel Animal Health Division)2,3 |
9.6 |
10.0 |
| EMD Serono Canada Inc.2 |
5.9 |
7.2 |
| Ferring Inc. |
0.0 |
3.1 |
| Forest Laboratories Canada Inc.2,5 |
149.5 |
– |
| Galderma Canada Inc. |
0.0 |
0.0 |
| Gilead Sciences Inc.2 |
19.5 |
24.6 |
| GlaxoSmithKline Inc.2 |
9.7 |
10.6 |
| Grifols Canada Ltd. (Talecris Biotherapeutics Ltd.)3 |
0.0 |
0.9 |
| Hoffmann-La Roche Ltd. Canada2 |
4.7 |
3.9 |
| Hospira Healthcare Corp. |
0.0 |
0.0 |
| Intermune Canada Inc.2 |
0.0 |
0.0 |
| Correvio (UK) Ltd.3 (Iroko International LP) |
0.0 |
0.0 |
| Janssen Inc.2,3 |
3.1 |
3.3 |
| Johnson & Johnson Inc. |
0.0 |
0.0 |
| Johnson & Johnson Medical Products |
0.0 |
0.8 |
| Lantheus MI Canada Inc. |
0.0 |
0.0 |
| LEO Pharma Inc.2 |
0.9 |
2.1 |
| Lundbeck Canada Inc.2 |
0.3 |
0.7 |
| McNeil Consumer Healthcare Canada |
2.9 |
2.6 |
| Meda Valeant Pharma Canada Ltd.5 |
0.0 |
– |
| Medical Futures Inc. |
0.0 |
0.0 |
| Merck Canada Inc.2,3 |
1.7 |
3.3 |
| Merus Labs5 |
0.0 |
– |
| Merz Pharma Canada Ltd. |
6.6 |
6.5 |
| Novartis Pharmaceuticals Canada Inc.2,3 |
9.4 |
12.6 |
| Novo Nordisk Canada Inc.2,3 |
1.3 |
1.7 |
| Otsuka America Pharmaceuticals2 |
39.1 |
17.4 |
| Paladin Laboratories Inc.2 |
0.0 |
0.02 |
| Pfizer Canada Inc.2,3 |
1.7 |
6.0 |
| Pharmascience Inc. |
9.8 |
8.6 |
| Purdue Pharma2 |
4.9 |
2.4 |
| Ranbaxy Pharmaceuticals Canada Inc. |
0.0 |
0.0 |
| Salix Pharmaceuticals Inc.5 |
130.7 |
– |
| sanofi pasteur Ltd.2,3,7 |
69.7 |
53.4 |
| sanofi-aventis Pharma Inc.2,8 |
3.7 |
5.8 |
| Sandoz Canada Inc. |
0.0 |
1.2 |
| Seattle Genetics Inc. |
6.6 |
14.7 |
| Sunovion (Sepracor Pharmaceuticals Canada Inc.)2 |
0.0 |
0.0 |
| Servier Canada Inc.2 |
4.6 |
5.4 |
| Shire Canada Inc.2 |
0.2 |
0.1 |
| Shire Human Genetic Therapies3 |
1.2 |
2.5 |
| Sigma Tau Pharmaceuticals Inc. |
0.0 |
0.0 |
| Sopherion Therapeutics Canada Inc. |
0.0 |
0.0 |
| Takeda Canada Inc.2,3 |
0.0 |
0.0 |
| Teva Canada Ltd. (Ratiopharm) |
0.0 |
0.0 |
| Teva Canada Innovation GP3 |
0.9 |
2.1 |
| Tribute Pharma Canada Inc. |
0.0 |
0.0 |
| Triton Pharma Inc. |
0.0 |
0.0 |
| Tyco Healthcare Group Canada Inc. |
0.0 |
0.0 |
| UCB Pharma Canada Inc.3 |
7.9 |
9.7 |
| Valeant Canada Ltd.3,9 |
0.0 |
0.0 |
| Vertex Pharma Canada Inc.3 |
21.3 |
26.4 |
| Vetoquinol Canada Inc.5 |
2.8 |
– |
| Vidara Therapeutics Inc.5 |
0.0 |
– |
| VIIV Healthcare ULC.2 |
0.0 |
0.0 |
| Warner Chilcott Canada Inc. |
0.2 |
0.1 |
TABLE 23 Current R&D Expenditures by Province/Territory, 2013
| Province |
Expenditures:
All patentees
($000) |
Regional
share:
(%) |
Expenditures:
Rx&D
($000) |
Regional
share:
(%) |
| Source: PMPRB |
| Newfoundland |
3,775.90 |
0.518 |
3,228.63 |
0.509 |
| Prince Edward Island |
43.65 |
0.006 |
32.01 |
0.005 |
| Nova Scotia |
14,578.32 |
1.999 |
13,801.87 |
2.178 |
| New Brunswick |
1,718.36 |
0.236 |
1,341.37 |
0.212 |
| Quebec |
292,013.44 |
40.041 |
233,405.50 |
36.832 |
| Ontario |
321,955.62 |
44.147 |
293,662.89 |
46.341 |
| Manitoba |
4,525.55 |
0.621 |
3,954.54 |
0.624 |
| Saskatchewan |
1,607.98 |
0.220 |
1,063.21 |
0.168 |
| Alberta |
58,616.21 |
8.037 |
55,555.94 |
8.767 |
| British Columbia |
30,451.30 |
4.175 |
27,651.92 |
4.364 |
| Territories |
0 |
0.000 |
0 |
0.000 |
| Canada |
729,286.33 |
100.0 |
633,697.88 |
100.0 |
TABLE 24 Current R&D Expenditures by Performer and Province/Territory, 2013
| Province |
|
Patentees |
Other companies |
Universities |
Hospitals |
Others |
|
Notes:
- The percentage under each R&D category gives the percentage of all money spent in that category in that province.
- Expenditures as a percentage of total means percentage of R&D expenditures in that province compared to total R&D in Canada.
- Rows and columns may not equal totals due to rounding.
- Current expenditures plus capital expenditures (equipment + depreciation) = total R&D expenditures.
Source: PMPRB
|
| Newfoundland |
$000 |
682.43 |
1,908.41 |
444.31 |
104.36 |
636.39 |
| % |
18.1 |
50.5 |
11.8 |
2.8 |
16.8 |
| Prince Edward Island |
$000 |
0.0 |
11.64 |
0.0 |
5.94 |
26.07 |
| % |
0.0 |
26.7 |
0.0 |
13.6 |
59.7 |
| Nova Scotia |
$000 |
1,070.79 |
3,310.91 |
6,074.00 |
2,254.95 |
1,867.66 |
| % |
7.3 |
22.7 |
41.7 |
15.5 |
12.8 |
| New Brunswick |
$000 |
115.33 |
837.68 |
0.0 |
337.63 |
427.71 |
| % |
6.7 |
48.7 |
0.0 |
19.6 |
24.9 |
| Quebec |
$000 |
135,074.27 |
92,742.32 |
11,585.75 |
14,314.87 |
38,296.23 |
| % |
46.3 |
31.7 |
3.9 |
4.9 |
13.1 |
| Ontario |
$000 |
172,685.52 |
70,194.20 |
13,834.96 |
34,498.05 |
30,742.89 |
| % |
53.6 |
21.8 |
4.3 |
10.7 |
9.5 |
| Manitoba |
$000 |
794.80 |
1,601.49 |
170.04 |
1,110.99 |
848.22 |
| % |
17.6 |
35.4 |
3.8 |
24.5 |
18.7 |
| Saskatchewan |
$000 |
95.68 |
1,051.49 |
213.48 |
133.79 |
113.54 |
| % |
6.0 |
65.4 |
13.3 |
8.3 |
7.1 |
| Alberta |
$000 |
41,799.62 |
7,231.48 |
2,722.01 |
3,156.34 |
3,706.76 |
| % |
71.3 |
12.3 |
4.6 |
5.4 |
6.3 |
| British Columbia |
$000 |
12,511.04 |
8,504.75 |
699.69 |
3,065.09 |
5,670.73 |
| % |
41.1 |
27.9 |
2.3 |
10.1 |
18.6 |
| Territories |
$000 |
0.0 |
0.0 |
0.0 |
0.0 |
0.0 |
| % |
0.0 |
0.0 |
0.0 |
0.0 |
0.0 |
| Canada |
$000 |
364,829.49 |
187,394.38 |
35,744.23 |
58,982.01 |
82,336.18 |
| % |
50.0 |
25.7 |
4.9 |
8.1 |
11.3 |
End Notes
1 All statistical results for patented drug products reported in this chapter are based on data submitted by patentees as of April 2014. On occasion, patentees report revisions to previously submitted data or provide data not previously submitted. New data of this sort can appreciably affect the statistics in this chapter. To account for this possibility, the PMPRB has adopted the practice of reporting recalculated sales figures (see Trends in Sales of Patented Drug Products), price and quantity indices (see Price Trends and Utilization of Patented Drug Products) and foreign-to-Canadian price ratios (see Comparison of Canadian Prices to Foreign Prices) for the five years preceding the current Annual Report year. All such recalculated values reflect currently available data. Consequently, where data revisions have occurred, values reported here may differ from those presented in earlier Annual Reports.
2 Although based in part on data obtained under license from the MIDAS IMS database, the statements, findings, conclusions, views and opinions expressed in this Annual Report are exclusively those of the PMPRB and are not attributable to IMS AG.
3 Under the scheme applied here, the “exiting drug effect” is the amount of 2013 sales generated by drug products that were under the PMPRB's jurisdiction in 2012 but not in 2013. The “new drug effect” is the amount of 2013 sales generated by drug products that were under the PMPRB's jurisdiction in 2013 but not in 2012. Other effects are derived by means of the relationship:
S p2013(i) q2013(i) - S p2012(i) q2012(i) = S [p2013 (i) - p2012(i)]q2012 (i) + S p2012 (i) [q2013 (i) - q2012 (i)] + S [p2013 (i) - p2012(i)] [q2013(i) - q2012(i)]
py(i) is the price of drug i in year y, qy(i) is the physical volume of drug i sold in year y and S signifies summation over the set of drug products that were under the PMPRB's jurisdiction in both 2012 and 2013. The left-hand side of this equation represents the change in total sales of such products between 2012 and 2013. The three terms of the right-hand side define the volume, price and cross effects, respectively, reported in Table 8.
4 This is obtained as the ratio of the year-over-year change in the dollar value of sales for the therapeutic class in question to the change in sales across all patented drug products.
5 These calculations are performed at the level defined by Health Canada's Drug Identification Number (DIN). Each DIN represents a unique combination of active ingredient(s), dosage form, strength(s), brand and manufacturer.
6 It is possible for individual prices (or, for that matter, the PMPI) to rise by more than the CPI in a given year. This can occur when patentees have banked price adjustments in the preceding years. It can also occur when the forecast rate of CPI inflation exceeds the actual rate.
7 Suppose R represents the overall rate of change in the PMPI and there are N therapeutic classes, indexed by 1, 2 … N. Let R(i) represent the average rate of price change in major therapeutic class i obtained by means of the PMPI methodology. Using the fact that R is a sales-weighted average of price changes taken over all patented drug products, it is easy to derive the following relationship:
R = w(1) x R(1) + w(2) x R(2) + … + w(N) x R(N)
where w(i) represents the share of therapeutic class i in the sales of patented drug products. This relationship provides the basis for the decomposition in the last column of Table 10. Each term on its right-hand-side multiplies the average rate of price change for a given therapeutic class by its share of overall sales. The resulting value is readily interpreted as the contribution of the corresponding class to the change in the overall PMPI. Note that the size of this contribution depends on both the rate of price change specific to the class and its relative importance, as measured by its share of sales.
The decomposition in Table 10 is approximate. This is because the weights used to calculate the contribution of each therapeutic class are based on annual sales data, whereas rates of price change (whether overall or by therapeutic class) are calculated from data covering six-month reporting periods. The resulting discrepancy is normally small.
8 Sales of patented drug products are dominated by sales to wholesalers, which accounted for 79.3% of all sales in 2013. Sales to hospitals accounted for another 7.7%, while direct sales to pharmacies accounted for 5.1%. The pharmacy share has fallen precipitously since 2001, when it stood at 20.1%.
9 Results for a fourth class of customer, “Others”, are not provided. This class accounted for about 7.9% of patented drug sales in 2013. Buyers in this class are principally health care institutions other than hospitals, such as clinics and nursing homes. It also includes direct sales to governments. The composition of this class is thought to vary substantially from one year to the next, rendering any analysis of price change in this class of limited value.
10 It must be emphasized that this statement refers to the behaviour of prices on average. There may be instances where individual prices have risen or fallen substantially since introduction.
11 The pharmaceutical industry in the US has argued that the publicly available prices in that country do not reflect actual prices because of confidential discounts and rebates. Effective January 2000, and following public consultation, the PMPRB began including prices listed in the US Federal Supply Schedule (FSS) in calculating the average US price of patented drug products. The FSS prices are negotiated between manufacturers and the US Department of Veterans' Affairs. They are typically less than other publicly available US prices reported to the PMPRB by patentees.
12 The number of drug products and sales these ratios encompass vary because it is not always possible to find a matching foreign price for each patented drug product sold in Canada. Note that all of the bilateral average price ratios reported in Table 11 combined represent at least 80% of 2013 Canadian sales, while the multilateral ratios in Table 12 cover over 98%.
13 To produce the results represented in this figure, foreign prices were converted to their Canadian-dollar equivalents at market exchange rates.
14 Most of the statistical results presented in this section are based on sales data from MIDAS©, 2005–2013, IMS Health Incorporated or its affiliates. All rights reserved.16 These data cover the pharmacy and hospital sectors.
15 The results given in Figures 13 through 16 are based on estimates of ex-factory sales revenues encompassing patented, non-patented branded and generic drug products. These estimates have been converted to Canadian dollar equivalents at annual average market exchange rates. Fluctuations in these rates can substantially influence these shares.
16 Although based in part on data obtained under license from the MIDAS IMS database, the statements, findings, conclusions, views and opinions expressed in this Annual Report are exclusively those of the PMPRB and are not attributable to IMS AG.
17 Comparisons made on this basis will reflect international differences in prices, overall utilization and patterns of therapeutic choice, as well as differences in national income.
18 Note that the data used to produce Table 15 encompass patented, non-patented branded and generic drug products. Hence, the results reported here for Canada are not directly comparable to those reported in Table 9, which encompass only patented drug products.
19 This is likely the situation for much of Canada's biotechnology sector. Note, however, that if a patentee commissions research from another company specializing in biotechnology research, the patentee should normally include this among the research expenditures that it reports to the PMPRB.
20 Budget 2012 proposed reductions to the Scientific Research and Experimental Development (SR&ED) tax credit and new restrictions on deductions. It also introduced new measures to support innovation and R&D. As per the Regulations, the PMPRB defines R&D based on the 1987 SR&ED definition.
21 As published in the Regulatory Impact Assessment Statement (RIAS) of the Patented Medicines Regulations, 1988, published in the Canada Gazette, Part II, Vol. 122, No. 20 – SOR/DORS/88-474.
22 The R&D-to-sales ratios presented in Table 16 include research expenditures funded by government grants. If the governmentfunded component is excluded, the ratios for all patentees and for the members of Rx&D in 2013 are 4.4% and 5.3%, respectively.
23 Current R&D expenditures consist of non-capital expenses directly related to research, including (a) wages and salaries; (b) direct material; (c) contractors and sub-contractors; (d) other direct costs such as factory overhead; (e) payments to designated institutions; (f) payments to granting councils; and (g) payments to other organizations. These elements are described in more detail in Form 3 (Revenues and Research and Development Expenditures) available from the PMPRB website. Current R&D expenditures accounted for 96.8% of total R&D expenditure in 2013, while capital equipment costs and allowable depreciation expenses made up 1.7% and 1.4%, respectively.
24 “Basic research” is defined as work that advances scientific knowledge without a specific application in mind. “Applied research” is directed toward a specific practical application, comprising research intended to improve manufacturing processes, pre-clinical trials and clinical trials. “Other qualifying research” includes drug regulation submissions, bioavailability studies and Phase IV clinical trials.
25 Sales in Figure 20 represent domestic sales and do not include exports.