The Impact of Generic Entry on the Utilization of the Ingredient
ISBN: 978-1-100-19411-0
Cat. No.: H82-10/2011E-PDF
September 2011 - (Revised May 2012)
Revision: The Impact of Generic Entry on the Utilization of the Ingredient
May 7, 2012
Note that we have revised the NPDUIS analytical study entitled The Impact of Generic Entry on the Utilization of the Ingredient originally posted on the PMPRB website on September 30, 2011.
The revised version of this paper contains an enhanced Methodology section that provides readers with a more detailed description of the projection methods used in the short-term analysis. This includes an overview of the rationale for the choice of projection (e.g., a linear, logarithmic, power, exponential or polynomial-based forecast). To further clarify the results, a footnote has been added to all the short-term projection charts to identify the projection method employed.
In addition, all data were thoroughly reexamined, and some minor discrepancies were corrected in the following figures:
- Figure 3.1 Pravastatin – Number of Claims by Jurisdiction (number of claims for Manitoba revised)
- Figure 4.1 Simvastatin – Number of Claims by Jurisdiction (projection for Nova Scotia revised)
- Figure 5.2 Citalopram – Number of Claims by Jurisdiction (projection for Alberta revised)
- Figure 6.1 Gabapentin – Number of Claims by Jurisdiction (number of claims and projection for Manitoba revised)
- Figure 6.2 Gabapentin – Actual Market Shares Variation from Projected (Claims) (projection for Manitoba revised)
In these cases, corresponding information was updated in the body of the text. None of these changes had an impact on the overall results of the study.
We hope that these enhancements will add value to the information contained in the report and further clarify the results for our readership.
Executive Summary
Introduction
Over the past decade a number of blockbuster drugs have lost their patent protection, allowing for the introduction of lower cost generic versions on the pharmaceutical market. Because of public drug plan policies governing the interchangeability between brand and generic versions of a drug product, a near-complete generic substitution often occurs within the first few months of a generic drug product's availability. While the effect of generic price discounts is well understood, the purpose of this study is to identify the impact that generic entry has on the utilization of the ingredient itself.
This study identifies the impact of generic entry on seven top-selling drugs that have lost their patent protection in recent years. The analysis incorporates data from eight public drug plans to determine whether the ingredient continues to be utilized to the same extent, thus allowing for cost savings levels commensurate with the generic price discount.
Methodology
This report employs a case-study approach to analyze the impact of generic competition on the utilization of the ingredient. It assesses the immediate and long-term impact of generic entry on a target list of seven top-selling drugs with various therapeutic profiles. The immediate impact analysis reports monthly trends in utilization over the 12-month period prior to and post generic entry. The long-term impact analysis assesses fiscal-year trends in utilization over the three years prior to and post generic entry, depending on the data availablility.
The utilization reported in this study encompasses both the brand name and generic utilization at the ingredient level. An analysis of the trends in utilization, in terms of the volume of claims and their market share, identifies any break in the pattern following generic entry. A projection of the utilization trends in the absence of generic competition compares extrapolated data to the actual utilization rates.
General Findings
Findings Generally, the utilization of the ingredient was not impacted by generic entry. Post generic entry, the utilization of the ingredient followed the trend established by the brand name product prior to generic entry. In most cases, any short- or long-term changes in utilization could not be directly and solely attributable to generic entry:
- In the case of gabapentin, pravastatin, risperidone and citalopram, the number of claims and market share following generic entry continued the trend established by the brand name under market exclusivity.
- In the case of omeprazole, changes in utilization occurred in almost all of the jurisdictions following generic entry; however, this was likely the result of drug plan policy changes.
- In the case of simvastatin, the decline in utilization corresponded to both the introduction of a generic version and the launch of a new competitor drug in the same class. Thus, it is difficult to attribute the change to one specific event.
Paroxetine was the only exception. The utilization of the antidepressant dropped significantly across all jurisdictions approximately one year after generic entry. Around this time, Health Canada issued warnings related to the possible negative side effects of using any of the drugs in the same class. However, none of the other ingredients were affected to the same extent as paroxetine, including citalopram, which also lost its patent protection and faced generic competition during the same time period.
Implications for Public Drug Plans
The main implication of the findings is that the only savings that can be expected from generic entry are those related to the generic price discount. Nevertheless, it should be recognized that over time these savings may be eroded by utilization growth; growth that would occur in the presence or absence of generic competition.
Limitations
While this study was conducted on a small sample of top-selling drug products utilized in public drug plans, it covers various therapeutic profiles, market conditions (price differential, number and type of competitors) and formulary statuses. Therefore, the findings could be applicable to other drug products facing generic competition.
Nevertheless, the findings may not apply to all drug products, as utilization can be affected by a number of factors, including reimbursement policies, pricing, demographics, physician prescribing practices, and the incidence of a particular condition. In addition, public drug plan data represents only one component of the overall pharmaceutical market. Results may differ for drugs reimbursed by private insurers or drugs paid for out-of-pocket by patients.
This analysis is limited to the impact of generic entry on the utilization of the ingredient in public drug plans and does not assess the cost implications of the generic entry impact on drug plan expenditures.
Table Of Contents
- Introduction
- Methodology
- Analysis: Omeprazole
- Analysis: Risperidone
- Analysis: Pravastatin
- Analysis: Simvastatin
- Analysis: Paroxetine and Citalopram
- Analysis: Gabapentin
- General Findings
Introduction
Over the past decade a number of top-selling prescription drug products used to treat high-prevalence conditions have lost their patent protection. The subsequent introduction of lower-priced generic drug products1 has translated into savings for public drug plans, private insurers and patients.
As a result of public drug plan policies governing the interchangeability between brand name and generic versions of a drug, a near-complete generic substitution often occurs shortly after the introduction of the generic. While the cost savings resulting from such a substitution are well understood, the purpose of this study is to identify the impact of generic entry on the utilization of the ingredient. Two hypotheses are proposed: on the one hand, the availability of a drug product at a lower price may lead to increased utilization; on the other hand, diminished advertising may decrease the utilization of a particular drug, as brand-name manufacturers generally cease to advertise once they lose market exclusivity and begin the promotion of a substitute product.
Given the number of blockbuster drugs that have either lost patent protection in recent years or are expected to come to the end of their patent life in the near future, the impact of generic competition on the utilization of the ingredient (brand and generic) is of interest to policy makers and drug plan managers.
This study identifies the impact of generic entry on the utilization of the ingredient in the case of seven top-selling drugs that have lost patent protection in recent years. The analysis was conducted using available data for eight public drug plans. The focus of the study is on utilization at the ingredient level, encompassing both the brand name and generic versions of each drug product. The ingredient's utilization is analyzed in the context of its relevant market, which includes medications prescribed for the same indication.
The next section of this report details the methodology employed. The following analysis section is organized in six subsections corresponding to each of the drugs reviewed. Subsection 5 analyzes two drugs conjointly: paroxetine and citalopram. These drugs share the anti-depressants market, and generic versions of both were released within months of each other. Each subsection includes a market profile and a short- and a long-term analysis. The general findings are provided in the final section of the report.
This study is restricted to the utilization of the ingredient and does not make any assessment on the cost implications of generic entry on drug plan expenditures.
1 Generic drug in this study refers to any drug for which the trade name contains the name of the active ingredient, irrespective of whether the drug is a licensed generic or has any patent protection.
Methodology
Target Drugs
This study focuses on public drug plan data using a case-study approach. A target list of seven drugs with various therapeutic profiles was established in consultation with the NPDUIS Steering Committee (see Methodology Table—Target Drug List). The drugs were selected from top-selling single-source drugs with first time generics entering the market between 2000 and 2006.
Short- versus Long-Term Impact Assessment
An analysis of both the short- and long-term impact of generic entry was conducted, providing a complete impact assessment.
The short-term impact of generic entry was assessed by analyzing monthly trends in utilization. For consistency, the reporting was based on the 12-month period prior to and post generic entry. The analysis was conducted on six public drug plans based on the availability of claims-level data in the Canadian Institute for Health Information (CIHI) NPDUIS database: Alberta, Saskatchewan, Manitoba, New Brunswick, Nova Scotia and Prince Edward Island. Claims-level data refers to data in which each record is related to a single claim made to an insurer for reimbursement by an individual.
The long-term impact was assessed by analyzing fiscal-year trends in utilization. For consistency, the reporting was based on up to a three-year period prior to and post generic entry, depending on the data availability. In addition to the data available from the six jurisdictions included in the short-term analysis, DIN-level2 data provided by Ontario and British Columbia were used to assess long-term impacts.
Target drug list
| Drug |
Market |
| Omeprazole (Losec) |
Proton pump inhibitors |
| Risperidone (Risperidal) |
Antipsychotics for the treatment of schizophrenia |
| Simvastatin (Zocor) |
HMG CoA reductase inhibitors |
| Pravastatin (Pravacol) |
HMG CoA reductase inhibitors |
| Citalopram (Celexa) |
Selective serotonin reuptake inhibitors |
| Paroxetine (Paxil) |
Selective serotonin reuptake inhibitors |
| Gabapentin (Neurontin) |
Treatments for neuropathic pain |
Data Sources
Cost and utilization data for this study came from two sources: the NPDUIS claims-level database housed within CIHI; and the NPDUIS aggregate DIN-level database housed within the PMPRB. Both databases contain administrative data from various provincial drug plans. The data is based on prescriptions dispensed and accepted as claims by public drug programs, either for reimbursement or toward a plan deductible. It is not known whether drugs were utilized as dispensed. The administrative drug plan data analyzed does not capture information on prescriptions dispensed but not claimed under the drug plan, or claimed but not approved.
Size-standardized Claims
The analysis was conducted at the ingredient level, and the utilization reported in this study encompasses both brand name and generic utilization. Utilization refers to the number of claims reimbursed by the public drug program, standardized by quantity to account for changes in claim size that might have occurred over time or for differences in the claim size between the brand name and generic versions. The utilization patterns were analyzed in terms of both the volume and the market share of the size-standardized claims.
Normalizing time of generic entry
Normalized Timing of Generic Entry
For the purpose of this study, generic entry time was determined at the drug plan level and refers to the time when notable utilization of the generic version occurred in each public drug plan. The time refers to a month in the case of the short-term impact assessment and a fiscal year in the case of the long-term impact assessment. Given that the timing of generic entry differed across jurisdictions, it was normalized to zero (month zero or fiscal year zero).
The time periods prior to generic entry were assigned negative sequential values (-1, -2, etc.), and the time periods post generic entry were assigned positive sequential values (1, 2, etc.).
Short-term Projections
The trends in utilization prior to and post generic entry were analyzed to identify any break in the trend following generic entry. Projections of utilization patterns in the absence of generic competition were made and compared to the actual utilization patterns.
In the analysis of short-term utilization trends, projections were generally based on the 12-month period prior to generic entry. However, in cases for which the 12-month period was insufficient to reflect overall trends in utilization, up to 24 months of data were considered to ensure accuracy.
Projections were done on a case-by-case basis. Depending on the nature of the observed trend in utilization prior to generic entry, various methods were used to develop these projections, including linear, logarithmic, power, exponential and polynomial based forecasts. In most cases the observed trends were linear. This was particularly the case for the market-share analysis. While some variations from the linear progression were observed, generally they were not significant enough to require an alternate to the linear model-based forecast. There were exceptions however. Non-linear trending was used to project utilization following generic entry in the following three cases, taking into consideration the coefficient of determination:
Case 1. Reductions in market shares that exhibited a convex curvature prior to generic entry. The linear function was found to underestimate the market shares.
Case 2. Markets that exhibited seasonality, with a steep yearly uptake, and a correction in the beginning of the subsequent year. Moreover, the slope of the yearly trend diminished, suggesting a reduction in the rate at which the market was growing. By taking into account multiple years of data, it was found that the use of a simple linear function based on a 12-month period would fail to account for the correction in seasonality.
Case 3. Limited and fluctuating observations prior to generic entry.
The specific projection methods use for each drug and jurisdiction are detailed in a footnote to each graph. If the linear method was not employed, an explanation is provided.
Ingredient Utilization Index
Given the significant differences in drug utilization across jurisdictions, to facilitate the presentation of the data for the long-term analysis, utilization rates were indexed. Since the first year for which jurisdictional data was available is indexed to one, year-over-year changes reported in the charts effectively represent percent change over the base year. Zero represents the year of generic entry.
Reporting
In the interests of reporting consistency, the Short-term Analysis reported periods of 12-month prior to and post generic entry, while the Long-term Analysis reported up to 3 years of prior and post generic entry, data permitting.
Limitations
The analysis was performed using data from Canada's public drug plans, which have specific reimbursement policies, pricing, demographics, physician prescribing practices, and incidence of a particular condition. Furthermore, public drug plan data represents only one component of the overall pharmaceutical market. Therefore, these results should not be extrapolated to the overall Canadian marketplace, as the impact may be different in markets reimbursed by private insurers or drugs paid for out-of-pocket by patients.
This study is purely a drug utilization analysis that assesses the impact of the generic entry on the utilization of the ingredient in public drug plans. The study does not make any assessment on the cost implications of generic entry impact on drug plan expenditures.
2 A Drug Identification Number (DIN) is a computer-generated eight digit number assigned by Health Canada to a drug product prior to being marketed in Canada. It uniquely identifies all drug products sold in a dosage form in Canada.
Analysis: Omeprazole
1 Omeprazole
Omeprazole is a proton pump inhibitor (PPI) prescribed to reduce the secretion of gastric acids (i.e., for gastroesophageal reflux disease, peptic ulcer)3. In the case of omeprazole, the first generic drug product to enter the market had a different formulation (capsule) than the brand-name Losec (tablet) and contained a different salt. These differences had an impact on the interchangeability status across jurisdictions, and thus, on the uptake of the generic version. Omeprazole utilization was assessed in the context of its relevant market, which includes esomperazole, lansoprazole, pantoprazole and rabeprazole. Since data was not available for all jurisdictions, the analysis in this section is limited to British Columbia, Alberta, Saskatchewan, Manitoba, Ontario, New Brunswick and Nova Scotia.
1.1 Market Profile
Public drug plans began receiving claims for generic omperazole in 2004 (Table 1.1). While omperazole was the dominant drug in the market at that time, its share had been declining prior to generic entry, losing ground in all jurisdictions to either pantoprazole or rabeprazole. Notwithstanding the differences between the brand-name and generic omeprazole, a number of jurisdictions chose to list the generic as interchangeable with the brand name, including Ontario, Manitoba and Alberta. However, even in this case, the uptake in the first year varied significantly, from 96.0% in Alberta to 22.4% in Ontario (see Table 1.1). In Saskatchewan, where generic omeprazole was not interchangeable with the brand name, the generic uptake was 61.8%.4
The market composition for PPIs is indicated in Table 1.2 along with the formulary status across jurisdictions around the time of generic entry. Except for Alberta, PPIs were available on a restricted basis.
Omeprazole was the first drug in its market to face generic competition. Its branded cost per unit of $2.29 (in the 12-month period prior to generic entry) was just slightly higher than the other brands in its class, except for rabeprazole, which was priced significantly below its competitors (Table 1.3). With an average cost per unit of $1.32 (standardized for changes in utilization strength), generic omperazole offered a 42% discount over the brand-name price.
Table 1.1. Omeprazole market profile—Jurisdictional variations
| Jurisdiction |
BC |
AB |
SK |
MB |
ON |
NB |
NS |
| Timing of generic entry* |
2004** |
June 2006 |
Oct. 2004 |
June 2004 |
July 2004 |
Feb. 2004 |
May 2004 |
| Market share & trend in claims 12 months prior to generic entry |
26.1% Large decrease |
42.1% Slight decrease |
35.0% Constant |
63.7% Slight increase |
43.0% Moderate increase |
58.5% Slight increase |
43.7% Large decrease |
| Generic share of ingredient 12 months post generic entry |
71.6% |
96.0% |
61.8% |
88.0% |
22.4% |
10.9% |
25.4% |
* Determined at the jurisdictional level and refers to the time of notable generic utilization.
** The generic entry month is unknown. Data is limited to the yearly aggregate level.
Table 1.2. Formulary status for drugs in the relevant market 12 months prior to and post generic entry
Table 1.3. Average cost per unit for drugs in the market, selected jurisdictions†
* 12 months prior to generic entry ** 12 months post generic entry
† Alberta, Saskatchewan, Manitoba, New Brunswick, Nova Scotia and Prince Edward Island
1.2 Results
The impact of generic entry was assessed in terms of both the volume of size-standardized claims and market share.
Short-Term Analysis: Figure 1.1 reports the volume of claims by jurisdiction over the 12-month period prior to and post generic entry. Actual and projected amounts are compared for the 12-month period following generic entry. The results indicate that, with the exception of Nova Scotia, the entry of the generic version had no immediate notable impact on the utilization of the ingredient. Prior to generic entry, the utilization rates of omeprazole in all jurisdictions except Nova Scotia were either flat or growing slightly. This trend continued once the generic version arrived on the market. In Nova Scotia, the downward trend was the result of the slow erosion of omeprazole's market share caused by the introduction of rabeprazole a year earlier.
Figure 1.2 shows the extent to which the actual market share for omeprazole varied from the projected amount. In all jurisdictions except Nova Scotia, the variations are minimal and inconsistent (within +/- 2%). This supports the conclusion drawn from the volume of claims analysis: generally generic entry did not have an immediate impact on the utilization of omeprazole.
In Nova Scotia, where the generic omeprazole was not listed as interchangeable with the brand name version, the introduction of the generic increased the utilization of the ingredient. Figure 1.3 reports on the number of claims for omeprazole over the 12-month period prior to and post generic entry. The results show that the brand-name version continued to follow the trend established 2 years before generic entry and that all of the increase in overall utilization occurred because of the addition of the generic. During this period, the generic was effectively retaking the market share back from rabeprazole. Nova Scotia eventually granted generic omeprazole full interchangeability status in May 2006, 2 years after adding it to their formulary. This resulted in the sharp generic uptake in month 24, as seen in Figure 1.3.
Following generic entry, the utilization of omeprazole expanded in Nova Scotia by an estimated 7% in the first fiscal year. This increase coincided with a change in the drug plan design that effectively expanded benefit eligibility to a larger population.
Figure 1.1. Omeprazole – Number of claims by jurisdiction*
* Projections are based on a linear function for all jurisdictions except Manitoba. The historical 24-month trend in utilization in this jurisdiction exhibits sizable annual variations and diminishing yearly uptake. It was found that the use of a simple linear function would fail to account for the correction in seasonality. Both the logarithmic and the power functions yielded similar projections, with higher values for the coefficient of determination than the linear function. The logarithmic projection is reported for Manitoba.
Figure 1.2. Omeprazole – Actual market shares variation from projected (claims)*
* Projections are based on a linear function for all jurisdictions except Alberta and Nova Scotia. While in both cases the historical trend was slightly convex, the polynomial function was a better fit in Alberta and the exponential projection was a better fit in Nova Scotia, based on the coefficient of determination.
Figure 1.3. Omeprazole – Number of claims in Nova Scotia: Brand vs. generic*
* The projection is based on a linear function over a 19-month period that exhibited a consistent trend.
Long-Term Analysis: Figure 1.4 reports the volume of claims over the 3-year period prior to and post generic entry, indexed for the first year that jurisdictional data was available. Zero represents the year of generic entry.
On the surface, the long-term trends represented in Figure 1.4 appear to suggest that there may have been some impact on utilization in all of the jurisdictions except Alberta. While utilization appears to be declining across most of the jurisdictions, both Saskatchewan and Nova Scotia seem to experience a marked growth following generic entry. However, a more detailed review of the data, as well as the drug plan policies of the various jurisdictions, shows that in fact the changes in omeprazole'sutilization in at least British Columbia, Saskatchewan and Nova Scotia were the result of drug plan changes rather than simply the entry of the generic.
In British Columbia, drug plan design changes took effect in 2002, and in 2003 Fair Pharmacare was implemented along with a policy change favouring the use of rabeprazole. All these changes contributed to the sharp drop in omeprazole'suse. Similarly, the drug plan in Saskatchewan, while not promoting omeprazole'sbrand/generic interchangeability, implemented a reimbursement policy that encouraged patients to switch to either the generic version of Apo-omeprazole or rabeprazole. Finally in the case of Nova Scotia, the expansion of benefits among its senior population coincided with the generic entry.
The long-term decline in omeprazole's utilization seen in the remaining jurisdictions, Manitoba, Ontario and New Brunswick, is difficult to interpret. While there is no clear explanation for the decline in New Brunswick, given that the change occurs two years following generic entry lessens the chance that this would be the cause. In the cases of Manitoba and Ontario, the decline in the utilization growth appears to coincide with generic entry. However, a closer analysis of the data suggests that, while the end of patent protection may have had an impact, the declining growth in utilization began well before and may be indicative of a maturing market.
Figure 1.4. Omeprazole – Ingredient utilization index
1.3 Conclusion
While the data suggests that changes in the utilization of omeprazole occurred in almost all the jurisdictions following generic entry, a more detailed review of the market for PPIs shows that these changes were the result of other factors. In most cases, changes to the drug plan design and reimbursement policy appear to have been the primary cause. While loss of omeprazole's patent protection may have had some impact on the utilization of the ingredient in Manitoba, Ontario and New Brunswick, the evidence suggests that these were maturing markets, making it difficult to attribute the decline in utilization solely to generic entry.
Of all the markets analyzed, the most interesting was that of Nova Scotia. As shown, the generic version arrived on the market as if it were a new competitor, drawing market share away from other PPIs, in particular rabeprazole. Because it was not listed as interchangeable, the introduction of the generic had almost no impact on the utilization trend of the original branded product until 2006 when its status changed.
3 Canadian Pharmacists Association, Compendium of Pharmaceuticals and Specialties (CPS), 2009.
4 It should be noted that while Saskatchewan's formulary did not list generic omeprazole as being interchangeable with the brand-name version, the drug plan's MAC policy favoured the use of the generic, Apo-omeprazole, and rabeprazole. Apo-Omeprazole was essentially treated as if it was a unique product.
Analysis: Risperidone
2 Risperidone
Risperidone is an anti-psychotic drug prescribed in the treatment of schizophrenia, the management of inappropriate behavior related to severe dementia and the management of manic episodes associated with bipolar disorder5. Risperidone utilization was assessed in the context of its relevant market, which includes the anti-psychotic medications clozapine, loxapine, olanzapine and quetiapine.
2.1 Market Profile
Public drug plans began receiving claims for generic risperidone in the summer and fall of 2006 (Table 2.1), with a near-complete generic substitution occurring shortly after. While risperidone was the dominant drug in the market at that time, its market share was stagnant or slightly decreasing.
The market composition for anti-psychotic drugs used in the treatment of schizophrenia is indicated in Table 2.2 along with the formulary status across jurisdictions around the time of generic entry. Risperidone was available as an unrestricted benefit during this period in all jurisdictions except Prince Edward Island, which extended benefit status just following the arrival of the generic on the market.
At the time of the generic risperidone's arrival, only the two least utilized drugs in the market had generic versions (clozapine and loxapine). The patents for the remaining drugs, olanzapine and quetiapine, expired in 2007 and 2008, respectively. With an average cost per unit of $0.71 (standardized for changes in utilization strength), generic risperidone offered a 41% discount over the name-brand price (Table 2.3).
Table 2.1. Risperidone market profile – Jurisdictional variations
* Determined at the jurisdictional level and refers to the time of notable generic utilization.
** The generic entry month is unknown. Data is limited to the yearly aggregate level.
Table 2.2. Formulary status for drugs in the relevant market 12 months prior to and post generic entry
Table 2.3. Average cost per unit for drugs in the market, selected jurisdictions†
* 12 months prior to generic entry ** 12 months post generic entry
† Alberta, Saskatchewan, Manitoba, New Brunswick, Nova Scotia and Prince Edward Island
2.2 Results
The impact of generic entry was assessed in terms of both the volume of size-standardized claims and market share.
Short-term Analysis: Figure 2.1 reports the volume of claims by jurisdiction over the 12-month period prior to and post generic entry. Actual and projected amounts are compared for the 12-month period following generic entry. The results indicate that the entry of the generic version had no notable impact on the utilization of the ingredient.
The Figure 2.2 shows the extent to which the actual market share for risperidone varied from the projected amount. For most jurisdictions the variations are minimal and inconsistent (within +/- 2%), although in the case of Nova Scotia and Prince Edward Island, there is marked yet contrasting variation, suggesting a positive impact (market share increase) and negative impact (market share decrease), respectively.
Figure 2.1. Risperidone – Number of claims by jurisdiction*
*Projections are based on the linear function.
Figure 2.2. Risperidone – Actual market shares variation from projected (claims)*
*Projections are based on the linear function.
Nevertheless, the trend in the volume of claims for risperidone in these jurisdictions was virtually unchanged. The variations in the market share are explained by the changes in the utilization patterns of other drugs in the same therapeutic class, in particular quetiapine. In Nova Scotia, for instance, both the number of claims for quetiapine and its market share grew at a fast pace prior to arrival of generic risperidone, after which it slowed somewhat. Conversely, in Prince Edward Island, the number of claims (and market share) for both quetiapine and olanzapine continued to increase, while the number of claims for risperidone remained relatively unchanged.
Long-term Analysis: The long-term analysis in the case of risperidone is limited by data availability. Figure 2.3 reports the volume of claims over a three year period prior to generic entry and a one year period post generic entry, indexed for the first year that jurisdictional data was available. Zero represents the year of generic entry.
The results for the year following the generic entry seem to confirm the observations made in the short-term analysis, namely, that the utilization of risperidone has not been impacted by generic entry.
Figure 2.3. Risperidone – Ingredient utilization index
2.3 Conclusion
The analysis of utilization patterns across the jurisdictions indicates that the utilization of risperidone has not been impacted by generic entry. The isolated variations cannot be attributed explicitly to risperidone generic entry.
5 Canadian Pharmacists Association, Compendium of Pharmaceuticals and Specialties (CPS), 2009.
Analysis: Pravastatin
3 Pravastatin
Pravastatin is a HMG CoA reductase inhibitor (statin) used to control hypercholesterolemia (elevated cholesterol levels) and in the prevention of cardiovascular disease6. Pravastatin utilization was assessed in the context of its relevant market, which includes the other statins: atorvastatin, cerivastatin, fluvastatin, lovastatin and simvastatin. Since data was not available for all jurisdictions, the analysis in this section is limited to British Columbia, Alberta, Saskatchewan, Manitoba, Ontario and New Brunswick.
3.1 Market Profile
Public drug plans began receiving claims for generic pravastatin in late 2000 and early 2001 (Table 3.1), with a near-complete generic substitution occurring shortly after. When the generic arrived on the market, pravastatin was already losing its market share to atorvastatin, the market leader, and to a lesser extent, to simvastatin.
The market composition for statins is listed in Table 3.2 along with the formulary status across jurisdictions around the time the generic entry. In all of the jurisdictions analyzed, except New Brunswick and Saskatchewan, statins were available on an unrestricted basis. The status in Saskatchewan changed to unrestricted in January 2001.
Pravastatin was the second statin to face generic competition after lovastatin. Its branded cost per unit of $1.87 (in the 12-month period prior to generic entry) was the second highest on the market (Table 3.3). With an average cost per unit of $1.31 (standardized for changes in utilization strength), generic pravastatin offered a 30% discount over the branded price.
Table 3.1. Pravastatin market profile – Jurisdictional variations
* Determined at the jurisdictional level and refers to the time of notable generic utilization.
** The generic entry month is unknown. Data is limited to the yearly aggregate level.
Table 3.2. Formulary status for drugs in the relevant market 12 months prior to and post generic entry
Table 3.3. Average cost per unit for drugs in the market, selected jurisdictions†
* 12 months prior to generic entry ** 12 months post generic entry
† Alberta, Saskatchewan, Manitoba, New Brunswick, Nova Scotia and Prince Edward Island
3.2 Results
The impact of generic entry was assessed in terms of both the volume of size-standardized claims and market share.
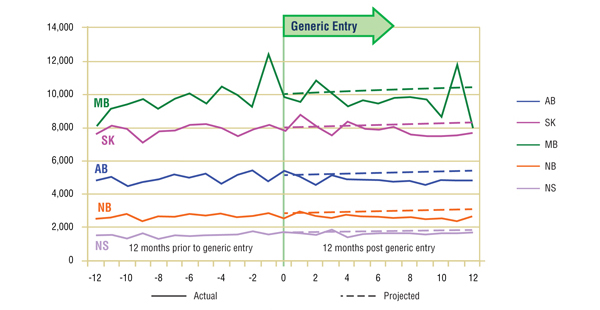
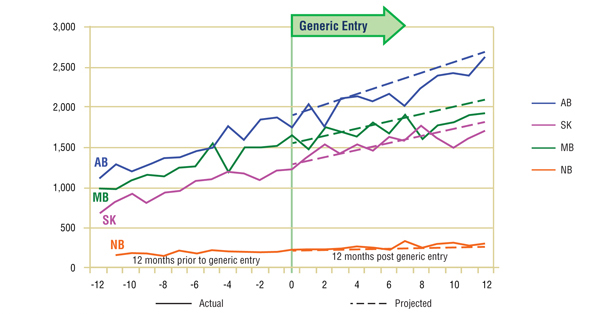
Short-Term Analysis: Figure 3.1 reports the volume of claims by jurisdiction over the 12-month period prior to and post generic entry. Actual and projected amounts are compared for the 12-month period following generic entry. In the case of New Brunswick, Saskatchewan, Manitoba and Alberta, data was available for parts of the 12-month period prior to generic entry. The results suggest that the entry of the generic version of pravastatin had little impact on the utilization of the ingredient.
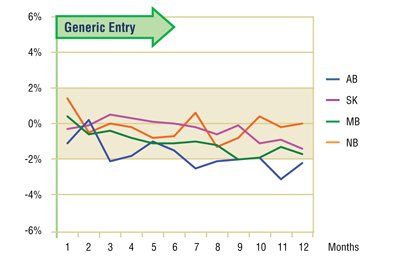
The Figure 3.2 shows the extent to which the actual market share for pravastatin varies from the projected amount. In the four jurisdictions analyzed, the variations are minimal and inconsistent (within +/- 2%), supporting the above conclusion.
Figure 3.1. Pravastatin – Number of claims by jurisdiction*
* Given the limited and fluctuating observations prior to generic entry, the projections were calculated using the logarithmic function, which yielded similar projections as the power function. In the case of Manitoba, the projection is based on 15-months of data prior to generic entry for a more accurate estimate.
Figure 3.2. Pravastatin – actual market shares variation from projected (claims)*
* Projections are based on the linear function.
Long-Term Analysis: Figure 3.3 reports the volume of claims over a 3-year period prior to and post generic entry, indexed for the first year that jurisdictional data was available. Zero represents the year of generic entry.
Data availability for this analysis is limited to Ontario and British Columbia.7 In Ontario, the annual trend seems to suggest that the utilization of pravastatin has not been impacted by generic entry. In British Columbia, however, there does appear to be a slight increase in utilization following generic entry. The decline at the end of the period coincides with the arrival of rosuvastatin on the market.
Figure 3.3. Pravastatin – Ingredient utilization index
3.3 Conclusion
The analysis of utilization patterns across the jurisdictions indicates that, with the possible exception of British Columbia, the utilization of pravastatin has not been impacted by generic entry.
6 Canadian Pharmacists Association, Compendium of Pharmaceuticals and Specialties (CPS), 2009.
7 To be able to perform a long-term analysis, a minimum of 3 years of data are required to develop a trend in utilization. Data for most of the jurisdictions in this study starts with March, 1999, barely 12 months before generic entry. Only data for Ontario and British Columbia is available back to 1997, offering the 3 years worth of data required by the methodology.
Analysis: Simvastatin
4 Simvastatin
Simvastatin is a HMG CoA reductase inhibitor (statin) used to control hypercholesterolemia (elevated cholesterol levels) and in the prevention of cardiovascular disease8. Simvastatin utilization is assessed in the context of its relevant market, which includes the other statins: atorvastatin, fluvastatin, lovastatin, pravastatin and rosuvastatin. Since data was not available for all jurisdictions, the analysis in this section is limited to British Columbia, Alberta, Saskatchewan, Manitoba, Ontario, New Brunswick and Nova Scotia.
4.1 Market Profile
Public drug plans began receiving claims for generic simvastatin late in 2002 and early 2003 (Table 4.1), with a near-complete generic substitution occurring shortly after. At the time, simvastatin was the second most utilized drug in the class (after atorvastatin), with constant or slight increasing trends in market share ranging from 23.5% to 34.2% depending on the jurisdiction.
The market composition for statins is listed in Table 4.2 along with their formulary status across jurisdictions around the time the generic entry. Except for New Brunswick and Nova Scotia, statins were available on an unrestricted basis.
Simvastatin was the third statin to face generic competition, after lovastatin and pravastatin. Its branded cost per unit of $2.17 (in the 12-month period prior to generic entry) was the highest on the market (Table 4.3). With an average cost per unit of $1.24 (standardized for changes in utilization strength), generic simvastatin offered a 43% discount over the branded price.
Table 4.1. Simvastatin market profile – Jurisdictional variations
* Determined at the jurisdictional level and refers to the time of notable generic utilization.
** The generic entry month is unknown. Data is limited to the yearly aggregate level.
Table 4.2. Formulary status for drugs in the relevant market 12 months prior to and post generic entry
Table 4.3. Average cost per unit for drugs in the market, selected jurisdictions†
* 12 months prior to generic entry ** 12 months post generic entry
† Alberta, Saskatchewan, Manitoba, New Brunswick, Nova Scotia and Prince Edward Island
4.2 Results
The impact of generic entry was assessed in terms of both the volume of size-standardized claims and their market share.9 The assessment of the generic impact on the utilization of the ingredient is affected by yet another event in the market: the launch of rosuvastatin (Crestor) a few months later.
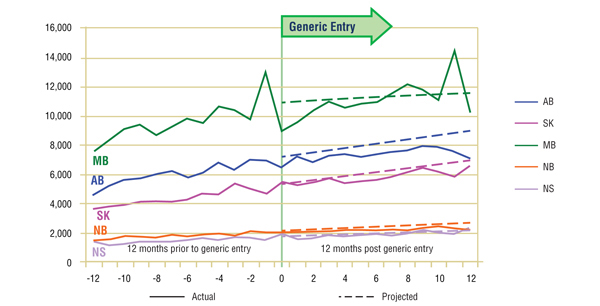
Short-Term Analysis: Figure 4.1 reports the volume of claims by jurisdiction over the 12-month period prior to and post generic entry. Actual and projected amounts are compared for the 12-month period following generic entry. On the one hand, the comparative analysis of the actual versus projected volume of claims seems to suggest that the entry of the generic had a negative impact on the utilization of simvastatin. However, given the arrival of rosuvastatin so soon afterward, the extent to which each event contributed to the overall change in the ingredient's utilization is unknown.
Figure 4.2 shows the extent to which the actual market share for simvastatin varied from the projected amount following generic entry. While simvastatin appears to lose market share following generic entry, the decline in the first few months prior to the arrival of rosuvastatin on the market was minimal (less than 2%). The launch of rosuvastatin and its rapid market uptake drastically eroded simvastatin's utilization and market share. The utilization of other drugs in the market experienced a similarly negative impact.
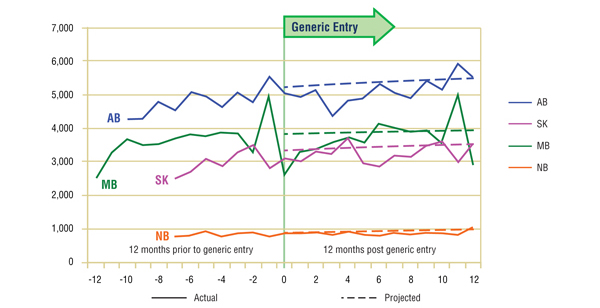
Figure 4.1. Simvastatin – Number of claims by jurisdiction*
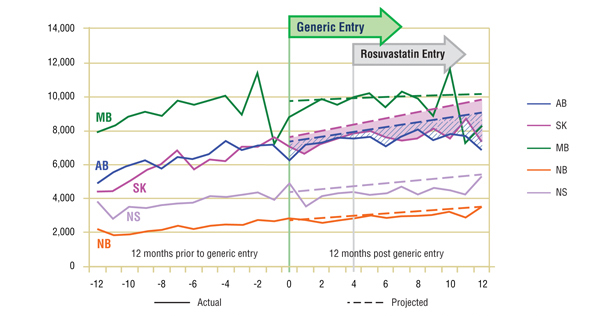
* Projections are based on a 24-month period, which in the case of simvastatin better reflected the overall trends in utilization. The linear function was used to generate projections for all jurisdictions except Manitoba. The historical 24-month trend in utilization in this jurisdiction exhibits sizable annual variations and diminishing yearly uptake. It was found that the use of a simple linear function would fail to account for the correction in seasonality. Both the logarithmic and the power functions yielded similar projections, with higher values for the coefficient of determination than the linear function. The logarithmic projection is reported for Manitoba.
Figure 4.2. Simvastatin – actual market shares variation from projected (claims)*
* Projections are based on the linear function.
Long-Term Analysis: Figure 4.3 reports the volume of claims over a 3-year period prior to and post generic entry, indexed for the first year that jurisdictional data was available. Zero represents the year of generic entry. The results suggest that the growth in utilization of simvastatin does slow during the fiscal year following generic entry. Nevertheless, as indicated in the short-term analysis, the trends cannot be solely attributed to generic entry, as the impact of rosuvastatin's launch is unknown.
Figure 4.3. Simvastatin – Ingredient utilization index
4.3 Conclusion
Due to the dual market impact of the entry of generic simvastatin and the launch of a new drug (rosuvastatin), it is unclear which event had the greatest effect on the utilization of simvastatin. Nevertheless, the immediate generic entry impact seems to suggest a small negative impact consistently across jurisdictions, exacerbated by the launch of rosuvastatin shortly thereafter.
8 Canadian Pharmacists Association, Compendium of Pharmaceuticals and Specialties (CPS), 2009.
9 Size standardization was not performed for Manitoba because of inconsistent unit reporting. Nevertheless, the reporting of the non-standardized claims for this province and for this market is not expected to affect the interpretation of the results.
Analysis: Paroxetine and Citalopram
5 Paroxetine and Citalopram
Paroxetine and citalopram are selective serotonin reuptake inhibitors (SSRIs) prescribed for the treatment of major depressive disorder, obsessive–compulsive disorder, panic disorder, social phobia and post-traumatic stress10. These two drug products are analyzed conjointly in this chapter due to the fact that they have a similar generic entry date and the impact that this may have on their utilization. Paroxetine and citalopram utilization are assessed in the context of their relevant market, which includes the other SSRIs: fluoxetine, fluvoxamine and sertraline. Since data was not available for all jurisdictions, the analysis in this section is limited to British Columbia, Alberta, Saskatchewan, Manitoba, Ontario, New Brunswick and Nova Scotia.
5.1 Market Profile
Public drug plans began receiving claims for generic paroxetine in late 2003 and early 2004, with generic citalopram entering at the same time or immediately after (Table 5.1). A near-complete generic substitution occurred shortly after generic entry in the case of both drugs. The two drug products accounted for a significant share of the overall claims made in this market. Over the period reviewed, paroxetine was slowly losing its place as market leader to citalopram.
The market composition for SSRIs is indicated in Table 5.2 along with their formulary status across jurisdictions around the time the generic entry. SSRIs were available on an unrestricted basis, except in Nova Scotia, where the status changed from restricted to unrestricted in March of 2004 (coinciding with the entry of generic citalopram).
Paroxetine and citalopram were the last two drug products in the market to lose patent protection. Their average brand price per quantity was $1.75 and $1.42, respectively, in the 12-month period prior to generic entry (Table 5.3). The two drug products had a comparable generic price discount (38% and 36%, respectively), bringing the generic price more in line with that of their competitors.
Table 5.1. Paroxetine and citalopram market profile – Jurisdictional variations
* Determined at the jurisdictional level and refers to the time of notable generic utilization.
** The generic entry month is unknown. Data is limited to the yearly aggregate level.
Table 5.2. Formulary status for drugs in the relevant market 12 months prior to and post generic entry
Table 5.3. Average cost per unit for drugs in the market, selected jurisdictions†
* 12 months prior to generic entry ** 12 months post generic entry
† Alberta, Saskatchewan, Manitoba, New Brunswick, Nova Scotia and Prince Edward Island
5.2 Results
The impact of generic entry was assessed in terms of both the volume of size-standardized claims and market share.
Short-Term Analysis: The actual and projected volumes of claims after generic entry are reported by jurisdiction in Figures 5.1 and 5.2. The results suggest that the entry of the generic version had little impact on the utilization of either ingredient, at least in the short term, with a slight drop in utilization.
Figure 5.1. Paroxetine – Number of claims by jurisdiction*
* Projections are based on a linear function for all jurisdictions except Manitoba. The historical 24-month trend in utilization in this jurisdiction exhibits sizable annual variations and diminishing yearly uptake. It was found that the use of a simple linear function would fail to account for the correction in seasonality. Both the logarithmic and the power functions yielded similar projections, with higher values for the coefficient of determination than the linear function. The logarithmic projection is reported for Manitoba.
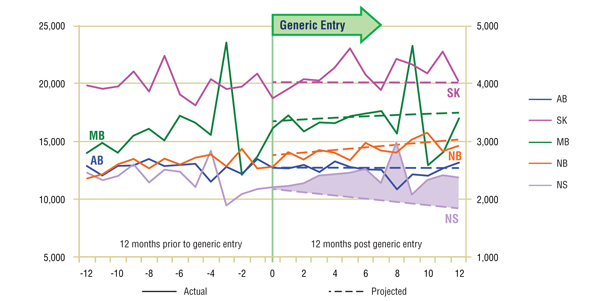
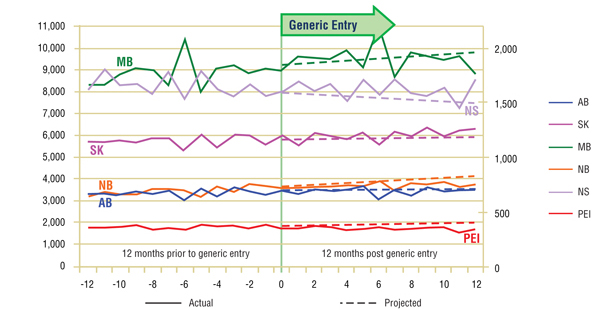
Figure 5.2. Citalopram – Number of claims by jurisdiction*
* Projections are based on a linear function for all jurisdictions except Manitoba. The historical 24-month trend in utilization in this jurisdiction exhibits sizable annual variations. It was found that the use of a simple linear function would fail to account for the correction in seasonality. Both the logarithmic and the power functions yielded similar projections, with values for the coefficient of determination that were similar to those for the linear function. The logarithmic projection is reported for Manitoba.
Figures 5.3 and 5.4 show the extent to which the actual market share for each of the two drugs varied from the projected amount following generic entry. In both cases, the variations are minimal and inconsistent (within +/- 2%). This supports the conclusion drawn from the volume of claims analysis, namely, that there was little impact on utilization after generic entry for either paroxetine or citalopram.
While there does appear to be a small impact on the market share of paroxetine in New Brunswick, a more detailed review of the utilization of all of the drugs in the market reveals that paroxetine was the only one with a change from its early trend, albeit small. As none of the competitors appears to have benefited from this decline, the loss in utilization and market share are likely the result of market maturation rather than the entry of generic paroxetine.
Figure 5.3. Paroxetine – actual market shares variation from projected (claims)*
* Projections are based on the linear function.
Figure 5.4. Citalopram – actual market shares variation from projected (claims)*
* Projections are based on the linear function.
Long-Term Analysis: Figures 5.5 and 5.6 report the volume of claims over a three year period prior to and post generic entry, indexed for the first year that jurisdictional data was available. Zero is the year of generic entry.
The results of the long-term analysis suggest two different outcomes. On the one hand, in the case of paroxetine, the slight decline in utilization that appeared near the middle of the first year following generic entry becomes more pronounced in all jurisdictions except British Columbia where the decline in utilization began the year before.
On the other hand, the results for citalopram suggest that the utilization followed the trend established prior to generic entry. This confirms the observation made in the short-term analysis, namely, that the utilization of citalopram has not been impacted by generic entry.
It should be noted that the change in utilization of paroxetine does seem to coincide with warnings on the long-term use of SSRIs. While initial reports out of the United States about the side-effects of their use focused on paroxetine, warnings were issued by Health Canada for all the drugs in the class, including citalopram. Unfortunately, there is not enough information available to assess the impact of this event.
Figure 5.5. Paroxetine – Ingredient utilization index
Figure 5.6. Citalopram – Ingredient utilization index
5.3 Conclusion
The analysis of utilization patterns across the jurisdictions suggests that, at least in the short-term, the utilization of paroxetine and citalopram was slightly affected by generic entry. The long-term analysis paints a different picture for the utilization of paroxetine, which, with the exception of British Columbia, saw a significant drop following generic entry.
10 Canadian Pharmacists Association, Compendium of Pharmaceuticals and Specialties (CPS), 2009.
Analysis: Gabapentin
6 Gabapentin
Gabapentin is an anticonvulsant indicated for the management of patients with epilepsy11. It is also extensively used on an off-label basis for the treatment of neuropathic pain. The utilization of gabapentin was analyzed in the context of the market for anticonvulsants and tricyclic antidepressants used to treat neuropathic pain, which includes amitriptyline, carbamazepine, desipramine, imipramine and nortriptyline. Since data was not available for all jurisdictions, the analysis in this section is limited to British Columbia, Alberta, Saskatchewan, Manitoba, Ontario and New Brunswick.
6.1 Market Profile
Public drug plans began receiving claims for generic gabapentin in 2001 (Table 6.1), with a near-complete generic substitution occurring within the same year. While gabapentin was not the dominant drug in the market, it was the fastest growing, with double-digit increases in the volume of claims in many jurisdictions including British Columbia, Alberta, Saskatchewan and Manitoba.
The market composition is considered in Table 6.2 along with the formulary status across jurisdictions around the time of generic entry. In four of the jurisdictions analyzed, all drugs in the market were available without restriction. Gabapentin was available in Ontario and New Brunswick on a restricted basis. New Brunswick had further restrictions on amitripyline and imipramine. Saskatchewan removed the formulary restrictions on all these drugs three months before the generic gabapentin entry.
Gabapentin was the last drug in its market to face generic competition. Its branded cost per unit of $0.90 (in the 12-month period prior to generic entry) was the highest on the market (Table 6.3). With an average cost per unit of $0.60 (standardized for changes in utilization strength), generic gabapentin offered a 33% discount over the branded price.
Table 6.1. Gabapentin market profile – Jurisdictional variations
* Determined at the jurisdictional level and refers to the time of notable generic utilization.
** The generic entry month is unknown. Data is limited to the yearly aggregate level.
Table 6.2. Formulary status for drugs in the relevant market 12 months prior to and post generic entry
Table 6.3. Average cost per unit for drugs in the market, selected jurisdictions†
* 12 months prior to generic entry ** 12 months post generic entry
† Alberta, Saskatchewan, Manitoba, New Brunswick, Nova Scotia and Prince Edward Island
6.2 Results
The impact of generic entry was assessed in terms of both the volume of size-standardized12 claims and market share.
Short-Term Analysis: Figure 6.1 reports the volume of claims by jurisdiction over the 12-month period prior to and post generic entry. Actual and projected amounts are compared for the 12-month period following generic entry. The results indicate that the entry of the generic version of gabapentin had no notable impact on the utilization of the ingredient, with the exception of a slight decline in utilization in some jurisdictions.
The Figure 6.2 shows the extent to which the actual market share for gabapentin varied from the projected amount. Generally, the variation is small and inconsistent (within +/- 2%), supporting the conclusion drawn from the volume of claims analysis, namely that the gabapentin utilization was not impacted by generic entry.
While the apparent modest decline (-2%) in gabapentin's market share along with the slowing growth in utilization suggests that there may have been some impact from generic entry, a more detailed review of trends in the other drugs in the market show that gabapentin was the only ingredient growing in both utilization and market share, though at a slower rate following generic entry. This suggests that the deviations from the earlier trends were the result of a maturing market rather than a change in utilization related to the arrival of the generic.
Figure 6.1. Gabapentin – Number of claims by jurisdiction*
* Projections are based on the linear function.
Figure 6.2. Gabapentin – Actual market shares variation from projected (claims)*
* Projections are based on the linear function.
Long-Term Analysis: Figure 6.3 reports the volume of claims over a three year period prior to and post generic entry, indexed for the first year that jurisdictional data was available. Zero represents the year of generic entry.
This analysis is limited to Ontario and British Columbia for reasons of data availability. In Ontario, the data seems to confirm observations made in the short-term analysis, namely that the utilization of gabapentin has not been impacted by generic entry. On the other hand, utilization in British Columbia appears to slow in its uptake in the two years following the arrival of a generic on the market. If the cause was indeed generic entry, then the impact was relatively small, approximately 4%, and short lived, as growth returned to its previous levels in subsequent years.
Figure 6.3. Gabapentin – Ingredient utilization index
6.3 Conclusion
The analysis of utilization patterns across the jurisdictions indicates that the utilization of gabapentin has not been notably impacted by generic entry. The isolated variations cannot be attributed solely to gabapentin generic entry.
11 Canadian Pharmacists Association, Compendium of Pharmaceuticals and Specialties (CPS), 2009.
12 Size standardization was not performed for Manitoba because of inconsistent unit reporting. Nevertheless, the reporting of the non-standardized claims for this province and for this market is not expected to affect the interpretation of the results.
General Findings
The purpose of this study was to identify the impact that generic entry had on the utilization of the ingredient in the case of top-selling drug products that have lost patent protection in recent years, as observed in public drug plan data. Seven drug products were selected for analysis: omeprazole, risperidone, pravastatin, simvastatin, paroxetine, citalopram and gabapentin. These drugs cover various therapeutic classes, market conditions (price differential, number and type of competitors) and formulary statuses.
Generally, this research shows that there is very little change in the trend in utilization once the first generic version is launched. Typically the number of claims and market share following generic entry continue the trend established by the brand name under market exclusivity. In most cases the changes in utilization that are identified cannot be directly and/or solely attributable to generic entry.
This is the case for simvastatin. While there appears to be a notable negative impact on utilization across jurisdictions both in the short- and long-term, it is difficult to separate out how much of the change was a result of the introduction of the generic and how much was a result of the arrival of rosuvastatin a few months later.
In the case of omeprazole, the changes observed in long-term utilization for some jurisdictions can be explained by drug plan policy changes. In other jurisdictions the slowing growth in utilization around the time of generic entry may indicate a maturing market.
The most significant change in utilization following generic entry was in the case of paroxetine. The long-term analysis revealed a sizable drop in utilization across every jurisdiction beginning 1 year after the end of the patent life. At the same time, another drug in the same market, citalopram, experienced almost no change in utilization despite facing a similar challenge from a generic. It should be noted that, while Health Canada issued warnings for all the drugs in the class at the time, there is no data available to assess the impact on utilization.
Implications
Two hypotheses were proposed at the start of this analysis. The first hypothesis proposed that the availability of a drug product at a lower price may lead to increased utilization. This hypothesis does not seem to be supported by the results. There may be two explanations for this. Firstly, a patient may be reluctant to switch from one drug to another because of a better clinical response, or based on other reasons related to their therapeutic choices. Secondly, the analysis was done on public drug plans where beneficiaries are generally responsible for a portion of the cost. In such cases, there may be limited price elasticity, in the sense that a price reduction on a drug product may not necessarily translate to an increased demand.
The second hypothesis proposed that the utilization may diminish due to a decrease in drug advertising, which is generally conducted by brand manufacturers and ceases with the loss of market exclusivity. This hypothesis does not seem to be supported by the results in the public drug plans analyzed. This may be explained by the fact that most of the drug products that were analyzed have mature markets with a limited number of new patients. Thus advertising would not have played a significant role in the market trends.
In conclusion, the utilization of the drug products analyzed was generally not impacted by generic entry. This implies that any cost savings after generic entry will be solely related to the generic price discount. Nevertheless, it should be recognized that over time these savings may be eroded by a growth in utilization; a growth that is unrelated to generic competition.
Limitations
While this study was conducted on a limited number of top-selling drug products utilized in public drug plans, it covers various therapeutic classes, market conditions (price differential, number and type of competitors) and formulary statuses. Therefore, we should be able to apply these findings to other drugs.
However, utilization can be affected by a number of factors including reimbursement policies, pricing, demographics, physician prescribing practices, and the incidence of a particular condition. In addition, public drug plan data represents only one component of the overall pharmaceutical market. Results may differ for markets reimbursed by private insurers or drugs paid for out-of-pocket by patients.
This study is purely a drug utilization analysis that assesses the impact of the generic entry on the utilization of the ingredient in public drug plans. The study does not make any assessment on the cost implications of generic entry impact on drug plan expenditures.