Annual Report 2010
The mandate of the Patented Medicine Prices Review Board is to ensure that prices at which patentees sell their patented medicines in Canada are not excessive; and to report on pharmaceutical trends of all medicines and on R&D spending by patentees.
Table of Contents
- Statistical Highlights 2010
- Letter to the Minister
- Executive Summary
- Chairperson’s Message
- About the Patented Medicine Prices Review Board
- Regulating Prices of Patented Medicines
- Key Pharmaceutical Trends
- Price Trends
- Comparison of Canadian Prices to Foreign Prices
- Utilization of Patented Drug Products
- Canadian Drug Expenditures in the Global Context
- Analysis of Research and Development Expenditures
- National Prescription Drug Utilization Information System
- Appendix 1: Glossary
- Appendix 2: Patented Drug Products First Reported to the PMPRB in 2010
- Appendix 3: Research and Development
Statistical Highlights 2010
Regulatory Mandate
Compliance
- 68 new patented drug products for human use were reported to the PMPRB.
- 48 new patented drug products were within Guidelines.
- In total, 1196 patented drug products for human use were under the PMPRB's jurisdiction.
Enforcement
In 2010, and up to May 31, 2011:
- The Board approved 16 Voluntary Compliance Undertakings (VCUs) and an amendment to one existing VCU.
- The Board issued decisions and/or orders effectively completing five matters: Adderall XR (Supplementary Order); Nicoderm; Penlac; Quadracel and Pentacel; and ratio-Salbutamol HFA.
- Decisions are pending in three matters: Copaxone (redetermination), on price; ratiopharm Inc. and Sandoz Canada Inc., on failure to file. Two proceedings are ongoing: Apotex Inc., on failure to file, and Apo-Salvent CFC Free, on price.
Reporting Mandate
Sales Trends
- Sales of patented drug products in Canada declined by 3.4% to $12.9 billion in 2010.
- The share of patented drug products as a percentage of total sales continued to decline, from 65.5% in 2009 to 58.0% in 2010.
- The greatest decline in sales of patented drug products was for cardiovascular system drugs, while antineoplastics and immunomodulating agents (such as drugs used in chemotherapy) had the largest growth in sales in 2010.
Patented Drug Price Trends
- The prices of patented drug products sold by patentees, as measured by the Patented Medicines Price Index, fell by 0.4% from 2009 to 2010, while the Consumer Price Index rose by 1.8%.
- Canadian prices were the fourth highest of the seven comparator countries.
Research and Development
- Patentees reported total R&D expenditures of $1.18 billion, a decline of 7.4% over 2009.
- Rx&D members accounted for 84.8% of all reported R&D expenditures in 2010.
- The R&D-to-sales ratio declined for all patentees from 7.5% in 2009 to 6.9% in 2010, while the R&D-to-sales ratio for members of Rx&D remained at 8.2%, the same as for 2009.
Letter to the Minister
May 31, 2011
The Honourable Leona Aglukkaq, P.C., M.P.
Minister of Health
House of Commons
Ottawa, Ontario
K1A 0A6
Dear Minister:
I have the pleasure to present to you, in accordance with sections 89 and 100 of the Patent Act, the Annual Report of the Patented Medicine Prices Review Board for the year ended December 31, 2010.
Yours very truly,
Mary Catherine Lindberg
Chairperson
Executive Summary
About the PMPRB
The Patented Medicine Prices Review Board (PMPRB) is an independent quasi-judicial body established by Parliament in 1987 under the Patent Act (Act).
The PMPRB has a dual role:
- to ensure that prices at which patentees sell their patented medicines in Canada are not excessive
- to report on pharmaceutical trends of all medicines and on R&D spending by patentees
The PMPRB has no authority to regulate the prices of non-patented drugs and does not have jurisdiction over prices charged by wholesalers or pharmacies, or over pharmacists' professional fees.
Governance
The Board consists of up to five members who serve on a part-time basis. Members, including a Chairperson and a Vice-Chairperson, are appointed by the Governor-in-Council. The Chairperson is designated under the Act as the Chief Executive Officer of the PMPRB with the authority and responsibility to supervise and direct its work.
Budget
The PMPRB operated with a budget of $12.2 million in 2010/11 and an approved staff level of 76 full-time equivalent employees. $3.1 million of the total budget resided in a Special Purpose Allotment (SPA) reserved for hearings. Unspent SPA funds were returned to the Consolidated Revenue Fund.
Communications and Outreach
The PMPRB is committed to transparency, accessibility and stakeholder engagement. The PMPRB regularly informs its stakeholders on its activities through its publications, such as the Annual Report and its quarterly NEWSletter, and by posting Staff and Board Member presentations. All PMPRB publications, including Board decisions in hearings and VCUs, are available on its website.
Industry stakeholders are consulted and informed of any changes in the operating environment. The Regulatory Affairs and Outreach Branch conducts outreach sessions with patentees on a regular basis.
Regulating the Prices of Patented Medicines
The PMPRB is responsible for regulating the prices that patentees charge for prescription and non-prescription patented drug products sold in Canada to wholesalers, hospitals, pharmacies or others, for human and veterinary use, to ensure that they are not excessive.
Although patentees are not required to obtain approval of the price beforehand, they are required under the Act to ensure that prices of patented drug products sold in Canada are not excessive. The Board's Guidelines detail how to establish a price that is not excessive.
New patented drug products
In 2010, 68 new patented drug products for human use were introduced. Some are one or more strengths of a new active substance and others are new presentations of existing medicines. Of the 68 new patented drug products, the prices of 57 had been reviewed as of March 31, 2011.
- 48 were found to be within the Guidelines
- 2 were at levels that appeared to exceed the Guidelines by an amount that did not trigger the investigation criteria
- 7 were priced at levels that appeared to exceed the Guidelines and investigations were commenced
The prices of 11 new patented drug products are still under review.
Price review of existing patented drugs for human use
Existing patented drug products include all patented drug products that were first sold and reported to the PMPRB prior to December 1, 2009. At the time of this report, there were 1,128 existing patented drug products. The prices of 1,039 (92%) were within the Guidelines or were at levels that appeared to exceed the Guidelines by an amount that did not trigger the investigation criteria. The prices of 78 existing patented drug products were the subject of investigations. Of these, 11 investigations were opened as result of introductory pricing and 67 were opened on the basis of year-over-year prices.
Voluntary Compliance Undertakings and Hearings
Voluntary Compliance Undertakings
In 2010 and up to May 31, 2011, the Board approved 16 VCUs and an amendment to an existing VCU.
Hearings
The Board issued one Notice of Hearing with respect to failure to file in the matter of Sandoz Canada Inc.
The Board issued decisions and/or orders effectively completing five matters: Adderall XR (Supplementary Order); Nicoderm; Penlac; Pentacel and Quadracel; and ratio-Salbutamol HFA.
As of May 31, 2011, decisions were pending in three matters: Copaxone (redetermination); ratiopharm Inc.; and Sandoz Canada Inc.
In addition to price reductions, excess revenues totalling $24.6 million were offset by way of payments to the Government of Canada through Voluntary Compliance Undertakings (VCUs) and Board Orders from January 2010 to May 31, 2011.
Since 1993, approximately $110 million has been collected through VCUs and Board Orders by way of payments to the Government of Canada and/or to customers such as hospitals and clinics.
Sales of patented drug products declined to $12.9 billion in 2010, a decrease of 3.4% from $13.3 billion in 2009.
Reporting on Key Pharmaceutical Trends
Trends in Sales of Patented Drug Products
Sales of patented drug products declined to $12.9 billion in 2010, a decrease of 3.4% from $13.3 billion in 2009.
The growth in sales has undergone a pronounced decline in recent years. Throughout the latter part of the 1990s, sales growth was largely driven by a succession of new “blockbuster” products that achieved very high sales volumes — in 1999, annual sales growth was 27.0%. However, since that time the pharmaceutical industry has not introduced new high-volume products in sufficient numbers to sustain double-digit sales growth. Older drug products, introduced between 1995 and 1999, still accounted for a substantial share of 2010 sales.
The share of patented drug products in overall drug sales has also declined since 2003, implying that sales of generic and non-patented branded drug products have grown faster than sales of patented drug products.
Figure 4 Annual Rate of Change, Patented Medicines Price Index (PMPI) and Consumer Price Index (CPI), 1988–2010
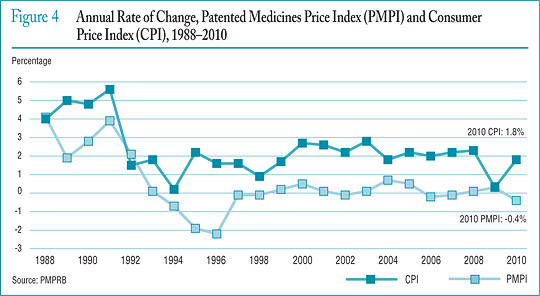
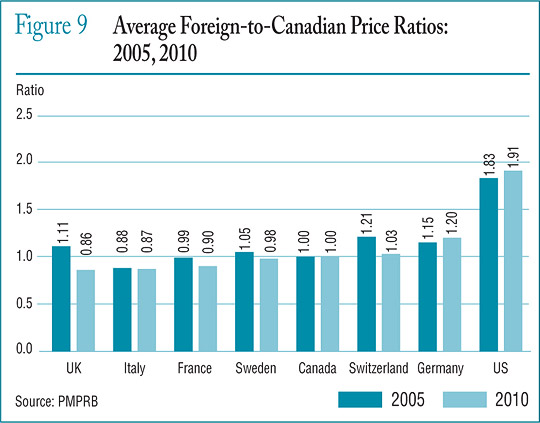
Figure 9 Average Foreign-to-Canadian Price Ratios: 2005, 2010
Price Trends
The PMPRB uses the Patented Medicines Price Index (PMPI) to monitor trends in prices of patented drug products sold in Canada. The PMPI measures the average year-over-year change in the ex-factory prices using a formula that takes a sales-weighted average of price changes observed at the level of individual products, similar to the approach used to calculate the Consumer Price Index (CPI).
As measured by the PMPI, prices of patented drug products fell, on average, by 0.4% between 2009 and 2010.
Price Change by Country
The Act and Patented Medicines Regulations require patentees to report publicly available ex-factory prices of their patented drug products for seven foreign comparator countries: France, Germany, Italy, Sweden, Switzerland, the United Kingdom, and the United States. The PMPRB uses this information to conduct its international price comparison tests.
Canadian prices were typically within the range of prices observed among the comparator countries. Canadian prices were roughly in line with Swedish and Swiss prices. Prices in Italy, France and the United Kingdom were appreciably lower than Canadian prices, while those in Germany were substantially higher. As in previous years, prices reported for the United States were much higher than prices in Canada or any other comparator country.
In 2010, prices in the United States rose on average at a rate of 5.3% from 2009. Germany and Sweden saw much more modest average price increases, while prices in France, Italy, the United Kingdom and Switzerland declined slightly.
R&D Expenditures
Spending on pharmaceutical R&D was $1.18 billion in 2010, a decline of 7.4% over 2009. Members of Canada's Research-Based Pharmaceutical Companies (Rx&D) reported R&D expenditures of $1.00 billion in 2010, a decrease of 11.7% over last year.
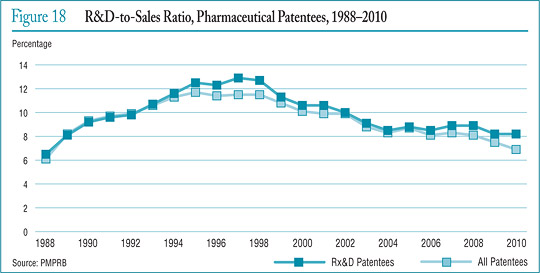
When the Act was amended in 1987, Rx&D members made a public commitment to increase their annual research and development expenditures to 10% of sales revenues by 1996. However, in recent years, R&D-to-sales ratios for all patentees and for Rx&D members have been declining. In 2010, the ratio for all patentees was 6.9%, down from 7.5% in 2009. The ratio for members of Rx&D was 8.2%, marking the eighth consecutive year that it has been less than 10%.
Patentees reported spending $235.9 million on basic research in 2010 (a decline of 0.5% over the previous year) and $613.4 million on applied research. Clinical trials accounted for 75.8% of applied research expenditures.
Compared to the PMPRB's seven comparator countries, in 2008 Canada's R&D-to-sales ratio was second lowest at 8.1%, ahead of Italy. Ratios in all other comparator countries were well above Canada's.
Figure 18 R&D-to-Sales Ratio, Pharmaceutical Patentees, 1988–2010
National Prescription Drug Utilization Information System
Through the National Prescription Drug Utilization Information System (NPDUIS), the PMPRB and the Canadian Institute for Health Information work with their federal, provincial, and territorial government partners to provide critical analyses of price, utilization and cost trends. In 2010, the PMPRB worked closely with its partners to support drug plan policy decision making.
The PMPRB published four NPDUIS analytical reports in 2010. The topics covered included the cost impacts of an aging population; the application of the World Health Organizations Defined Daily Dose Measure (ATC/DDD); and the price and market structure of the Canadian generic drug industry.
Chairperson’s Message
As the PMPRB moves towards 25 years of operations, its role has never seemed more pertinent. As the business environment of the pharmaceutical industry becomes ever more complex, and the needs of the health care system become more acute, the PMPRB plays an important role in contributing to the health care system and protecting consumers.
I am delighted to have been appointed as Chairperson, after serving as Vice-Chair for the past five years. It is a privilege to have been given the opportunity to work with the industry and stakeholders for the benefit of all Canadians. I am also delighted that Dr. Mitchell Levine has been appointed Vice-Chair. In addition to his familiarity with the PMPRB through his work on the Human Drug Advisory Panel, his expertise and professional engagement will be a valuable asset to the Board.
I was pleased to welcome Michelle Boudreau as Executive Director last fall. Her energy and enthusiasm come to the PMPRB at a time when the organization is assessing its direction in light of ongoing shifts in the health care environment. The Board has already identified enhancing our engagement with stakeholders and bolstering our outreach to patentees as priorities.
This can already be felt in the implementation of the renewed Guidelines that came into effect on January 1, 2010. Monitoring the short- and long-term impacts has given us additional opportunities for dialogue with patentees and allowed us to make adjustments rapidly in the field. It has also allowed us to note that some changes are already a success. Exchanges with stakeholders are key to our long-standing commitment to a regulatory regime that is relevant, responsive and appropriate.
An important clarification came this year from the Supreme Court of Canada, which upheld key aspects of the Board's jurisdiction and affirmed the PMPRB's role as protecting consumers.
For the most part, matters before the Board focus on the scientific and pricing issues of patented drug products. While these proceedings can be time sensitive, resource intensive, and require thoughtful deliberation, they provide patentees with an opportunity to be heard. And while Board proceedings sometimes result in judicial reviews in the Federal Court, they provide all parties with vital clarifications on the intent of the law. An important clarification came this year from the Supreme Court of Canada, which upheld key aspects of the Board's jurisdiction and affirmed the PMPRB's role as protecting consumers.
Through the National Prescription Drug Utilization Information System (NPDUIS), we pursued our partnership with the Canadian Institute for Health Information, Health Canada and the provinces and territories. The NPDUIS initiative provides critical analyses of price, utilization and cost trends to facilitate informed, efficient and cost-effective policy making. Publishing the results of NPDUIS studies brings the benefits of this work to the broader health care community.
I would like to thank the staff for its commitment, enthusiasm and continuous support. I would also like to thank my fellow Board Members for their dedication and tireless work. Our ability to effectively meet challenges, serve Canadians, and contribute to the health care system is thanks to the commitment, dedication and expertise of Board Members and Staff.
Mary Catherine Lindberg
Chairperson
About the Patented Medicine Prices Review Board
The Patented Medicine Prices Review Board (PMPRB) is an independent quasi-judicial body established by Parliament in 1987 under the Patent Act (Act).
The PMPRB protects the interests of Canadian consumers by ensuring that the prices of patented medicines sold in Canada are not excessive. It does this by reviewing the prices that patentees charge for each individual patented drug product in Canadian markets. If a price is found to be excessive, the Board can hold public hearings and order price reductions and/or the offset of excess revenues. The PMPRB regulates the “factory gate” prices and does not have jurisdiction over prices charged by wholesalers or pharmacies, or over pharmacists' professional fees.
The PMPRB is also responsible for reporting on trends in pharmaceutical sales and pricing for all medicines and for reporting research and development spending by patentees.
The Minister of Health is responsible for the pharmaceutical provisions of the Act as set out in sections 79 to 103. The PMPRB is part of the Health Portfolio, which also includes Health Canada, the Public Health Agency of Canada, the Canadian Institutes of Health Research, the Hazardous Materials Information Review Commission, and Assisted Human Reproduction Canada.
The Health Portfolio supports the Minister of Health in maintaining and improving the health of Canadians.
Although part of the Health Portfolio, the PMPRB carries out its mandate at arm's length from the Minister of Health. It also operates independently of other bodies such as Health Canada, which approves drugs for safety, efficacy and quality; federal, provincial and territorial public drug plans, which are responsible for listing reimbursement decisions for their respective plans; and the Common Drug Review, which provides listing recommendations based on cost-effectiveness to participating public drug plans.
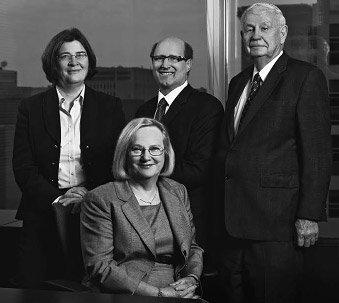
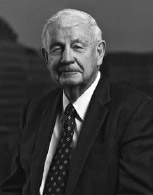
Photo caption:
Standing, from left to right: Anne Warner La Forest, Mitchell Levine, Tim Armstrong. Seated: Mary Catherine Lindberg.
Jurisdiction
Regulatory
The PMPRB is responsible for regulating the prices that patentees charge for prescription and non-prescription patented drugs sold in Canada to ensure that they are not excessive. It includes sales to wholesalers, hospitals, pharmacies or others for both human and veterinary use. The PMPRB regulates the price of each patented drug product. This includes each strength of an individual, final dosage form of a medicine.
The Board's jurisdiction is not limited to drug products for which the patent is on the active ingredient. Rather, the Board's jurisdiction also covers drugs for which the patents relate to, but are not limited to, the processes of manufacture, the delivery system or dosage form, the indication/use and any formulations. Patented drug products are not limited to brand-name products.
A number of generic companies fall under the Board's jurisdiction by virtue of being licensees selling the same drug product as the brand company or because of manufacturing or processing patents, which various generic companies also hold.
The PMPRB has no authority to regulate the prices of non-patented drugs and does not have jurisdiction over prices charged by wholesalers or pharmacies, or over pharmacists' professional fees. Also, matters such as whether medicines are reimbursed by public drug plans, their distribution and prescribing are outside the purview of the PMPRB.
Under the Act, patentees are required to inform the PMPRB of their intention to sell a new patented drug product. Upon the sale of such a patented drug product, patentees are required to file price and sales information at introduction and, thereafter, twice a year for each strength of each dosage form of each patented drug product sold in Canada.
Although patentees are not required to obtain approval of the price before a drug is sold, they are required to comply with the Act to ensure that prices of patented drug products sold in Canada are not excessive. In the event that the Board finds, after a public hearing, that a price is or was excessive in any market, it may order the patentee to reduce the price and take measures to offset any excess revenues it may have received.
Reporting
The PMPRB reports annually to Parliament through the Minister of Health on its activities, on trends relating to the sales and prices of medicines, and on R&D spending by patentees.
Through the National Prescription Drug Utilization Information System (NPDUIS) program, the PMPRB provides critical analyses of price, utilization and cost trends in Canada to support decision making by participating federal, provincial and territorial public drug plans.
Governance
The Board consists of not more than five members who serve on a part-time basis. Board Members, including a Chairperson and a Vice-Chairperson, are appointed by the Governor-in-Council. The Chairperson is designated under the Act as the Chief Executive Officer of the PMPRB, with the authority and responsibility to supervise and direct its work.
The Members of the Board, including the Chairperson, are collectively responsible for the implementation of the applicable provisions of the Act. Together, they establish the guidelines, rules, by-laws and other policies of the Board as provided by the Act and consult as necessary with stakeholders including Ministers of Health and representatives of consumer groups, the pharmaceutical industry and others.
Members of the Board
Chairperson
Mary Catherine Lindberg, BSP

Mary Catherine Lindberg was first appointed Member and Vice-Chair of the Board in June 2006. On May 19, 2010, Ms. Lindberg assumed the powers and functions of the Chairperson while the office was vacant. She was officially appointed Chairperson of the Board on March 3, 2011.
From 2002 to 2009, Ms. Lindberg was Executive Director of the Ontario Council of Academic Hospitals, an organization of 25 Academic Hospitals that are fully affiliated with a university and its Faculty of Medicine. Previously, she was the Assistant Deputy Minister, Health Services, with the Ontario Ministry of Health and Long-Term Care. Her responsibilities included the Ontario Health Insurance Plan (OHIP) and the Ontario Drug Programs.
Ms. Lindberg has a degree in pharmacy from the University of Saskatchewan and holds a pharmacist license in both Saskatchewan and Ontario.
Vice-Chairperson
Mitchell Levine, BSc, MSc, MD, FRCPC, FISPE

Dr. Mitchell Levine was appointed Member and Vice-Chairperson of the Board on March 3, 2011.
Dr. Levine is a professor in the departments of Medicine and Clinical Epidemiology and Biostatistics in the Faculty of Health Sciences at McMaster University in Hamilton, Ontario. He is also director of the Centre for Evaluation of Medicines at St. Joseph's Healthcare in Hamilton.
Dr. Levine received his medical degree from the University of Calgary in 1979, which was followed by postgraduate training in Internal Medicine (FRCPC) and Clinical Pharmacology at the University of Toronto (1981–1987). He received an MSc degree in Clinical Epidemiology from McMaster University in 1988.
Until his recent appointment to the Board, Dr. Levine was a member of the Patented Medicine Prices Review Board's Human Drug Advisory Panel. He acts, on an ad hoc basis, as a clinical pharmacology consultant to the Ontario Ministry of Health and Long-Term Care. In addition, he is the Editor-in-Chief of the Journal of Population Therapeutics and Clinical Pharmacology and is an Associate Editor of the ACP Journal Club: Evidence-Based Medicine.
Thomas (Tim) Armstrong, QC, O. Ont.
Tim Armstrong was first appointed Member of the Board in October 2002 and was re-appointed for a second term in 2007.
Mr. Armstrong practiced law from 1958 to 1974, first in the Civil Litigation Division of the federal Department of Justice, subsequently in private practice in Toronto with Jolliffe, Lewis & Osler, and later as a senior partner of Armstrong & MacLean, specializing in administrative law litigation before administrative tribunals, the Ontario Courts, the Federal Court, and the Supreme Court of Canada.
In 1974, Mr. Armstrong became Chair of the Ontario Labour Relations Board (1974–1976), then Deputy Minister of Labour (1976–1986), Agent General for Ontario in Tokyo (1986–1990), Deputy Minister of Industry, Trade and Technology (1991–1992) and advisor to the Premier of Ontario on economic development (1992–1995). He was a facilitator/mediator for the Ontario Health Services Restructuring Commission (1998–1999) and the arbitrator under the City of Toronto Labour Disputes Resolution Act (2001). He was counsel to the law firm McCarthy Tétrault (1995–2002) and Chief Representative for Canada for the Japan Bank for International Cooperation (1996–2010). His 2010 report to the Ontario government on trades and apprenticeship led to the passage of legislation creating the Ontario College of Trades.
Mr. Armstrong currently serves as arbitrator and mediator by consensual, provincial and federal government appointment in the field of labour relations and is Chair of the Radiation Safety Institute of Canada and a member of the Ontario Press Council.
Mr. Armstrong received the Order of Ontario in 1995 in recognition of his contribution to public service in Ontario.
Anne Warner La Forest, LLB (UNB), LLM (Cantab)

Anne Warner La Forest was appointed Member of the Board in March 2007.
Ms. La Forest is currently a law professor at the University of New Brunswick. Member of the New Brunswick Securities Commission since 2004, she was also the Chair of the Commission's Human Resources Committee until June 2008 and was appointed Lead Member of the Commission in July of 2008.
After working in private practice with the firm of Fraser & Beatty in Toronto for several years, Ms. La Forest joined the Faculty of Law at Dalhousie University in 1991. In 1996, she was appointed Dean of the Faculty of Law of the University of New Brunswick, a position she held until 2004. A member of the bars of New Brunswick, Nova Scotia and Ontario, Ms. La Forest has extensive experience as an arbitrator and has acted as a consultant on matters relating to human rights, employment, property and extradition law. She has been a member of the Nova Scotia Human Rights Tribunal, a member of the Social Sciences and Humanities Research Council and Chair of the Fellowships Committee. She has also served as Arbitrator in the province of Nova Scotia as well as Commissioner of the province's Human Rights Commission. She is a Fellow of the Cambridge Commonwealth Society and is currently a member of the Board of Governors of the National Judicial Institute.
She holds an LL.M. degree in International Law from Cambridge University in the United Kingdom.
Ms. La Forest has published many articles, books and case comments during her career and has been the chair or has served as a panelist at many national and international law conferences.
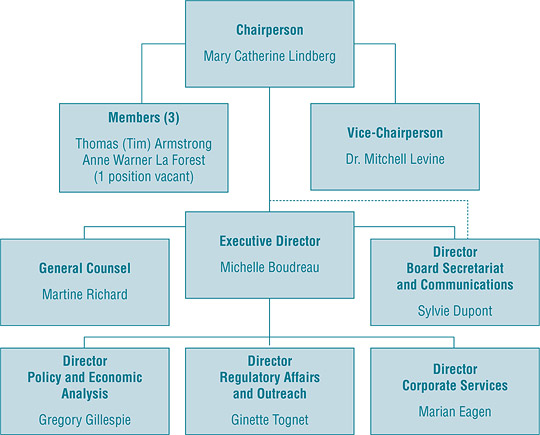
Organizational Structure and Staff
Executive Director
The Executive Director is responsible for overall advice to the Board and for the leadership and management of the Staff.
Regulatory Affairs and Outreach
The Regulatory Affairs and Outreach Branch reviews the prices of patented drug products sold in Canada to ensure that they are not excessive; encourages patentees to comply voluntarily with the Board's Guidelines; implements related compliance policies; and investigates complaints into the prices of patented medicines. This Branch also informs and educates patentees on the Board's Guidelines and filing requirements.
Policy and Economic Analysis
The Policy and Economic Analysis Branch develops policy advice and recommendations on possible changes to the Board's Guidelines and on other policy issues, as required; conducts research and economic analysis on pharmaceutical trends and prepares reports; and conducts studies both in support of compliance and enforcement and as directed by the Minister of Health.
Corporate Services
The Corporate Services Branch provides advice and services in relation to human resources management, facilities, health, safety and security, information technology and information management. It is also responsible for strategic and financial planning and reporting, audit and evaluation, and liaison with federal central agencies on these topics.
Board Secretariat and Communications
The Board Secretariat and Communications develops and manages the PMPRB's communications program, media relations and public enquiries; manages the Board's meeting and hearing processes, including the official record of proceedings; and coordinates activities pursuant to the Access to Information Act and the Privacy Act.
General Counsel
The General Counsel advises the PMPRB on legal matters and leads the prosecution team in proceedings before the Board.
The PMPRB operates with an annual budget of $12 million. Of this total budget, $3 million resides in a Special Purpose Allotment (SPA) reserved strictly for hearings. All unspent SPA funds must be returned to the Consolidated Revenue Fund.
Budget
The PMPRB operated with a budget of $12.1 million in 2010/11 and an approved staff level of 76 full-time equivalent employees.
Table 1 Budget and Staffing
| |
2009/10 |
2010/11 |
2011/12 |
| Total PMPRB |
$11,971 M |
$12,181 M |
$11,855 M |
| FTEs |
76 |
76 |
76 |
Of the total budget in 2010/11, $3.1 million resided in a Special Purpose Allotment reserved strictly for external costs of public hearings (legal counsel, expert witnesses, etc.). Any unspent funds were returned to the Consolidated Revenue Fund.
Communications and Outreach
The Communications Program is primarily responsible for planning and managing the PMPRB's external communications activities, as well as raising the organization's visibility and engaging with stakeholders. It focuses on adapting to the changing requirements of the PMPRB's operating environment by constantly evaluating its effectiveness and exploring alternate communications products. Information is exchanged in different forms, and through a variety of media, with consumers, provincial/territorial partners, industry and other stakeholders, and the media.
The main activities of the Communications Group include media relations; responding to public inquiries; publishing, including reporting on updates of Board proceedings and decisions; and providing strategic advice on communications.
Industry stakeholders are consulted and informed of changes in the operating environment. The Regulatory Affairs and Outreach Branch conducts outreach sessions with patentees and ensures that they are promptly informed of any updates to the regulatory process.
Publications
The PMPRB publishes the Annual Report and the quarterly NEWSletter in both print and electronic formats. Other publications, including NPDUIS research reports, are released in response to program and corporate requirements. Presentations given by Staff and Board Members, along with all other PMPRB publications, are available on the PMPRB website.
Regulating Prices of Patented Medicines
On January 1, 2010, the Board's new Guidelines came into force, providing direction to patentees and Board Staff on how to establish and maintain non-excessive prices for patented drug products sold in Canada. The PMPRB monitors and evaluates the application of the new Guidelines on an ongoing basis to assess the need for further changes.
Reporting Requirements
Patentees are required by law to file information pertaining to the sale of their drug products in Canada. The Patent Act (Act) along with the Patented Medicines Regulations (Regulations) set out the filing requirements, and Board Staff reviews the pricing information on an ongoing basis to ensure that the prices are not excessive. Patentees are required to file information with the PMPRB at introduction and then twice a year until the patent expires.
There are five factors used for determining whether a drug product is excessively priced, as outlined in section 85 of the Act. The Compendium of Policies, Guidelines and Procedures (Guidelines) details the various price tests used by Board Staff to determine whether a price charged by a patentee falls within the maximum allowable price. The Guidelines were developed in consultation with stakeholders including the provincial and territorial Ministers of Health, consumer groups, and the pharmaceutical industry. When an investigation determines that there is a problem with the price of a patented drug product, the patentee is offered the opportunity to voluntarily lower its price and/or offset its excess revenues through a Voluntary Compliance Undertaking (VCU). If the patentee disagrees with the results of the investigation and chooses not to submit a VCU, the Chairperson of the Board can issue a Notice of Hearing (NOH). After hearing the evidence, if the Board finds that the price is indeed excessive, it can issue an Order to reduce the price and/or offset the excess revenues.
A VCU may be jointly submitted by the patentee and Board Staff after the NOH has been issued.
The Act, the Regulations, the Guidelines and the Patentees' Guide to Reporting are posted on the PMPRB's website.
Failure to Report
The PMPRB relies upon the patentees' full and timely disclosure of any and all drug products being sold in Canada to which a patent pertains. In 2010, 11 new drug products were reported to the PMPRB for the first time even though they were patented and sold prior to 2010.
Table 2 lists the drug products that were patented and sold in Canada prior to being reported to the PMPRB.
Table 2 Failure to Report the Sale of Patented Drugs
| Currently sold by |
Brand name |
Generic name |
Year medicine came under PMPRB's jurisdiction |
| Baxter Corporation |
Clinoleic 20% |
Olive oil/soybean oil |
2007 |
| Baxter Corporation |
Procytox 25 mg/tablet |
Cyclophosphamide |
2003 |
| Baxter Corporation |
Procytox 50 mg/tablet |
Cyclophosphamide |
2003 |
| CSL Behring |
Humate-P 200/300 |
AHF factor/von Willebrand factor (human) |
2005 |
| CSL Behring |
Vivaglobin |
Immune globulin subcutaneous (human) |
2007 |
| CSL Behring |
Helixate FS 250 |
Antihemophilic factor (recombinant) |
2008 |
| CSL Behring |
Helixate FS 500 |
Antihemophilic factor (recombinant) |
2008 |
| CSL Behring |
Helixate FS 1000 |
Antihemophilic factor (recombinant) |
2008 |
| CSL Behring |
Helixate FS 2000 |
Antihemophilic factor (recombinant) |
2008 |
| CSL Behring |
Helixate FS 3000 |
Antihemophilic factor (recombinant) |
2008 |
| Pfizer Canada Inc. |
Lyrica 225 mg/capsule |
Pregabalin |
2009 |
Failure to File Price and Sales Data (Form 2)
Failure to file refers to the complete or partial failure of a patentee to comply with the regulatory filing requirements outlined in the Act and the Regulations. There were no Board Orders issued for failure to file in 2010.
Scientific Review
Human Drug Advisory Panel
All new patented drug products reported to the PMPRB are subject to a scientific evaluation as part of the price review process. The Human Drug Advisory Panel (HDAP) was established by the Board to provide independent expertise and advice to Board Staff. In particular, the HDAP identifies comparable drug products for use in the price tests and evaluates the level of therapeutic improvement of a new patented drug product compared to existing drug products for the same indication.
HDAP members base their recommendations on current medical and scientific knowledge and clinical practices. The HDAP is presently composed of 5 members:
- Dr. Jean Gray, Professor Emeritus of Medical Education, Medicine and Pharmacology at Dalhousie University
- Dr. Adil Virani, Director of Pharmacy Services at the Fraser Health Authority and Associate Professor in the Faculty of Pharmaceutical Sciences at the University of British Columbia
- Dr. Fred Y. Aoki, Professor of Medicine, Medical Microbiology and Pharmacology and Therapeutics at the University of Manitoba
- Dr. Jacques LeLorier, Professor in the Departments of Medicine and Pharmacology at the University of Montreal and Adjunct Professor in the Department of Epidemiology and Biostatistics at McGill University
- Dr. Muhammad Mamdani, Director of the Applied Health Research Centre, Li Ka Shing Knowledge Institute at St. Michael's Hospital, Toronto and Associate Professor in the Department of Health Policy, Management and Evaluation at the University of Toronto
Dr. Mitchell Levine was a member of HDAP until his appointment to Vice-Chairperson of the Board on March 3, 2011.
Price Review
The PMPRB reviews the average price of each strength of an individual dosage form of each patented medicine. In most cases, this unit is consistent with the Drug Identification Number (DIN) assigned by Health Canada at the time the drug is approved for sale in Canada.
New Patented Drug Products Reported to the PMPRB in 2010
For the purpose of this report, a new patented drug product in 2010 is defined as any patented drug product first sold in Canada, or previously sold but first patented, between December 1, 2009, and November 30, 2010.
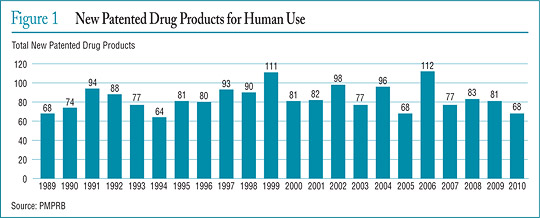
There were 68 new patented drug products for human use reported as sold in 2010. Some are one or more strengths of a new active substance and others are new presentations of existing medicines. Of the 68 DINs for new patented drug products, 3 (4.4%) were being sold in Canada prior to the issuance of the Canadian patent that brought them under the PMPRB's jurisdiction. The table below shows the year of first sale for these DINs.
The PMPRB reviews the average price of each strength of an individual dosage form of each patented medicine. In 2010, 68 new patented drug products for human use were reported to the PMPRB.
Table 3 Number of New Patented Drug Products for Human Use in 2010 by Year First Sold
| Year first sold |
No. of DINs |
| 2010 |
65 |
| 2009 |
2 |
| 2008 |
0 |
| 2007 |
1 |
| Total |
68 |
Figure 1 New Patented Drug Products for Human Use
The list of New Patented Medicines Reported to the PMPRB is posted on the website. This list includes information on the status of the review (e.g., whether the price of the medicine is under review, within the Guidelines, under investigation, or subject to a Voluntary Compliance Undertaking or Notice of Hearing).
Figure 1 illustrates the number of new patented drug products for human use reported to the PMPRB from 1989 to 2010.
Of the 68 new patented drug products
- the prices of 57 had been reviewed as of March 31, 2011:
- 48 were found to be within the Guidelines
- 2 were at levels that appeared to exceed the Guidelines by an amount which did not trigger the investigation criteria
- 7 were priced at levels that appeared to exceed the Guidelines and investigations were commenced
- the prices of 11 are still under review
A complete list of the 68 new patented drug products and their price review status appears in Appendix 2.
Price Review of Existing Patented Drug Products for Human Use in 2010
For the purpose of this report, existing patented drug products include all patented drug products that were first sold and reported to the PMPRB prior to December 1, 2009.
At the time of this report, there were 1128 existing patented drug products:
- 906 were within the Guidelines
- 133 exceeded the Guidelines by an amount that did not trigger the investigation criteria
- 78 were the subject of investigations
- 11 were opened as result of introductory pricing
- 4 in 2006
- 1 in 2007
- 5 in 2008
- 1 in 2009
- 67 were opened on the basis of year-over-year prices
- 2 additional drug products remained under investigation, although they were no longer patented in 2010
- 9 were still under review
- 2 were the subject of a price hearing under section 83 of the Act (see Hearings)
- 1 additional drug product remained the subject of a hearing, although it was no longer patented in 2010
A summary of the status of the price review of the new and existing patented drug products for human use in 2010 is provided in Table 4.
Table 4 Patented Drug Products for Human Use Sold in 2010 — Status of Price Review as of March 31, 2011
| |
New drug products introduced in 2010 |
Existing drug products |
Total |
| Total |
68 |
1128 |
1196 |
| Within Guidelines |
48 |
906 |
954 |
| Under Review |
11 |
9 |
20 |
| Does Not Trigger |
2 |
133 |
135 |
| Under Investigation |
7 |
78 |
85 |
| Price Hearings |
|
2 |
2 |
Update from the 2009 Annual Report
- Reviews of all of the 28 patented drug products for human use reported as under review in the 2009 Annual Report have been completed
- 62 of the 109 investigations reported in the 2009 Annual Report resulted in one of the following:
- the closure of the investigation where it was concluded that the price was within the Guidelines
- a Voluntary Compliance Undertaking (VCU) by the patentee to reduce the price and offset excess revenues through a payment and/or a reduction in the price of another patented drug product
- a public hearing to determine whether the price was excessive, including any remedial Order determined by the Board
Patented Over-the-Counter Drug Products and Patented Drug Products for Veterinary Use
In 2010, 81 patented over-the-counter drugs and 51 patented drugs for veterinary use were reported to the PMPRB. Board Staff will only review the price of a patented over-the-counter drug product or a patented veterinary drug product when a complaint has been received. No complaints were received in 2010.
Voluntary Compliance Undertakings and Hearings
Board Staff reviews the prices of all patented drug products sold in Canada. When it finds that the price of a patented drug product appears to exceed the Guidelines, and the circumstances meet the criteria for commencing an investigation, Board Staff will conduct an investigation to determine if the price of the patented drug product in fact exceeds the Guidelines. An investigation could result in one of the following:
- its closure where it is concluded that the price was within the Guidelines
- a Voluntary Compliance Undertaking (VCU) by the patentee to reduce the price and offset excess revenues obtained as a result of excessive prices through a payment and/or a price reduction of another patented drug product
- a recommendation from Board Staff to the Board Chair to issue a Notice of Hearing to hold a public hearing into the price of a patented medicine
Voluntary Compliance Undertakings
A Voluntary Compliance Undertaking (VCU) is a written undertaking by a patentee to comply with the Board's Guidelines including adjusting its price to a non-excessive level and offsetting excess revenues. Patentees are given an opportunity to submit a VCU when Board Staff concludes, following an investigation, that the price of a patented drug product sold in Canada appears to have exceeded the Guidelines. A VCU can also be submitted following the issuance of a Notice of Hearing, but at this point, must be approved by the Hearing Panel.
In 2010, the Board approved 12 VCUs and an amendment to the Andriol 2009 VCU. In the first quarter of 2011, the Board approved 4 VCUs.
Patentees are to ensure that the prices of their patented drug products remain within the Board's Guidelines in all periods in which the drug products remain under the PMPRB's jurisdiction.
Table 5 Voluntary Compliance Undertakings in 2010 up to May 31, 2011
VCUs in 2010
| Patented drug product |
Indication / use |
Patentee |
Date of approval |
Price reduction |
Excess revenues |
| Adenoscan |
Adjunct to thallium 201 myocardial perfusion scintigraphy in patients unable to exercise adequately |
Astellas Pharma Inc. |
May 2010 |
|
$34,545 |
| Andriol (amendment to original VCU) |
Replacement therapy in males in conditions associated with symptoms of deficiency or absence of endogenous testosterone |
Schering-Plough Canada Inc. |
July 2010 |
|
$2,286,633 |
| Busulfex |
Conditioning regimen prior to hematopoietic progenitor cell transplantation in combination with other chemotherapeutic agents and/or radiotherapy |
Otsuka America Pharmaceutical Inc. |
June 2010 |
|
$22,092 |
| Dicetel |
Treatment and relief of symptoms associated with irritable bowel syndrome, abdominal pain, bowel disturbances and intestinal discomfort; treatment of symptoms
related to functional disorders of the biliary tract |
Solvay Pharma Inc. |
May 2010 |
|
$31,287 |
| FASLODEX |
Hormonal treatment of locally advanced or metastatic breast cancer in post-menopausal women who have disease progression following prior endocrine therapy |
AstraZeneca |
June 2010 |
X |
$405,030 |
| FSME-IMMUN |
Immunization against the TBE virus in individuals 16 years and older who are at risk of contact with ticks that carry TBE virus |
Baxter Corporation |
March 2010 |
|
$53,579 |
| Levemir Penfill |
Treatment of adult patients with type 1 or type 2 diabetes mellitus who require a long-acting (basal) insulin for the maintenance of normal glucose homeostasis |
Novo Nordisk Canada Inc. |
May 2010 |
|
$6,468,240 |
| Miochol-E® |
To obtain miosis of the iris in seconds after delivery of the lens in cataract surgery, in penetrating keratoplasty, iridectomy and other anterior segment surgery where rapid miosis may be required |
Novartis Pharmaceuticals Canada Inc. |
September 2010 |
X |
$323,870 |
| Paxil CR |
Selective serotonin reuptake inhibitor in a new dosage form: controlled release tablets for the symptomatic treatment of depression and panic disorder |
GlaxoSmithKline Inc. |
March 2010 |
|
$53,178 |
| Tasigna® |
Treatment of accelerated phase Philadelphia chromosome positive chronic myeloid leukemia (CML) in adult patients resistant to or intolerant of at least one prior therapy including imatinib |
Novartis Pharmaceuticals Canada Inc. |
October 2010 |
X |
$545,365 |
| Vancocin |
Treatment of enterocolitis caused by Staphylococcus aureus (including methicillin-resistant strains) and antibiotic-associated pseudomembranous colitis caused by Clostridium difficile |
Iroko International LP |
July 2010 |
|
$263,442 |
| Voluven |
Treatment of hypovolemia when plasma volume is required |
Fresenius Kabi Canada |
January 2010 |
|
$1,448,002 |
| Xarelto |
Prevention of venous thromboembolic events in patients who have undergone elective hip or total knee replacement surgery |
Bayer Inc. |
January 2010 |
X |
$243,271 |
VCUs in 2011, up to May 31
| Patented drug product |
Indication / use |
Patentee |
Date of approval |
Price reduction |
Excess revenues |
| Abilify |
Treatment of schizophrenia and related psychotic disorders and for the acute treatment of manic or mixed episodes in Bipolar I Disorder |
Bristol-Myers Squibb Canada Co. |
February 2011 |
X |
$1,043,311* |
| Niaspan |
Treatment of elevated total cholesterol, low-density lipoprotein cholesterol, apolipoprotein B and triglyceride levels, and to increase high-density lipoprotein cholesterol in patients with primary hypercholesterolaemia and mixed dyslipidaemia when the response to diet and other non-pharmaceutical measures have been inadequate |
Sepracor Pharmaceuticals, Inc. |
May 2011 |
|
$76,554 |
| Suprane |
Inhalation agent for maintenance of general anesthesia |
Baxter Corporation |
April 2011 |
|
$43,659 |
| Technescan MAG3 |
Radiopharmaceutical agent used in the diagnosis of diseases |
Lantheus Medical |
May 2011 |
|
$34,800 |
* Excess revenues offset by way of price reduction only.
Hearings
In the event that the price of a patented medicine appears to be excessive, the Board can hold a public hearing, and if it finds that the price is excessive, it may issue an order to reduce the price and to offset revenues received as a result of the excessive price. Board decisions are subject to judicial review in the Federal Court of Canada.
In 2010, the Board issued one Notice of Hearing with respect to failure to file in the matter of Sandoz Canada Inc.
The Board issued decisions and/or orders effectively completing five matters: Adderall XR (Supplementary Order); Nicoderm; Penlac; Pentacel and Quadracel; and ratio-Salbutamol HFA.
Decisions are pending in three matters: Copaxone (redetermination), on price; ratiopharm Inc. and Sandoz Canada Inc., on failure to file. Two proceedings are ongoing: Apotex Inc., on failure to file, and Apo-Salvent CFC Free, on price.
Matters before the Federal Court
During the year, one Board decision was subject to Judicial Review by the Federal Court.
Pentacel and Quadracel, sanofi pasteur Limited
The Board issued a Notice of Hearing in this matter on March 27, 2007. The Hearing Panel issued its decision and reasons on December 21, 2009, and an Order on March 16, 2010. sanofi pasteur filed an Application for Judicial Review of the Board's decision. Release of the Federal Court decision is expected in June 2011.
Matter before the Supreme Court of Canada
Thalomid, Celgene Corporation
After a hearing in August 2007, the Board issued its decision in January 2008 asserting its jurisdiction over the price of Thalomid. The Board's decision was subsequently quashed by the Federal Court and then upheld by the Federal Court of Appeal. Celgene Corporation was granted leave to appeal to the Supreme Court of Canada.
The Supreme Court dismissed the appeal, confirming the Board's jurisdiction over the price of Thalomid. The decision recognized that the purpose of the Board's legislative mandate is the protection of consumers.
Summary
Excess revenues totalling $24.6 million were offset by way of payments to the Government of Canada through VCUs and Board Orders in 2010 up to May 31, 2011.
Since 1993, the Board has approved a total of 74 VCUs and initiated 25 public hearings. These measures resulted in price reductions and the offset of excess revenues by way of additional price reductions. In addition, approximately $110 million has been collected through VCUs and Board Orders by way of payments to the Government of Canada and/or to customers such as hospitals and clinics.
Table 6 Status of Board Proceedings in 2010 up to May 31, 2011
| Patented drug product |
Indication/use |
Patentee |
Issuance of Notice of Hearing |
Status |
Adderall XR
|
Treatment of attention deficit hyperactivity disorder (ADHD) |
Shire Canada Inc. |
January 18, 2006 Order: |
Supplementary Board May 5, 2010 |
| Apo-Salvent CFC Free |
Relief of chest tightness and wheezing caused by spasms or narrowing in the small air passages of the lungs |
Apotex Inc. |
July 8, 2008 |
Ongoing |
| Copaxone — Redetermination |
Use in ambulatory patients with relapsing–remitting multiple sclerosis to reduce the frequency of relapses |
Teva Neuroscience G.P.-S.E.N.C. |
May 8, 2006 Board |
Decision: Pending |
| Nicoderm |
Smoking cessation |
sanofi-aventis Canada Inc. |
April 20, 1999 |
Board Decision: April 9, 2010 |
| Penlac |
Part of a comprehensive nail management program in immunocompetent patients with mild to moderate onychomycosis of fingernails and toenails without lunula involvement |
sanofi-aventis Canada Inc. |
March 26, 2007 |
Board Decision: January 31, 2011 |
| Pentacel |
Routine immunization of all children between 2 and 59 months of age against diphtheria, tetanus, whooping cough (pertussis), poliomyelitis and Haemophilus influenzae type b disease. It is sold in Canada in the form of a reconstituted product for injection combining one single dose vial of Act-HIB (lyophilized powder for injection) and one single (0.5 mL) dose ampoule of Quadracel (suspension for injection) |
sanofi pasteur Limited |
March 27, 2007 |
Board Order: March 16, 2010 Excess revenues for Pentacel & Quadracel: $2,512,878 Federal Court of Canada Hearing: February 16–17, 2011 |
| Quadracel |
Primary immunization of infants, at or above the age of 2 months, and as a booster in children up to their 7th birthday against diphtheria, tetanus, whooping cough (pertussis) and poliomyelitis |
sanofi pasteur Limited |
March 27, 2007 |
Federal Court of Canada Decision:Pending |
| ratio-Salbutamol HFA |
Relief of chest tightness and wheezing caused by spasms or narrowing in the small air passages of the lungs |
ratiopharm Inc. |
July 18, 2008 |
Board Decision: May 27, 2011 Board Order: Pending |
VCUs in 2010
| Patentee |
Issue |
Date of Notice of Application |
Status |
| Apotex Inc. |
Failure to file (jurisdiction) |
March 3, 2008 |
Ongoing |
| ratiopharm Inc. |
Failure to file (jurisdiction) |
August 28, 2008 |
Board Decision: Pending |
| Sandoz Canada Inc. |
Failure to file (jurisdiction) |
March 8, 2010 |
Board Decision: Pending |
Key Pharmaceutical Trends
In 2010, sales of patented drug products declined to $12.9 billion from $13.3 billion in 2009, a decrease of 3.4%.
Trends in Sales of Patented Drug Products
Patentees are required under the Patented Medicines Regulations (Regulations) to submit detailed information on their sales of patented drug products, including quantities sold and net revenues received for each product by class of customer in each province/territory. The PMPRB uses this information to analyze trends in sales, prices and utilization of patented drug products.1 This section provides key statistical results from this analysis.
In 2010, sales of patented drug products declined to $12.9 billion from $13.3 billion in 2009, a decrease of 3.4%.
Sales and Prices
Canadians spend much more today on patented drug products than they did a decade ago, but it is important to understand that an increase in drug spending does not in itself imply rising drug prices. The PMPRB's Annual Reports from 1995 through 2003 noted that sales of patented drug products grew at annual rates consistently exceeding 10%, while average annual rates of change for prices were less than 1%. In these instances, sales growth was driven by changes in the volume and composition of drug utilization.
A variety of factors can produce such changes. These include:
- increases in total population
- changes in the demographic composition of the population (for example, shifts in the age distribution toward older persons with more health problems)
- increases in the incidence of health problems requiring drug therapy
- changes in the prescribing practices of physicians (for example, shifts away from older, less expensive drug products to newer, more expensive medications, or a shift toward higher, more frequent dosages)
- increases in the use of drug therapy instead of other forms of treatment
- the use of new drug products to treat conditions for which no effective treatment existed previously
Sales Trends
Table 7 reports patentees' total sales of patented drug products in Canada for 1990 through 2010. Sales of patented drug products declined to $12.9 billion from $13.3 billion in 2010, a decrease of 3.4%. By comparison, the annual growth in sales stood at 27.0% in 1999 and remained in double-digits until 2003.
The third column of Table 7 gives sales of patented drug products as a share of overall drug sales. This share rose from 43.2% in 1991 to 72.7% in 2003. It has declined since 2003, implying that sales of non-patented branded and generic drug products have grown faster than sales of patented drug products in recent years.
Drivers of Sales Growth
Table 8 decomposes the sales growth that occurred between 2009 and 2010 into distinct elements reflecting the impacts of:
- previously patented drug products that have gone off-patent or left the Canadian market (“exiting drug effect”)
- patented drug products introduced to the Canadian market in 2010 (“new drug effect”)
- changes in prices among patented drug products with sales in Canada in both 2009 and 2010 (“price effect”)
- differences in the quantities of such drug products sold in the two years (“volume effect”)
- interactions of price and quantity changes (“cross effect”)
Table 7 Sales of Patented Drug Products, 1990–2010
| Year |
Patented drug products
Sales ($billions) |
Patented drug products
Change (%) |
Sales of drug product share of all drug sales (%)* |
| 2010 |
12.9 |
-3.4 |
58.0 |
| 2009 |
13.3 |
3.3 |
65.5 |
| 2008 |
12.9 |
5.0 |
64.7 |
| 2007 |
12.3 |
3.3 |
63.2 |
| 2006 |
11.9 |
3.6 |
67.8 |
| 2005 |
11.5 |
4.7 |
70.6 |
| 2004 |
11.0 |
8.6 |
72.2 |
| 2003 |
10.2 |
14.3 |
72.7 |
| 2002 |
8.9 |
17.5 |
67.4 |
| 2001 |
7.6 |
18.9 |
65.0 |
| 2000 |
6.3 |
16.7 |
63.0 |
| 1999 |
5.4 |
27.0 |
61.0 |
| 1998 |
4.3 |
18.9 |
55.1 |
| 1997 |
3.7 |
22.6 |
52.3 |
| 1996 |
3.0 |
12.8 |
45.0 |
| 1995 |
2.6 |
10.8 |
43.9 |
| 1994 |
2.4 |
-2.1 |
40.7 |
| 1993 |
2.4 |
9.4 |
44.4 |
| 1992 |
2.2 |
14.0 |
43.8 |
| 1991 |
2.0 |
13.1 |
43.2 |
| 1990 |
1.7 |
— |
43.2 |
Sources: PMPRB and IMS Health
* The denominator in this ratio comprises sales of patented, non-patented brand and generic drug products. Starting with the estimate for 2005, this value is derived from data contained in IMS Health's MIDAS database. In previous years, IMS data were used to calculate sales of generic drug products only, while sales of non-patented brand products were estimated from data submitted by patentees. This approach was abandoned because of anomalies related to year-to-year changes in the set of companies reporting to the PMPRB. Ratios reported for years before 2005 likely overstate the patented share, but by only a small amount. This small bias in no way invalidates the strong upward trend evinced by the results for the years 1990 through 2004.
Table 8 Decomposition of Changes in Sales of Patented Drug Products
| |
Total change |
Exiting drug effect |
New drug effect |
Price effect |
Volume effect |
Cross effect |
Net revenue impact,
2010/2009 ($millions) |
-456.7 |
-243.6 |
138.6 |
-50.0 |
-332.6 |
30.9 |
Proportion of Total Change,
2010/2009 (%) |
100.0 |
53.3 |
-30.3 |
11.0 |
72.8 |
-6.8 |
Average proportion of total
change, 2005–2009 (%) |
100.0 |
-42.5 |
38.9 |
1.2 |
101.7 |
0.8 |
Source: PMPRB
The first row of Table 8 gives these impacts as dollar amounts. The second row expresses the impacts as proportions of the overall change in sales between 2009 and 2010. For the sake of comparison, the third row provides average year-over-year proportionate impacts for 2005 through 2009.2
The results in this table show that the decline in sales that occurred between 2009 and 2010 was principally the result of drug products going off-patent and declines in the quantities of patented drug products sold. They reflect the number of patents that expired partway through 2010. Price decreases among existing patented products accounted for 11.0% of the decrease in expenditures.
The pronounced decline in rates of sales growth over the last few years is a striking development. Figure 2 breaks down 2010 sales of patented drug products according to the year in which the product was first sold in Canada. Throughout the latter part of the 1990s, sales growth was largely driven by a succession of new “blockbuster” products that ultimately achieved very high sales volumes: despite the patent expiries noted above, these products still accounted for a substantial share of sales in 2010. Since the beginning of the 2000s, high-volume products have not been introduced in sufficient numbers to sustain the double-digit sales growth seen in the previous decade.
Figure 2 Share of 2010 Sales of Patented Drug Products by Year of Introduction
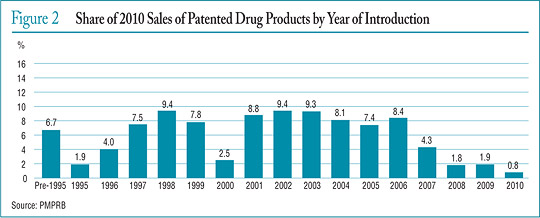
The pronounced decline in rates of sales growth over the last few years is a striking development. Figure 2 breaks down 2010 sales of patented drug products according to the year in which the product was first sold in Canada. Throughout the latter part of the 1990s, sales growth was largely driven by a succession of new “blockbuster” products that ultimately achieved very high sales volumes: despite the patent expiries noted above, these products still accounted for a substantial share of sales in 2010. Since the beginning of the 2000s, high-volume products have not been introduced in sufficient numbers to sustain the double-digit sales growth seen in the previous decade.
Table 9 Sales of Patented Drug Products by Major Therapeutic Class, 2010
| Therapeutic class |
2010 sales ($millions) |
Share: 2010 sales (%) |
Growth: 2010/2009 ($millions) |
Growth: 2010/2009 (%) |
Impact on change in expenditure (%) |
| A: Alimentary tract and metabolism |
1,022.8 |
7.9 |
-129.7 |
-11.3 |
28.4 |
| B: Blood and blood forming organs |
876.6 |
6.8 |
3.9 |
0.4 |
-0.8 |
| C: Cardiovascular system |
2,595.3 |
20.1 |
-672.3 |
-20.6 |
147.4 |
| D: Dermatologicals |
83.8 |
0.6 |
-20.2 |
-19.4 |
4.4 |
| G: Genito-urinary system and sex hormones |
544.5 |
4.2 |
-1.5 |
-0.3 |
0.3 |
| H: Systemic hormonal preparations |
107.0 |
0.8 |
12.1 |
12.8 |
-2.7 |
| J: General antiinfectives for systemic use; and P: Antiparasitic products* |
1,296.1 |
10.0 |
-63.7 |
-4.7 |
14.0 |
L: Antineoplastics and immunomodulating
agents |
2,685.1 |
20.8 |
298.6 |
12.5 |
-65.5 |
| M: Musculo-skeletal system |
475.7 |
3.7 |
-48.9 |
-9.3 |
10.7 |
| N: Nervous system |
1,689.3 |
13.1 |
49.9 |
3.0 |
-10.9 |
| R: Respiratory system |
1,111.4 |
8.6 |
41.2 |
3.9 |
-9.0 |
| S: Sensory organs |
382.4 |
3.0 |
79.0 |
26.0 |
-17.3 |
| V: Various |
57.2 |
0.4 |
-4.5 |
-7.3 |
1.0 |
| All therapeutic classes |
12,927.2 |
100.0 |
-456.1 |
-3.4 |
100.0 |
* These groups have been combined for reasons of confidentiality.
Source: PMPRB
Sales by Therapeutic Class
The PMPRB classifies drug products according to the World Health Organization's (WHO) Anatomical Therapeutic Chemical (ATC) system when it conducts analyses at the level of therapeutic class. This is a hierarchical system that classifies drug products according to their principal therapeutic use and chemical composition. At its first level of aggregation (Level 1), the ATC system classifies drug products according to the element of human anatomy with which they are primarily associated.
Table 9 breaks out sales of patented drug products in Canada in 2010 by major therapeutic class, defined by ATC Level 1. The table gives the 2010 sales for each class, the share of the total sales this represents and the rate at which sales grew relative to 2009. Values in the last column represent the component of overall sales growth attributable to drug products in the corresponding therapeutic class.3 By this measure, antineoplastics and immunomodulating agents made the largest positive contribution to sales growth. This contribution was more than offset by the declining sales of patented drug products related to the cardiovascular system and, secondarily, the alimentary tract and metabolism classes.
1 All statistical results for patented drug products reported in this chapter are based on data submitted by patentees as of April 2011. On occasion, patentees report revisions to previously submitted data or provide data not previously submitted. New data of this sort can appreciably affect the statistics in this chapter. To account for this possibility, the PMPRB has adopted the practice of reporting recalculated sales figures (page 16, Trends in Sales of Patented Drug Products), price and quantity indices (page 19, Price Trends; and page 27, Utilization of Patented Drug Products) and foreign-to- Canadian price ratios (page 23, Comparison of Canadian Prices to Foreign Prices) for the 5 years preceding the current Annual Report year. All such recalculated values reflect currently available data. Consequently, where data revisions have occurred, values reported here may differ from those presented in earlier Annual Reports.
2 Under the scheme applied here, the “exiting drug effect” is the amount of 2010 sales generated by drug products that were under the PMPRB's jurisdiction in 2009 but not in 2010. The “new drug effect” is the amount of 2010 sales generated by drug products that were under the PMPRB's jurisdiction in 2010 but not in 2009. Other effects are derived by means of the relationship:

where py (i ) is the price of drug i in year y, qy (i ) is the physical volume of drug i sold in year y and Ó signifies summation over the set of drug products that were under the PMPRB's jurisdiction in both 2009 and 2010. The left-hand-side of this equation represents the change in total sales of such products between 2009 and 2010. The three terms of the right-hand-side define the volume, price and cross effects, respectively, reported in Table 8.
3 This is obtained as the ratio of the year-over-year change in the dollar value of sales for the therapeutic class in question to the change in sales across all patented drug products.
Price Trends
The PMPRB uses the Patented Medicines Price Index (PMPI) to monitor trends in prices of patented drug products. The PMPI measures the average year-over-year change in the ex-factory prices of patented drug products sold in Canada. The index is constructed using a formula that takes a sales-weighted average of price changes observed at the level of individual drug products.4 This is similar to the approach Statistics Canada uses to construct the Consumer Price Index (CPI). The PMPI is updated every six months using price and sales information submitted by patentees.
As measured by the PMPI, prices of patented drug products declined, on average, by 0.4% between 2009 and 2010.
It is important to understand the conceptual relationship between the PMPI and drug costs. The PMPI does not measure changes in the utilization of patented drug products; a quantity index, the PMQI, is calculated for this purpose (see page 27, Utilization of Patented Drug Products). The PMPI does not measure the cost impact of changes in prescribing patterns or the introduction of new medicines. By design, the PMPI isolates the component of sales growth attributable to changes in prices.
Figure 3 provides year-over-year changes in the PMPI for the years 1988 through 2010. As measured by the PMPI, prices of patented drug products declined, on average, by 0.4% between 2009 and 2010.
The Act requires the PMPRB to consider changes in the Consumer Price Index (CPI), among other factors, in determining whether the price of a patented drug product is excessive. Figure 4 plots year-over-year rates of change in the PMPI against corresponding changes in the CPI. General price inflation, as measured by the CPI, has exceeded the average increase in patented drug prices almost every year since 1988. In 2010, the CPI rose by 1.8%, while the PMPI fell by 0.4%.
It is not surprising that the PMPI has seldom kept pace with the CPI. The PMPRB's Guidelines allow the price of a patented drug product to rise by no more than the CPI over any three-year period. (The Guidelines also impose a cap on year-over-year price increases equal to one-and-one-half times the current year rate of CPI inflation.) This effectively establishes CPI inflation as an upper bound on the amount by which individual prices may rise over any period of three years or more.5 Increases in the PMPI normally do not reach this upper bound because some patentees do not raise their prices by the full amount permitted under the Guidelines, or choose to reduce their prices.
Figure 3 Annual Rates of Change, Patented Medicines Price Index (PMPI), 1988–2010
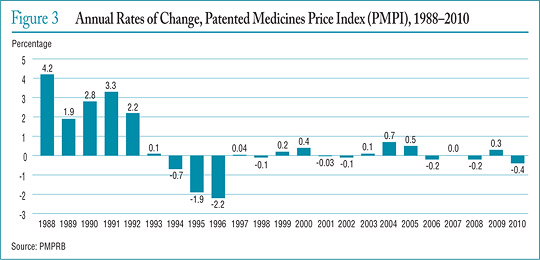
Figure 4 Annual Rate of Change, Patented Medicines Price Index (PMPI) and Consumer Price Index (CPI), 1988–2010
Figure 5 Annual Rate of Change, Patented Medicines Price Index (PMPI), by Class of Customer, 2007–2010
Price Change by Therapeutic Class
Table 10 provides average rates of price change among patented drug products at the level of major therapeutic classes. Results in this table were obtained by applying the PMPI methodology to data segregated by their ATC Level I class. The last column provides a decomposition of overall PMPI change, with each entry representing the component of the overall change attributable to drug products in the corresponding therapeutic class. By this measure, the slight overall decrease in the PMPI of 0.4% reflects a general state of price stability across therapeutic classes. Note that only therapeutic class G saw an average rate of price increase that exceeded CPI inflation.6
Table 10 Change in the Patented Medicines Price Index (PMPI) by Major Therapeutic Class, 2010
| Therapeutic class |
Share: 2010 sales (%) |
Price change: 2009 to 2010 (%) |
Contribution: change in PMPI(%) |
| A: Alimentary tract and metabolism |
7.9 |
0.1 |
0.0 |
| B: Blood and blood forming organs |
6.8 |
-1.7 |
-0.1 |
| C: Cardiovascular system |
20.1 |
-0.1 |
0.0 |
| D: Dermatologicals |
0.6 |
1.2 |
0.0 |
| G: Genito-urinary system and sex hormones |
4.2 |
2.7 |
0.1 |
| H: Systemic hormonal preparations |
0.8 |
-0.3 |
0.0 |
| J: General Antiinfectives for systemic use; and P: Antiparasitic products* |
10.0 |
-1.1 |
-0.1 |
| L: Antineoplastics and immunomodulating agents |
20.8 |
0.5 |
0.1 |
| M: Musculo-skeletal system |
3.7 |
-0.1 |
0.0 |
| N: Nervous system |
13.1 |
0.3 |
0.0 |
| R: Respiratory system |
8.6 |
-0.7 |
-0.1 |
| S: Sensory organs |
3.0 |
0.1 |
0.0 |
| V: Various |
0.4 |
-0.9 |
0.0 |
| All therapeutic classes |
100.0 |
-0.4 |
-0.4 |
* These groups have been combined for reasons of confidentiality.
Source: PMPRB
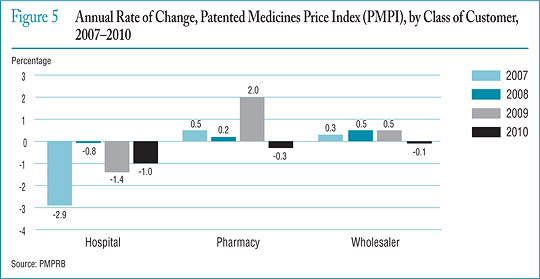
Price Change by Class of Customer
Figure 5 presents average rates of price change by class of customer.7 These results were obtained by applying the PMPI methodology separately to sales data for hospital, pharmacy and wholesale customers.8 The 2010 rates of price change for these classes were, respectively, -1.0%, -0.3% and -0.1%.
Price Change by Province/Territory
Figure 6 (see page 22) presents average annual rates of price change by province/territory, obtained by applying the PMPI methodology to sales data segregated by the province/territory in which the sale occurred. These results indicate that, between 2009 and 2010, prices of patented drug products in Nova Scotia, New Brunswick, Ontario, Saskatchewan, Alberta, the Northwest Territories and the Yukon fell on average. The largest average price increase occurred in Prince Edward Island (7.7%).
Figure 6 Annual Rate of Price Change by Province/Territory, by Class of Customer, 2010
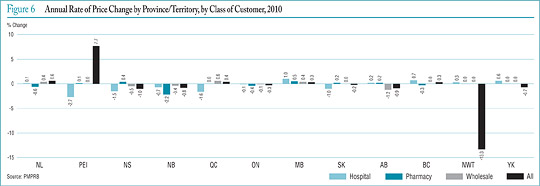
Figure 7 Average Ratio of 2010 Price to Introductory Price by Year of Introduction
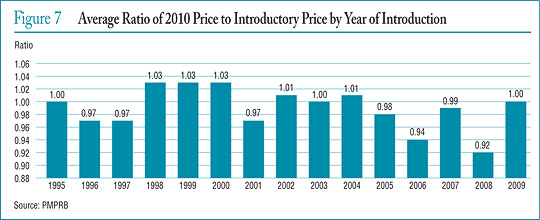
Price Behaviour After Introduction
Does the price of a typical patented drug product change much in the years after it enters the Canadian market? To answer this question, Figure 7 provides the average ratio of the 2010 price to introductory price (the price at which the drug product was sold in its first year on the Canadian market). The figure provides a separate average ratio for drug products introduced in 1995, those introduced in 1996, and so forth.
The results in Figure 7 imply no consistent tendency for prices to either rise or fall after introduction, with the 2010 price of a typical patented drug product being within a few percentage points of its introductory price, regardless of when it was introduced to the Canadian market.9
Price Change by Country
In accordance with the Act and the Regulations, patentees must report publicly available prices of patented drug products for seven foreign comparator countries: France, Germany, Italy, Sweden, Switzerland, the United Kingdom and the United States.
The PMPRB uses this information to
- conduct the international price comparison tests specified in its Guidelines
- compare the Canadian prices of patented drug products to those prevailing in other countries
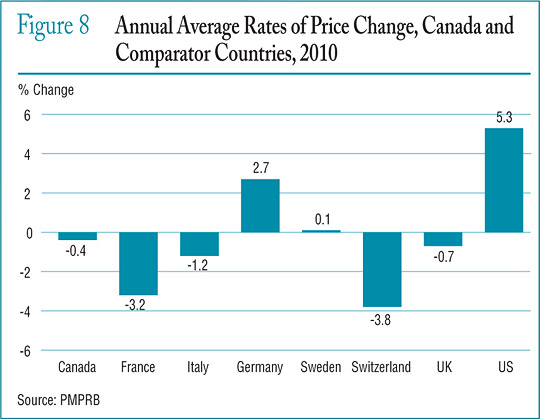
Figure 8 gives the average annual rates of price change for Canada and each of the seven comparator countries. These results were obtained by applying the PMPI methodology (with weights based on Canadian sales patterns) to the international price data that patentees have submitted to the PMPRB. Note that results for the United States are based on prices that incorporate prices from the US Federal Supply Schedule (FSS).10
The results in Figure 8 indicate that in 2010, the United States saw prices rise on average at a rate of 5.3%. Germany and Sweden saw much more modest average price increases, while prices in France, Italy, Switzerland and the United Kingdom declined slightly.
Figure 8 Annual Average Rates of Price Change, Canada and Comparator Countries, 2010
4 These calculations are performed at the level defined by Health Canada's Drug Identification Number (DIN). Each DIN represents a unique combination of active ingredient(s), dosage form, strength(s), brand and manufacturer.
5 It is possible for individual prices (or, for that matter, the PMPI) to rise by more than the CPI in a given year. This can occur when patentees have banked price adjustments in the preceding two years. It can also occur when the forecast rate of CPI inflation exceeds the actual rate. To facilitate and encourage compliance by patentees, the PMPRB's CPI-Adjustment Methodology uses the forecast rate of CPI inflation published by the Department of Finance. Patentees must satisfy the PMPRB's priceadjustment rules based on calculations incorporating either the forecast or actual rate of CPI inflation for the year in question. This raises the possibility of price increases exceeding CPI inflation whenever forecast CPI inflation exceeds actual CPI inflation. Note that this will not be a permanent gain to the patentee, as the PMPRB's three-year price-adjustment rule will eventually bring cumulative price increase back into line with cumulative (actual) CPI inflation.
6 Suppose R represents the overall rate of change in the PMPI. Suppose there are N therapeutic classes, indexed by 1, 2 … N. Let R(i ) represent the average rate of price change in major therapeutic class i obtained by means of the PMPI methodology. Using the fact that R is a sales-weighted average of price changes taken over all patented drug products, it is easy to derive the following relationship:
R = w(1) x R(1) + w(2) x R(2) + … + w(N ) x R(N ),
where w(i ) represents the share of therapeutic class i in the sales of patented drug products. This relationship provides the basis for the decomposition in the last column of Table 10. Each term on its right-hand-side multiplies the average rate of price change for a given therapeutic class by its share of overall sales. The resulting value is readily interpreted as the contribution of the corresponding class to the change in the overall PMPI. Note that the size of this contribution depends on both the rate of price change specific to the class and its relative importance, as measured by its share of sales.
The decomposition in Table 10 is approximate. This is because the weights used to calculate the contribution of each therapeutic class are based on annual sales data, whereas rates of price change (whether overall or by therapeutic class) are calculated from data covering six-month reporting periods. The resulting discrepancy is normally small.
7 Sales of patented drug products are dominated by sales to wholesalers, which accounted for 80.0% of all sales in 2010. Sales to hospitals accounted for another 8.7%, while direct sales to pharmacies accounted for 4.3%. The pharmacy share has fallen precipitously since 2001, when it stood at 20.1%.
8 Results for a fourth class of customer, “Others”, are not provided. This class accounted for about 7.1% of patented drug sales in 2010. Buyers in this class are principally health care institutions other than hospitals, such as clinics and nursing homes. It also includes direct sales to governments. The composition of this class is thought to vary substantially from one year to the next, rendering any analysis of price change in this class of limited value.
9 It must be emphasized that this statement refers to the behaviour of prices on average. There are undoubtedly instances where individual prices have risen or fallen substantially since introduction.
10 The pharmaceutical industry in the US has argued that the publicly available prices in that country do not reflect actual prices because of confidential discounts and rebates. Effective January 2000, and following public consultation, the PMPRB began including prices listed in the US Federal Supply Schedule (FSS) in calculating the average US price of patented drug products. The FSS prices are negotiated between manufacturers and the US Department of Veterans' Affairs. They are typically less than other publicly available US prices reported to the PMPRB by patentees.
Comparison of Canadian Prices to Foreign Prices
Tables 11 and 12 (see pages 24 and 25) provide detailed statistics comparing the foreign prices of patented drug products to their Canadian prices. Each table provides two sets of average price ratios. These are differentiated according to the method by which foreign prices were converted to their Canadian dollar equivalents. The tables also give the numbers of drug products (DINs) and the volume of sales encompassed by each reported price ratio.11
The average price ratios given in Tables 11 and 12 are sales-weighted arithmetic means of price ratios obtained for individual drug products, with weights based on Canadian sales patterns. Average price ratios constructed in this way provide exact answers to questions of the type:
How much more/less would Canadians have paid for the patented drug products they purchased in 2010 had they paid Country X prices rather than Canadian prices?
For example, Table 11 states that the 2010 average French-to-Canadian price ratio was 0.90. This means Canadians would have paid 10% less for the patented drug products they purchased in 2010 had they bought these products at French prices.
For many years, the PMPRB has reported average foreign-to-Canadian price ratios with foreign prices converted to their Canadian dollar equivalents by means of market exchange rates. (More exactly, the 36-month moving averages of market rates the PMPRB normally uses in applying its Guidelines.) Table 11 also reports foreign-to-Canadian price ratios with currency conversion at purchasing power parity (PPP). The PPP between any two countries measures their relative costs of living expressed in units of their own currencies. In practice, cost of living is determined by pricing out a standard “basket” of goods and services at the prices prevailing in each country. Because PPPs are designed to represent relative costs of living, they offer a simple way to account for differences in overall national price levels when comparing individual prices, incomes and other monetary values across countries. When applied to the calculation of average foreign-to-Canadian price ratios they produce statistics answering questions of the type:
How much more/less consumption of other goods and services would Canadians have sacrificed for the patented drug products they purchased in 2010 had they lived in Country X?
Questions of this type cannot be answered by simply comparing drug prices. Rather, one must first calculate what each price represents in terms of goods and services foregone. PPPs are designed for such purposes.
Bilateral Comparisons
Table 11 provides bilateral comparisons of prices in each of the PMPRB's seven comparator countries to corresponding Canadian prices. Focusing on the results with currency conversion at market exchange rates, it appears that, as in previous years, Canadian prices were typically within the range of prices observed among the comparator countries. Canadian prices were roughly in line with Swedish and Swiss prices. Prices in France, Italy and the United Kingdom were appreciably lower than Canadian prices, those in Germany substantially higher. As in previous years, prices reported for the United States were much higher than prices in Canada or any other comparator country.
Table 11 Average Foreign-to-Canadian Price Ratios, Bilateral Comparisons, 2010
At Market Exchange Rates
| |
Canada |
France |
Italy |
Germany |
Sweden |
Switzerland |
United Kingdom |
United States |
| Average price ratio |
1.00 |
0.90 |
0.87 |
1.20 |
0.98 |
1.03 |
0.86 |
1.91 |
| Number of patented drug products |
1,193 |
733 |
815 |
866 |
855 |
813 |
854 |
1,021 |
| Net revenues ($millions) |
12,927.2 |
10,877.2 |
11,085.0 |
11,465.0 |
11,304.2 |
11,277.4 |
11,128.4 |
12,347.1 |
At Purchasing Power Parities
| |
Canada |
France |
Italy |
Germany |
Sweden |
Switzerland |
United Kingdom |
United States |
| Average price ratio |
1.00 |
0.85 |
0.88 |
1.22 |
0.91 |
0.80 |
0.90 |
2.31 |
| Number of patented drug products |
1,193 |
733 |
815 |
866 |
855 |
813 |
854 |
1,021 |
| Net revenues ($millions) |
12,927.2 |
10,877.2 |
11,085.0 |
11,465.0 |
11,304.2 |
11,277.4 |
11,128.4 |
12,347.1 |
Source: PMPRB
Average price ratios obtained with currency conversion at PPPs, provided at the bottom of Table 11, tell a somewhat different story. When international differences in cost of living are accounted for, it appears Canadians incurred a substantially larger consumption cost for the patented drug products they purchased in 2010 than did residents of every other comparator country except Germany and the United States.
Figure 9 puts these results in historical perspective. In 2005, Canadian prices were, on average, approximately equal to or below corresponding prices in all comparators other than Italy. By 2010, Canadian prices were decidedly above prices in the United Kingdom and France, as well as Italy.
Figure 9 Average Foreign-to-Canadian Price Ratios: 2005, 2010
Multilateral Price Comparisons
Table 12 provides average foreign-to-Canadian price ratios using several multilateral measures of foreign prices. The median international price (MIP) is the median of prices observed among the seven comparator countries. Other multilateral price ratios compare the minimum, maximum and simple mean of foreign prices to their Canadian counterparts.
Table 12 Average Foreign-to-Canadian Price Ratios, Multilateral Comparisons, 2010
At Market Exchange Rates
| |
Median |
Minimum |
Maximum |
Mean |
| Average price ratio |
1.06 |
0.80 |
2.04 |
1.18 |
| Number of patented drug products |
1,144 |
1,144 |
1,144 |
1,144 |
| Net revenues ($millions) |
12,707.0 |
12,707.0 |
12,707.0 |
12,707.0 |
At Purchasing Power Parities
| |
Median |
Minimum |
Maximum |
Mean |
| Average price ratio |
1.02 |
0.80 |
2.37 |
1.22 |
| Number of patented drug products |
1,144 |
1,144 |
1,144 |
1,144 |
| Net revenues ($millions) |
12,707.0 |
12,707.0 |
12,707.0 |
12,707.0 |
Source: PMPRB
Figure 10 Average Ratio of Median International Price (MIP) to Canadian Price, at Market Exchange Rates, 2001–2010
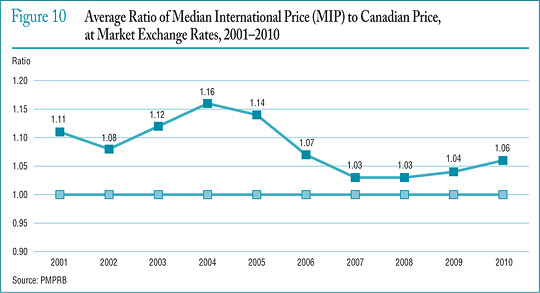
Figure 11 Range Distribution, Sales, by Median International Price (MIP)-to-Canadian Price Ratio, 2010
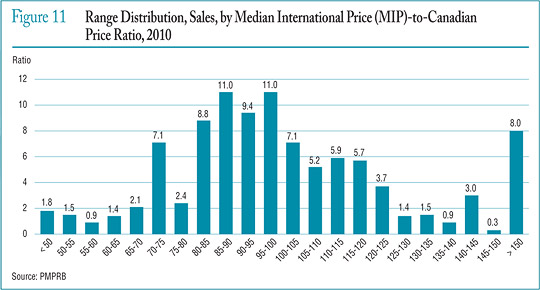
Focusing again on results at market exchange rates, the average MIP-to-Canadian price ratio stood at 1.06 in 2010. (The corresponding value for 2009 was 1.04.) Results obtained with other multilateral measures are much as one would expect. Note that mean foreign prices produce higher foreign-to-Canadian price ratios than do MIPs. This is readily explained by the influence of US prices, which are typically much higher than prices elsewhere: although US prices nearly always figure importantly in determining mean foreign price they almost never emerge as median international prices.
Figure 10 (see page 25) puts these results in historical perspective, giving a history of the average MIP-to-Canadian price ratio from 2001 to 2010. Although there has been considerable movement in the ratio over this period, it has remained above parity.
Figure 11 offers more detail on the product-level MIP-to-Canadian ratios underlying the averages reported in Table 12 (see page 25). This figure distributes the 2010 sales of each patented drug product according to the value of its MIP-to-Canadian price ratio (more exactly, according to the range into which the ratio fell).12 These results show substantial dispersion in product-level price ratios: while patented drug products with MIP-to-Canadian price ratios between 0.90 and 1.10 accounted for 32.7% of sales, those with ratios less than 0.90 accounted for 37.0% of sales, and products with ratios exceeding 1.10 accounted for 30.2%.
11 The number of drug products and sales these ratios encompass vary because it is not always possible to find a matching foreign price for each patented drug product sold in Canada. Note that all of the bilateral average price ratios reported in Table 11 (see page 24) combined represent at least 84% of 2010 Canadian sales, while the multilateral ratios in Table 12 (see page 25) cover over 98%.
12 To produce the results represented in this figure, foreign prices were converted to their Canadian-dollar equivalents at market exchange rates.
Utilization of Patented Drug Products
The price and sales data used to calculate the PMPI also allow the PMPRB to examine trends in the quantities of patented drug products sold in Canada. The PMPRB maintains the Patented Medicines Quantity Index (PMQI) for this purpose. Figure 12 provides average rates of utilization growth, as measured by the PMQI, from 1988 through 2010. These results confirm that in recent years, growth in the utilization of patented drug products has been the primary source of rising sales, with rates of utilization growth roughly tracking sales growth. This tracking pattern continued in 2010, with the utilization of patented drug products declining by 1.8% and sales declining by 3.4%.
Utilization Growth by Therapeutic Class
Table 13 provides average rates of utilization growth among patented drug products at the level of major therapeutic classes. The results in this table were obtained by applying the PMQI methodology to data segregated by ATC Level I class. As in Table 10 (see page 21), the last column provides an approximate decomposition of overall PMQI change into contributions attributable to each therapeutic class.
In 2010, levels of utilization remained the same or rose in all but two therapeutic classes, with the cardiovascular system class seeing a substantial decline in utilization. A single class, antineoplastics and immunomodulating agents, accounted for most of the growth in overall utilization. Drug products in the sensory organs class also contributed appreciably to utilization growth.
Figure 12 Annual Rate of Change, Patented Medicines Quantity Index (PMQI), 1988–2010
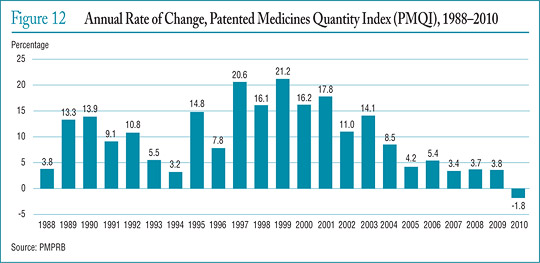
Table 13 Change in the Patented Medicines Quantity Index (PMQI) by Major Therapeutic Class, 2010
| Therapeutic class |
Share: 2010 sales (%) |
Price change: 2009 to 2010 (%) |
Contribution: Change in PMQI (%) |
| A: Alimentary tract and metabolism |
7.9 |
-1.3 |
-0.1 |
| B: Blood and blood forming organs |
6.8 |
1.6 |
0.1 |
| C: Cardiovascular system |
20.1 |
-20.7 |
-4.2 |
| D: Dermatologicals |
0.6 |
2.0 |
0.0 |
| G: Genito-urinary system and sex hormones |
4.2 |
-0.4 |
0.0 |
| H: Systemic hormonal preparations |
0.8 |
2.8 |
0.0 |
| J: General antiinfectives for systemic use and P: Antiparasitic products* |
10.0 |
-0.1 |
0.0 |
| L: Antineoplastics and immunomodulating agents |
20.8 |
12.0 |
2.5 |
| M: Musculo-skeletal system |
3.7 |
-8.0 |
-0.3 |
| N: Nervous system |
13.1 |
4.4 |
0.6 |
| R: Respiratory system |
8.6 |
4.9 |
0.4 |
| S: Sensory organs |
3.0 |
27.7 |
0.8 |
| V: Various |
0.4 |
4.2 |
0.0 |
| All therapeutic classes |
100.0 |
-1.8 |
-1.8 |
* These groups have been combined for reasons of confidentiality.
Source: PMPRB
Canadian Drug Expenditures in the Global Context
IMS Health13 regularly reports on drug sales across a large number of countries. Based on sales data from this source, Figure 13 provides shares of global sales for Canada and each of the seven comparator countries that the PMPRB considers in conducting its price reviews.14 The Canadian market accounted for 2.7% of the global market in 2010.
Canada's share of global sales has remained between 2.4% and 2.7% from 2005 to 2010.
Figure 14 provides Canada's share of global sales for each of the years 2005 through 2010. The Canadian share has remained between 2.4% and 2.7% throughout this period.
Figure 15 gives the average annual rate of growth in total drug sales for Canada and the seven comparator countries, individually and collectively. From 2005 to 2010, drug sales in Canada rose at an annual average rate of approximately 6.4%. Drug sales among the seven comparator countries rose at an annual average rate of 4.3% over the same period.
Figure 13 Distribution of Drug Sales Among Major National Markets, 2010
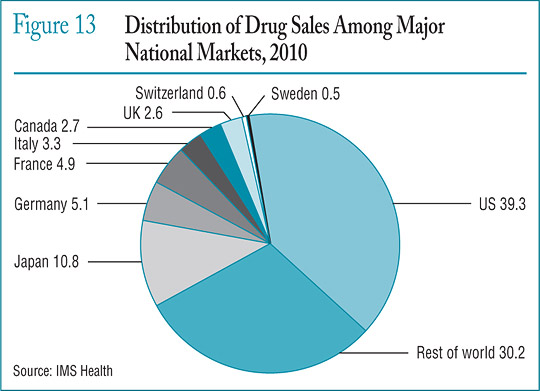
Figure 14 Canada's Share of Global Drug Sales, 2005–2010
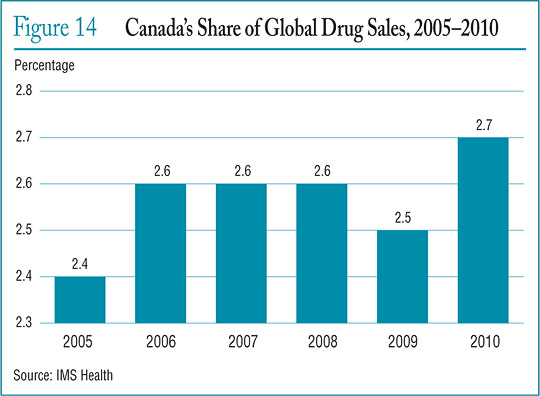
Figure 16 compares rates of year-over-year growth in drug sales in Canada and the comparator countries combined. In 2010, for the first time in recent years, sales grew at a slower rate in Canada than in the comparator countries.
The proportion of national income allocated to the purchase of drug products provides another way to compare drug costs across countries.15 Figure 17 gives drug expenditures as a share of Gross Domestic Product (GDP) for Canada and the seven comparator countries based on data for 2008. Drug expenditures absorbed between 1.0% and 1.9% of the GDP in the seven comparators. The Canadian value (1.8%) lies near the upper end of this range.
Figure 15 Average Rate of Growth, Drug Sales, at Constant 2010 Market Exchange Rates by Country, 2005–2010
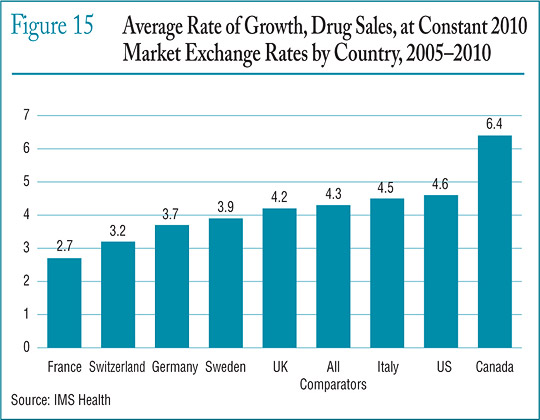
Figure 16 Average Annual Rate of Change in Drug Sales, at Constant 2010 Market Exchange Rates, Canada and Comparator Countries, 2006–2010
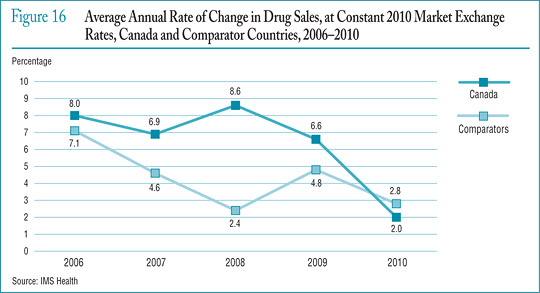
Figure 17 Pharmaceutical Expenditure as a Share of GDP, 2008
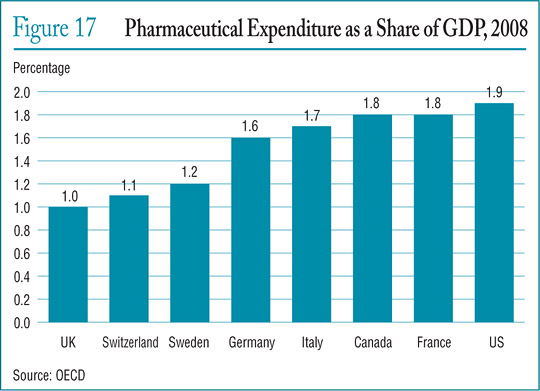
Table 14 Drug Expenditures as a Share of GDP, 2008
| |
Share: Drug expenditures/ GDP, 2008 (%) |
Share: Drug expenditures/ GDP, 2008 (%) |
Growth: Drug expenditures/ 2000–2008 (%) |
Growth: GDP 2000–2008 (%) |
| Canada |
1.79 |
1.42 |
128.70 |
81.55 |
| France |
1.84 |
1.81 |
70.30 |
67.82 |
| Germany |
1.59 |
1.43 |
80.96 |
63.21 |
| Italy |
1.67 |
1.74 |
78.24 |
85.22 |
| Sweden |
1.24 |
1.18 |
59.61 |
51.79 |
| Switzerland |
1.10 |
1.11 |
45.15 |
46.19 |
| United Kingdom |
1.03 |
1.14 |
41.56 |
57.20 |
| United States |
1.90 |
1.46 |
90.99 |
46.45 |
Source: OECD
Table 14 provides historical perspective on the expenditures-to-GDP ratio. Between 2000 and 2008 drug expenditures in Canada grew at approximately twice the rate of GDP growth.
Table 15 gives the composition of patentees' sales by therapeutic class for Canada and the seven comparator countries, individually and as an aggregate.16 With the exception of cardiovascular drug products (which account for a substantially larger part of overall sales in Canada than anywhere else), these results imply a remarkable degree of similarity across countries.
Table 15 Drug Sales by Major Therapeutic Class for Canada and Comparator Countries, 2010
| Therapeutic class |
Canada |
Comparators |
France |
Italy |
Germany |
Sweden |
Switzerland |
United Kingdom |
United States |
| A: Alimentary tract and metabolism |
12.7 |
11.9 |
10.3 |
10.9 |
11.4 |
9.5 |
12.0 |
11.2 |
12.3 |
| B: Blood and blood-forming organs |
4.1 |
6.7 |
7.9 |
7.7 |
5.3 |
7.0 |
5.0 |
4.7 |
6.8 |
| C: Cardiovascular system |
19.8 |
12.2 |
14.5 |
16.2 |
11.2 |
7.8 |
14.0 |
11.9 |
11.7 |
| D: Dermatologicals |
2.9 |
2.4 |
2.3 |
2.1 |
2.5 |
2.3 |
3.6 |
3.1 |
2.3 |
| G: Genito-urinary system and sex hormones |
4.7 |
4.8 |
3.3 |
4.0 |
4.0 |
4.8 |
4.5 |
4.3 |
5.1 |
| H: Systemic hormonal preparations |
1.0 |
1.6 |
1.8 |
1.8 |
2.0 |
2.4 |
1.4 |
2.1 |
1.4 |
| J: General antiinfectives for systemic use |
6.5 |
10.2 |
11.4 |
13.2 |
9.8 |
10.3 |
10.7 |
9.8 |
9.9 |
| L: Antineoplastics and immunomodulating agents |
12.9 |
14.7 |
16.3 |
15.1 |
18.9 |
19.9 |
15.8 |
14.0 |
13.8 |
| M: Musculo-skeletal system |
3.8 |
2.9 |
3.9 |
4.2 |
3.6 |
3.1 |
5.0 |
2.7 |
2.6 |
| N: Nervous system |
18.2 |
18.9 |
14.4 |
11.8 |
16.3 |
18.5 |
16.4 |
18.9 |
20.4 |
| P: Antiparasitic products |
0.2 |
0.1 |
0.2 |
0.0 |
0.1 |
0.2 |
0.1 |
0.3 |
0.1 |
| R: Respiratory system |
6.9 |
7.8 |
6.4 |
5.9 |
7.1 |
8.4 |
6.3 |
9.9 |
8.1 |
| S: Sensory organs |
2.5 |
2.3 |
2.3 |
1.7 |
1.9 |
2.4 |
2.9 |
2.9 |
2.4 |
| V: Various |
3.7 |
3.6 |
5.1 |
5.3 |
6.0 |
3.4 |
2.2 |
4.1 |
3.0 |
| All therapeutic classes |
100.0* |
100.0* |
100.0* |
100.0* |
100.0* |
100.0* |
100.0* |
100.0* |
100.0* |
* Values in this column may not add to 100.0 due to rounding.
Source: IMS Health
13 Most of the statistical results presented in this section are based on sales data from IMS Health's MIDAS database. These data cover the pharmacy and hospital sectors.
14 The results given in Figures 13 through 16 are based on estimates of ex-factory sales revenues encompassing patented, non-patented branded and generic drug products. These estimates have been converted to Canadian-dollar equivalents at annual average market exchange rates. Fluctuations in these rates can substantially influence these shares.
15 Comparisons made on this basis will reflect international differences in prices, overall utilization and patterns of therapeutic choice, as well as differences in national income.
16 Note that the data used to produce Table 15 encompass patented, nonpatented branded and generic drug products. Hence, the results reported here for Canada are not directly comparable to those in Table 9 (see page 18), which encompass only patented drug products.
Analysis of Research and Development Expenditures
The Patent Act (Act) mandates the PMPRB to monitor and report on pharmaceutical research and development (R&D) spending (while giving the PMPRB no regulatory authority to consider the amount or type of patentees' research spending in the context of its price regulation). This chapter provides key statistics on the current state of pharmaceutical research investment in Canada.
Data Sources
The statistical results presented below were entirely derived from data that patentees have submitted to the PMPRB.
The Act requires each patentee to report its total gross revenues from sales of all drugs for human or veterinary use (including revenues from sales of non-patented drug products and from licensing agreements) and R&D expenditures in Canada related to medicines (both patented and non-patented for human or veterinary use). Patentees transmit this information to the PMPRB by means of its Form 3 (Revenues and Research and Development Expenditures Provided Pursuant to subsection 88(1) of the Patent Act).
The Patented Medicines Regulations (Regulations) require that each submitted Form 3 be accompanied by a certificate stating the information it contains is “true and correct”. The Board does not audit Form 3 submissions, but it does review submitted data for anomalies and inconsistencies, seeking corrections or clarifications from patentees where necessary. To confirm that PMPRB staff has correctly interpreted the data submitted, each patentee is given the opportunity to review and confirm the accuracy of its own R&D-to-sales ratio before that ratio is published.
Failure to File
It is a patentee's responsibility to ensure a complete and accurate Form 3 is filed within the time frame set out in the Regulations. Where a patentee fails to meet these filing requirements, the Board may issue an Order demanding compliance. There were no such Board Orders issued for the 2010 reporting period.
Coverage
Note that companies without sales of patented medicines need not report to the PMPRB on their R&D expenditures. This has two implications.
First, the statistical results reported below should not be taken to cover all pharmaceutical research conducted in Canada. For example, a company may sell only non-patented drug products but may still perform considerable research in Canada. Similarly, a company may conduct research and have no product sales at all.17 The results presented below will not reflect the R&D expenditures of firms in either situation.
Second, as new patented drug products come onto the Canadian market and existing patents expire, the number and identity of companies required to file R&D data may change from year to year. A total of 82 companies reported on their R&D activity in 2010. Of these, 35 were members of Canada's Research-Based Pharmaceutical Companies (Rx&D).
Definition of Sales Revenues
For reporting purposes, sales revenues are defined as total gross revenues from sales in Canada of all drug products and from licensing agreements (e.g., royalties and fees accruing to the patentee related to sales in Canada by licensees).
Definition of R&D Expenditures
Pursuant to section 6 of the Regulations, patentees are required to report R&D expenditures that would have qualified for an Investment Tax Credit for scientific research and experimental development under the provisions of the Income Tax Act that came into effect on December 1, 1987. By this definition, R&D expenditures may include current expenditures, capital equipment costs and allowable depreciation expenses. Market research, sales promotions, quality control or routine testing of materials, devices or products and routine data collection are not eligible for an Investment Tax Credit and, therefore, are not to be included in the R&D expenditures reported by patentees.
Table 16 Total R&D Expenditures and R&D-to-Sales Ratios of Reporting Companies, 1988–2010
| |
All Patentees |
Rx&D |
|
|
| Year |
Number of companies reporting |
R&D expenditures by all patentees ($millions) |
Change from previous year (%) |
Sales revenues ($millions) |
Change from previous year (%) |
R&D expenditures by Rx&D patentees ($millions) |
Change from previous year (%) |
Sales revenues by Rx&D patentees ($millions) |
Change from previous year (%) |
R&D-to-sales ratio: all patentees (%) |
R&D-to-sales ratio: Rx&D patentees (%) |
| 2010 |
82 |
1,178.2 |
-7.4 |
17,000.0 |
-0.3 |
1,000.2 |
-11.7 |
12,149.0 |
-11.8 |
6.9 |
8.2 |
| 2009 |
81 |
1,272.0 |
-2.9 |
17,051.9 |
4.5 |
1,132.9 |
-3.4 |
13,780.0 |
4.6 |
7.5 |
8.2 |
| 2008 |
82 |
1,310.7 |
-1.1 |
16,316.7 |
2.0 |
1,172.2 |
-1.0 |
13,178.2 |
-1.4 |
8.1 |
8.9 |
| 2007 |
82 |
1,325.0 |
9.5 |
15,991.0 |
7.3 |
1,184.4 |
24.8 |
13,359.8 |
20.0 |
8.3 |
8.9 |
| 2006 |
72 |
1,210.0 |
-1.9 |
14,902.0 |
4.7 |
949.0 |
-8.8 |
11,131.2 |
-5.8 |
8.1 |
8.5 |
| 2005 |
80 |
1,234.3 |
5.5 |
14,231.3 |
0.5 |
1,040.1 |
3.9 |
11,821.4 |
0.0 |
8.7 |
8.8 |
| 2004 |
84 |
1,170.0 |
-2.0 |
14,168.3 |
4.0 |
1,000.8 |
0.8 |
11,819.0 |
8.8 |
8.3 |
8.5 |
| 2003 |
83 |
1,194.3 |
-0.4 |
13,631.1 |
12.8 |
992.9 |
-3.6 |
10,865.7 |
5.2 |
8.8 |
9.1 |
| 2002 |
79 |
1,198.7 |
13.0 |
12,081.2 |
12.5 |
1,029.6 |
10.1 |
10,323.8 |
16.8 |
9.9 |
10.0 |
| 2001 |
74 |
1,060.1 |
12.6 |
10,732.1 |
15.3 |
935.2 |
14.7 |
8,835.4 |
14.3 |
9.9 |
10.6 |
| 2000 |
79 |
941.8 |
5.3 |
9,309.6 |
12.0 |
815.5 |
4.0 |
7,728.8 |
11.6 |
10.1 |
10.6 |
| 1999 |
78 |
894.6 |
12.0 |
8,315.5 |
19.2 |
784.3 |
9.9 |
6,923.4 |
22.8 |
10.8 |
11.3 |
| 1998 |
74 |
798.9 |
10.2 |
6,975.2 |
10.9 |
713.7 |
8.6 |
5,640.2 |
10.6 |
11.5 |
12.7 |
| 1997 |
75 |
725.1 |
9.0 |
6,288.4 |
7.4 |
657.4 |
10.3 |
5,098.2 |
4.9 |
11.5 |
12.9 |
| 1996 |
72 |
665.3 |
6.4 |
5,857.4 |
9.9 |
595.8 |
6.5 |
4,859.5 |
8.7 |
11.4 |
12.3 |
| 1995 |
71 |
625.5 |
11.5 |
5,330.2 |
7.5 |
559.5 |
9.8 |
4,468.8 |
1.4 |
11.7 |
12.5 |
| 1994 |
73 |
561.1 |
11.4 |
4,957.4 |
4.4 |
509.5 |
10.4 |
4,407.2 |
2.0 |
11.3 |
11.6 |
| 1993 |
70 |
503.5 |
22.1 |
4,747.6 |
14.0 |
461.4 |
24.0 |
4,321.4 |
14.4 |
10.6 |
10.7 |
| 1992 |
71 |
412.4 |
9.6 |
4,164.4 |
6.9 |
372.1 |
9.0 |
3,778.4 |
6.5 |
9.9 |
9.8 |
| 1991 |
65 |
376.4 |
23.2 |
3,894.8 |
18.1 |
341.4 |
24.7 |
3,546.9 |
19.5 |
9.7 |
9.6 |
| 1990 |
65 |
305.5 |
24.8 |
3,298.8 |
11.0 |
273.8 |
25.8 |
2,967.9 |
10.5 |
9.3 |
9.2 |
| 1989 |
66 |
244.8 |
47.4 |
2,973.0 |
9.4 |
217.6 |
34.7 |
2,685.5 |
7.3 |
8.2 |
8.1 |
| 1988 |
66 |
165.7 |
— |
2,718.0 |
— |
161.5 |
— |
2,502.3 |
— |
6.1 |
6.5 |
Source: PMPRB
Total Sales Revenues and R&D Expenditures
Table 16 provides an overview of reported sales revenues and R&D expenditures over the period 1988 through 2010.
Patentees reported total 2010 sales revenues (Table 16) of $17.0 billion, a decline of 0.3% from 2009. Sales revenues reported by Rx&D members were $12.1 billion, accounting for 71.1% of the total. Less than 1% of reported sales revenues were generated by licensing agreements.
Patentees reported R&D expenditures of $1,178.2 million in 2010, a decline of 7.4% over 2009. Rx&D members reported R&D expenditures of $1,000.2 million in 2010, a decrease of 11.7% over last year. Rx&D members accounted for 84.8% of all reported R&D expenditures in 2010.
R&D-to-Sales Ratios
Table 16 also provides ratios of R&D expenditures to sales revenues. It should be noted in this context that, with the adoption of the 1987 amendments to the Act, Rx&D made a public commitment to increase their annual R&D expenditures to 10% of sales revenues by 1996.18
The ratio of R&D expenditures to sales revenues among all patentees was 6.9% in 2010, down from 7.5% in 2009. This is the lowest value recorded since 1989. The overall R&D-to-sales ratio has been less than 10% for 10 consecutive years.
The ratio of R&D expenditures to sales revenues among all patentees was 6.9% in 2010, down from 7.5% in 2009. The corresponding R&D-to-sales ratio for members of Rx&D was 8.2%, as in 2009.
The corresponding R&D-to-sales ratio for members of Rx&D was 8.2%, as in 2009.19 The Rx&D ratio has been less than 10% for eight consecutive years.
Table 21 in Appendix 3 provides details on the range of 2010 R&D-to-sales ratios. Of the 82 companies reporting in 2010, 81.7% had R&D-to-sales ratios below 10%.
The PMPRB is participating as a member of a working group chaired by Industry Canada that was formed to examine current mechanisms of capturing and reporting R&D investments by members of Rx&D, as well as to capture other investments made by Rx&D member companies. The completed study is expected to be presented to the working group in the spring or summer of 2011.
At the same time, an expert panel appointed by the federal government is reviewing all federal programs that support R&D, including tax incentives. The panel is expected to submit its report by October 2011.
Figure 18 R&D-to-Sales Ratio, Pharmaceutical Patentees, 1988–2010
Table 17 Current R&D Expenditures by Type of Research, 2010 and 2009
| Type of research |
Expenditures: 2010 ($millions) |
Share: 2010 (%) |
Expenditures: 2009 ($millions) |
Share: 2009 (%) |
Annual change in expenditures (%) |
| Basic |
235.9 |
21.1 |
237.1 |
19.4 |
-0.5 |
| Chemical |
119.8 |
10.7 |
125.6 |
10.3 |
-4.6 |
| Biological |
116.1 |
10.4 |
111.5 |
9.1 |
4.1 |
| Applied |
613.4 |
54.6 |
685.3 |
56.2 |
-10.5 |
| Manufacturing process |
86.7 |
7.8 |
86.9 |
7.1 |
-0.2 |
| Pre clinical trial I |
8.9 |
0.8 |
7.7 |
0.6 |
15.6 |
| Pre clinical trial II |
52.8 |
4.7 |
64.2 |
5.3 |
-17.8 |
| Clinical trial phase I |
33.9 |
3.0 |
45.0 |
3.7 |
-24.7 |
| Clinical trial phase II |
113.3 |
10.1 |
116.4 |
9.6 |
-2.7 |
| Clinical trial phase III |
317.8 |
28.4 |
365.1 |
29.9 |
-13.0 |
| Other qualifying R&D |
270.8 |
24.3 |
296.8 |
24.3 |
-8.8 |
| Total |
1,120.1 |
100.0 |
1,219.2 |
100.0* |
-8.1 |
* Values in this column may not add to 100.0 due to rounding.
Source: PMPRB
Current Expenditures by Type of Research
Table 17 and Figure 19 (as well as Figure 21 in Appendix 3) provide information on the allocation of 2010 current R&D expenditures20 among basic and applied research and other qualifying R&D.21 Patentees reported spending $235.9 million on basic research in 2010, representing 21.1% of current R&D expenditures and a decline of 0.5% over the previous year. Patentees reported spending $613.4 million on applied research, representing 54.6% of current R&D expenditures. Clinical trials accounted for 75.8% of applied research expenditures.
Figure 19 Current R&D Expenditures by Type of Research, 1988–2010
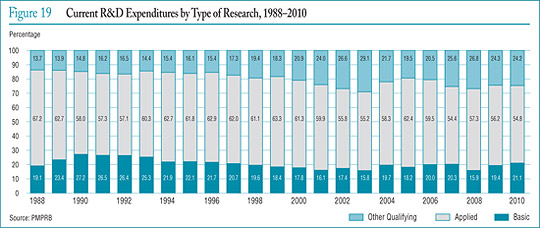
Table 18 Current R&D Expenditures by R&D Performer, 2010 and 2009
Intramural
| R&D performer |
Expenditures: 2010 ($millions) |
Share: 2010 (%) |
Expenditures: 2009 ($millions) |
Share: 2009 (%) |
Annual change in expenditures (%) |
| Patentees |
575.1 |
51.4 |
628.8 |
51.6 |
-8.5 |
Extramural
| R&D performer |
Expenditures: 2010 ($millions) |
Share: 2010 (%) |
Expenditures: 2009 ($millions) |
Share: 2009 (%) |
Annual change in expenditures (%) |
| Universities and hospitals |
160.9 |
14.4 |
187.9 |
15.4 |
-15.4 |
| Other companies |
241.7 |
21.6 |
242.6 |
19.9 |
-0.4 |
| Others |
142.4 |
12.6 |
159.9 |
13.1 |
-10.9 |
| Total |
1,120.1 |
100.0 |
1,219.2 |
100.0 |
-8.1 |
Source: PMPRB
Current R&D Expenditures by Performer
Patentees report expenditures on research they conduct themselves (intramural) and research performed by other establishments, such as universities, hospitals and other manufacturers (extramural). Table 18 shows that 51.4% of 2010 current research expenditures were intramural, down slightly from 2009. Research performed by other companies on behalf of patentees was 21.6% of current expenditures, while research conducted in universities and hospitals accounted for 14.4%.
Current R&D Expenditures by Source of Funds
Table 19 provides information on the sources of funds used by patentees to finance their R&D activity. Internal company funds remained by far the single largest source of funding in 2010, accounting for 89.2% of current expenditures. Funds received from government amounted to 3.1% of current expenditures.
Table 19 Total R&D Expenditures by Source of Funds, 2010 and 2009
| Source of funds |
Expenditures: 2010 ($millions) |
Share: 2010 (%) |
Expenditures: 2009 ($millions) |
Share: 2009 (%) |
Annual change in expenditures (%) |
| Company funds |
1,050.8 |
89.2 |
1,139.6 |
89.6 |
-7.8 |
| Federal/provincial governments |
36.3 |
3.1 |
33.8 |
2.6 |
7.4 |
| Others |
91.1 |
7.7 |
98.6 |
7.7 |
-7.6 |
| Total |
1,178.2 |
100.0 |
1,272.0 |
100.0* |
-7.4 |
* Values in this column may not add to 100.0 due to rounding.
Source: PMPRB
Current R&D Expenditures by Region
Table 20 (as well as Table 23 and Table 24 in Appendix 3) show current R&D expenditures by region. As in previous years, current expenditures were heavily concentrated in Ontario and Quebec in 2010, with these provinces accounting for 85.9% of total expenditures. While current R&D expenditures increased at a year-over-year rate of 5.7% in Western Canada, they declined in Ontario by 12.0% and in Quebec by 7.4%.
Table 20 Current R&D Expenditures by Region, 2010 and 2009
| Region |
Expenditures: 2010 ($millions) |
Share: 2010 (%) |
Expenditures: 2009 ($millions) |
Share: 2009 (%) |
Annual change in expenditures (%) |
| Atlantic provinces |
18.1 |
1.6 |
19.6 |
1.6 |
-7.6 |
| Quebec |
461.2 |
41.2 |
498.0 |
40.8 |
-7.4 |
| Ontario |
500.2 |
44.7 |
568.5 |
46.6 |
-12.0 |
| Western provinces |
140.6 |
12.6 |
133.1 |
10.9 |
5.7 |
| Territories |
0.0 |
0.0 |
0.0 |
0.0 |
-100.0 |
| Total |
1,120.1 |
100.0* |
1,219.2 |
100.0* |
-8.1 |
* Values in this column may not add to 100.0 due to rounding.
Source: PMPRB
Figure 20 R&D-to-Sales Ratios, Canada and Comparator Countries
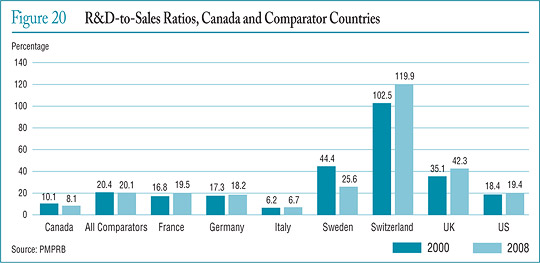
The Global Context
Figure 20 compares Canadian pharmaceutical R&D-to-sales ratios for the years 2000 and 2008 to those in the PMPRB's seven comparator countries.22 Canada's ratio stood at 10.1% in 2000. Only Italy, at 6.2%, had a lower ratio in that year, while Switzerland had the highest ratio at 102.5%.
A similar pattern emerges in the ratios for 2008. Italy remained at the bottom of the range at 6.7%, with Canada second lowest at 8.1%. Ratios in all other comparator countries remained well above Canada's ratio. The ratio obtained by aggregating R&D spending and sales across all seven comparator countries was 20.1%, two and a half times the value obtained for Canada.
It is instructive to compare the R&D-to-sales ratios represented in Figure 20 to the average bilateral price ratios reported in Table 11 on page 24. Such a comparison reveals no obvious correlation between a country's R&D-to-sales performance and its policies with regard to the pricing of patented drug products. In particular, several comparator countries have achieved R&D-to-sales ratios well above those in Canada despite having patented drug prices that are, on average, substantially less than prices in this country. France constitutes a particularly interesting point of comparison with an R&D-to-sales ratio twice that observed in Canada despite prices that are, on average, at least 10% less than their Canadian counterparts.
17 This is likely the situation for much of Canada's biotechnology sector. Note, however, that if a patentee commissions research from another company specializing in biotechnology research, the patentee should normally include this among the research expenditures that it reports to the PMPRB.
18 As published in the Regulatory Impact Assessment Statement (RIAS) of the Patented Medicines Regulations, 1988, published in the Canada Gazette, Part II, Vol. 122, No. 20 – SOR/DORS/88-474.
19 The R&D-to-sales ratios presented in Table 16 include research expenditures funded by government grants. If the government-funded component is excluded, the ratios for all patentees and for the members of Rx&D in 2010 are 6.7% and 7.9%, respectively.
20 Current R&D expenditures consist of non-capital expenses directly related to research, including (a ) wages and salaries; (b ) direct material; (c ) contractors and sub-contractors; (d ) other direct costs such as factory overhead; (e ) payments to designated institutions; (f ) payments to granting councils; and (g ) payments to other organizations. These elements are described in more detail in Form 3 (“Revenues and Research and Development Expenditures”) available from the PMPRB website under the heading Regulatory Filings. Current R&D expenditures accounted for 95.1% of total R&D expenditure in 2010, while capital equipment costs and allowable depreciation expenses made up 2.7% and 2.2%, respectively.
21 “Basic research” is defined as work that advances scientific knowledge without a specific application in mind. “Applied research” is directed toward a specific practical application, comprising research intended to improve manufacturing processes, pre-clinical trials and clinical trials. “Other qualifying research” includes drug regulation submissions, bioavailability studies and Phase IV clinical trials.
22 Sales in Figure 20 represent domestic sales and do not include exports.
National Prescription Drug Utilization Information System
The National Prescription Drug Utilization Information System (NPDUIS) provides critical analyses of drug prices, utilization and cost trends in Canada to support drug plan policy decision making for participating federal, provincial and territorial governments. The PMPRB and the Canadian Institute for Health Information (CIHI) are partners in this initiative.
The NPDUIS initiative involves two major elements:
- development of a database incorporating data on individual claims reimbursed by public drug plans
- production of analytical reports using information in this database CIHI is responsible for the first element, while the PMPRB (as requested by the Minister of Health under section 90 of the Patent Act) is principally responsible for the second element.
The NPDUIS Steering Committee, composed of representatives from public drug plans in British Columbia, Alberta, Saskatchewan, Manitoba, Ontario, New Brunswick, Nova Scotia, Prince Edward Island, Newfoundland and Labrador, Yukon, and Health Canada, advises the PMPRB on its research agenda and on individual studies. In 2010, the NPDUIS Steering Committee held five conference calls and met once in Ottawa.
During 2010, the PMPRB published four reports in December. The reports, listed below, are available on the PMPRB website under Publications.
- Baby-Boomer Effect on Prescription Expenditures and Claims
Using public drug plan data for the period between 2002 and 2006 and population projections from Statistics Canada, the report attempts to project the impact of Canada's aging population on public drug plan expenditures.
- The Use of the WHO DDD in Canadian Drug Utilization and Costs Analyses
This is a technical discussion related to the appropriate use of the Defined Daily Dose (DDD) measure when conducting drug utilization and costs analyses.
- Generic Drugs in Canada: Price Trends and International Price Comparisons
The report compares international prices for a basket of 298 leading generic drugs sold in Canada for 2004–2007.
- Generic Drugs in Canada: Market Structure - Trends and Impacts
The report looks at market concentration within Canada's generic drug industry and explores the potential impact on Canadian and international prices.
Further publications are expected later in 2011. These include reports on:
- Public Drug Plan Professional Fees: A Cost-Driver Analysis
- Generic Entry Impact on the Utilization of the Ingredient
- Canadian Generic Drug Expenditures at International Price Levels
Work is currently underway to develop a research agenda for 2011/12.
Appendix 1: Glossary
For more detailed information and definitions please refer to the Patent Act, the Patented Medicines Regulations, the PMPRB Compendium of Policies, Guidelines and Procedures, and the Food and Drug Regulations, or contact the PMPRB.
Active Ingredient: Chemical or biological substance responsible for the claimed pharmacologic effect of a drug product.
Advance Ruling Certificate (ARC): A non-binding advance ruling certificate may be issued pursuant to subsection 98(4) of the Patent Act at the request of a patentee when the Board is satisfied that the price or proposed price of the medicine would not exceed the maximum non-excessive price under the Board's Guidelines.
ATC: Anatomical Therapeutic Chemical (ATC) classification system, developed and maintained by the World Health Organization (WHO) Collaborating Centre for Drug Statistics Methodology, divides drugs into different groups according to their site of action and therapeutic and chemical characteristics. This system is used by the PMPRB as a guide for selecting comparable medicines for purposes of price review.
Dedication of Patent: A practice whereby a patentee notifies the Commissioner of Patents that it has surrendered its rights and entitlements flowing from the patent for the benefit of the public to use and enjoy. NB: As of January 30, 1995, the Board does not recognize dedication of patent as a means to remove the medicine from its jurisdiction.
Drug Identification Number (DIN): A registration number (drug identification number) that the Health Products and Food Branch of Health Canada assigns to each prescription and non-prescription drug product marketed under the Food and Drugs Regulations. The DIN is assigned using information in the following areas: manufacturer of the product; active ingredient(s); strength of active ingredient(s); pharmaceutical dosage form; brand/trade name; and route of administration.
Drug Product: A particular presentation of a medicine characterized by its pharmaceutical dosage form and the strength of the active ingredient(s).
Failure to File: The complete or partial failure of a patentee to comply with regulatory filing requirements pursuant to the Patent Act and the Patented Medicines Regulations.
Failure to Report: The complete failure of a patentee to have reported a patented drug product being sold in accordance with regulatory filing requirements pursuant to the Patent Act and the Patented Medicines Regulations.
Generic Product: A drug product with the same active ingredient, strength and dosage form of a brand name drug product.
License, Voluntary: A contractual agreement between a patent holder and a licensee under which the licensee is entitled to enjoy the benefit of the patent or to exercise any rights in relation to the patent for some consideration (i.e., royalties in the form of a share of the licensee's sales).
Medicine: Any substance or mixture of substances made by any means, whether produced biologically, chemically, or otherwise, that is applied or administered in vivo in humans or in animals to aid in the diagnosis, treatment, mitigation or prevention of disease, symptoms, disorders, abnormal physical states, or modifying organic functions in humans and or animals, however administered. For greater certainty, this definition includes vaccines, topical preparations, anaesthetics and diagnostic products used in vivo, regardless of delivery mechanism (e.g., transdermal, capsule form, injectable, inhaler, etc.). This definition excludes medical devices, in vitro diagnostic products and disinfectants that are not used in vivo.
Notice of Compliance (NOC): A notice in respect of a medicine issued by the Health Products and Food Branch of Health Canada under section C.08.004 of the Food and Drugs Regulations. The issuance of an NOC indicates that a drug product meets the required Health Canada standards for use in humans or animals and that the product is approved for sale in Canada.
Patent: An instrument issued by the Commissioner of Patents in the form of letters patent for an invention that provides its holder with a monopoly limited in time, for the claims made within the patent. A patent gives its holder and its legal representatives, the exclusive right of making, constructing and using the invention and selling it to others to be used.
Patented Medicine Price Index (PMPI): The PMPI was developed by the PMPRB as a measure of average year-over-year change in the transaction prices of patented drug products sold in Canada, based on the price and sales information reported by patentees.
Patentee: As defined by subsection 79(1) of the Patent Act, “the person for the time being entitled to the benefit of the patent for that invention and includes, where any other person is entitled to exercise any rights in relation to that patent other than under a license continued by subsection 11(1) of the Patent Act Amendment Act, 1992, that other person in respect of those rights;”
Pending Patent: An application for a patent that has not yet been issued.
Research and Development (R&D): Basic or applied research for the purpose of creating new, or improving existing, materials, devices, products or processes (e.g., manufacturing processes).
Research and Development - Applied Research: R&D directed toward a specific practical application, comprising research intended to improve manufacturing processes, pre-clinical trials and clinical trials.
Research and Development - Basic Research: R&D defined as work that advances scientific knowledge without a specific application in mind.
Research and Development - Other Qualifying: Includes eligible research and development expenditures that cannot be classified into any of the preceding categories of “type of research and development”. It includes drug regulation submissions, bioavailability studies and Phase IV clinical trials.
Research and Development Expenditures: For the purposes of the Patented Medicines Regulations, in particular Sections 5 and 6, research and development includes activities for which expenditures would have qualified for the investment tax credit for scientific research and experimental development under the Income Tax Act as it read on December 1, 1987.
Current Research and Development Expenditures: Consist of the following non-capital expenses that are directly related to research work: (a) wages and salaries, (b) direct material, (c) contractors and subcontractors, (d) other direct costs such as factory overhead, (e) payments to designated institutions, (f) payments to granting councils, and (g) payments to other organizations. These elements are described in greater detail in the Patentees' Guide to Reporting - Form 3, available from the PMPRB Website under Regulatory Filings.
Special Access Programme (SAP): A program operated by Health Canada to give practitioners access to drugs that are not approved or otherwise available for sale in Canada.
Voluntary Compliance Undertaking (VCU): A written undertaking by a patentee to adjust its price to comply to the Board's Guidelines. The Chairman may approve a VCU in lieu of issuing a Notice of Hearing if it is in the public interest. A VCU can also be submitted following the issuance of a Notice of Hearing. A VCU submitted at this point must be approved by the Board Hearing Panel struck to hear the matter. The Board reports publicly on all VCUs approved by the Chairman or the Board.
Appendix 2: Patented Drug Products First Reported to the PMPRB in 2010
| Brand Name |
Company |
DIN |
Status |
Level of Therapeutic Improvement/Category |
| Actemra - 200 mg/vial |
Hoffmann-La Roche Limited |
02350106 |
Within Guidelines |
Slight or no improvement |
| Actemra - 400 mg/vial |
Hoffmann-La Roche Limited |
02350114 |
Within Guidelines |
Slight or no improvement |
| Actemra - 80 mg/vial |
Hoffmann-La Roche Limited |
02350092 |
Within Guidelines |
Slight or no improvement |
| Adcirca - 20 mg/tablet |
Eli Lilly Canada Inc. |
02338327 |
Within Guidelines |
Slight or no improvement |
| Advagraf - 3 mg/capsule |
Astellas Pharma Canada Inc. |
02331667 |
Within Guidelines |
Slight or no improvement |
| Advate 3000 |
Baxter Corporation |
02337193 |
Within Guidelines |
Slight or no improvement |
| Afinitor - 10 mg/tablet |
Novartis Pharma Canada Inc. |
02339528 |
Within Guidelines |
Moderate improvement - primary |
| Besivance - 6 mg/mL |
Bausch & Lomb Canada Inc. |
02336847 |
Within Guidelines |
Slight or no improvement |
| BuTrans 10 - 10 mg/patch |
Purdue Pharma |
02341212 |
Within Guidelines |
Slight or no improvement |
| BuTrans 20 - 20 mg/patch |
Purdue Pharma |
02341220 |
Within Guidelines |
Slight or no improvement |
| BuTrans 5 - 5 mg/patch |
Purdue Pharma |
02341174 |
Subject to Investigation |
|
| Cervarix |
GlaxoSmithKline Inc. |
02342227 |
Subject to Investigation |
|
| Coralan - 7.5 mg/tablet |
Servier Canada Inc. |
- |
Within Guidelines |
Slight or no improvement |
| Coralan - 5 mg/tablet |
Servier Canada Inc. |
- |
Subject to Investigation |
|
| Dexilant - 30 mg/capsule |
Takeda Canada Inc. |
02354950 |
Within Guidelines |
Slight or no improvement |
| Dexilant - 60 mg/capsule |
Takeda Canada Inc. |
02354969 |
Does Not Trigger Investigation |
Slight or no improvement |
| Dipeptiven - 200 mg/mL |
Fresenius Kabi |
- |
Within Guidelines |
Breakthrough |
| Effient - 10 mg/tablet |
Eli Lilly Canada Inc. |
02349124 |
Subject to Investigation |
|
| Eraxis (without solvent) - 100 mg/vial |
Pfizer Canada Inc. |
02330695 |
Within Guidelines |
Slight or no improvement |
| Extavia - 0.3 mg/vial |
Novartis Pharma Canada Inc. |
02337819 |
Within Guidelines |
Slight or no improvement |
| Finacea - 150 mg/gm |
Bayer Inc. |
02270811 |
Within Guidelines |
Slight or no improvement |
| Invega Sustenna - 100 mg/syringe |
Janssen-Ortho Inc. |
02354233 |
Within Guidelines |
|
| Invega Sustenna - 150 mg/syringe |
Janssen-Ortho Inc. |
02354241 |
Under Review |
|
| Invega Sustenna - 50 mg/syringe |
Janssen-Ortho Inc. |
02354217 |
Under Review |
|
| Invega Sustenna - 75 mg/syringe |
Janssen-Ortho Inc. |
02354225 |
Under Review |
|
| Ixiaro - 5 mcg/dose |
Novartis Pharma Canada Inc. |
02333279 |
Within Guidelines |
Moderate improvement - primary |
| Kogenate FS Bioset 3000 |
Bayer Inc. |
02342758 |
Within Guidelines |
Slight or no improvement |
| Kuvan - 100 mg/tablet |
BioMarin Pharmaceutical Canada Inc. |
02350580 |
Within Guidelines |
Breakthrough |
| Latisse - 0.3 mg/mL |
Allergan Inc. |
02350939 |
Within Guidelines |
Slight or no improvement |
| Metrogel - 10 mg/gm |
Galderma Canada Inc. |
02297809 |
Within Guidelines |
Category 1* |
| Mycamine - 100 mg/vial |
Astellas Pharma Canada Inc. |
02311054 |
Within Guidelines |
Slight or no improvement |
| Niastase RT - 1 mg/vial |
Novo Nordisk Canada Inc. |
02347113 |
Within Guidelines |
Slight or no improvement |
| Niastase RT - 2 mg/vial |
Novo Nordisk Canada Inc. |
02347121 |
Within Guidelines |
Slight or no improvement |
| Niastase RT - 5 mg/vial |
Novo Nordisk Canada Inc. |
02347148 |
Within Guidelines |
Slight or no improvement |
| Pradax - 150 mg/capsule |
Boehringer Ingelheim (Canada) Ltd. |
02358808 |
Under Review |
|
| Prevnar 13 |
Wyeth Pharmaceuticals |
02335204 |
Within Guidelines |
Moderate improvement - primary |
| Prezista - 75 mg/tablet |
Janssen-Ortho Inc. |
02338432 |
Within Guidelines |
Slight or no improvement |
| Primovist - 181.43 mg/mL |
Bayer Inc. |
02340666 |
Within Guidelines |
Slight or no improvement |
| Prolia - 60 mg/mL |
Amgen Canada Inc. |
02343541 |
Within Guidelines |
Moderate improvement - secondary |
| Recothorm - 6000 unit/vial |
Bayer Inc. |
02339277 |
Within Guidelines |
Slight or no improvement |
| Restasis - 0.2 mg/vial |
Allergan Inc. |
02355655 |
Within Guidelines |
Moderate improvement - primary |
| Revatio IV - 0.8 mg/mL |
Pfizer Canada Inc. |
02341611 |
Subject to Investigation |
|
| Sanctura XR - 60 mg/capsule |
Allergan Inc. |
02339706 |
Within Guidelines |
Slight or no improvement |
| Simponi - 50 mg/syringe |
Schering-Plough Canada Inc. |
02324776 |
Within Guidelines |
Category 3* |
| Simponi - 50 mg/syringe |
Schering-Plough Canada Inc. |
02324784 |
Within Guidelines |
Category 3* |
| Soliris - 10 mg/mL |
Alexion Pharmaceuticals Inc. |
02322285 |
Subject to Investigation |
|
| Stalevo 125/31.25/200 |
Novartis Pharma Canada Inc. |
02337835 |
Within Guidelines |
Slight or no improvement |
| Stalevo 75/18.75/200 |
Novartis Pharma Canada Inc. |
02337827 |
Within Guidelines |
Slight or no improvement |
| Strattera - 100 mg/capsule |
Eli Lilly Canada Inc. |
02279355 |
Within Guidelines |
Slight or no improvement |
| Strattera - 80 mg/capsule |
Eli Lilly Canada Inc. |
02279347 |
Within Guidelines |
Slight or no improvement |
| Tamiflu (Seasonal) - 30 mg/capsule |
Hoffmann-La Roche Limited |
02304848 |
Within Guidelines |
Slight or no improvement |
| Tamiflu (Seasonal) - 45 mg/capsule |
Hoffmann-La Roche Limited |
02304856 |
Within Guidelines |
Slight or no improvement |
| Targin 10/5 - 15 mg/tablet |
Purdue Pharma |
02339609 |
Within Guidelines |
Moderate improvement - secondary |
| Targin 20/10 - 30 mg/tablet |
Purdue Pharma |
02339617 |
Within Guidelines |
Moderate improvement - secondary |
| Targin 40/20 - 60 mg/tablet |
Purdue Pharma |
02339625 |
Within Guidelines |
Moderate improvement - secondary |
| Temodal - 100 mg/vial |
Schering-Plough Canada Inc. |
02321262 |
Within Guidelines |
Slight or no improvement |
| Toctino - 20 mg/capsule |
Actelion Pharmaceuticals Canada Inc. |
02337649 |
Does Not Trigger Investigation |
Moderate improvement - primary |
| Uloric - 80 mg/tablet |
Takeda Canada Inc. |
02357380 |
Subject to Investigation |
|
| Ultram - 50 mg/tablet |
Janssen-Ortho Inc. |
02349469 |
Within Guidelines |
Slight or no improvement |
| Victoza - 6 mg/mL |
Novo Nordisk Canada Inc. |
02351064 |
Within Guidelines |
Slight or no improvement |
| Vimpat - 100 mg/tablet |
UBC Canada Inc. |
02357623 |
Under Review |
|
| Vimpat - 150 mg/tablet |
UBC Canada Inc. |
02357631 |
Under Review |
|
| Vimpat - 200 mg/tablet |
UBC Canada Inc. |
02357658 |
Under Review |
|
| Vimpat - 50 mg/tablet |
UBC Canada Inc. |
02357615 |
Under Review |
|
| Yondelis - 1 mg/vial |
Janssen-Ortho Inc. |
02351528 |
Under Review |
|
| Zmax SR - 2 g/bottle |
Pfizer Canada Inc. |
02354802 |
Within Guidelines |
Slight or no improvement |
| Zyclara - 250 mg/packet |
Graceway Pharmaceuticals |
02340445 |
Within Guidelines |
Slight or no improvement |
| Zyvoxam - 20 mg/mL |
Pfizer Canada Inc. |
02234686 |
Under Review |
|
* Sold prior to implementation of new Guidelines in 2010:
- Category 1, an existing or comparable dosage form of an existing medicine
- Category 2, a non-comparable dosage form of an existing medicine, or the first DIN of a new chemical entity that is a breakthrough or provides a substantial improvement over comparable existing DINs
- Category 3, a non-comparable dosage form of an existing medicine, or the first DIN of a new chemical entity that provides moderate, little or no therapeutic advantage over comparable existing DINs
Appendix 3: Research and Development
Table 21 Range of R&D-to-Sales Ratios by Number of Reporting Companies and Total Sales Revenue
| Range: R&D-to-sales ratio |
Number of reporting companies: 2010 |
Sales revenue: 2010 ($millions) |
Share: 2010 (%) |
Number of reporting companies: 2009 |
Sales revenue: 2009 ($millions) |
Share: 2009 (%) |
| 0% |
26 |
628.0 |
3.7 |
23 |
561.9 |
3.3 |
| ≤10% |
41 |
12,349.0 |
72.6 |
40 |
12,081.7 |
70.9 |
| > 10% |
15 |
4,023.0 |
23.7 |
18 |
4,408.3 |
25.9 |
| Total |
82 |
17,000.0 |
100.0* |
81 |
17,051.9 |
100.0* |
* Values in this column may not add to 100.0 due to rounding.
Figure 21 Current R&D Expenditures by Type of Research, 1988-2010
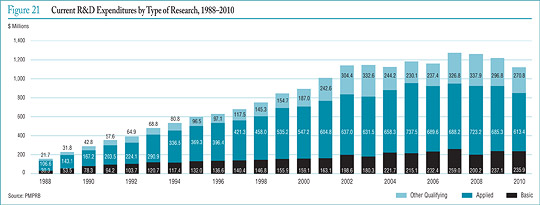
Table 22 Ratios of R&D Expenditures to Sales Revenue by Reporting Patentee1, 2010 and 2009
| Company |
R&D-to-sales ratio (%) |
| 2010 |
2009 |
| Abbott Laboratories, Ltd.2,5 |
1.6 |
2.8 |
| Abbott Products Inc.2 |
0.4 |
24.6 |
| Actelion Pharmaceutiques Canada Inc.2 |
8.8 |
9.3 |
| Alcon Canada Inc. |
0.3 |
0.3 |
| Alexion Pharmaceuticals Inc.5,6 |
0.0 |
- |
| Allergan Inc. |
6.7 |
9.5 |
| Amersham Health Inc. (GE Healthcare Inc.) |
0.0 |
0.0 |
| Amgen Canada Inc.2,5 |
7.8 |
7.1 |
| Astellas Pharma Canada Inc.2,5,8 |
9.9 |
12.7 |
| AstraZeneca Canada Inc.2,5 |
4.3 |
6.1 |
| Axcan Pharma Inc.2 |
29.2 |
40.8 |
| Bausch & Lomb Canada Inc.6 |
0.0 |
- |
| Baxter Corporation5 |
0.4 |
0.1 |
| Bayer Inc., Healthcare Division2 |
4.5 |
3.3 |
| Biogen Idec Canada Inc.5 |
5.6 |
6.6 |
| BioMarin Canada Inc.5,6 |
59.2 |
- |
| Biovail Pharmaceuticals Canada, Division of Biovail Corporation |
3.5 |
4.6 |
| Biovitrum AB |
0.0 |
0.0 |
| Boehringer Ingelheim (Canada) Ltd.2 |
13.6 |
15.9 |
| Bracco Diagnostics Canada Inc. |
0.0 |
0.0 |
| Bristol-Myers Squibb Pharmaceutical Group5 |
8.1 |
10.1 |
| Celgene Canada5 |
6.3 |
2.8 |
| Duchesnay Inc. |
4.8 |
3.4 |
| Eli Lilly Canada Inc. (includes Provel Animal Health Division)2,5 |
10.7 |
10.2 |
| EMD Serono Canada Inc.2 |
15.3 |
15.7 |
| Ferring Inc. |
3.8 |
4.8 |
| Fournier Pharma Inc2,4 |
0.0 |
0.0 |
| Fresenius Kabi Canada |
0.5 |
0.7 |
| Fresenius Medical Care Canada |
0.0 |
0.0 |
| Galderma Canada Inc. |
0.1 |
0.4 |
| Genzyme Canada Inc.5 |
0.5 |
0.6 |
| Gilead Sciences Inc.2,5 |
28.1 |
32.6 |
| GlaxoSmithKline Inc.2 |
11.1 |
13.3 |
| Graceway Pharmaceuticals |
0.0 |
0.0 |
| Hoffmann-La Roche Ltd. Canada2 |
5.0 |
5.2 |
| Hospira Healthcare Corp. |
0.0 |
0.0 |
| INO Therapeutics2 |
0.0 |
6.9 |
| Iroko International LP |
0.0 |
0.0 |
| Janssen Inc.2,5 |
7.5 |
7.0 |
| Johnson & Johnson Merck, Consumer Pharmaceuticals of Canada |
0.0 |
0.0 |
| Lantheus MI Canada Inc. |
0.0 |
0.0 |
| LEO Pharma Inc.2 |
0.7 |
2.5 |
| Lundbeck Canada Inc.2 |
1.6 |
3.2 |
| Lundbeck Inc. (Ovation Pharmaceuticals Inc.) |
0.0 |
0.0 |
| McNeil Consumer Healthcare Canada |
2.4 |
1.9 |
| Merck Frosst Canada Ltd.2,5 |
10.3 |
12.1 |
| Merck Frosst - Schering Pharma2 |
0.1 |
0.3 |
| Merz Pharma Canada Ltd. |
20.5 |
109.7 |
| Novartis Consumer Health Canada Inc. |
0.0 |
0.0 |
| Novartis Pharmaceuticals Canada Inc.2,5 |
12.8 |
18.1 |
| Novo Nordisk Canada Inc.5 |
2.1 |
1.5 |
| Nycomed Canada Inc.3,5 |
0.5 |
0.6 |
| Otsuka America Pharmaceuticals2 |
0.0 |
0.0 |
| Paladin Laboratories Inc.2 |
0.4 |
0.2 |
| Pfizer Canada Inc.2,5 |
5.1 |
4.1 |
| Pharmascience Inc. |
8.8 |
9.9 |
| Purdue Pharma2 |
2.3 |
1.9 |
| Rare Disease Therapeutics Inc. |
0.0 |
0.0 |
| sanofi pasteur Ltd.2,5,9 |
48.9 |
52.7 |
| sanofi-aventis Pharma Inc.2,5,10 |
8.2 |
9.4 |
| Santhera Pharmaceuticals Canada Inc.5 |
2.9 |
7.8 |
| Schering-Plough Canada Inc.2 |
2.8 |
3.2 |
| Sepracor Pharmaceuticals Canada Inc. (Oryx Pharmaceuticals Inc.) |
0.03 |
0.0 |
| Servier Canada Inc.2 |
7.5 |
8.7 |
| Shire Canada Inc.2 |
0.0 |
0.0 |
| Shire Human Genetic Therapies5 |
2.5 |
2.1 |
| Sigma Tau Pharmaceuticals Inc.6 |
0.0 |
- |
| Sopherion Therapeutics Canada Inc. |
0.0 |
118.1 |
| Takeda Canada Inc.2,5 |
3.5 |
16.2 |
| Talecris Biotherapeutics Ltd.5 |
0.9 |
0.5 |
| Tercica Inc. |
0.0 |
0.0 |
| Teva Neuroscience Canada5 |
12.1 |
2.7 |
| Theramed Corp.6 |
0.0 |
- |
| Triton Pharma Inc.6 |
0.0 |
- |
| Tyco Healthcare Group Canada Inc. |
0.0 |
0.0 |
| UCB Pharma Canada Inc.5 |
10.1 |
44.1 |
| Valeant Canada Ltd.7 |
2.2 |
2.9 |
| Warner Chilcott Canada Inc.2,5 |
0.4 |
0.6 |
| Wyeth Animal Health |
0.0 |
0.0 |
| Wyeth Pharmaceuticals2,5 |
25.9 |
23.1 |
| YM Biosciences Inc.5 |
5277.6 |
13611.6 |
Notes:
- To avoid double counting of sales revenues, revenues from royalties are included in calculating each company's ratio but
not included in calculating industry-wide ratios. Federal and provincial government grants are subtracted from the R&D expenditure in calculating individual R&D-to-sales ratios but are included in calculating industry-wide ratios. Differences between the list of firms filing data on prices and those filing R&D data are due to differences in reporting practices of patentees and their affiliates or licensees. Note as well that some veterinary patentees (i.e., those without revenue from sales of products for human use) are required to file information on R&D expenditure but not price and sales information.
- Member of Rx&D.
- Formerly known as Altana Pharma Inc. (prev. BYK Canada Inc.)
- Merged with Solvay Pharma Inc.
- Member of BIOTECanada.
- Not a patentee in 2009.
- Formerly known as ICN Canada Ltd.
- Formerly known as Fujisawa Canada Inc.
- Formerly known as Aventis Pasteur Ltd.
- Formerly known as Aventis Pharma Inc.
Table 23 Current R&D Expenditures by Province/Territory, 2010
| Province |
Expenditures: all patentees ($000) |
Regional share (%) |
Expenditures ($000) |
Regional share (%) |
| Newfoundland |
4,666.9 |
0.4 |
3,999.6 |
0.4 |
| Prince Edward Island |
96.4 |
0.0 |
86.6 |
0.01 |
| Nova Scotia |
11,162.6 |
1.0 |
10,126.8 |
1.0 |
| New Brunswick |
2,134.1 |
0.2 |
1,730.5 |
0.2 |
| Quebec |
461,211.8 |
41.2 |
404,432.1 |
42.7 |
| Ontario |
500,163.2 |
44.7 |
406,323.2 |
42.9 |
| Manitoba |
7,459.8 |
0.7 |
5,909.3 |
0.6 |
| Saskatchewan |
3,338.9 |
0.3 |
2,485.4 |
0.3 |
| Alberta |
77,624.3 |
6.9 |
72,793.5 |
7.7 |
| British Columbia |
52,223.4 |
4.7 |
39,998.8 |
4.2 |
| Territories |
0.0 |
0.0 |
0.0 |
0.0 |
| Canada |
1,120,081.5 |
100.0* |
947,885.8 |
100.0* |
* Values in this column may not add to 100.0 due to rounding.
Table 24 Current R&D Expenditures by Performer and Province/Territory, 2010
| Province |
|
Patentees |
Other companies |
University |
Hospitals |
Others |
| Newfoundland |
$000 |
499.5 |
1,079.9 |
522.8 |
1,277.3 |
1,287.3 |
| % |
10.7 |
23.1 |
11.2 |
27.4 |
27.6 |
| Prince Edward Island |
$000 |
9.9 |
28.5 |
12.0 |
30.1 |
16.0 |
| % |
10.3 |
29.5 |
12.4 |
31.2 |
16.6 |
| Nova Scotia |
$000 |
1,433.8 |
2,097.2 |
3,397.2 |
2,017.7 |
2,216.4 |
| % |
12.8 |
18.8 |
30.4 |
18.1 |
19.9 |
| New Brunswick |
$000 |
225.7 |
808.8 |
44.7 |
450.9 |
604.0 |
| % |
10.6 |
37.9 |
2.1 |
21.1 |
28.3 |
| Quebec |
$000 |
266,989.6 |
96,206.2 |
8,705.5 |
23,815.3 |
65,495.3 |
| % |
57.9 |
20.9 |
1.9 |
5.2 |
14.2 |
| Ontario |
$000 |
235,129.6 |
105,659.8 |
32,174.1 |
67,598.7 |
59,601.2 |
| % |
47.0 |
21.1 |
6.4 |
13.5 |
11.9 |
| Manitoba |
$000 |
2,537.1 |
1,330.6 |
830.5 |
1,609.7 |
1,151.9 |
| % |
34.0 |
17.8 |
11.1 |
21.6 |
15.4 |
| Saskatchewan |
$000 |
755.8 |
832.5 |
703.2 |
293.6 |
753.8 |
| % |
22.6 |
24.9 |
21.1 |
8.8 |
22.6 |
| Alberta |
$000 |
52,717.4 |
10,589.7 |
6,318.5 |
3,070.9 |
4,927.9 |
| % |
67.9 |
13.64 |
8.1 |
4.0 |
6.3 |
| British Columbia |
$000 |
14,842.5 |
23,080.6 |
2,540.8 |
5,442.4 |
6,317.1 |
| % |
28.4 |
44.2 |
4.9 |
10.4 |
12.1 |
| Territories |
$000 |
0.0 |
0.0 |
0.0 |
0.0 |
0.0 |
| % |
- |
- |
- |
- |
- |
| Canada |
$000 |
575,140.9 |
241,714.1 |
55,249.1 |
105,606.5 |
142,370.9 |
| % |
51.4 |
21.6 |
4.9 |
9.4 |
12.6 |
Notes:
- The percentage under each R&D category gives the percentage of all money spent in that category in that province.
- Expenditures as a percentage of total means percentage of R&D expenditures in that province compared to total R&D in Canada.
- Rows and columns may not equal totals due to rounding.
- Current expenditures plus capital expenditures (equipment + depreciation) = total R&D expenditures.