Biosimilars in Canada: Current Environment and Future Opportunity
PDF - 647 KB
Biologic drugs have become an increasingly important segment of the global pharmaceutical market. In 2018, biologic medicines accounted for almost one third of all pharmaceutical sales in Canada, ranking Canada fourth highest in share of sales among the OECD countries. Canadians also ranked third in terms of spending on originator biologics, with per capita sales of $208.
Given the high use and cost of biologics in Canada, biosimilars offer an opportunity for significant cost savings. However, these potential savings have not been fully realized. Biosimilars are launched later in Canada than in Europe and the United States, and when they do arrive, biosimilar uptake tends to be lower than in other OECD countries. Even though the biosimilar discounts in Canada are greater than in other counties, Canadians still end up paying more, as the discounts do not offset the higher reference price of more expensive originator biologics.
This analysis examines the uptake, discounts, and estimates of realized and potential savings from biosimilars in Canada. The primary data source is the IQVIA MIDAS® Database from 2006 to 2018. The international markets examined include the Organisation for Economic Co-operation and Development (OECD) members, with a focus on the seven countries the PMPRB considers in reviewing the prices of patented medicines (PMPRB7): France, Germany, Italy, Sweden, Switzerland, the United Kingdom (UK), and the United States (US).
These findings will be published as part of an upcoming PMPRB NPDUIS chartbook, Biosimilars in Canada: Current Environment and Future Opportunity.
1. Biosimilars tend to be launched later and have a lower uptake in Canada than internationally
By the end of 2018, 5 biosimilars had been launched in Canada compared with 13 in Europe and 7 in the United States, some of which have been available for a number of years. For example, epoetin alfa biosimilars were launched in Europe in 2007, and biosimilars for follitropin alfa were launched in 2014, though neither are currently sold in Canada.
Once biosimilars are launched in Canada, their uptake is typically lower than in the OECD and PMPRB7 countries. In the fourth quarter of 2018 (Q4-2018), only the somatropin biosimilar outpaced international uptake. Even after indexing based on the time of launch, the uptake of infliximab, etanercept, and insulin glargine biosimilars in Canada lags behind other countries.
Initial biosimilar approvals and market availability in Canadian and international markets, Q4-2018
| Biologic medicine (Originator) |
Europe |
United States |
Canada |
| Approval |
First sales |
Approval |
First sales |
Approval |
First sales |
| Infliximab (Remicade) |
Sept-13 |
Q4-2013 |
Apr-16 |
Q4-2016 |
Jan-14 |
Q1-2015 |
| Adalimumab (Humira) |
Mar-17 |
Q4-2018 |
Sept-16 |
|
May-18 |
|
| Etanercept (Enbrel) |
Jan-16 |
Q1-2016 |
Aug-16 |
|
Aug-16 |
Q4-2016 |
| Insulin glargine (Lantus) |
Sept-14 |
Q2-2015 |
Dec-15 |
Q4-2016 |
Sept-15 |
Q1-2016 |
| Rituximab (MabThera/Rituxan) |
Feb-17 |
Q2-2017 |
Nov-18 |
|
Apr-19 |
|
| Trastuzumab (Herceptin) |
Nov-17 |
Q2-2018 |
Dec-17 |
|
May-19 |
|
| Filgrastim (Neupogen) |
Sept-08 |
Q4-2008 |
Mar-15 |
Q3-2015 |
Dec-15 |
Q2-2016 |
| Bevacizumab (Avastin) |
Jan-18 |
|
Sept-17 |
|
Apr-18 |
|
| Epoetin alfa (Eprex/Erypo) |
Aug-07 |
Q4-2007 |
May-18 |
Q3-2018 |
|
|
| Insulin lispro (Humalog) |
Jul-17 |
Q4-2017 |
Dec-17 |
Q1-2018 |
Nov-17 |
|
| Enoxaparin sodium (Clexane/Lovenox) |
Sept-16 |
Q1-2017 |
NA* |
NA* |
|
|
| Pegfilgrastim (Neulasta) |
Sept-18 |
Q4-2018 |
Jun-18 |
Q3-2018 |
Apr-18 |
|
| Somatropin (Genotropin) |
Apr-06 |
Q2-2006 |
May-06 |
Q1-2007 |
Apr-09 |
Q3-2009 |
| Teriparatide (Forsteo/Forteo) |
Jan-17 |
|
|
|
|
|
| Follitropin alfa (GONAL-f) |
Sept-13 |
Q2-2014 |
|
|
|
|
| Total |
15 |
13 |
12 |
7 |
11 |
5 |
*Not approved under a Biologic License Application in the US; thus, approved generic versions are not reflected in this analysis.
Biosimilar uptake, by medicine, in Canada, the OECD, and the PMPRB7, Q4-2018
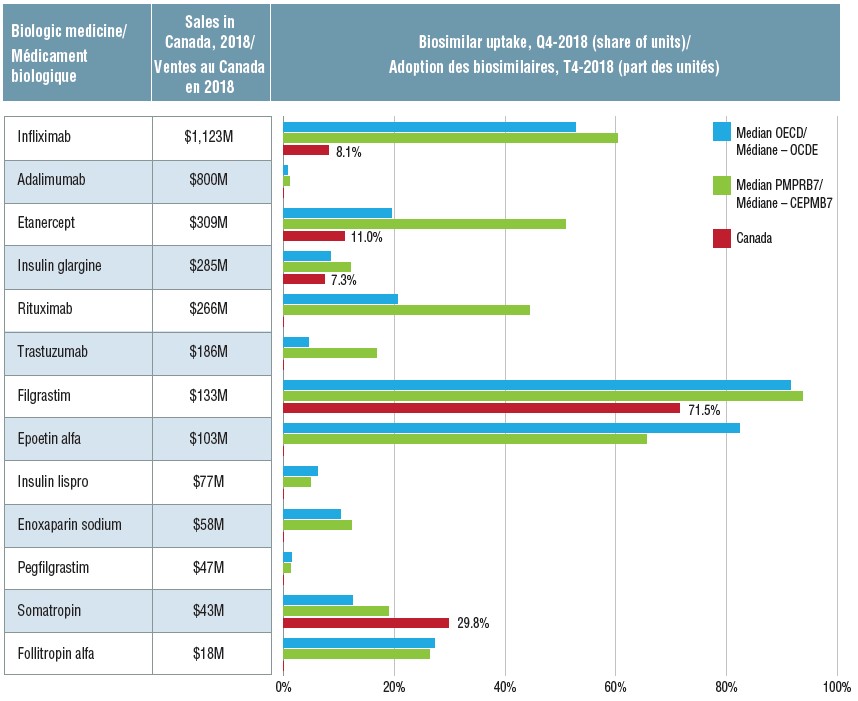
Figure description
This table and accompanying bar graph provide information on 13 biosimilars sold in Canada, Europe, and/or the United States in the fourth quarter of 2018. The biosimilar uptake in share of units is given for the median of the OECD countries, the median of the seven PMPRB comparator counties, and for Canada (if available). The total 2018 Canadian sales for each medicine (including the originator and any biosimilars) in millions of dollars is also provided.
| |
Biosimilar uptake by share of units |
| Biologic medicine |
Sales in Canada, 2018 (in millions of dollars) |
Median OECD |
Median PMPRB7 |
Canada |
| Infliximab |
$1,123 |
52.7% |
60.2% |
8.1% |
| Adalimumab |
$800 |
0.7% |
1.0% |
0.0% |
| Etanercept |
$309 |
19.4% |
50.9% |
11.0% |
| Insulin glargine |
$285 |
8.4% |
12.0% |
7.3% |
| Rituximab |
$266 |
20.5% |
44.3% |
0.0% |
| Trastuzumab |
$186 |
4.5% |
16.7% |
0.0% |
| Filgrastim |
$133 |
91.6% |
93.7% |
71.5% |
| Epoetin alfa |
$103 |
82.3% |
65.5% |
- |
| Insulin lispro |
$77 |
6.1% |
4.9% |
0.0% |
| Enoxaparin sodium |
$58 |
10.2% |
12.3% |
- |
| Pegfilgrastim |
$47 |
1.4% |
1.3% |
0.0% |
| Somatropin |
$43 |
12.4% |
19.0% |
29.8% |
| Follitropin alfa |
$18 |
27.3% |
26.3% |
- |
2. Biosimilars take longer to gain market share in Canada than internationally
Biosimilars generally take one to two years to start gaining market share in Canada. This is very different from the international experience where there is steady market growth following launch.
These graphs compare the biosimilar uptake in Canada with international norms for four medicines: infliximab, etanercept, insulin glargine, and filgrastim. International comparisons include (1) the OECD median; and (2) the median of the four countries with the highest uptake in the OECD (based on uptake three years after launch). The graphs are indexed quarterly beginning with the launch date (Q0) in each market.
After an initial slow start, the uptake of biosimilars in Canada varies widely. The market share of the etanercept and infliximab biosimilars remained well below the OECD median a number of years after launch, with the infliximab biosimilar Inflectra only at 8% of the Canadian market after year 4 compared to a median of 55% for the OECD. In contrast, the filgrastim biosimilar Grastofil exceeded the OECD median uptake by midyear in year 2, and made another significant jump in the last quarter of year 3. This suggests that biosimilars used to treat acute conditions are able to a gain a better market share than those indicated for chronic diseases. Insulin glargine has experienced a much lower biosimilar uptake overall compared to other biosimilars, possibly due to its comparatively long treatment duration and low treatment costs.
Index of biosimilar uptake from launch, Canada and the OECD
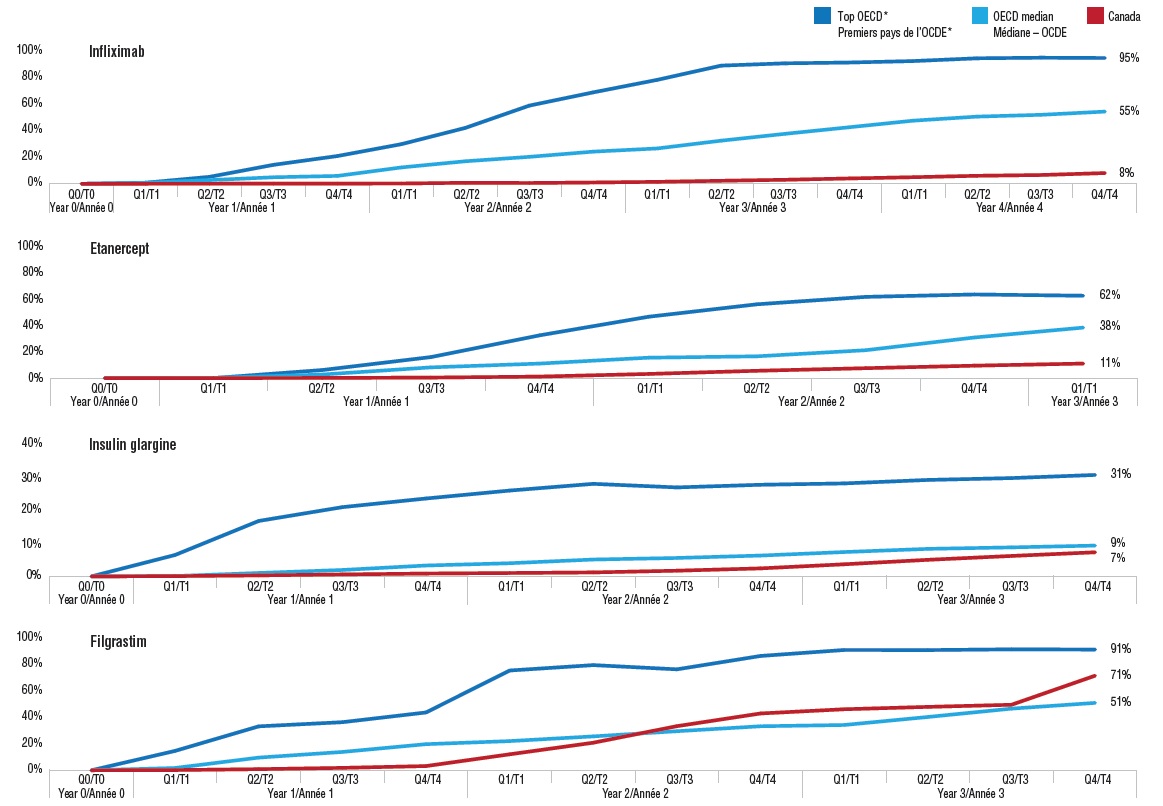
Figure description
This series of four line graphs gives the index of biosimilar uptake from launch for four medicines with biosimilars available in Canada. The uptake in share of units is given for Canada, the OECD median, and the median of the four countries with the highest uptake in the OECD (referred to as the top OECD).
| |
Year 0 |
Year 1 |
Year 2 |
Year 3 |
Year 4 |
| |
Quarter 1 |
Quarter 2 |
Quarter 3 |
Quarter 4 |
Quarter 1 |
Quarter 2 |
Quarter 3 |
Quarter 4 |
Quarter 1 |
Quarter 2 |
Quarter 3 |
Quarter 4 |
Quarter 1 |
Quarter 2 |
Quarter 3 |
Quarter 4 |
| Etanercept |
Canada |
0% |
0.02% |
0.15% |
0.41% |
1.17% |
3.16% |
5.56% |
7.52% |
9.42% |
11.01% |
|
|
|
|
|
|
|
| OECD median |
0% |
0.20% |
2.72% |
8.13% |
11.00% |
15.45% |
16.49% |
21.11% |
30.73% |
38.19% |
|
|
|
|
|
|
|
| Top OECD* |
0% |
0.05% |
6.10% |
15.91% |
32.35% |
46.38% |
55.82% |
61.42% |
63.24% |
62.28% |
|
|
|
|
|
|
|
| Filgrastim |
Canada |
0% |
0.17% |
0.85% |
1.82% |
3.19% |
12.08% |
20.84% |
33.35% |
42.95% |
46.13% |
47.92% |
49.52% |
71.49% |
|
|
|
|
| OECD median |
0% |
1.74% |
9.59% |
13.86% |
19.74% |
22.06% |
25.62% |
29.54% |
33.28% |
34.24% |
40.29% |
46.60% |
50.94% |
|
|
|
|
| Top OECD* |
0% |
14.65% |
33.21% |
36.35% |
43.70% |
75.41% |
79.50% |
76.30% |
86.42% |
90.93% |
90.85% |
91.43% |
91.24% |
|
|
|
|
| Infliximab |
Canada |
0% |
0.02% |
0.06% |
0.12% |
0.20% |
0.22% |
0.77% |
0.61% |
0.99% |
1.48% |
2.29% |
3.04% |
4.05% |
4.99% |
6.06% |
6.65% |
8.12% |
| OECD median |
0% |
0.73% |
2.79% |
4.95% |
5.97% |
12.38% |
17.04% |
20.38% |
24.32% |
26.72% |
32.61% |
37.79% |
42.74% |
47.72% |
50.79% |
52.15% |
54.58% |
| Top OECD* |
0% |
0.83% |
5.26% |
14.34% |
20.99% |
29.96% |
42.26% |
59.11% |
69.12% |
78.57% |
89.34% |
91.07% |
91.67% |
92.77% |
94.86% |
95.32% |
95.08% |
| Insulin glargine |
Canada |
0% |
0.08% |
0.30% |
0.59% |
0.86% |
1.02% |
1.20% |
1.72% |
2.42% |
3.66% |
5.01% |
6.18% |
7.29% |
|
|
|
|
| OECD median |
0% |
0.10% |
1.03% |
1.94% |
3.29% |
3.98% |
5.10% |
5.57% |
6.30% |
7.36% |
8.32% |
8.77% |
9.31% |
|
|
|
|
| Top OECD* |
0% |
6.47% |
16.76% |
20.93% |
23.55% |
25.95% |
27.98% |
26.90% |
27.70% |
28.11% |
29.16% |
29.72% |
30.67% |
|
|
|
|
Note: The Canadian market includes both retail and hospital segments. Index begins at time of launch in each market. The period of analysis (years and quarters) is based on availabilty in Canada: the period from the time of launch until the time of this analysis (Q4-2018).
* Based on the median value for the four countries with the highest uptake in the OECD after three years.
3. Biosimilar prices in Canada are generally higher than international norms, despite greater discounts off originator pricing
Internationally, the prices of biosimilars are much lower than in Canada. On average, PMPRB median prices are 15% lower than Canadian levels, and median OECD prices are 39% lower. Although larger price discounts are generally realized in Canada, they are still not enough to offset the difference between Canadian price levels and international norms because the prevailing prices of originator biologics are higher in Canada.
In Canada, there is no discernable relationship between the relative discount and the uptake, as many other factors ultimately influence the switch from the originator to the biosimilar biologic. For example, infliximab has the greatest price discount but has experienced very low uptake, while filgrastim, which has the lowest discount, has the greatest uptake.
This also applies to international comparisons. Infliximab, which has a much higher relative Canadian price discount, lags significantly behind the OECD median in terms of uptake. Meanwhile, filgrastim, which has a much lower Canadian discount, has the highest Canadian biosimilar uptake, even when considering the indexed time from launch.
Biosimilar foreign-to-Canadian price ratios and price discounts relative to originator biologic, Q4-2018
| Biologic medicine |
Price in Canada (CAD) |
Median foreign prices (CAD) |
Foreign-to-Canadian price ratios |
Biosimilar price discount relative to originator biologic* |
| PMPRB7 |
OECD |
PMPRB7 |
OECD |
Canada |
PMPRB7 |
OECD |
| Infliximab |
$5.36 |
$5.83 |
$4.44 |
1.09 |
0.83 |
45.80% |
33.22% |
35.54% |
| Adalimumab |
|
$11.31 |
$11.31 |
|
|
|
17.55% |
25.84% |
| Etanercept |
$5.29 |
$4.79 |
$4.38 |
0.91 |
0.83 |
34.53% |
31.00% |
31.00% |
| Insulin glargine |
$0.05 |
$0.04 |
$0.04 |
0.84 |
0.77 |
23.39% |
16.12% |
19.58% |
| Rituximab |
|
$2.66 |
$2.39 |
|
|
|
17.66% |
15.96% |
| Trastuzumab |
|
$3.63 |
$3.43 |
|
|
|
5.65% |
8.64% |
| Filgrastim |
$0.48 |
$0.30 |
$0.19 |
0.62 |
0.39 |
20.98% |
35.50% |
53.39% |
| Epoetin alfa |
|
$11.18 |
$7.77 |
|
|
|
37.06% |
40.59% |
| Insulin lispro |
|
$0.03 |
$0.02 |
|
|
|
18.44% |
22.11% |
| Enoxaparin sodium |
|
$1.02 |
$0.99 |
|
|
|
-3.93% |
16.98% |
| Pegfilgrastim |
|
$237.33 |
$160.57 |
|
|
|
-1.53% |
28.19% |
| Sales-weighted average |
|
|
|
0.85 |
0.61 |
30.05% |
23.49% |
29.51% |
* Calculated using the price of the originator biologic in the three-month period before biosimilar introduction.
4. Canadians are only realizing a fraction of the potential savings from biosimilars
The biosimilars of infliximab, etanercept, insulin glargine, and filgrastim potentially saved Canadians an estimated $93.9 million in drug costs in 2018. However, if biosimilar uptake and pricing in Canada had been more closely aligned with median OECD levels, the savings could have been many times greater.
Two alternative scenarios based on OECD biosimilar uptake and pricing are used to determine additional potential savings for 2018 and projected savings in 2021:
- OECD moderate estimate: Assumes that Canadian biosimilar uptake matched the OECD median (indexed to launch) and biosimilar prices remained at the actual quarterly average Canadian price level.
This would have resulted in a potential savings of $345.6 million in 2018.
- OECD high estimate: Assumes that Canadian biosimilar uptake matched the median uptake in the top four OECD countries and the Canadian price matched the OECD median price.
This would have resulted in a potential savings of $807.7 million in 2018.
Projecting to 2021, if the uptake of biosimilars in Canada continue on their current trends and prices remain at Q4-2018 levels, the total estimated future savings would be $293.9 million. If the moderate OECD uptake rates are applied, this increases to $694.7 million. Potential savings increase even further if the high OECD estimate is applied, resulting in estimated future savings of $1,135.7 million, $841.7 million more than the Canadian estimate.
Estimated savings from biosimilars in Canada, actual and potential for 2018, and projected savings for 2021 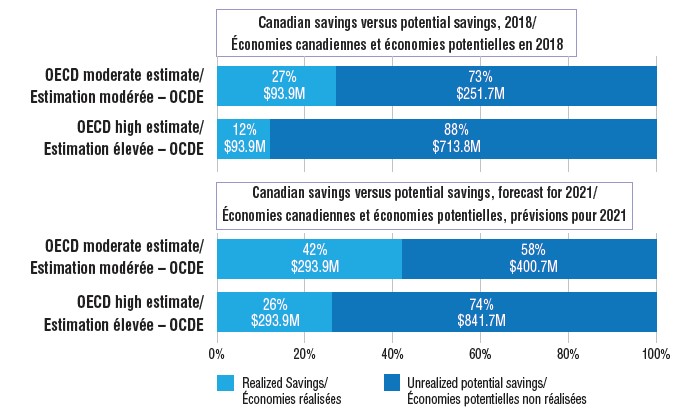
Figure description
There are two sets of bar graphs in this illustration. The first set shows the realized cost savings from biosimilars in Canada in 2018 and compares them to the potential savings that could have been realized under two alternate scenarios: a moderate and a high estimate using OECD median values for uptake and/or pricing. The second set compares the forecast savings in Canada in 2021 with the potential savings using the moderate and high OECD estimate.
| |
Realized (or forecast) savings |
Unrealized potential savings |
| 2018 |
| OECD moderate estimate |
$93.9 million (27%) |
$251.7 million (73%) |
| OECD high estimate |
$93.9 million (12%) |
$713.8 million (88%) |
| 2021 |
| OECD moderate estimate |
$293.9 million (42%) |
$400.7 million (58%) |
| OECD high estimate |
$293.9 million (26%) |
$841.7 million (74%) |
| Biologic medicine |
Total Canadian sales for the medicine, 2018 |
Estimated actual savings,* 2018 |
Potential savings, 2018 |
Projected savings, 2021 (forecasted) |
| OECD moderate estimate |
OECD high estimate |
Canadian status quo |
OECD moderate estimate |
OECD high estimate |
| Infliximab |
$1,122.8M |
$55.2M |
$287.8M |
$588.0M |
$212.7M |
$568.6M |
$834.8M |
| Etanercept |
$308.6M |
$11.4M |
$31.0M |
$86.2M |
$31.5M |
$78.8M |
$131.1M |
| Insulin glargine |
$285.4M |
$5.5M |
$7.4M |
$35.4M |
$18.7M |
$17.1M |
$56.9M |
| Filgrastim |
$132.6M |
$21.8M |
$19.4M |
$98.1M |
$31.2M |
$30.2M |
$112.9M |
| Savings |
|
$93.9M |
$345.6M |
$807.7M |
$293.9M |
$694.7M |
$1,135.7M |
| Canadian vs Potential (%) |
|
|
27.2% |
11.6% |
|
42.3% |
25.9% |
* Assuming that the total use of each medicine remained the same and that the price of the reference medicine did not drop after the launch of the biosimilar.
5. New biosimilars entering the Canadian market present an opportunity for significant future savings
Three new biosimilar medicines were launched in Canada in 2019 and three more are expected by the end of 2020.
Their forecasted savings in 2023 were generated for the following scenarios:
- Canadian estimate: Assumes that the Canadian price of the originator biologic is discounted by the average Canadian biosimilar discount (30.05%) unless a publically available price is available.
- OECD moderate estimate: Assumes that the OECD median uptake is combined with the Canadian prices used in scenario 1.
- OECD high estimate: Assumes that the median uptake in the top four OECD countries is combined with the OECD median price. If no OECD biosimilar price was available, the OECD median prices were discounted by the OECD average biosimilar discount of 29.51%.
Five of the new drugs have indications for acute diseases or cancer. Their rate of uptake is modelled after the indexed uptake of the filgrastim biosimilar (illustrated in section 2), which has a higher market share in Canada than in the OECD. The new insulin drug is expected to follow a similar trend as insulin glargine. Total molecule use was projected based on the Canadian use of the reference biologic.
The Canadian scenario estimates a total savings of $222 million for the six medicines in 2023. These potential savings double under the OECD high estimate scenario.
Estimated potential savings of new biosimilars in 2023, Canada
| Biologic medicine |
Canadian
sales, 2018 |
First biosimilar availability |
2023 forecast |
Potential savings in 2023 |
| NOC |
Launch status |
Anticipated launch |
Estimated sales without biosimilar |
Canadian estimate |
OECD moderate estimate |
OECD high estimate |
| Ranibizumab |
$317M |
- |
|
2020 |
$372M |
$79M
(21.3%) |
$54M
(14.6%) |
$201M
(54.2%) |
| Rituximab |
$266M |
Apr-19 |
|
2020 |
$283M |
$59M
(20.8%) |
$40M
(14.2%) |
$83M
(29.3%) |
| Trastuzumab |
$186M |
May-19 |
Jun-19 |
|
$194M |
$46M
(23.8%) |
$39M
(20.2%) |
$83M
(43.0%) |
| Bevacizumab |
$118M |
Apr-18 |
Aug-19 |
|
$130M |
$30M
(23.4%) |
$26M
(19.8%) |
$54M
(41.4%) |
| Insulin lispro |
$77M |
Nov-17 |
|
Q4-2019 |
$96M |
$3M
(3.1%) |
$3M
(3.4%) |
$12M
(12.8%) |
| Pegfilgrastim |
$47M |
Apr-18 |
Feb-19 |
|
$22M |
$5M
(20.7%) |
$4M
(17.9%) |
$13M
(61.7%) |
| Total savings (2023) |
$1,011M |
|
|
|
$1,097M |
$222M
(20.3%) |
$167M
(15.2%) |
$447M
(40.7%) |
Note: Biologics were included if they were listed as a Schedule D and Schedule-Prescription as per Health Canada’s Drug Product Database (DPD). Insulin biologics were included in the analysis regardless of whether a prescription is required in Canada.
Biosimilars are subsequent entry versions of Canadian approved originator biologics with demonstrated similarity to a reference biologic drug.
Data source: IQVIA MIDAS® Database (all rights reserved), 2006 to 2018.
Limitations: Canadian and international sales and list prices available in the IQVIA MIDAS® Database are estimated manufacturer factory-gate list prices and do not reflect off-invoice price rebates and allowances, managed entry agreements, or patient access schemes.
Disclaimer: Although this information is based in part on data obtained under license from IQVIA’s MIDAS® Database, the statements, findings, conclusions, views, and opinions expressed in this study are exclusively those of the PMPRB and are not attributable to IQVIA.