Pressures behind the rising costs in Canadian private drug plans, 2018
PDF - 588 KB
Private insurers are the second largest payer of prescription drugs in Canada, financing over one third of all prescribed drug spending. This study analyzes the evolving cost pressures driving the change in private drug plan expenditures. These include changes in the beneficiary population (demographic effect); increases or decreases in the amount of drugs used (volume effect); shifts between lower- and higher-cost drugs (drug-mix effect); and changes to drug prices as well as shifts from brand-name to generic or biosimilar options (price effect). The overall growth in expenditures in any given year is the net result of these opposing “push” and “pull” effects.
The results are based on an analysis of 2009 to 2018 data from the IQVIA Private Drug Plan Database, with a focus on the change in private drug plan expenditures from 2017 to 2018. This study is part of a broader PMPRB reporting on private drug plans and complements the PMPRB’s annual CompassRx report on public drug plan expenditures.
Increased cost pressure from higher-cost drugs in 2018 muted by the introduction of OHIP+ and a drop in generic prices
In 2018, the increasing upward push from higher-cost drugs was offset by significant one-time cost reductions, as private coverage for Ontario residents age 24 and younger shifted to the public plan (OHIP+ program) and a widespread generic pricing policy introduced in April 2018 drove prices down. This resulted in a temporary drop in the overall drug cost growth, with private plan expenditures increasing by only 0.6% in 2018, much less than the consistent annual average growth of close to 6% over the previous 5-year period (CAGR of 5.7%).
The use of higher-cost drugs (drug-mix effect) has become an increasingly important cost driver for private plans. Its upward pressure on expenditures has gradually increased over the last decade, from 3% in 2009 to a high of 5.2% in 2018. The pressure from direct-acting antiviral (DAA) drugs for hepatitis C, which was a notable cost driver in previous years, only had a minimal impact on the growth in private drug plan expenditures in 2017 and 2018.
The combined pressure of an increase in the number of active beneficiaries and the volume of drugs used generally pushes drug costs upward by 3–4% each year. In 2018, the introduction of OHIP+ coverage in Ontario pulled drug costs down by 2.8% nationally and by 6.6% in Ontario. While drug costs related to beneficiaries aged 24 and younger accounted for over one tenth of private plan costs in Ontario in 2017, this share dropped by half in 2018.
Cost savings from generic and biosimilar substitution (-2.3%), as well as price reductions (-2.5%), pulled costs down by a marked 4.7% in 2018, a significant change from the 2–3% downward pressure in previous years.
Drug cost drivers, 2009 to 2018
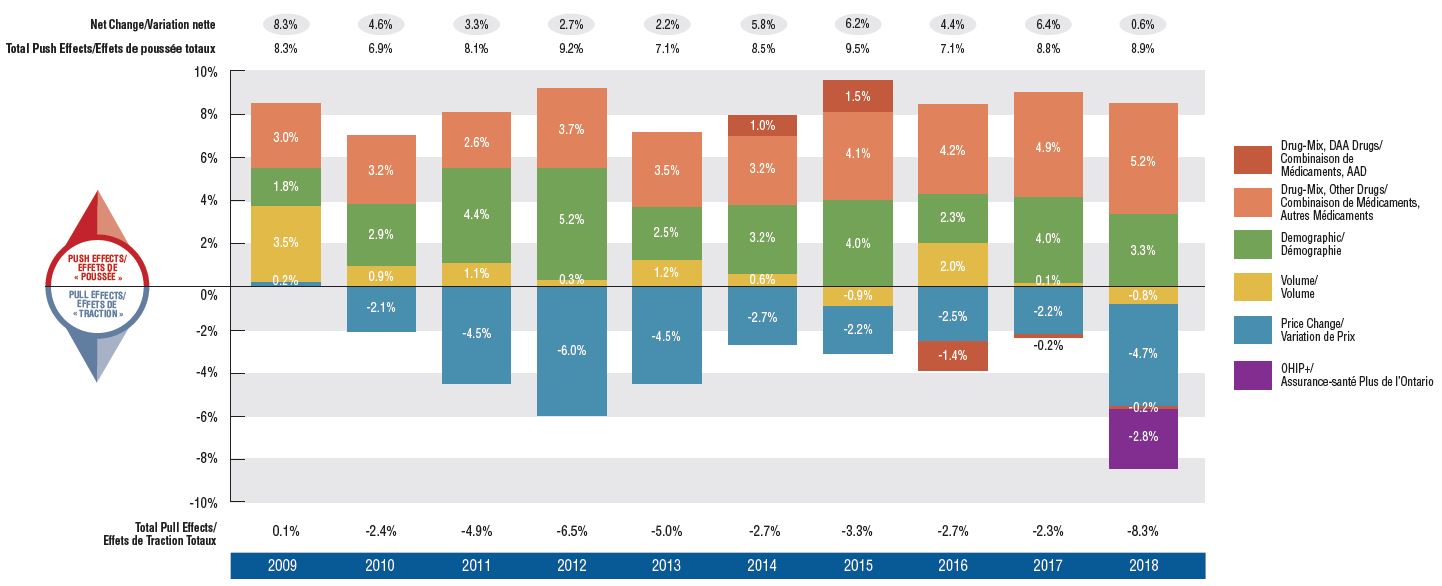
Figure description
This column graph describes the primary factors that impacted the rates of change in the annual drug costs of Canadian private drug plans from 2009 to 2018: demographic, volume, price, and drug-mix effects. The drug-mix for direct-acting antiviral hepatitis C drugs and the effects from OHIP+ are reported separately. Total positive push effects, negative pull effects, and net effects are reported for each year.
|
2009 |
2010 |
2011 |
2012 |
2013 |
2014 |
2015 |
2016 |
2017 |
2018 |
| Drug-Mix Effect, Direct-Acting Antiviral Drugs |
– |
– |
– |
– |
– |
1.0% |
1.5% |
-1.4% |
-0.2% |
-0.2% |
| Drug-Mix Effect, Other Drugs |
3.0% |
3.2% |
2.6% |
3.7% |
3.5% |
3.2% |
4.1% |
4.2% |
4.9% |
5.2% |
| Demographic Effect |
1.8% |
2.9% |
4.4% |
5.2% |
2.5% |
3.2% |
4.0% |
2.3% |
4.0% |
3.3% |
| Volume Effect |
3.5% |
0.9% |
1.1% |
0.3% |
1.2% |
0.6% |
-0.9% |
2.0% |
0.1% |
-0.8% |
| Price Effect |
0.2% |
-2.1% |
-4.5% |
-6.0% |
-4.5% |
-2.7% |
-2.2% |
-2.5% |
-2.2% |
-4.7% |
| OHIP+ |
- |
- |
- |
- |
- |
- |
- |
- |
- |
-2.8% |
| Total Push Effects |
8.3% |
6.9% |
8.1% |
9.2% |
7.1% |
8.5% |
9.5% |
7.1% |
8.8% |
8.9% |
| Total Pull Effects |
0.1% |
-2.4% |
-4.9% |
-6.5% |
-5.0% |
-2.7% |
-3.3% |
-2.7% |
-2.3% |
-8.3% |
| Net Change |
8.3% |
4.6% |
3.3% |
2.7% |
2.2% |
5.8% |
6.2% |
4.4% |
6.4% |
0.6% |
High-cost drugs are top contributors to the drug-mix effect
The shift in use from lower- to higher-cost drugs pushed drug costs up by 5.2% in 2018. More than half of this impact (2.8%) came from drugs with annual costs per active beneficiary of $10,000 or more. For instance, eight of the drugs with the greatest impact were high-cost drugs. These included five immunosuppressive agents, one oncology drug, one anti-asthmatic drug, and a new DAA drug for hepatitis C. The remaining two top contributors were high-use drugs with a relatively low annual treatment costs.
Top 10 drugs contributing to the drug-mix effect, 2018
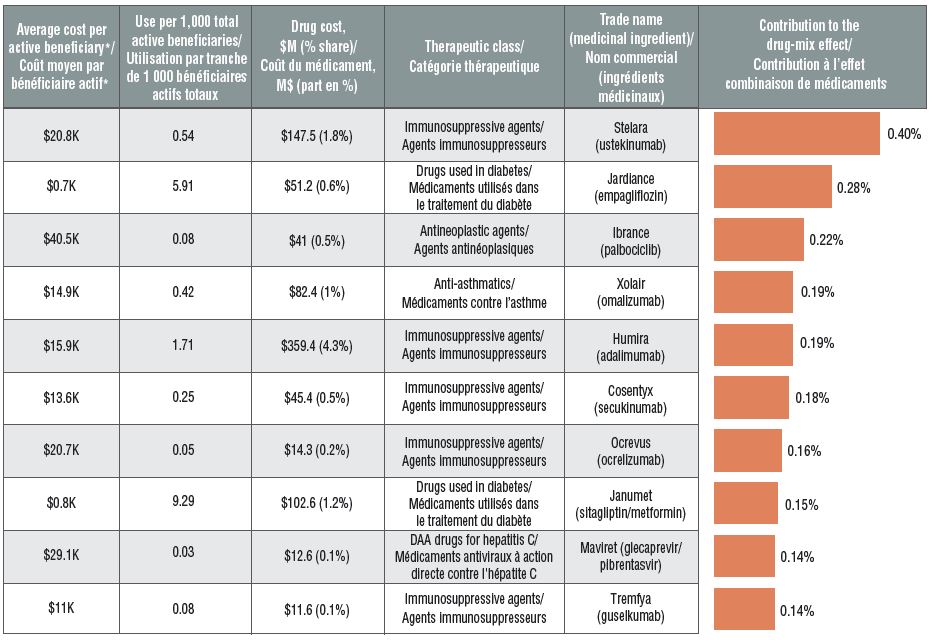
Figure description
This table and accompanying bar graph describe the top 10 drugs in private drug plans by their contribution to the drug-mix effect in 2018.
| Average cost per active beneficiary*, in thousands of dollars |
Use per 1,000 total active beneficiaries |
Drug cost, in millions of dollars (% share) |
Therapeutic class |
Trade name (medicinal ingredient) |
Contribution to the drug-mix effect |
| $20.8 |
0.54 |
$147.5 (1.8%) |
Immunosuppressive agents |
Stelara (ustekinumab) |
0.40% |
| $0.7 |
5.91 |
$51.2 (0.6%) |
Drugs used in diabetes |
Jardiance (empagliflozin) |
0.28% |
| $40.5 |
0.08 |
$41.0 (0.5%) |
Antineoplastic agents |
Ibrance (palbociclib) |
0.22% |
| $14.9 |
0.42 |
$82.4 (1.0%) |
Anti-asthmatics |
Xolair (omalizumab) |
0.19% |
| $15.9 |
1.71 |
$359.4 (4.3%) |
Immunosuppressive agents |
Humira (adalimumab) |
0.19% |
| $13.6 |
0.25 |
$45.4 (0.5%) |
Immunosuppressive agents |
Cosentyx (secukinumab) |
0.18% |
| $20.7 |
0.05 |
$14.3 (0.2%) |
Immunosuppressive agents |
Ocrevus (ocrelizumab) |
0.16% |
| $0.8 |
9.29 |
$102.6 (1.2%) |
Drugs used in diabetes |
Janumet (sitagliptin/metformin) |
0.15% |
| $29.1 |
0.03 |
$12.6 (0.1%) |
Direct-acting antiviral drugs for hepatitis C |
Maviret (glecaprevir/ pibrentasvir) |
0.14% |
| $11.0 |
0.08 |
$11.6 (0.1%) |
Immunosuppressive agents |
Tremfya (guselkumab) |
0.14% |
* Based on the total drug cost divided by the number of active beneficiaries in a given year. Note that the resulting cost per beneficiary may be underestimated, as some beneficiaries may have only used the drug for part of the year.
Spending on high-cost drugs has more than tripled since 2009
In 2009, private plans reimbursed 79 drugs with an annual average cost per active beneficiary of $10,000 or more, representing approximately 12% of the total private drug plan costs. By 2018, the number of high-cost drugs more than doubled to 189, representing 29% of the drug costs. This is a high-growth market segment, demonstrated by the 3.5-fold increase in related costs over the last decade.
Trends in the number and cost of high-cost drugs
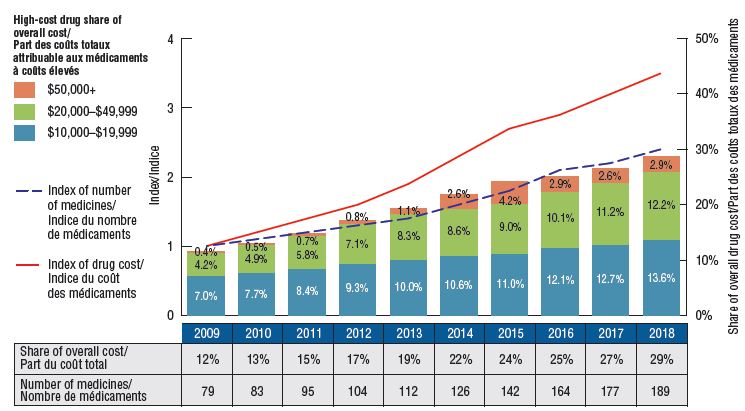
Figure description
This bar graph depicts the trends in the number of high-cost drugs and their share of total drug costs for private drug plans from 2009 to 2018.
The high-cost drug share of total costs is represented by the bars and is given for each year. Each bar is subdivided into bands based on the average annual costs per beneficiary: $10,000 to $20,000; $20,000 to $50,000; and $50,000 and greater. An index of the number of medicines and an index of drug cost are represented by superimposed lines on the graph. Both indices are set to a value of 1.0 for 2009. An accompanying table gives the number of medicines for each year.
|
2009 |
2010 |
2011 |
2012 |
2013 |
2014 |
2015 |
2016 |
2017 |
2018 |
| High-cost drug share of overall drug cost |
12% |
13% |
15% |
17% |
19% |
22% |
24% |
25% |
27% |
29% |
| Share of $10K to $20K |
7.0% |
7.7% |
8.4% |
9.3% |
10.0% |
10.6% |
11.0% |
12.1% |
12.7% |
13.6% |
| Share of $20K to $50K |
4.2% |
4.9% |
5.8% |
7.1% |
8.3% |
8.6% |
9.0% |
10.1% |
11.2% |
12.2% |
| Share of $50K and greater |
0.4% |
0.5% |
0.7% |
0.8% |
1.1% |
2.6% |
4.2% |
2.9% |
2.6% |
2.9% |
| Index of number of medicines |
1.0 |
1.1 |
1.2 |
1.3 |
1.4 |
1.6 |
1.8 |
2.1 |
2.2 |
2.4 |
| Index of medicine costs |
1.0 |
1.2 |
1.4 |
1.6 |
1.9 |
2.3 |
2.7 |
2.9 |
3.2 |
3.5 |
| Number of medicines |
79 |
83 |
95 |
104 |
112 |
126 |
142 |
164 |
177 |
189 |
Generic pricing policies contributed to a relatively strong downward pressure on private drug plan costs
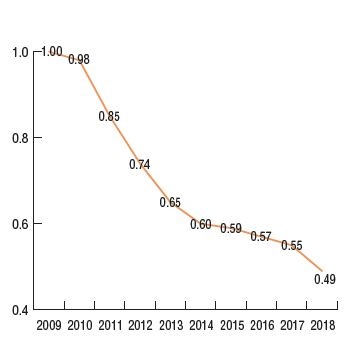
The generic pricing policy that came into effect in April 2018 reduced the prices of nearly 70 generic drugs to as little as 10% of their brand reference price. This had a significant impact on private drug plan costs, further driving the average generic unit cost down to half of what it was in 2009, with an 11% average decline between 2017 and 2018. This decrease reduced the overall drug costs by 2.5% in private plans in 2018.
The downward pressure from both brand-to-generic and biologic-to-biosimilar substitution was 2.3%. Perindopril, indapamide/perindopril, and aripiprazole accounted for more than half of the savings. Biosimilar substitution only contributed a small but measurable (0.2%) reduction to overall drug costs.
Per unit cost index, generic drugs*, 2009 to 2018.
Top generic substitutions contributing to the price effect, 2018
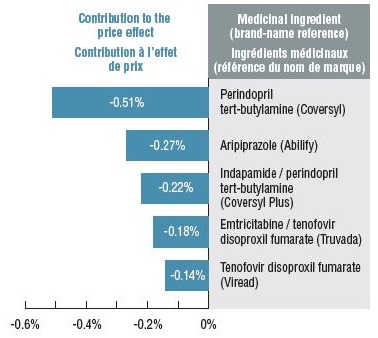
Figure description
This figure has two parts. The first is a line graph that gives the per unit cost index for oral solid generic drugs in private plans from 2009 to 2018. The second lists the top generic substitutions that contributed to the price effect in 2018.
Cost index for generic drugs:
|
2009 |
2010 |
2011 |
2012 |
2013 |
2014 |
2015 |
2016 |
2017 |
2018 |
| Index |
1 |
0.98 |
0.85 |
0.74 |
0.65 |
0.60 |
0.59 |
0.57 |
0.55 |
0.49 |
Top contributors to generic substitution:
|
Medicinal ingredient |
Brand-name reference |
Contribution to the price effect |
| Perindopril tert-butylamine |
Coversyl |
-0.51% |
| Aripiprazole |
Abilify |
-0.27% |
| Indapamide / perindopril tert-butylamine |
Coversyl Plus |
-0.22% |
| Emtricitabine / tenofovir disoproxil fumarate |
Truvada |
-0.18% |
| Tenofovir disoproxil fumarate |
Viread |
-0.14% |
*The analysis was restricted to oral solid drugs to ensure consistency in units.
Method: This study uses a cost-driver model to disaggregate and measure the impact of a number of effects. For a detailed description of the approach, see the PMPRB report The Drivers of Prescription Drug Expenditures: A Methodological Report, 2013.
Data source: IQVIA Private Pay Direct Drug Plan (PDP) Database. Capture rate: 85.7%.
Limitation: Sales and unit prices available from the IQVIA PDP database do not reflect off-invoice price rebates.
Disclaimer: Although this information is based in part on data obtained under license by IQVIA, the statements, findings, conclusions, views, and opinions expressed in this report are exclusively those of the PMPRB and are not attributable to IQVIA.