Alignment of oncology drug coverage across Canada
PDF - 1.30 MB
Determining which drugs to cover is key to the development of a national pharmacare program in Canada. This study explores the current coverage of oncology medicines across provincial public drug programs.
The analysis focuses on 85 medicines reviewed by the interim Joint Oncology Drug Review (iJODR) and the pan-Canadian Oncology Drug Review (pCODR) from March 1, 2007, through June 30, 2018. It reports on the percentage of these medicines that are listed in province-specific programs for each of the pCODR participating provinces, as well as the public drug programs in Quebec and Canadian private drug plans, as of December 31, 2018. Weighted listing rates, based on Canadian national retail and hospital sales in 2018, were used to determine the relative importance of the medicines listed.
This preliminary analysis will form the basis of a more comprehensive study on oncology medicines to be published as part of the PMPRB’s research series Alignment Among Public Formularies in Canada.
1. Oncology medicines are fairly consistently covered by the public drug programs in Canada
On average, Canadian public programs listed 73% of the 85 iJODR- and pCODR-reviewed oncology medicines, representing 96% of the total retail and hospital sales for these treatments in 2018. Of the select medicines, the majority were available in one or more private drug plans in Canada. These results are similar to those reported in a previous PMPRB analysis of oncology coverage rates in 2015Footnote 1.
British Columbia had the highest percentage of formulary listings at 85%, with the listed medicines accounting for 98% of the associated sales. Saskatchewan, Ontario, and Manitoba followed closely behind, with listing rates between 81% and 82%. While coverage rates in the Atlantic provinces were lower than average, the weighted listing rates were comparable to the other provinces, suggesting that the Atlantic provinces are covering higher-selling medicines.
Listing rates in public drug programs and availability in private drug plans for select oncology medicines, 2018
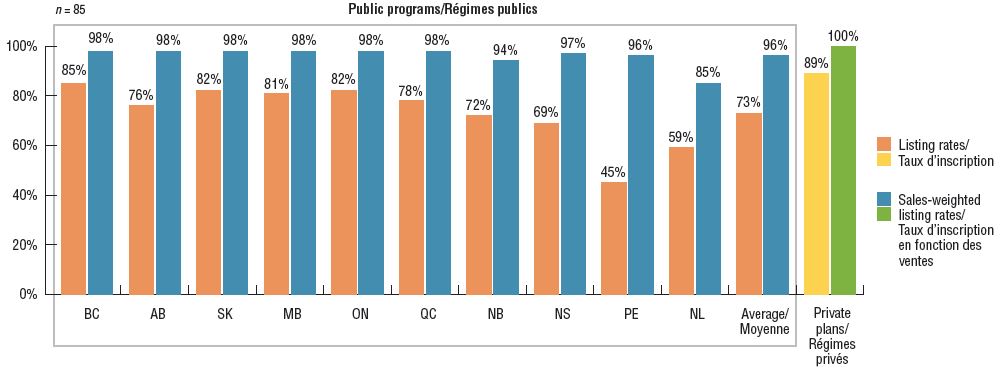
Figure description
This bar graph depicts the percentage of select oncology medicines listed in province-specific programs for each of the pCODR participating provinces, as well as the public programs in Quebec and Canadian private drug plans, as of December 2018. An average for public programs is also provided. The analysis focuses on medicines reviewed by the interim Joint Oncology Drug Review and the pan-Canadian Oncology Drug Review from January 1, 2007, through June 30, 2018. Weighted listing rates are based on data from the IQVIA Canadian Drugstore and Hospital Purchases Audit Database.
|
Listing rates |
Sales-weighted listing rates |
| British Columbia |
85% |
98% |
| Alberta |
76% |
98% |
| Saskatchewan |
82% |
98% |
| Manitoba |
81% |
98% |
| Ontario |
82% |
98% |
| Quebec |
78% |
98% |
| New Brunswick |
72% |
94% |
| Nova Scotia |
69% |
97% |
| Prince Edward Island |
45% |
96% |
| Newfoundland and Labrador |
59% |
85% |
| Average for all public programs |
73% |
96% |
| Private plans |
89% |
100% |
Note: Includes medicines reviewed by iJODR and pCODR from March 1, 2007, through June 30, 2018. Weighted listing rates are based on data captured by the IQVIA CDH Database.
2. Public drug programs cover the majority of top-selling oncology medicines
Over three-quarters of the select oncology medicines were listed in six or more provinces in 2018, representing 88% of the associated national retail and hospital sales for these medicines.
A small percentage were listed in fewer than six provinces (9%) or were not approved for coverage under any of the public formularies (11%). These medicines combined accounted for only 12% of the total national sales. Most of the medicines in the "not listed" category had received positive recommendations from pCODR and were under negotiation or provincial review at the time of this study.
Distribution of oncology medicine coverage, 2018
a) Number of select medicines covered by public programs
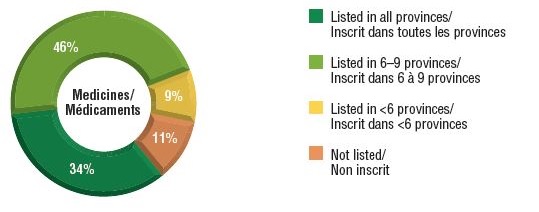
b) Share of corresponding national sales
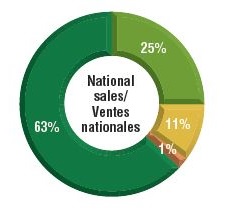
Figure description
This figure is composed of two donut graphs. The left-hand graph gives the percentage of select oncology medicines that are listed in all provinces; six to nine provinces; fewer than six provinces; and in none of the provinces. The right-hand graph gives the corresponding share of national sales for these categories of medicines.
|
Share of medicines |
Share of national sales |
| Listed in all provinces |
34% |
63% |
| Listed in 6–9 provinces |
46% |
25% |
| Listed in fewer than 6 provinces |
9% |
11% |
| Not listed |
11% |
1% |
3. Provinces have a relatively high rate of agreement in coverage of oncology medicines
When provinces were compared with each other using a paired approach, the average bilateral rate of agreement was 90% across all provinces, with rates ranging from 74% to 99%. The average agreement rate increased to 95% when the sales of these medicines were factored in, with a range of 84% to 100% among pairs of provinces. Overall results indicate small variations in both unweighted and weighted bilateral agreement rates.
Interprovincial coverage agreement rates for select oncology medicines, 2018
| |
Average |
Median |
Minimum |
Maximum |
Standard deviation |
| Agreement rate (n = 85 medicines) |
90% |
91% |
74% |
99% |
5% |
| Sales-weighted agreement rate |
95% |
97% |
84% |
100% |
5% |
Note: For the 10 provinces analyzed, 45 bilateral comparisons were considered, with the “positive–positive” and “negative–negative” formulary listing decisions being considered as an “agreement”.
4. Provinces with higher listing rates in public drug programs generally spend less per capita for oncology medicines
In Canada, there are several public funding options for oncology drugs including hospital budgets, provincial drug plans and/or provincial cancer agencies, as well as funding through private drug plans. When the total public and private sales of the select oncology medicines are considered, most of the provinces with higher coverage rates in public drug programs have lower sales per 100,000 general population than the national average ($6.9 million). Manitoba and Saskatchewan, which had some of the highest listing rates, spent the least on the select oncology medicines, while New Brunswick, Prince Edward Island, and Newfoundland and Labrador were among the provinces with the highest sales per capita. Many factors outside the scope of this study may contribute to these results, and a more comprehensive analysis is required before making any definitive conclusions.
Provincial sales per 100,000 population for select oncology medicines, 2018
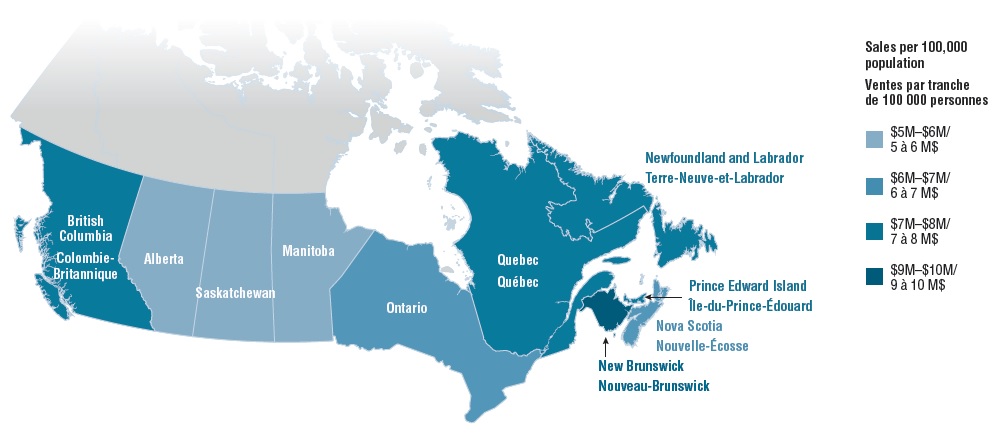
Figure description
This choropleth map of Canada illustrates the provincial sales per 100,000 population for the select oncology medicines by province. Provinces with higher sales are shaded in darker blue.
| Province |
Sales per 100,000 |
| British Columbia |
$7–8 million |
| Alberta |
$5–6 million |
| Saskatchewan |
$5–6 million |
| Manitoba |
$5–6 million |
| Ontario |
$6–7 million |
| Quebec |
$7–8 million |
| New Brunswick |
$9–10 million |
| Nova Scotia |
$6–7 million |
| Prince Edward Island |
$7–8 million |
| Newfoundland and Labrador |
$7–8 million |
Note: The results include both public and private (including cash) sales.
Population by province from Statistics Canada population estimates for 2017.
Data Sources
Coverage status: Publically available data including the pCODR and INESSS websites; IQVIA Private Drug Plan Database.
Sales: National - IQVIA Canadian Drugstore and Hospital Purchases Audit (CDH) Database; IQVIA MIDAS™ database (all rights reserved); Private - IQVIA Private Drug Plan Database.
Limitations
Variation in the coverage of medicines across public plans may be impacted by differences in the plan designs, demographics, and the disease profiles of the eligible beneficiary populations.
Sales weights are based on overall national retail and hospital sales. Medicines not commonly reimbursed, or reimbursed by smaller plans, may have lower related sales, and hence, lower weights in the overall results.
Sales data for some of the selected medicines is not available in the IQVIA CDH database; this may have a slight impact on some of the results.
Disclaimer
Although this information is based in part on data obtained under license from the IQVIA Canadian Drugstore and Hospital Purchases Audit (CDH), MIDAS™, and Private Drug Plan databases, the statements, findings, conclusions, views, and opinions expressed in this study are exclusively those of the PMPRB and are not attributable to IQVIA.