CompassRx, 4th Edition
Annual Public Drug Plan Expenditure Report, 2016/17
Acknowledgements
This report was prepared by the Patented Medicine Prices Review Board (PMPRB) as part of the National Prescription Drug Utilization Information System (NPDUIS).
The PMPRB would like to acknowledge the contributions of:
- The members of the NPDUIS Advisory Committee, for their expert oversight and guidance in the preparation of this report.
- The PMPRB staff for their contribution to the analytical content of the report:
- Tanya Potashnik – Director, Policy and Economic Analysis
- Elena Lungu – Manager, NPDUIS
- Nevzeta Bosnic – Senior Economic Analyst
- Yvonne Zhang – Economic Analyst
- Ai Chau – SAS Analyst
- Carol McKinley – Publications Advisor
- Sarah Parker – Junior Communications Officer
Disclaimer
NPDUIS operates independently of the regulatory activities of the Board of the PMPRB. The research priorities, data, statements and opinions expressed or reflected in NPDUIS reports do not represent the position of the PMPRB with respect to any regulatory matter. NPDUIS reports do not contain information that is confidential or privileged under sections 87 and 88 of the Patent Act, and the mention of a medicine in a NPDUIS report is not and should not be understood as an admission or denial that the medicine is subject to filings under sections 80, 81 or 82 of the Patent Act or that its price is or is not excessive under section 85 of the Patent Act.
Although based in part on data provided by the Canadian Institute for Health Information (CIHI), the statements, findings, conclusions, views and opinions expressed in this report are exclusively those of the PMPRB and are not attributable to CIHI.
Contact Information
Patented Medicine Prices Review Board
Standard Life Centre
Box L40
333 Laurier Avenue West
Suite 1400
Ottawa, ON K1P 1C1
Telephone: 1-877-861-2350
TTY: 613-288-9654
Email: PMPRB.Information-Renseignements.CEPMB@pmprb-cepmb.gc.ca
Executive Summary
The PMPRB CompassRx report monitors and analyzes the cost pressures driving changes in prescription drug expenditures in Canadian public drug plans. Following a significant 10.8% increase in 2015/16, prescription drug expenditures grew by an additional 1.9% in 2016/17. Drug costs, including markups, accounted for 79% of these expenditures, while dispensing costs accounted for the remaining 21%.
This fourth edition of CompassRx provides insight into the factors driving the growth in drug and dispensing costs in 2016/17, as well as a retrospective review of recent trends in public drug plan costs and utilization.
The main data source for this report is the National Prescription Drug Utilization Information System (NPDUIS) Database at the Canadian Institute for Health Information (CIHI), which includes data for the following jurisdictions: British Columbia, Alberta, Saskatchewan, Manitoba, Ontario, New Brunswick, Nova Scotia, Prince Edward Island, Newfoundland and Labrador, Yukon and Health Canada’s Non-Insured Health Benefits Program.
The findings from this report will inform policy discussions and aid decision-makers in anticipating and responding to evolving cost pressures.
The methodological approach has been refined in this edition of CompassRx. The analysis now focuses exclusively on data for beneficiaries that met their deductible and received public reimbursement. Drug costs now include all associated markups, and the data for Yukon has been included in the drug cost driver analysis.
Key findings
Following a notable growth of 10.8% in 2015/16, prescription drug expenditures for the NPDUIS public drug plans increased by an additional 1.9% in 2016/17, reaching $10.7 billion.
- Over the last five years, prescription drug expenditures for Canada’s public drug plans rose by a total of $1.9 billion, with a compound annual growth rate of 4.1%.
- Drug costs, which represented 79% of prescription drug expenditures in 2016/17, grew by 2.0%, while dispensing costs, which accounted for the remaining 21% of expenditures, grew by 1.6%.
- On average, the NPDUIS public drug plans paid 86% of the total prescription costs for 266 million prescriptions dispensed to almost 6 million active beneficiaries in 2016/17.
Drug cost increases in the NPDUIS public plans in 2016/17 were driven primarily by the increased use of higher-cost drugs combined with reduced generic savings and a decline in the use of direct-acting antiviral (DAA) drugs for hepatitis C.
- The 2.0% increase in 2016/17 was in addition to a significant 12% increase in 2015/16, with the total drug costs reaching $8.4 billion.
- The increased use of higher-cost drugs (other than DAAs) continues to be the most pronounced driver, pushing costs upward by 4.4% in 2016/17.
- Excluding the DAA drugs, patented medicines, which represent the largest market segment, grew by 5.7% in 2016/17, while drugs exceeding $10,000 in annual treatment costs grew by 17.2%. These high-cost drugs were used by less than 2% of public drug plan beneficiaries and accounted for almost 28% of the total drug costs in 2016/17.
- The growth in the use of new curative DAA drugs for hepatitis C, which contributed 8% to the increase in drug costs in 2015/16, demonstrated a slight decline in 2016/17 mainly due to lower use. After reaching a multi-stakeholder pricing agreement in 2017, public plans began to expand their eligibility for DAA drug coverage; this may have implications on future drug cost growth.
- Increases in the size of the beneficiary population and in the use of drugs pushed drug costs upward by 2.8% in 2016/17, following a predictable five-year trend. This
was counterbalanced by savings from price reductions and generic and biosimilar substitution.
- Drug cost savings from price reductions and generic and biosimilar substitutions steadily declined from -9.2% in 2012/13 to -2.8% in 2016/17, following a reduction in the impact of the patent cliff and generic price reforms.
Overview of Drug cost drivers
Figure description
This column graph describes the key factors or effects that impacted the rates of change in drug costs across all NPDUIS public drug plans for each year from 2012/13 to 2016/17. Each column is broken out to give the positive or negative contribution of each effect: drug-mix for direct-acting antiviral (DAA) drugs for the treatment of hepatitis C; drug-mix for all other drugs; volume; demographic; price change; and substitution. Separate rows above and below the bar graph show the total positive push effect, negative pull effect and net change for each year.
blank
|
2012/13 |
2013/14 |
2014/15 |
2015/16 |
2016/17 |
| Drug-mix, direct-acting antiviral (DAA) drugs |
0.0% |
0.0% |
0.0% |
8.0% |
-2.3% |
| Drug mix, other drugs |
4.1% |
5.4% |
4.9% |
4.1% |
4.4% |
| Volume |
1.7% |
2.2% |
0.3% |
1.2% |
1.0% |
| Demographic |
2.7% |
2.1% |
2.7% |
3.0% |
1.8% |
| Price change |
-2.0% |
-6.0% |
-3.0% |
-1.8% |
-1.0% |
| Substitution |
-7.2% |
-1.5% |
-3.2% |
-2.3% |
-1.8% |
| Total push effect |
8.5% |
9.7% |
7.9% |
16.2% |
7.2% |
| Total pull effect |
-9.2% |
-7.5% |
-6.2% |
-4.1% |
-5.1% |
| Net change |
-0.8% |
2.0% |
2.5% |
12.0% |
2.0% |
A colour-coded table to the right of the graph provides an analysis for each effect in 2016/17.
blank
| Drug mix, other drugs |
- The number of high-cost drugs nearly doubled from 47 in 2011/12 to 86 in 2016/17.
- Biologic drugs accounted for 26.0% of the total drug plan costs in 2016/17, climbing to $2.2 billion or almost double the amount just five years ago.
- Antineoplastic and immunomodulating agents captured the highest share drug costs (21.7%) in 2016/17.
- Seven of the top 10 highest-cost drugs for 2016/17 had average treatment costs exceeding $100,000.
|
| Volume |
- The increased use of drugs had a consistent, small positive effect on drug costs in 2016/17 of 1.0%.
|
| DemographicVolume |
- The increase of the active beneficiary population and aging had a slightly lower impact of 1.8% in 2016/17.
|
| Price change |
- The modest reduction in drug prices was driven by limited savings from lower generic prices. Through the pan-Canadian Pharmaceutical Alliance (pCPA) the prices of four additional drugs were lowered to 18% of their brand-name equivalents in 2016.
|
| Substitution |
- Three drugs were responsible for most of the savings from generic substitution: duloxetine (-0.7%), pantoprazole (-0.4%) and abacavir/lamivudine (-0.1%).
- The total savings offered by biosimilars have been limited, with Inflectra (-0.04%) and Grastofil (-0.02%) making only a small but measurable difference in overall drug costs.
|
| Drug-mix, direct-acting antiviral (DAA) drugs |
- While the emergence of DAAs was a major contributor to drug cost growth in 2015/16, driving costs up 8%, the use of these drugs declined in 2016/17, lowering the total drug costs by 2.3%.
|
Note: Values for the years prior to 2016/17 have not been updated using the new methodology, as there would have been no notable change in the relative contribution of each effect. This analysis is based on publicly available pricing information. It does not reflect the confidential drug price discounts negotiated by the pCPA on behalf of the public plans. Values may not add to totals due to rounding and the cross effect.
Results for 2012/13 do not capture the data for the British Columbia and Newfoundland and Labrador public drug plans.
Data for Yukon is included for 2016/17.
Data source: National Prescription Drug Utilization Information System Database, Canadian Institute for Health Information.
The growth in dispensing costs in the NPDUIS public plans slowed for the second year in a row after three years of strong growth, reaching $2.2 billion.
- The overall growth in dispensing costs in 2016/17 was 1.6% (or $35.7 million), which was less than the increases in previous years; however, the results varied among individual plans.
- An increase in the number of active beneficiaries had the greatest impact on the dispensing costs in 2016/17, pushing overall costs up by 1.9%; PEI had the highest growth at 9.1%.
- While most public drug plans saw a slight increase in the average dispensing fee per prescription in 2016/17, overall average dispensing fees decreased by 1.1%, mainly due to the -2.4% change in Ontario.
- Overall, smaller prescription sizes made only a slight 0.8% positive contribution to the growth in dispensing costs in 2016/17.
Introduction
Canadian public drug plan expenditures represent a significant portion of the overall health-care budget. The Canadian Institute for Health Information (CIHI) estimated the total cost of prescription drugs in Canada to be $33.9 billion in 2017, with the largest component (42.7%) financed by the public drug plans, and the remainder paid by private plans (35.5%) or out of pocket by households and individuals (21.8%)Footnote 1.
CompassRx is an annual PMPRB publication that explores the recent trends in public drug plan costs and utilization, as well as the shifting cost pressures that contribute to the growth in prescription drug expenditures. An analysis of the drivers of drug and dispensing costs measures the impact of changes in the beneficiary population, the use of lower- and higher-priced drugs, prescription fees, drug prices and the volume of drugs, as well as other key factors.
This edition of the report focuses on the 2016/17 fiscal year and provides a retrospective look at recent trends. The methodological approach has been refined to provide
a more consistent analytical approach across plans, as described in the next section. The results of this analysis aid stakeholders in anticipating and responding to the
evolving cost pressures affecting Canada’s public drug plans.
The analysis focuses on the public drug plans participating in the National Prescription Drug Utilization Information System (NPDUIS) initiative, which includes all of the provincial public plans (with the exception of Quebec), Yukon and Health Canada’s Non-Insured Health Benefits Program. These plans account for approximately one third of
the total annual spending on prescription drugs in Canada. Note that data for Yukon has been added
to the drug cost analysis in this edition.
Each of the public drug plans reimburses eligible beneficiaries according to its own specific plan design, and implements policies related to the reimbursement of drug prices and dispensing fees. Summaries of the plan designs and policies are available in the Reference Documents section of the Analytical Studies page on the PMPRB website.
In addition, Health Canada, the Patented Medicine Prices Review Board (PMPRB) and the Canadian Agency for Drugs and Technologies in Health (CADTH) are responsible for drug approvals, price reviews and health technology assessments, respectively. Details of the 2016/17 approvals and reviews are provided in Appendix A of this report.
Methods
The main data source for this report is the National Prescription Drug Utilization Information System (NPDUIS) Database, developed by the Canadian Institute for Health Information (CIHI). This database houses pan-Canadian information on public drug programs, including anonymous claims-level data collected from the plans participating in the NPDUIS initiative. Data is reported on a fiscal year basis.
Results are presented for the following public drug plans: British Columbia, Alberta, Saskatchewan, Manitoba, Ontario, New Brunswick, Nova Scotia, Prince Edward Island, Newfoundland and Labrador, Yukon and Health Canada’s Non-Insured Health Benefits (NIHB) Program.
The methodological approach used in CompassRx is reviewed on an annual basis to improve the relevance of the results. The analysis in this edition focuses exclusively
on data for beneficiaries that met their deductible and received public reimbursement. The term “drug cost” has also been redefined to include any associated markups. These changes are designed to provide more consistent and comparable results across the plans. The greatest impact will be on the plans with universal income-based coverage, such as British Columbia, Saskatchewan and Manitoba.
Historical results for most of the analyses, except for the drug and dispensing cost drivers, have been refreshed to reflect the new methodology; thus, the data in this report may not wholly correspond to previous editions of CompassRx. Although the new methodology was applied to the 2016/17 cost driver model, the previous years were not updated, as there would have been no notable change in the relative contribution of each factor.
The analysis of the drivers of drug and dispensing costs follows the methodological approach detailed in the PMPRB report entitled The Drivers of Prescription Drug Expenditures: A Methodological ReportFootnote 2.
The results reported for Saskatchewan and Manitoba include the accepted prescription drug expenditures for individuals who are eligible for coverage but have not submitted an application and, therefore, do not have a defined deductible. For the NIHB, claims that were coordinated with provincial public drug plans are excluded from the analysis to ensure consistency in the annual data reporting. The results reported for New Brunswick include the number of active beneficiaries enrolled in the Medavie Blue Cross Seniors’ Prescription Drug Program and their related drug expenditures, which are offset by monthly premiums. Yukon is not included in the dispensing cost analyses due to data limitations.
Analyses of the average prescription size, as well as pricing, are limited to oral solids to avoid data reporting inconsistencies that may exist in the day supply and unit reporting of other formulations. Anatomical Therapeutic Chemical (ATC) levels reported here follow the CIHI NPDUIS data and reflect the ATC classification system maintained by the World Health Organization Collaborating Centre for Drug Statistics Methodology.
For a Glossary of Terms, see the Reference Documents section of the NPDUIS Analytical Studies page on the PMPRB website.
Limitations
Expenditure and utilization levels vary widely among the jurisdictions and cross comparisons of the results are limited by the plan designs and policies of the individual public drug plans, as well as the demographic and disease profiles of the beneficiary populations. For example, public drug plans in British Columbia, Saskatchewan and Manitoba provide universal income-based coverage, while other provincial public drug plans offer specific programs for seniors, income assistance recipients and other select patient groups, and the
NIHB provides universal care to its entire population.
The NPDUIS Database includes sub-plan data specific to particular jurisdictions. This further limits the comparability of results across plans. For instance, Alberta, Nova Scotia and Prince Edward Island submit the data for a select subset of their sub-plans to NPDUIS. A comprehensive summary of the sub-plans available in the database, along with the eligibility criteria, is available in the Reference Documents section of the NPDUIS Analytical Studies page on the PMPRB website.
The totals for the NPDUIS public drug plans are heavily skewed toward Ontario due to its size.
This edition of the CompassRx reports on data up to and including the 2016/17 fiscal year. Developments that have taken place in the Canadian environment since then are not captured in the analysis.
Drug costs reported are the amounts accepted toward reimbursement by the public plans and do not reflect off-invoice price rebates or price reductions resulting from confidential product listing agreements.
The prescription drug expenditure data for the public drug plans reported in this study represents only one segment of the Canadian pharmaceutical market, and hence, the findings should not be extrapolated to the overall marketplace.
1. Trends in Prescription Drug Expenditures, 2012/13 to 2016/17
Prescription drug expenditures increased by an additional 1.9% in 2016/17 following a significant increase in the rate of growth the year before. The return to a lower rate of growth in prescription drug expenditures resulted from a decline in the use of new hepatitis C drugs rather than savings from the generic market segment, which limited the increases in overall expenditures in previous years.
High-cost patented medicines (other than DAAs for hepatitis C) continue to be the most significant contributor to the growth in public plan drug costs, with consistent annual increases of between 4% and 5% over the past five years.
Prescription Drug Expenditures = Drug Costs (79%) + Dispensing Costs (21%)
After a marked increase of 10.8% in 2015/16, the growth in prescription drug expenditures for the NPDUIS public drug plans rose by an additional 1.9% 2016/17. This growth was driven by a modest 2.0% increase in drug costs, including markups, and a 1.6% increase in dispensing costs.
Overall expenditures in 2016/17 reached $10.7 billion, with public drug plans reimbursing a total of approximately 266 million prescriptions dispensed to almost 6 million
active beneficiaries.
Brief Insights: Drug Plan Designs
The expenditure and utilization levels reported in this study depend on the specific plan design and policies of each jurisdiction, as well as the demographic and disease profiles of the beneficiary population. This must be considered when comparing the results across plans.
Supplementary reference documents providing information on individual public drug plan designs, policies governing markups and dispensing fees and a glossary of terms are available on the NPDUIS Analytical Studies page of the PMPRB website.
There were no notable changes in public plan designs in 2016/17.
The expenditures reported in this section represent the total amount accepted for reimbursement by the NPDUIS public drug plans and include drug costs, with associated markups, and dispensing costs. These amounts reflect both the plan-paid and beneficiary-paid portions of the prescription costs, such as co-payments and deductibles. In 2016/17, the split between drug costs and dispensing costs was approximately 80% to 20%, as reported in Figure 1.1.
On average, public plans paid 86% of the total prescription drug expenditures, while the remainder was paid by the beneficiaries either out of pocket or through a third-party
private insurer. This edition of CompassRx reports less variability in the plan-paid share across jurisdictions. As noted earlier, the enhanced methodological approach, which focuses exclusively on data for beneficiaries that met their deductible and received public reimbursement, ensures a more consistent, apples-to-apples comparison among plans.
Figure 1.1 Prescription drug expenditures in NPDUIS public drug plans, 2016/17 ($million)
Figure description
This stacked column graph shows the total prescription drug expenditure in 2016/17 for each NPDUIS public drug plan broken out by percent shares of drug costs and dispensing costs, along with the total costs across all plans. A table below provides absolute values for the drug and dispensing costs in millions of dollars, as well as the plan-paid shares of the total prescription costs.
blank
| |
British Columbia |
Alberta |
Saskatchewan |
Manitoba |
Ontario |
New Brunswick |
Nova Scotia |
Prince Edward Island |
Newfoundland and Labrador |
Non-Insured Health Benefits |
Total results for the drug plans captured in this figure |
| Share of dispensing costs |
21% |
23% |
20% |
21% |
20% |
24% |
22% |
26% |
29% |
28% |
21% |
| Share of drug costs |
79% |
77% |
80% |
79% |
80% |
76% |
78% |
74% |
71% |
72% |
79% |
| Dispensing costs ($ million) |
$277 |
$221 |
$92 |
$92 |
$1,206 |
$60 |
$53 |
$11 |
$47 |
$177 |
$2,236 |
| Drug costs ($ million) |
$1,075 |
$735 |
$359 |
$337 |
$4,918 |
$193 |
$184 |
$32 |
$117 |
$463 |
$8,413 |
| Plan-paid amount ($ million) |
$1,101 |
$782 |
$318 |
$344 |
$5,434 |
$226 |
$198 |
$27 |
$143 |
$581 |
$9,154 |
| Plan-paid share of total prescription cost |
81% |
82% |
70% |
80% |
89% |
90% |
84% |
63% |
87% |
91% |
86% |
| Total prescription cost ($ million) |
$1,352 |
$955 |
$452 |
$428 |
$6,124 |
$252 |
$237 |
$44 |
$164 |
$640 |
$10,649 |
Note: This analysis only includes data for beneficiaries that met their deductible and received public reimbursement. Markup
amounts are captured in the drug costs. Yukon is not reported due to limitations in the dispensing cost data. Values may not add to totals due to rounding.
* Total results for the drug plans captured in this figure.
Data source: National Prescription Drug Utilization Information System Database, Canadian Institute for Health Information.
Between 2012/13 and 2016/17, the total prescription drug expenditure for Canada’s public drug plans rose by $1.9 billion, from $8.8 billion to $10.7 billion, with a significant growth of $1.1 billion in 2015/16 alone. In 2016/17, the total prescription expenditure rose by 1.9% and added an additional $0.2 billion on top of the substantial increase in the previous fiscal year (Figure 1.2).
The annual growth in prescription expenditures is a function of increases in the number of active beneficiaries and their treatment costs.
Figure 1.2 Annual rate of change in prescription drug expenditures, NPDUIS public drug plans*, 2012/13 to 2016/17
Figure description
This column graph shows the trend in the annual rates of change for prescription drug expenditures from 2012/13 to 2016/17. Price tags below each bar show the annual prescription drug cost in billions of dollars.
blank
| Fiscal Year |
2012/13 |
2013/14 |
2014/15 |
2015/16 |
2016/17 |
| Annual growth rate |
0.5% |
3.5% |
3.8% |
10.8% |
1.9% |
| Annual prescription drug cost ($ billion) |
$8.8 |
$9.1 |
$9.4 |
$10.5 |
$10.7 |
A separate table show the compound annual growth rate (CAGR) for two years and for five years, ending in 2016/17.
blank
| Compound annual growth rate (CAGR) |
5-year ending 2016/17 |
4.1% |
| 2-year ending 2016/17 |
6.3% |
Note: This analysis only includes data for beneficiaries that met their deductible and received public reimbursement. Historical
results reported reflect this new approach.
* British Columbia, Alberta, Saskatchewan, Manitoba, Ontario, New Brunswick, Nova Scotia, Prince Edward Island, Newfoundland and Labrador, Yukon and the Non-Insured Health Benefits Program.
† Compound annual growth rate.
Data sources: National Prescription Drug Utilization Information System Database, Canadian Institute for Health Information.
In 2016/17, the overall beneficiary population of the NPDUIS public drug plans grew by 1.7%. Almost 6 million active beneficiaries filled approximately 266 million prescriptions that were accepted towards a deductible or paid for (in full or in part) by the NPDUIS public drug plans. Seniors made up the majority (59%) of the overall active beneficiary population, although there were relatively wide jurisdictional differences in the senior versus non-senior split due to variations in plan design and eligibility (Figure 1.3).
Figure 1.3 Utilization in NPDUIS public drug plans, senior and non-senior active beneficiaries,
2016/17
Figure description
This stacked column graph shows the percent share of utilization in senior and non-senior populations for each public drug plan in 2016/17, along with the totals across all plans. A table below gives the number of active beneficiaries in thousands, the change in beneficiary population from 2015/16 to 2016/17, the number of active beneficiaries as share of the population and the total number of prescriptions, in millions.
blank
| |
British Columbia |
Alberta |
Saskatchewan |
Manitoba |
Ontario |
New Brunswick |
Nova Scotia |
Prince Edward Island |
Newfoundland and Labrador |
Yukon |
Non-Insured Health Benefits |
Total |
| Seniors |
44.5% |
80.1% |
44.9% |
40.1% |
70.7% |
61.9% |
87.3% |
61.3% |
49.5% |
70.0% |
8.3% |
59.3% |
| Non-seniors |
55.5% |
19.9% |
55.1% |
59.9% |
29.3% |
38.1% |
12.7% |
38.7% |
50.5% |
30.0% |
91.7% |
40.7% |
| Active beneficiaries (thousands) |
738.1 |
581.6 |
286.6 |
140.3 |
3,045.7 |
126.9 |
136.8 |
41.4 |
103.0 |
5.1 |
634.1 |
5,839.6 |
| Percent change in the active beneficiary population from 2015/16 to 2016/17 |
-0.5% |
3.4% |
-5.2% |
0.6% |
2.6% |
1.8% |
2.2% |
8.9% |
-0.5% |
5.6% |
1.3% |
1.7% |
| Active beneficiary share of population |
15.4% |
13.7% |
24.8% |
10.6% |
21.7% |
16.7% |
14.4% |
27.6% |
19.4% |
13.4% |
66.9% |
20.2% |
| Total number of prescriptions (millions) |
38.2 |
15.4 |
8.4 |
9.7 |
159.0 |
5.7 |
4.7 |
1.0 |
3.8 |
0.2 |
20.2 |
266.3 |
Note: This analysis only includes data for beneficiaries that met their deductible and received public reimbursement. Not all of
the sub-plan data for the jurisdictions is reported to NPDUIS; this may impact the ratio of senior to non-senior shares.
Data sources: National Prescription Drug Utilization Information System Database, Canadian Institute for Health Information; Statistics Canada, CANSIM Table 051-0005; Non-Insured Health Benefits Program Annual Report, 2016/17.
Prescription Drug Expenditures = Drug Costs (79%) + Dispensing Costs (21%)
Drug costs, including markups, represent the largest component of prescription drug expenditures and have the greatest influence on overall trends. After a spike in 2015/16, drug costs rose by an additional 2.0% in 2016/17, for a compound annual growth rate of 7.3% over the last two years. This follows a negative rate of change in 2012/13 (-1.0%) and two subsequent years of moderate growth (2.8% each year). The average rate of change over the last five years was 3.8% across the public plans.
While the relatively low rate of change in drug costs in 2016/17 (2.0%) appears to be a return to the growth rates in reported in previous years (e.g., -1.0% and 2.8% from 2012/13 to 2014/15), the past results are based on very different cost pressures.
Figure 1.4 reports the annual rate of change in drug costs for each NPDUIS drug plan from 2012/13 to 2016/17. The rates in 2016/17 varied considerably across plans, from -5.2% in Yukon to 13.2% in Prince Edward Island, which recently implemented a new program for residents under the age of 65 without private drug coverage. The negative rates of change observed in some plans are due to a decline in the costs related to the recently introduced direct-acting antiviral (DAA) drugs for the treatment of hepatitis C, which had generated a tremendous growth in costs in the previous fiscal year.
Patented medicines represented the largest market segment, capturing 60.1% of drug costs in 2016/17. While this segment had a relatively modest 2.0% rate of change, without the influence of the DAA drugs, the growth would have increased to 5.7%. The change in the high-cost drug component mirrors these results: the rate of change for the DAA drugs for hepatitis C was -13.1% in 2016/17, reflecting diminishing costs from the year before, while other high-cost drugs had a substantial 17.2% growth. Single-source non-patented medicines also had a sizable rate of growth (7.4%), but only captured a small market share (3.9%). The costs for multi-source generic drugs, which accounted for nearly one quarter of drug costs, increased by 2.7% in 2016/17.
Figure 1.4 Annual rates of change in drug costs, NPDUIS public drug plans, 2012/13 to 2016/17
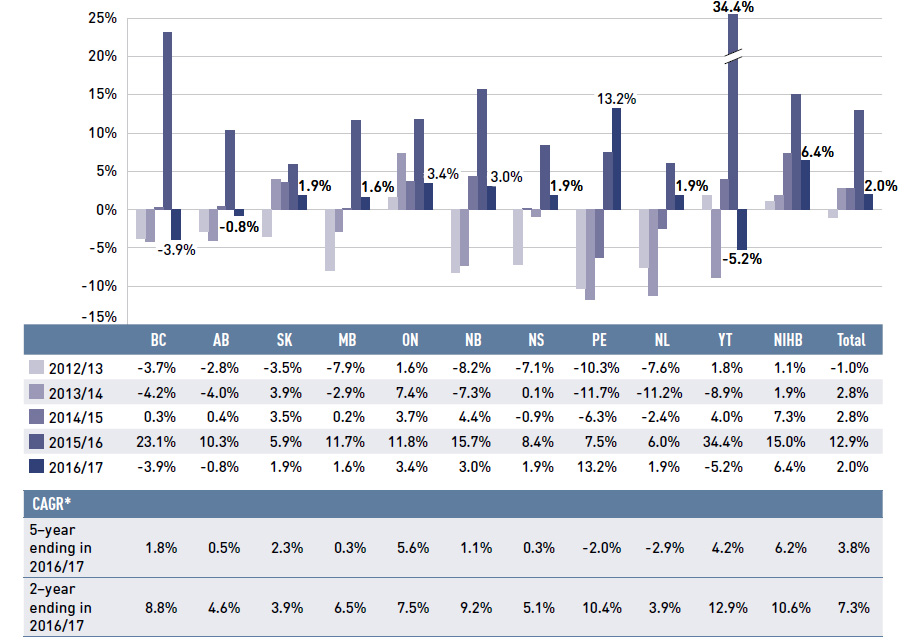
Figure description
This column graph illustrates the trend in annual rates of change in drug costs from 2012/13 to 2016/17 for each of the NPDUIS drug plans. Total annual results for all plans are included. All results are also shown in a table below, along with the five-year and two-year compound annual growth rates for each plan.
blank
| |
British Columbia |
Alberta |
Saskatchewan |
Manitoba |
Ontario |
New Brunswick |
Nova Scotia |
Prince Edward Island |
Newfoundland and Labrador |
Yukon |
Non-Insured Health Benefits |
Total |
| 2012/13 |
-3.7% |
-2.8% |
-3.5% |
-7.9% |
1.6% |
-8.2% |
-7.1% |
-10.3% |
-7.6% |
1.8% |
1.1% |
-1.0% |
| 2013/14 |
-4.2% |
-4.0% |
3.9% |
-2.9% |
7.4% |
-7.3% |
0.1% |
-11.7% |
-11.2% |
-8.9% |
1.9% |
2.8% |
| 2014/15 |
0.3% |
0.4% |
3.5% |
0.2% |
3.7% |
4.4% |
-0.9% |
-6.3% |
-2.4% |
4.0% |
7.3% |
2.8% |
| 2015/16 |
23.1% |
10.3% |
5.9% |
11.7% |
11.8% |
15.7% |
8.4% |
7.5% |
6.0% |
34.4% |
15.0% |
12.9% |
| 2016/17 |
-3.9% |
-0.8% |
1.9% |
1.6% |
3.4% |
3.0% |
1.9% |
13.2% |
1.9% |
-5.2% |
6.4% |
2.0% |
| 5-year compound annual growth rate ending 2016/17 |
1.8% |
0.5% |
2.3% |
0.3% |
5.6% |
1.1% |
0.3% |
-2.0% |
-2.9% |
4.2% |
6.2% |
3.8% |
| 2-year compound annual growth rate ending 2016/17 |
8.8% |
4.6% |
3.9% |
6.5% |
7.5% |
9.2% |
5.1% |
10.4% |
3.9% |
12.9% |
10.6% |
7.3% |
Note: This analysis only includes data for beneficiaries that met their deductible and received public reimbursement.
Historical results reported reflect this new approach.
* Compound annual growth rate.
Data source: National Prescription Drug Utilization Information System Database, Canadian Institute for Health Information.
These overall results suggest that the relatively small rate of change in drug costs in 2016/17 was driven by very different factors than the low rates in previous years. The
low growth in drug costs from 2012/13 to 2014/15, was due to savings from the generic market segment, while the decline in the use of the DAA drugs dampened the rate of change in 2016/17. The growth in the high-cost drug market segment continues to be sizable. The next section will further elaborate on these findings.
Figure 1.5 breaks down the annual rate of change in drug costs from 2015/16 to 2016/17 by market segment (bar chart) and gives the corresponding market share in 2016/17 for each (pie chart).
Figure 1.5 Annual rates of change in drug costs by market segment, NPDUIS public drug plans*, 2015/16 to 2016/17
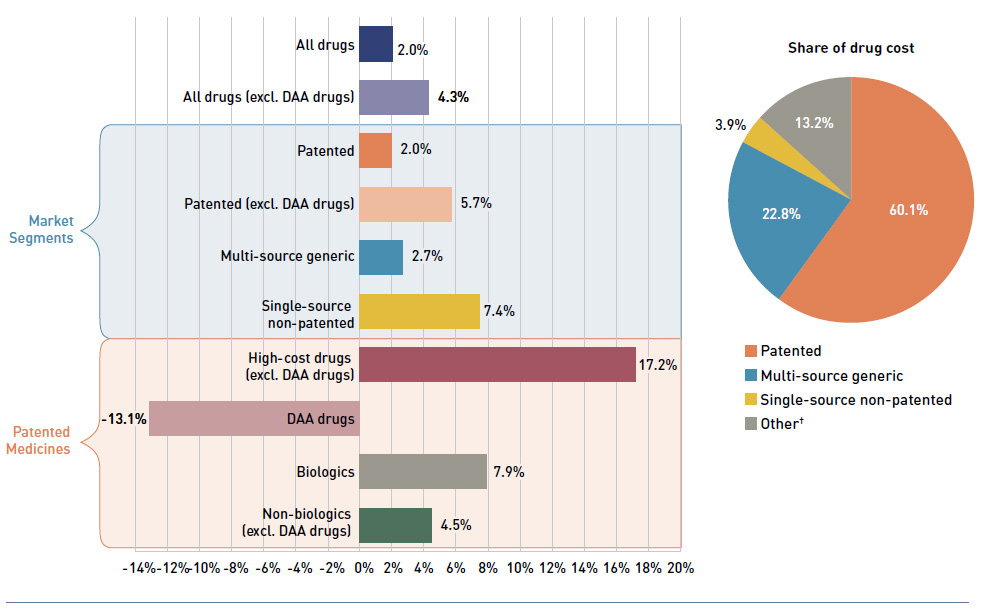
Figure description
This graph consists of two parts: a horizontal bar chart on the left breaks down the annual rate of change in drug costs in 2016/17 by market segment; and a pie chart on the right displays the market share of the total drug cost for each segment. Both represent the combined totals for NPDUIS public drug plans.
The bar chart is divided into three parts. The first gives the annual rate of change for all drugs; the second displays the growth rates for the three main market segments; and the third focuses on the patented medicine segment. Results may include or exclude the direct-acting antiviral (DAA) drugs for the treatment of hepatitis C, as indicated. High-cost drugs have an annual cost greater than $10,000.
Annual rates of change
All drugs: 2.0%
All drugs excluding DAA drugs: 4.3%
By market segment
- Patented: 2.0%
- Patented excluding DAA drugs: 5.7%
- Multi-source generic: 2.7%
- Single-source non-patented: 7.4%
Patented medicines:
- High-cost drugs excluding DAA drugs: 17.2%
- DAA drugs: -13.1%
- Biologics: 7.9%
- Non-biologics (excluding DAA drugs): 4.5%
blank
| Market segment |
Share of drug costs |
| Patented |
60.1% |
| Multi-source generic |
22.8% |
| Single-source non-patented |
3.9% |
| Other† |
13.2% |
Note: This analysis only includes data for beneficiaries that met their deductible and received public reimbursement.
Direct-acting antiviral (DAA) drugs are used in the treatment of hepatitis C.
High-cost drugs have an average annual treatment cost of greater than $10,000 and include both biologics and non-biologics.
* British Columbia, Alberta, Saskatchewan, Manitoba, Ontario, New Brunswick, Nova Scotia, Prince Edward Island, Newfoundland and Labrador,
Yukon and the Non-Insured Health Benefits Program.
† This market segment includes devices, compounded drugs and other products that are reimbursed by public drug plans but do not have
a Health Canada assigned Drug Identification Number (DIN).
Data source: National Prescription Drug Utilization Information System Database, Canadian Institute for Health Information.
Prescription Drug Expenditures = Drug Costs (79%) + Dispensing Costs (21%)
Dispensing costs represent an important part of prescription drug expenditures. Overall, their rate of growth has been declining in recent years, dropping to 1.6% in 2016/17.
Figure 1.6 reports the annual rate of change in dispensing costs for each NPDUIS drug plan from 2012/13 to 2016/17. Jurisdictional variations may be due, in part, to changes in
the dispensing fees and plan designs, as well as changes in the number of prescriptions and their size, among other factors.
Brief Insights: Dispensing Fees
The following provinces implemented changes in dispensing fees in 2016/2017:
- Nova Scotia increased dispensing fees from $11.65 to $11.75 for ostomy supplies, from $17.47 to $17.62 for compounded extemporaneous products (excluding methadone and injectables) and from $11.65 to $11.75 for all other prescriptions (including methadone) effective April 1, 2016.
- Prince Edward Island increased the maximum reimbursable professional fee to $12.36 and the extemporaneous fee to $18.54. The private nursing home capitation fee is $76.52.
Figure 1.6 Annual rates of change in dispensing costs, NPDUIS public drug plans, 2012/13 to 2016/17
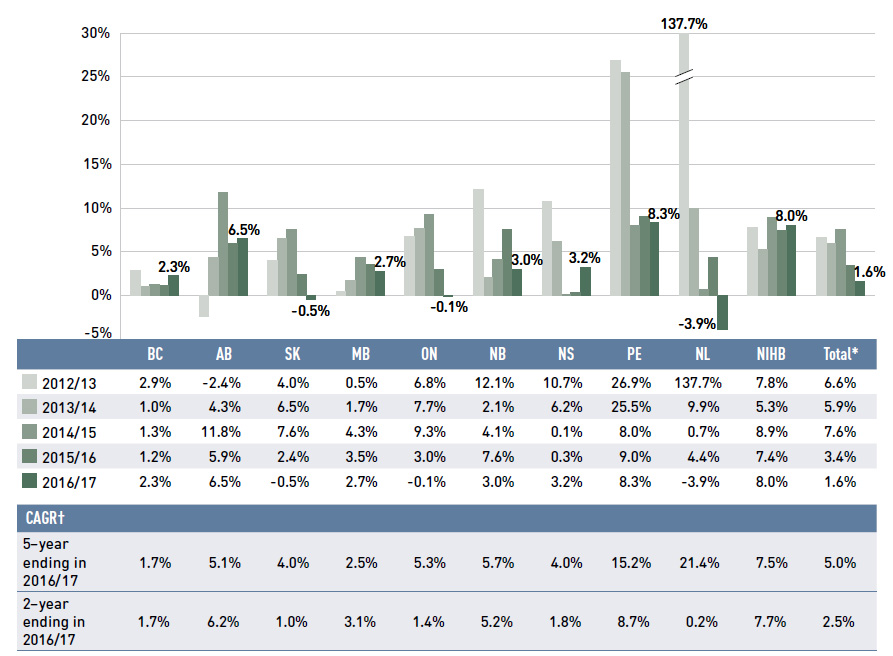
Figure description
This column graph illustrates the trend in annual rates of change for dispensing costs from 2012/13 to 2016/17 for each of the NPDUIS public drug plans. Total annual results for all plans are included. All results are also shown in a table below, along with the five-year and two-year compound annual growth rates for each plan.
blank
| |
British Columbia |
Alberta |
Saskatchewan |
Manitoba |
Ontario |
New Brunswick |
Nova Scotia |
Prince Edward Island |
Newfoundland and Labrador |
Non-Insured Health Benefits |
Total results for the drug plans captured in this figure |
| 2012/13 |
2.9% |
-2.4% |
4.0% |
0.5% |
6.8% |
12.1% |
10.7% |
26.9% |
137.7% |
7.8% |
6.6% |
| 2013/14 |
1.0% |
4.3% |
6.5% |
1.7% |
7.7% |
2.1% |
6.2% |
25.5% |
9.9% |
5.3% |
5.9% |
| 2014/15 |
1.3% |
11.8% |
7.6% |
4.3% |
9.3% |
4.1% |
0.1% |
8.0% |
0.7% |
8.9% |
7.6% |
| 2015/16 |
1.2% |
5.9% |
2.4% |
3.5% |
3.0% |
7.6% |
0.3% |
9.0% |
4.4% |
7.4% |
3.4% |
| 2016/17 |
2.3% |
6.5% |
-0.5% |
2.7% |
-0.1% |
3.0% |
3.2% |
8.3% |
-3.9% |
8.0% |
1.6% |
| 5-year compound annual growth rate ending 2016/17 |
1.7% |
5.1% |
4.0% |
2.5% |
5.3% |
5.7% |
4.0% |
15.2% |
21.4% |
7.5% |
5.0% |
| 2-year compound annual growth rate ending 2016/17 |
1.7% |
6.2% |
1.0% |
3.1% |
1.4% |
5.2% |
1.8% |
8.7% |
0.2% |
7.7% |
2.5% |
Note: This analysis only includes data for beneficiaries that met their deductible and received public reimbursement. Historical
results reported reflect this new approach. Yukon is not reported due to limitations in the available data.
* Total results for the drug plans captured in this figure.
† Compound annual growth rate.
Data source: National Prescription Drug Utilization Information System Database, Canadian Institute for Health Information.
Prior to 2015/16, the dispensing cost share of prescription drug expenditures increased in all public drug plans, as dispensing costs rose at a faster rate than drug costs.
The trend shifted in 2015/16 with a significant increase in the drug cost component slightly crowding out the dispensing cost share. The overall share of dispensing costs remained virtually unchanged in 2016/17 at 21%. Figure 1.7 depicts the trend in the dispensing cost share of total prescription expenditures for each NPDUIS drug plan from 2012/13 to 2016/17.
Figure 1.7 Annual dispensing costs as a share of total prescription drug expenditures, NPDUIS public drug plans, 2012/13 to 2016/17
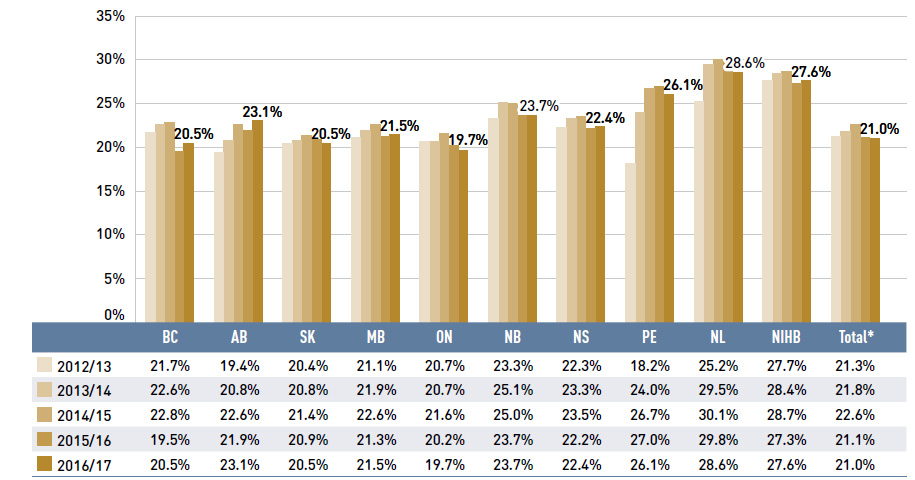
Figure description
This column graph shows the trend in annual dispensing costs as a share of the total prescription expenditures from 2012/13 to 2016/17 for each of the NPDUIS public drug plans. Total annual results for all plans are included. All results are also shown in a table below the graph.
blank
| |
British Columbia |
Alberta |
Saskatchewan |
Manitoba |
Ontario |
New Brunswick |
Nova Scotia |
Prince Edward Island |
Newfoundland and Labrador |
Non-Insured Health Benefits |
Total results for the drug plans captured in this figure |
| 2012/13 |
21.7% |
19.4% |
20.4% |
21.1% |
20.7% |
23.3% |
22.3% |
18.2% |
25.2% |
27.7% |
21.3% |
| 2013/14 |
22.6% |
20.8% |
20.8% |
21.9% |
20.7% |
25.1% |
23.3% |
24.0% |
29.5% |
28.4% |
21.8% |
| 2014/15 |
22.8% |
22.6% |
21.4% |
22.6% |
21.6% |
25.0% |
23.5% |
26.7% |
30.1% |
28.7% |
22.6% |
| 2015/16 |
19.5% |
21.9% |
20.9% |
21.3% |
20.2% |
23.7% |
22.2% |
27.0% |
29.8% |
27.3% |
21.1% |
| 2016/17 |
20.5% |
23.1% |
20.5% |
21.5% |
19.7% |
23.7% |
22.4% |
26.1% |
28.6% |
27.6% |
21.0% |
Note: This analysis only includes data for beneficiaries that met their deductible and received public reimbursement. Historical
results reported reflect this new approach. Yukon is not reported due to limitations in the available data.
* Total results for the drug plans captured in this figure.
Data source: National Prescription Drug Utilization Information System Database, Canadian Institute for Health Information.
2. The Drivers of Drug Costs, 2015/16 to 2016/17
The fluctuating rates of changes in drug costs over the last few years have been shaped by the sudden uptake in the use of DAA drugs for hepatitis C in 2015/16 followed by a slight decline in their use in 2016/17. At the same time other market forces followed a fairly predictable trend marked by a sustained push effect from the increased use of drugs, in particular higher-cost drugs, as well as a diminishing pull-down effect from generic savings.
Changes in drug costs are driven by a number of “push” and “pull” effects. The net effect of these opposing forces yields the overall rate of change.
Price change effect: Changes in the prices of both brand-name and generic drugs, determined at molecule, strength and form level.
Substitution effect: Shifts from brand-name to generic drugs as well as shifts to biosimilar use.
Demographic effect: Changes in the number of active beneficiaries, as well as shifts in the distribution of age or gender.
Volume effect: Changes in the number of prescriptions dispensed to patients, the average number of units of a drug dispensed per prescription and/or shifts in the use of various strengths or forms of an ingredient.
Drug-mix effect: Shifts in use between lower- and higher-cost drugs, including those entering, exiting or remaining in the market during the time period analyzed.
In this section, a comprehensive cost driver analysis is used to determine how much public plan drug costs would have changed between 2015/16 and 2016/17 if only one factor (e.g., the price of drugs) was considered while all the others remained the sameFootnote I.
Figure 2.1 provides insight into the pressures driving the rates of change in drug costs from 2012/13 to 2016/17. In any given year, the combined increase in the number of
people and the volume of drugs push costs upward by a fairly predictable 3% to 4%. Beyond this, the actual net rate of change will move upward or downward depending on
the net effect of two important but opposing forces: the push effect of an increase in the use of higher-cost drugs and the pull-down effect resulting from lower-priced generic and biosimilar substitutions and price reductions.
In recent years, the pull-down effect from substitutions and price reductions has diminished, gradually declining from -9.2% in 2012/13 to -2.8% in 2016/17. During this same time period, the increased use of higher-cost drugs, which represents the greatest contribution to the overall increase in drug costs, has had a relatively consistent annual impact of 4% to 5%. In addition to this, hepatitis C drugs had a significant impact on drug costs over the last two years, pushing costs upward by 8.0% in 2015/16, followed by a moderate pull-down of -2.3% in 2016/17.
The results suggest that the current underlying trends are characterized by relatively low generic savings and sizable pressure from higher-cost drugs. Although the growth rate in 2016/17 was a relatively low, this was mainly due to the reduction in the use of DAA drugs, which is a transitory effect.
Figure 2.1 Drug cost drivers, NPDUIS public drug plans*, 2012/13 to 2016/17
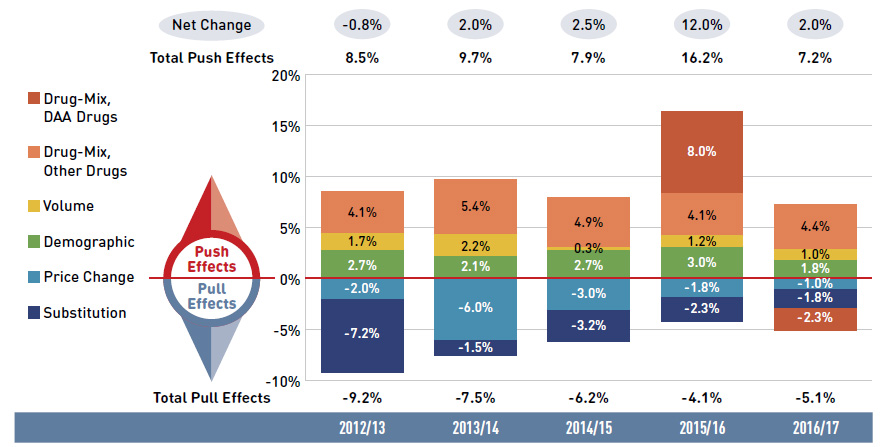
Figure description
This column graph describes the key factors or effects that impacted the rates of change in drug costs across all NPDUIS public drug plans for each year from 2012/13 to 2016/17. Each column is broken out to give the positive or negative contribution of each effect: drug-mix for direct-acting antiviral (DAA) drugs for the treatment of hepatitis C; drug-mix for all other drugs; volume; demographic; price change; and substitution. Separate rows above and below the bar graph show the total positive push effect, negative pull effect and net change for each year.
blank
|
2012/13 |
2013/14 |
2014/15 |
2015/16 |
2016/17 |
| Drug-mix, direct-acting antiviral (DAA) drugs |
0.0% |
0.0% |
0.0% |
8.0% |
-2.3% |
| Drug mix, other drugs |
4.1% |
5.4% |
4.9% |
4.1% |
4.4% |
| Volume |
1.7% |
2.2% |
0.3% |
1.2% |
1.0% |
| Demographic |
2.7% |
2.1% |
2.7% |
3.0% |
1.8% |
| Price change |
-2.0% |
-6.0% |
-3.0% |
-1.8% |
-1.0% |
| Substitution |
-7.2% |
-1.5% |
-3.2% |
-2.3% |
-1.8% |
| Total push effect |
8.5% |
9.7% |
7.9% |
16.2% |
7.2% |
| Total pull effect |
-9.2% |
-7.5% |
-6.2% |
-4.1% |
-5.1% |
| Net change |
-0.8% |
2.0% |
2.5% |
12.0% |
2.0% |
Note: Values for the years prior to 2016/17 have not been updated using the new methodology, as there would have been no notable change in the relative contribution of each effect; thus the net changes reported here differ slightly from those reported in Figure 1.4.
This analysis is based on publicly available pricing information. It does not reflect the confidential drug price discounts negotiated by the pCPA on behalf of the public plans.
Values may not add to totals due to rounding and the cross effect. Results for 2012/13 do not capture the data for the British Columbia and Newfoundland and Labrador provincial public drug plans. Results for Yukon were only included for 2016/17.
* British Columbia, Alberta, Saskatchewan, Manitoba, Ontario, New Brunswick, Nova Scotia, Prince Edward Island, Newfoundland and Labrador, Yukon and the Non-Insured Health Benefits Program.
Data source: National Prescription Drug Utilization Information System Database, Canadian Institute for Health Information.
In 2016/17, the rates of growth in drug costs varied widely across plans, from a low of -5.6% in Yukon to a high of 13.4% in Prince Edward Island (Figure 2.2). These variations were mainly driven by differences in the impact of the drug-mix effect. Jurisdictions with higher overall growth rates included Prince Edward Island (13.4%), the NIHB (6.4%), Ontario (3.4%) and New Brunswick (3.0%). The declining impact of DAA drugs also varied, with the largest downward pull in Yukon (-11%), followed by British Columbia (-7.1%), Nova Scotia (-3.2%) and Manitoba (-3.1%).
The overall 2.0% increase in drug costs in NPDUIS public drug plans represents an absolute growth of $168 million.
The drug-mix effect for higher-cost drugs (other than DAA drugs for hepatitis C) had the greatest push on drug costs with an impact of 4.4% or $363 million. In contrast, a decrease in the use of DAA drugs drove costs down by -2.3% or -$186 million. Differences in the drug-mix effect across public drug plans may be related to plan designs, formulary listing decisions, or the disease profiles of the population, among other determinants.
The demographic effect boosted drug costs in the NPDUIS public plans by 1.8% ($151 million) in 2016/17. An increase in the number of Canadians eligible for senior coverage (65+) and the launch of new sub-plans (e.g., increased eligibility in PEI) are among the factors that contributed to this growth.
The volume effect, which has been reasonably stable over the past few years, pushed drug costs up by 1.0% ($86 million) in 2016/17. This effect was an important driver in New Brunswick (3.3%), Saskatchewan (2.3%) and the NIHB (2.3%).
The cost-saving effects of generic substitutions (-1.8% or -$145 million) and price reductions (-1.0% or -$84 million) were similar in magnitude in 2016/17 and were relatively
uniform across the jurisdictions. Together they represented a 2.8% savings for the NPDUIS public plans ($229 million).
The following three subsections further explore the price change, substitution and drug-mix effects for 2016/17.
Figure 2.2 Rates of change in drug costs, NPDUIS public drug plans, 2015/16 to 2016/17
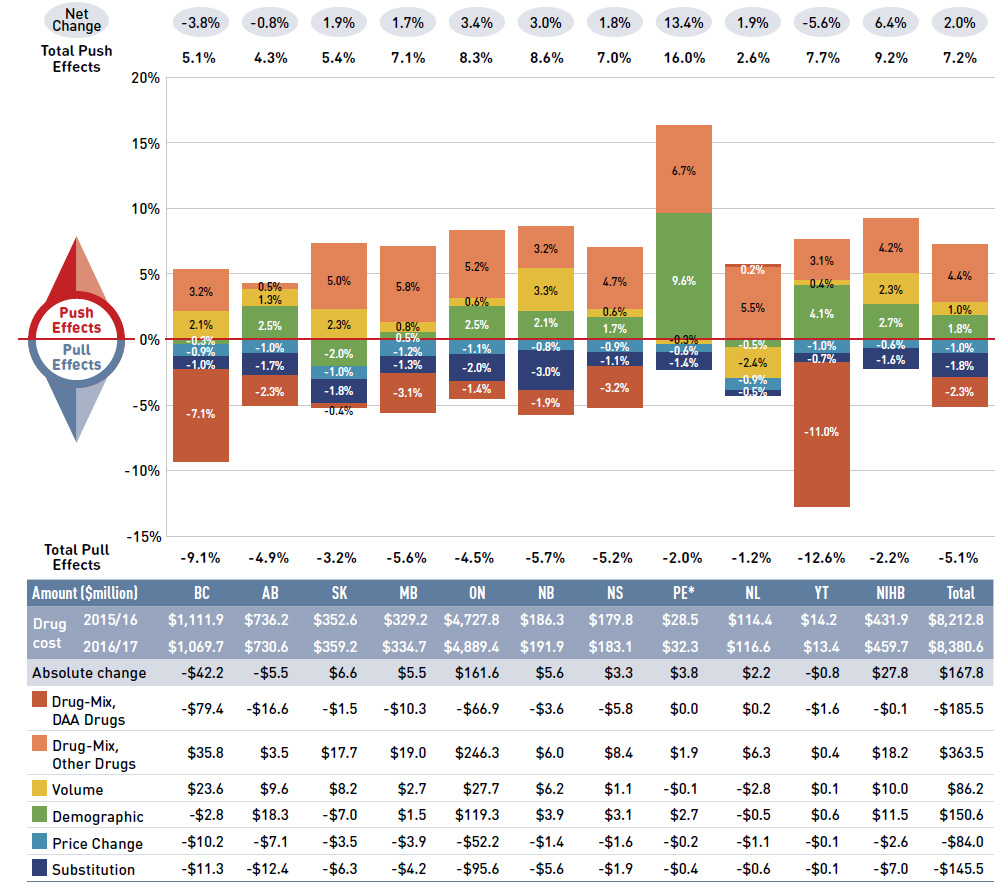
Figure description
This column graph and table describe the key factors or effects that impacted the rates of change in drug costs for each of the NPDUIS public drug plans from 2015/16 to 2016/17. Each column is broken out to give the positive or negative contribution of each effect: drug-mix for direct-acting antiviral (DAA) drugs for the treatment of hepatitis C; drug-mix for all other drugs; volume; demographic; price change; and substitution. Separate rows above and below the bar graph show the total positive push effect, negative pull effect and net change for each year. Total results for all plans are also included.
blank
|
British Columbia |
Alberta |
Saskatchewan |
Manitoba |
Ontario |
New Brunswick |
Nova Scotia |
Prince Edward Island |
Newfoundland and Labrador |
Yukon |
Non-Insured Health Benefits |
Total |
| Drug-mix, direct-acting antiviral (DAA) drugs |
-7.1% |
-2.3% |
-0.4% |
-3.1% |
-1.4% |
-1.9% |
-3.2% |
0.0% |
0.2% |
-11.0% |
0.0% |
-2.3% |
| Drug-mix, other drugs |
3.2% |
0.5% |
5.0% |
5.8% |
5.2% |
3.2% |
4.7% |
6.7% |
5.5% |
3.1% |
4.2% |
4.4% |
| Volume |
2.1% |
1.3% |
2.3% |
0.8% |
0.6% |
3.3% |
0.6% |
-0.3% |
-2.4% |
0.4% |
2.3% |
1.0% |
| Demographic |
-0.3% |
2.5% |
-2.0% |
0.5% |
2.5% |
2.1% |
1.7% |
9.6% |
-0.5% |
4.1% |
2.7% |
1.8% |
| Price change |
-0.9% |
-1.0% |
-1.0% |
-1.2% |
-1.1% |
-0.8% |
-0.9% |
-0.6% |
-0.9% |
-1.0% |
-0.6% |
-1.0% |
| Substitution |
-1.0% |
-1.7% |
-1.8% |
-1.3% |
-2.0% |
-3.0% |
-1.1% |
-1.4% |
-0.5% |
-0.7% |
-1.6% |
-1.8% |
| Total push effect |
-9.1% |
-4.9% |
-3.2% |
-5.6% |
-4.5% |
-5.7% |
-5.2% |
-2.0% |
-1.2% |
-12.6% |
-2.2% |
7.2% |
| Total pull effect |
5.1% |
4.3% |
5.4% |
7.1% |
8.3% |
8.6% |
7.0% |
16.0% |
2.6% |
7.7% |
9.2% |
-5.1% |
| Net change |
-3.8% |
-0.8% |
1.9% |
1.7% |
3.4% |
3.0% |
1.8% |
13.4% |
1.9% |
-5.6% |
6.4% |
2.0% |
An accompanying table gives the corresponding changes in millions of dollars, as well as the total drugs costs in 2015/16 and 2016/17 and the absolute change for each plan.
blank
|
British Columbia |
Alberta |
Saskatchewan |
Manitoba |
Ontario |
New Brunswick |
Nova Scotia |
Prince Edward Island |
Newfoundland and Labrador |
Yukon |
Non-Insured Health Benefits |
Total |
| Drug cost 2015/16 |
$1,111.9 |
$736.2 |
$352.6 |
$329.2 |
$4,727.8 |
$186.3 |
$179.8 |
$28.5 |
$114.4 |
$14.2 |
$431.9 |
$8,212.8 |
| Drug cost 2016/17 |
$1,069.7 |
$730.6 |
$359.2 |
$334.7 |
$4,889.4 |
$191.9 |
$183.1 |
$32.3 |
$116.6 |
$13.4 |
$459.7 |
$8,380.6 |
| Absolute change |
-$42.2 |
-$5.5 |
$6.6 |
$5.5 |
$161.6 |
$5.6 |
$3.3 |
$3.8 |
$2.2 |
-$0.8 |
$27.8 |
$167.8 |
| Drug-mix, direct-acting antiviral (DAA) drugs |
-$79.4 |
-$16.6 |
-$1.5 |
-$10.3 |
-$66.9 |
-$3.6 |
-$5.8 |
$0.0 |
$0.2 |
-$1.6 |
-$0.1 |
-$185.5 |
| Drug-mix, other drugs |
$35.8 |
$3.5 |
$17.7 |
$19.0 |
$246.3 |
$6.0 |
$8.4 |
$1.9 |
$6.3 |
$0.4 |
$18.2 |
$363.5 |
| Volume |
$23.6 |
$9.6 |
$8.2 |
$2.7 |
$27.7 |
$6.2 |
$1.1 |
-$0.1 |
-$2.8 |
$0.1 |
$10.0 |
$86.2 |
| Demographic |
-$2.8 |
$18.3 |
-$7.0 |
$1.5 |
$119.3 |
$3.9 |
$3.1 |
$2.7 |
-$0.5 |
$0.6 |
$11.5 |
$150.6 |
| Price change |
-$10.2 |
-$7.1 |
-$3.5 |
-$3.9 |
-$52.2 |
-$1.4 |
-$1.6 |
-$0.2 |
-$1.1 |
-$0.1 |
-$2.6 |
-$84.0 |
| Substitution |
-$11.3 |
-$12.4 |
-$6.3 |
-$4.2 |
-$95.6 |
-$5.6 |
-$1.9 |
-$0.4 |
-$0.6 |
-$0.1 |
-$7.0 |
-$145.5 |
Note: This analysis is based on publicly available pricing information. It does not reflect the confidential drug price discounts negotiated by the pCPA on behalf of the public plans. Values may not add to totals due to rounding and the cross effect.
* In 2015, PEI introduced a Generic Drug Program for residents under the age of 65 without private insurance, limiting the out-of-pocket costs for eligible generic prescription drugs. This resulted in a large increase in the beneficiary population and the volume of drugs used since then.
Data source: National Prescription Drug Utilization Information System Database, Canadian Institute for Health Information.
Price Change Effect
The relatively modest 1.0% ($84 million) downward pull of the price change effect in 2016/17 was mainly due to the limited scope of the generic pricing policies implemented
between 2015/16 and 2016/17. This is reflected as a reduction in the average unit costs reimbursed in the multi-source generic market segment. The average unit costs of patented medicines remained relatively stable, while the costs of single-source non-patented medicines increased.
The decrease in the cost of generic drugs in 2016/17 was mainly the result of a pan-Canadian Pharmaceutical Alliance (pCPA) initiative that lowered the prices of four additional commonly used drugs to 18% of their brand-name equivalentsFootnote II. Note that any pricing policies implemented after 2016/17 will not be reflected in these results.
From 2009/10 to 2016/17, the prices of patented medicines, which represent the largest market segment (60.1% in 2016/17), have been relatively stable, while the prices of single-source non-patented medicines, the smallest market segment (3.9%), have increased by an average of 18%. Despite this significant rise, the impact of the single-source non-patented market segment was limited due to its small size.
The multi-source generic market segment shows a similar trend across all NPDUIS public drug plans: a rapid decline in the first few years after generic price reforms, followed
by a slowing decline from 2014/15 to 2016/17, as generic prices stabilized. The variation among the individual plans reflects the timing of generic reforms, the magnitude of
generic price reductions and the utilization rates of generic drugs.
Brief Insights: pCPA Initiatives
Through the pan-Canadian Pharmaceutical Alliance (pCPA), the provinces, territories and federal government have been working collectively to achieve greater value for generic and brand-name drugs for Canada’s publicly funded drug programs.
Generic drugs:
Between April 1, 2015, and April 1, 2016, the prices of 18 commonly used generic drugs were reduced to 18% of their brand-name reference products. In addition, a one-year bridging period was put into effect on April 1, 2017, which further reduced the prices of six of the molecules to 15% of the brand reference price.
As of April 1, 2018, the prices of nearly 70 of the most commonly prescribed drugs in Canada were reduced by 25% to 40%, resulting in overall discounts of up to 90% off the price of their brand-name equivalents.
Brand-name drugs:
As of June 30, 2018, 219 joint negotiations or product listing agreements (PLAs) for brand-name drugs were completed by the pCPA, with another 47 negotiations underway.
For more details, see the overview of generic pricing policies and pCPA initiatives available in the Reference Documents section of the NPDUIS Analytical Studies page on the PMPRB website.
Figure 2.3 reports trends in average unit costs from 2009/10 to 2016/17 by market segment for (a) patented medicines; (b) multi-source generic drugs; and (c) single-source non-patented medicines, along with their corresponding 2016/17 market shares. The results are presented as an index, with the base year (2009/10) set to one and subsequent years reported relative to this value. The findings were calculated using the cost-weighted average of the average reimbursed unit cost changes at the individual drug level. The analysis was restricted to oral solid formulations to ensure unit consistency.
Figure 2.3 Average unit cost index by market segment, NPDUIS public drug plans, 2009/10 to 2016/17
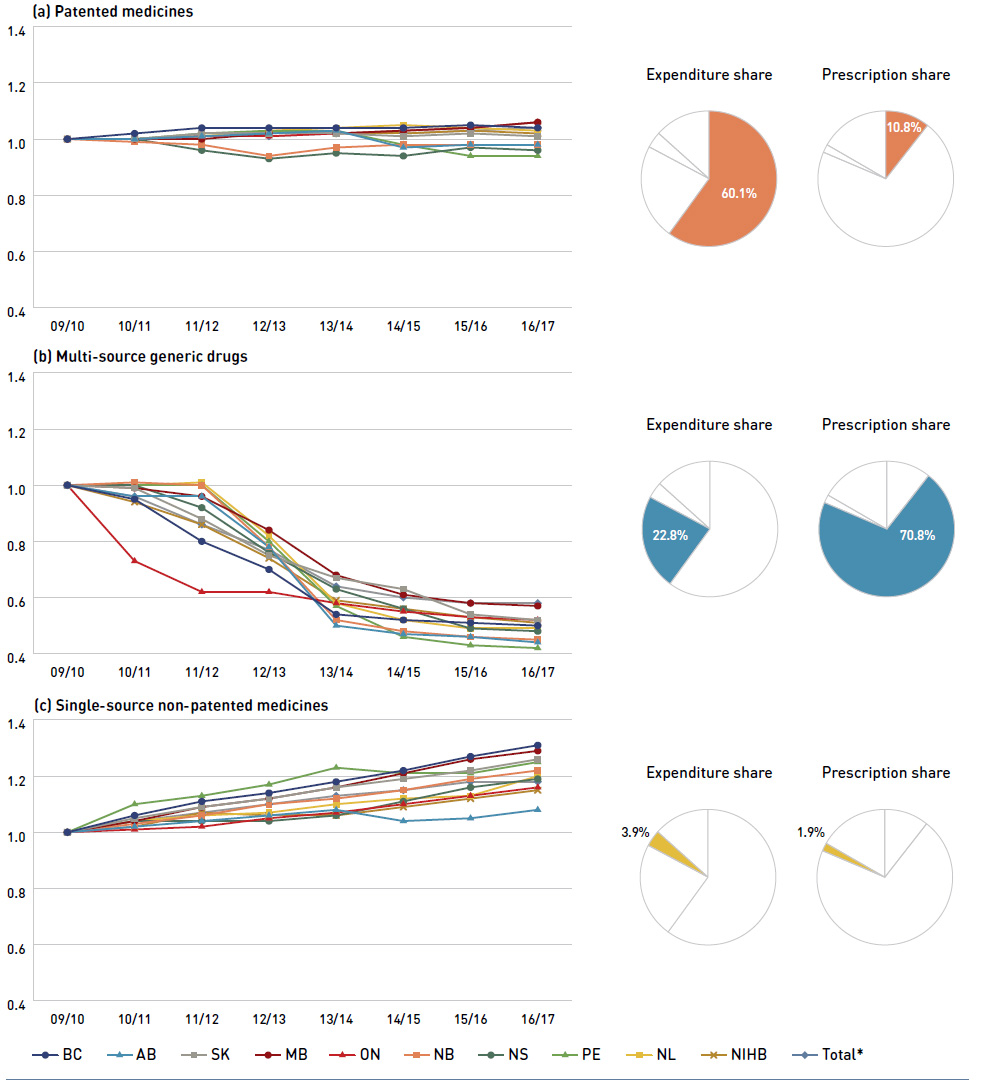
Figure description
This figure has three sections, each with a line graph depicting the average unit cost index from 2009/10 to 2016/17 for (a) patented medicines, (b) multi-source generic drugs, and (c) single-source non-patented medicines. Results are given for each NPDUIS drug plan, as well as the total for all plans. Expenditure and prescription shares for 2016/17 are shown in pie charts below each graph.
(a) Patented medicines:
blank
| |
2009/10 |
2010/11 |
2011/12 |
2012/13 |
2013/14 |
2014/15 |
2015/16 |
2016/17 |
| British Columbia |
1.00 |
1.02 |
1.04 |
1.04 |
1.04 |
1.04 |
1.05 |
1.04 |
| Alberta |
1.00 |
1.00 |
1.01 |
1.02 |
1.03 |
0.97 |
0.98 |
0.98 |
| Saskatchewan |
1.00 |
1.00 |
1.02 |
1.02 |
1.02 |
1.01 |
1.02 |
1.01 |
| Manitoba |
1.00 |
1.00 |
1.00 |
1.02 |
1.02 |
1.03 |
1.04 |
1.06 |
| Ontario |
1.00 |
1.00 |
1.01 |
1.01 |
1.02 |
1.03 |
1.04 |
1.06 |
| New Brunswick |
1.00 |
0.99 |
0.98 |
0.94 |
0.97 |
0.98 |
0.98 |
0.98 |
| Nova Scotia |
1.00 |
1.00 |
0.96 |
0.93 |
0.95 |
0.94 |
0.97 |
0.96 |
| Prince Edward Island |
1.00 |
1.00 |
1.02 |
1.03 |
1.03 |
0.98 |
0.94 |
0.94 |
| Newfoundland and Labrador |
1.00 |
1.00 |
1.01 |
1.03 |
1.04 |
1.05 |
1.04 |
1.03 |
| Non-Insured Health Benefits |
1.00 |
1.00 |
1.01 |
1.02 |
1.02 |
1.02 |
1.03 |
1.02 |
| Total results for the drugs plans captured in this figure |
1.00 |
1.00 |
1.01 |
1.01 |
1.02 |
1.02 |
1.03 |
1.04 |
blank
| Expenditure share |
Prescription share |
| 60.1% |
10.8% |
(b) Multi-source generic drugs:
blank
| |
2009/10 |
2010/11 |
2011/12 |
2012/13 |
2013/14 |
2014/15 |
2015/16 |
2016/17 |
| British Columbia |
1.00 |
0.95 |
0.80 |
0.70 |
0.54 |
0.52 |
0.51 |
0.50 |
| Alberta |
1.00 |
0.96 |
0.96 |
0.78 |
0.50 |
0.47 |
0.46 |
0.44 |
| Saskatchewan |
1.00 |
0.99 |
0.88 |
0.75 |
0.67 |
0.63 |
0.54 |
0.52 |
| Manitoba |
1.00 |
0.99 |
0.96 |
0.84 |
0.68 |
0.61 |
0.58 |
0.57 |
| Ontario |
1.00 |
0.73 |
0.62 |
0.62 |
0.58 |
0.55 |
0.53 |
0.52 |
| New Brunswick |
1.00 |
1.01 |
1.00 |
0.78 |
0.52 |
0.48 |
0.46 |
0.45 |
| Nova Scotia |
1.00 |
1.00 |
0.92 |
0.76 |
0.63 |
0.56 |
0.49 |
0.48 |
| Prince Edward Island |
1.00 |
1.00 |
1.00 |
0.80 |
0.57 |
0.46 |
0.43 |
0.42 |
| Newfoundland and Labrador |
1.00 |
1.00 |
1.01 |
0.82 |
0.58 |
0.52 |
0.49 |
0.49 |
| Non-Insured Health Benefits |
1.00 |
0.94 |
0.86 |
0.74 |
0.59 |
0.56 |
0.53 |
0.51 |
| Total results for the drugs plans captured in this figure |
1.00 |
0.96 |
0.86 |
0.77 |
0.64 |
0.60 |
0.58 |
0.58 |
blank
| Expenditure share |
Prescription share |
| 22.8% |
70.8% |
(c) Single-source non-patented medicines:
blank
| |
2009/10 |
2010/11 |
2011/12 |
2012/13 |
2013/14 |
2014/15 |
2015/16 |
2016/17 |
| British Columbia |
1.00 |
1.06 |
1.11 |
1.14 |
1.18 |
1.22 |
1.27 |
1.31 |
| Alberta |
1.00 |
1.02 |
1.04 |
1.06 |
1.08 |
1.04 |
1.05 |
1.08 |
| Saskatchewan |
1.00 |
1.05 |
1.09 |
1.12 |
1.16 |
1.19 |
1.22 |
1.26 |
| Manitoba |
1.00 |
1.04 |
1.09 |
1.12 |
1.16 |
1.21 |
1.26 |
1.29 |
| Ontario |
1.00 |
1.01 |
1.02 |
1.05 |
1.07 |
1.10 |
1.13 |
1.16 |
| New Brunswick |
1.00 |
1.03 |
1.06 |
1.10 |
1.12 |
1.15 |
1.19 |
1.22 |
| Nova Scotia |
1.00 |
1.04 |
1.04 |
1.04 |
1.06 |
1.11 |
1.16 |
1.19 |
| Prince Edward Island |
1.00 |
1.10 |
1.13 |
1.17 |
1.23 |
1.21 |
1.21 |
1.25 |
| Newfoundland and Labrador |
1.00 |
1.04 |
1.06 |
1.07 |
1.10 |
1.12 |
1.13 |
1.20 |
| Non-Insured Health Benefits |
1.00 |
1.02 |
1.07 |
1.06 |
1.06 |
1.09 |
1.12 |
1.15 |
| Total results for the drugs plans captured in this figure |
1.00 |
1.04 |
1.07 |
1.10 |
1.13 |
1.15 |
1.18 |
1.18 |
blank
| Expenditure share |
Prescription share |
| 3.9% |
1.9% |
Note: This analysis only includes data for beneficiaries that met their deductible and received public reimbursement.
Historical results reported reflect this new approach. Yukon is not reported due to data limitations.
The findings were calculated using the cost-weighted average of the average reimbursed unit cost changes at the individual drug level. The analysis was limited to data for oral solid formulations. The remaining share of prescriptions and expenditures includes devices, compounded drugs and other products that are reimbursed by public drug plans but do not have a Health Canada assigned Drug Identification Number (DIN).
* Total results for the drugs plans captured in this figure.
Data source: National Prescription Drug Utilization Information System Database, Canadian Institute for Health Information.
Substitution Effect
Shifts from brand-name to generic drugs or biosimilars pulled overall drug costs down by 1.8% in 2016/17, translating into a savings of $145 million for the NPDUIS
public plans. Three drugs were responsible for most of the savings from generic substitution: duloxetine (-0.7%), pantoprazole (-0.4%) and abacavir/lamivudine (-0.1%).
The total savings offered by biosimilars have been limited, with Inflectra (-0.04%) and Grastofil (-0.02%) making only a small but measurable difference in overall drug costs.
The share of prescriptions for multi-source generic drugs exceeded 70% in 2016/17, a marked increase from 58.9% in 2011/12, while the corresponding share of total drug costs decreased significantly over the same time period, from 28.0% to 22.8%. This six-year trend reflects the end of the patent cliff period followed by the implementation
of provincial generic pricing policies.
Brief Insights: Biosimilars
The pan-Canadian Pharmaceutical Alliance (pCPA) is working toward establishing a policy framework related to biosimilars. On April 1, 2016, the pCPA released a set of “First Principles” to guide negotiations and inform expectations.
During the same period, patented medicines, which accounted for a decreasing share of prescriptions (from 15.9% to 10.8%), increasingly dominated public drug plan costs (rising from 51.4% to 60.1%). This shift resulted from the increased use of high-cost drugs, such as biologic agents, oral oncology drugs and the new DAA drugs for hepatitis C.
Figure 2.4 reports the 2011/12 to 2016/17 trends in market shares by market segment: patented, multi-source generic and single-source non-patented medicines.
Figure 2.4 Shares of prescriptions and drug costs by market segment, NPDUIS public drug plans*, 2011/12 to 2016/17
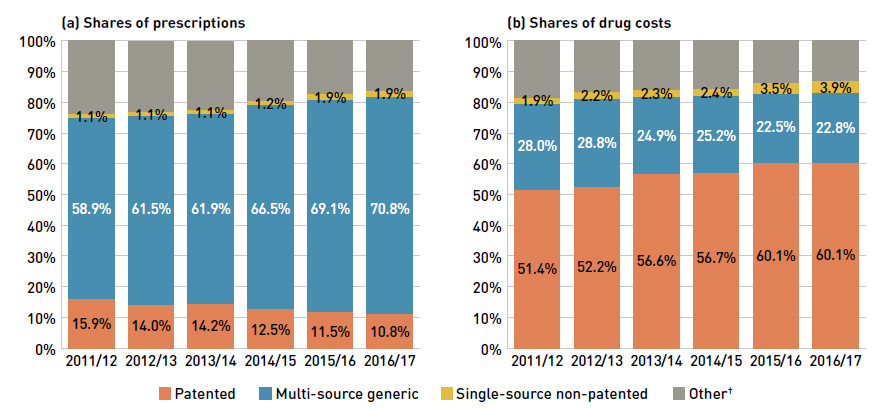
Figure description
This figure shows two complementary stacked column graphs. Graph (a) shows the generic share of prescriptions by market segment from 2011/12 to 2016/17 for all NPDUIS public drug plans. Graph (b) shows the generic share of drug costs by market segment for the same period.
(a) Share of prescriptions:
blank
| Market segment |
2011/12 |
2012/13 |
2013/14 |
2014/15 |
2015/16 |
2016/17 |
| Patented |
15.9% |
14.0% |
14.2% |
12.5% |
11.5% |
10.8% |
| Multi-source generic |
58.9% |
61.5% |
61.9% |
66.5% |
69.1% |
70.8% |
| Single-source non-patented |
1.1% |
1.1% |
1.1% |
1.2% |
1.9% |
1.9% |
| Other† |
24.1% |
23.3% |
22.7% |
19.8% |
17.5% |
16.5% |
† This market segment includes devices, compounded drugs and other products that are reimbursed by public drug plans but do not have a Health Canada assigned Drug Identification Number (DIN).
(b) Share of drug costs:
blank
| Market segment |
2011/12 |
2012/13 |
2013/14 |
2014/15 |
2015/16 |
2016/17 |
| Patented |
51.4% |
52.2% |
56.6% |
56.7% |
60.1% |
60.1% |
| Multi-source generic |
28.0% |
28.8% |
24.9% |
25.2% |
22.5% |
22.8% |
| Single-source non-patented |
1.9% |
2.2% |
2.3% |
2.4% |
3.5% |
3.9% |
| Other† |
18.7% |
16.8% |
16.2% |
15.8% |
13.9% |
13.2% |
† This market segment includes devices, compounded drugs and other products that are reimbursed by public drug plans but do not have a Health Canada assigned Drug Identification Number (DIN).
Note: This analysis only includes data for beneficiaries that met their deductible and received public reimbursement. Historical
results reported reflect this new approach.
* British Columbia, Alberta, Saskatchewan, Manitoba, Ontario, New Brunswick, Nova Scotia, Prince Edward Island, Newfoundland and Labrador, Yukon and the Non-Insured Health Benefits Program.
† This market segment includes devices, compounded drugs and other products that are reimbursed by public drug plans but do not have a Health Canada assigned Drug Identification Number (DIN).
Data source: National Prescription Drug Utilization Information System Database, Canadian Institute for Health Information.
Compared to traditional generic drug markets, the savings from biosimilars are limited by a slower uptake and lower price reductions.
A number of biosimilar drugs have recently entered the Canadian market following the approval of the first biosimilar in 2009 (Sandoz Canada’s Omnitrope growth hormone). Unlike generics, biosimilars are not identical to their reference drug products, but are rather highly similar versionsFootnote III.
Table 2.1 provides an overview of the biosimilars recently approved in Canada. Inflectra was approved in Canada in 2014 and became available in the public market in 2016. By 2016/17 it had been approved for most of the same autoimmune inflammatory disease indications as its reference product Remicade. Compared to other biosimilars, Inflectra’s price was a notable 47% lower than its reference product. However, its market uptake has been slow, acquiring only an average share of 1.6% of the infliximab market by 2016/17.
While still modest, Grastofil, a biosimilar of the white blood cell stimulator Neupogen (filgrastim), has the highest uptake in the public plans so far (at an average of 4.7% in 2016/17).
Table 2.1 Biosimilars recently approved in Canada, NPDUIS public drug plans*, 2016/17
| Reference biologic |
Biosimilar |
| Trade name (molecule) |
Drug cost, $M (share) |
Trade name |
Market approval |
First reimbursed |
Price discount†
from reference drug |
Share of prescriptions
for molecule |
| Remicade (infliximab) |
$396.3 (4.7%) |
Inflectra |
15/01/14 |
Q1-2016 |
46.8% |
1.6% |
| Lantus (insulin glargine) |
$137.7 (1.6%) |
Basaglar |
01/09/15 |
Q3-2017 |
25.0% |
NA |
| Neupogen (filgrastim) |
$42.4 (0.5%) |
Grastofil |
07/12/15 |
Q4-2016 |
25.0% |
4.7% |
| Enbrel (etanercept) |
$159.6 (1.9%) |
Brenzys |
31/08/16 |
Q3-2017 |
33.7% |
NA |
| Erelzi |
06/04/17 |
NA |
37.2% |
NA |
* British Columbia, Alberta, Saskatchewan, Manitoba, Ontario, New Brunswick, Nova Scotia, Prince Edward Island, Newfoundland and Labrador, Yukon and the Non-Insured Health Benefits Program.
† Based on the Ontario Drug Benefit formulary listing price.
Data source: National Prescription Drug Utilization Information System Database, Canadian Institute for Health Information.
Drug-Mix Effect
In 2016/17, the shifts in use between lower- and higher-cost drugs, pushed overall cost levels for the NPDUIS drug plans up by 4.4% or $363 million. This does not include the impact of the DAA drugs for hepatitis C, which is reported separately.
Direct-acting antiviral (DAA) drugs for the treatment of hepatitis C have had a significant impact on public plan drug costs over the last few years.
In 2015/16, DAAs for hepatitis C pushed drug costs in public plans up by 8.0% or $600.6M. A total of 8,448 beneficiaries received reimbursement reflecting the unmet need that existed at that time. In 2016/17, slightly fewer beneficiaries (7,563) received reimbursement for the DAA drugs, generating a cost pressure of $440.2M, which was $185.5M lower than the previous year, pulling the overall costs downward by -2.3%Footnote IV.
Brief Insights: DAA drugs for hepatitis C
The new generation of DAAsFootnote V for hepatitis C were introduced at high prices. Through the pan-Canadian Pharmaceutical Alliance (pCPA), pricing agreements for most of these drugs were reached between 2014 and 2016, resulting in public coverage being restricted to patients with a certain type or severity of illness. In 2017, a multi-stakeholder agreement was reached through the pCPA, which included several new drugs along with those that were already being reimbursed. This was guided by the need to expand publicly funded access to most patients with hepatitis C while addressing the issues of financial affordability and sustainability and a fair approach to negotiating value among multiple drugs and manufacturers.
Since the implementation of the multi-stakeholder agreement in 2017, the criteria for listing DAA drugs in public drug plans has been expanded to include patients previously not eligible for coverage. This will likely have implications on the cost growth of DAAs in future years, which will be monitored through this publication.
Figure 2.5 reports the drugs that made the greatest contribution to the drug-mix effect; with the top 10 positive contributors accounting for an upward push of 4.0% on overall drug costs. Ophthalmological drugs contributed both positively (Eylea) and negatively (Lucentis) to the increase in drug costs, almost offsetting one another. Most of the other major contributors had annual treatment costs exceeding $10,000, including oral oncology products, immunosuppressants and antivirals. The remaining top contributors were used by larger
beneficiary populations to treat more common conditions. The share of total drug costs for each of the top 10 contributors is reported in the accompanying table. Note that this
value differs from the contribution to the drug-mix effect, which measures the growth (increase or decrease in costs over time) rather than the costs themselves.
The NPDUIS public plans have been reimbursing a growing number of high-cost drugs, which often target relatively small patient populations. The number of drugs with average annual costs per beneficiary exceeding $10,000 nearly doubled from 47 in 2011/12 to 86 in 2016/17. These drugs, which accounted for 12.6% of the overall NPDUIS drug costs in 2011/12, accounted for 27.7% of the costs in 2016/17, representing only a very small percentage of active beneficiaries (1.67%).
Figure 2.5 Top drugs contributing to the drug-mix effect, NPDUIS public drug plans*, 2016/17
Figure description
A horizontal bar graph depicts the top 10 drugs contributing to the drug-mix push effect in the NPDUIS public drug plans in 2016/17 and the top drug contributing to the drug-mix pull effect. An accompanying table gives the average cost per beneficiary; total number of beneficiaries; drug cost in millions of dollars; share of the total drug cost; therapeutic class; and trade name and molecule for each drug.
Top 10 drugs contributing to the push effect
| Average cost per beneficiary |
Total number of beneficiaries |
Drug cost $ million (share) |
Therapeutic class |
Trade name (molecule) |
Contribution to the drug-mix effect |
| $7,800 |
24,143 |
$188.3 (2.2%) |
Ophthalmologicals |
Eylea (aflibercept) |
1.44% |
| $64,604 |
599 |
$38.7 (0.5%) |
Antineoplastic agents |
Imbruvica (ibrutinib) |
0.36% |
| $870 |
94,444 |
$82.2 (1.0%) |
Antithrombotic agents |
Eliquis (apixaban) |
0.36% |
| $67,015 |
1,844 |
$123.6 (1.5%) |
Immunosuppressive agents |
Revlimid (lenalidomide) |
0.31% |
| $29,665 |
13,453 |
$399.1 (4.8%) |
Immunosuppressive agents |
Remicade, Inflectra (infliximab) |
0.31% |
| $764 |
48,416 |
$37 (0.4%) |
Drugs used in diabetes |
Invokana (canagliflozin) |
0.27% |
| $16,876 |
15,645 |
$264 (3.1%) |
Immunosuppressive agents |
Humira (adalimumab) |
0.27% |
| $11,394 |
2,912 |
$33.2 (0.4%) |
Antivirals to treat HIV/AIDS |
Triumeq (abacavir, lamivudine, dolutegravir) |
0.24% |
| $948 |
106,002 |
$100.5 (1.2%) |
Drugs used in diabetes |
Janumet (sitagliptin, metformin) |
0.21% |
| $20,280 |
1,091 |
$22.1 (0.3%) |
Endocrine therapy |
Xtandi (enzalutamide) |
0.20% |
Top drug contributing to the pull effect
| Average cost per beneficiary |
Total number of beneficiaries |
Drug cost $ million (share) |
Therapeutic class |
Trade name (molecule) |
Contribution to the drug-mix effect |
| $8,387 |
26,057 |
$218.5 (2.6%) |
Ophthalmologicals |
Lucentis (ranibizumab) |
-1.19% |
Note: This analysis only includes data for beneficiaries that met their deductible and received public reimbursement.
* British Columbia, Alberta, Saskatchewan, Manitoba, Ontario, New Brunswick, Nova Scotia, Prince Edward Island, Newfoundland and Labrador, Yukon and the Non-Insured Health Benefits Program.
† The therapeutic class is based on ATC level 2, except for antivirals to treat HIV/AIDS. Jurisdictions which have special programs for ophthalmological drugs are not captured in the results.
Data source: National Prescription Drug Utilization Information System Database, Canadian Institute for Health Information.
Although there has been a sustained growth in the costs of all high-cost drugs in recent years, the steepest increase has been in the highest-cost band (50K+). Figure 2.6 reports on the trends in high-cost drug use from 2011/12 to 2016/17 by average annual drug cost per active beneficiary determined at the drug level in the following ranges: $10,000–$20,000; $20,000–$50,000 and $50,000+. The share of new DAA drugs for hepatitis C is reported separately starting in 2015/16. The figure also reports the shares of drug costs (bar graph), active beneficiaries and prescriptions, as well as the number of high-cost drugs. While the share of hepatitis C drugs declined over the last year, the increase in the share
of other high-cost drugs more than compensated for the difference.
Figure 2.6 Trends in the number and cost of high-cost drugs* NPDUIS public drug plans†, 2011/12 to 2016/17
Figure description
This stacked column graph depicts the trend in the high-cost drug share of total drug costs for the NPDUIS drug plans from 2011/12 to 2016/17. Each column is divided into cost bands with percent shares shown. The share of new direct-acting antiviral (DAA) drugs for hepatitis C is reported separately for 2015/16 and 2016/17. The total share per year is given, as well as the total cost for high-cost drugs per year, in millions.
blank
| |
2011/12 |
2012/13 |
2013/14 |
2014/15 |
2015/16 |
2016/17 |
| $10 to $20 thousand |
7.2% |
8.8% |
10.3% |
10.6% |
10.3% |
11.4% |
| $20 to $50 thousand |
4.4% |
5.4% |
5.8% |
6.7% |
7.1% |
8.0% |
| $50 thousand and up, other drugs |
1.0% |
1.3% |
1.6% |
2.0% |
2.4% |
3.5% |
| $50 thousand and up, direct-acting antiviral (DAA) drugs‡ |
0.0% |
0.0% |
0.0% |
0.0% |
7.3% |
4.8% |
| Total high-cost drug share |
12.6% |
15.6% |
17.7% |
19.3% |
27.1% |
27.7% |
| Drug cost ($ million) |
$865.2 |
$1,075.7 |
$1,258.6 |
$1,408.7 |
$2,235.7 |
$2,327.2 |
An accompanying table shows the number of high-cost molecules, number of molecules in each cost band, share of active beneficiaries and share of prescriptions.
blank
| |
2011/12 |
2012/13 |
2013/14 |
2014/15 |
2015/16 |
2016/17 |
| Total number of molecules |
47 |
56 |
63 |
75 |
82 |
86 |
| $10 to $20 thousand |
27 |
30 |
37 |
38 |
35 |
36 |
| $20 to $50 thousand |
10 |
17 |
16 |
24 |
28 |
31 |
| $50 thousand and up, other drugs |
10 |
9 |
10 |
13 |
16 |
16 |
| $50 thousand and up, direct-acting antiviral (DAA) drugs‡ |
-- |
-- |
-- |
-- |
3 |
3 |
| Share of active beneficiaries |
0.87% |
1.04% |
1.18% |
1.28% |
1.52% |
1.67% |
| Share of prescriptions |
0.16% |
0.18% |
0.20% |
0.22% |
0.27% |
0.29% |
Note: This analysis only includes data for beneficiaries that met their deductible and received public reimbursement. Historical results reported reflect this new approach. These results may be underestimated, as some high-cost drugs are reimbursed through special public drug plan programs that are not captured in the NPDUIS data.
* Average annual drug costs per active beneficiary exceeding $10,000.
† British Columbia, Alberta, Saskatchewan, Manitoba, Ontario, New Brunswick, Nova Scotia, Prince Edward Island, Newfoundland and Labrador, Yukon and the Non-Insured Health Benefits Program.
‡ Direct-acting antiviral (DAA) drugs used in the treatment of hepatitis C.
Data source: National Prescription Drug Utilization Information System Database, Canadian Institute for Health Information.
Table 2.2 reports the 10 highest-cost drugs for 2016/17 ranked by their average annual drug cost per active beneficiary. The top seven drugs have treatment costs exceeding $100,000, and the top 10 includes one DAA drug, Sovaldi. Note that although Table 2.2 presents the overall results for all the NPDUIS public drug plans, there is a significant variation at the individual plan level.
Over the past five years, biologic drugs have captured an increasing share of the total drug costs for the NPDUIS public plans, reaching a new high of 26.0% in 2016/17. While the growth has slowed over the past three years, the total costs climbed to $2.2 billion in 2016/17, almost double the $1.4 billion costs in 2012/13. The top 10 biologics accounted for 18.4% of the total NPDUIS drug costs in 2016/17, with the top four drugs—Remicade, Humira, Lucentis and Elyea—responsible for 12.8% of the total.
Table 2.2 Top 10 drugs with the highest average annual drug cost per active beneficiary, NPDUIS public drug plans*, 2016/17
| Trade name (molecule) |
Therapeutic class, ATC level 2 |
Average drug cost per beneficiary† |
| Myozyme (alglucosidase alfa) |
Other alimentary tract and metabolism products |
$596,513 |
| Soliris (eculizumab) |
Immunosuppressants |
$433,796 |
| VPRIV (velaglucerase alfa) |
Other alimentary tract and metabolism products |
$360,203 |
| Kalydeco (ivacaftor) |
Other respiratory system products |
$255,608 |
| Remodulin (treprostinil) |
Antithrombotic agents |
$124,874 |
| Zavesca (miglustat) |
Other alimentary tract and metabolism products |
$113,445 |
| Prolastin C (alpha 1-proteinase inhibitor) |
Antihemorrhagics |
$104,213 |
| Pheburane (sodium phenylbutyrate) |
Other alimentary tract and metabolism products |
$76,178 |
| Somavert (pegvisomant) |
Pituitary and hypothalamic hormones and analogues |
$70,594 |
| Sovaldi (sofosbuvir) |
Antivirals for systemic use |
$68,716 |
Note: This analysis only includes data for beneficiaries that met their deductible and received public reimbursement. This list of drugs does not include high-cost drugs reimbursed through special programs.
* British Columbia, Alberta, Saskatchewan, Manitoba, Ontario, New Brunswick, Nova Scotia, Prince Edward Island, Newfoundland and Labrador, Yukon and the Non-Insured Health Benefits Program.
† Represents the total drug cost divided by the total number of beneficiaries and, thus, may include beneficiaries with incomplete treatment costs.
Data source: National Prescription Drug Utilization Information System Database, Canadian Institute for Health Information.
Figure 2.7 reports on trends in the biologic share of total drug costs for the NPDUIS public drug plans, along with the growth in drug costs for this market segment and the current list of top 10 biologic drugs.
Manitoba and Alberta had the highest levels of biologic-related costs relative to total drug costs in 2016/17 (34.2% and 34.0%, respectively); while Prince Edward Island and the NIHB had the highest rates of growth (18.3% and 14.5%, respectively). Variations across plans may be driven by plan designs, eligibility for reimbursement and the disease profiles of the population, among other considerations.
Figure 2.7 Biologic share of total drug costs, NPDUIS public drug plans, 2012/13 to 2016/17
Figure description
This column graph shows the biologic drug share of the total drug costs for the NPDUIS public drug plans from 2012/13 to 2016/17. There are three tables below the bar graph. The first shows the percent year-over-year growth in biologic drug costs over five years for each NPDUIS plan; the second displays the total cost of biologics in millions of dollars for 2016/17 by plan; and the third shows the top ten biologics by share of drug cost for all plans in 2016/17.
blank
| |
British Columbia |
Alberta |
Saskatchewan |
Manitoba |
Ontario |
New Brunswick |
Nova Scotia |
Prince Edward Island |
Newfoundland and Labrador |
Yukon |
Non-Insured Health Benefits |
Total |
| Biologic share of total drug cost by year |
| 2012/13 |
24.7% |
27.3% |
23.6% |
24.7% |
17.3% |
18.7% |
18.3% |
24.8% |
16.9% |
22.6% |
12.3% |
20.1% |
| 2013/14 |
29.3% |
34.6% |
27.2% |
29.4% |
20.5% |
21.8% |
21.5% |
28.3% |
21.0% |
25.9% |
14.1% |
23.7% |
| 2014/15 |
31.2% |
36.6% |
28.8% |
32.5% |
22.8% |
21.2% |
24.0% |
29.4% |
23.5% |
26.1% |
17.2% |
25.2% |
| 2015/16 |
27.6% |
34.3% |
29.8% |
31.7% |
22.6% |
21.0% |
22.6% |
29.3% |
23.3% |
21.1% |
15.6% |
24.8% |
| 2016/17 |
31.8% |
34.0% |
32.2% |
34.2% |
23.6% |
24.4% |
23.9% |
29.5% |
24.4% |
24.4% |
16.7% |
26.0% |
| Year-over-year growth |
| 2012/13 |
16.1% |
22.2% |
16.6% |
8.7% |
19.6% |
7.7% |
19.1% |
11.4% |
16.8% |
9.0% |
19.0% |
18.0% |
| 2013/14 |
13.9% |
21.7% |
19.9% |
15.4% |
26.0% |
7.5% |
17.9% |
3.8% |
10.5% |
3.4% |
17.8% |
21.2% |
| 2014/15 |
6.8% |
6.1% |
9.9% |
10.9% |
13.8% |
-2.6% |
9.4% |
-3.6% |
8.7% |
3.9% |
11.8% |
11.6% |
| 2015/16 |
9.0% |
3.4% |
9.6% |
8.8% |
11.1% |
4.9% |
-0.4% |
1.4% |
0.6% |
10.5% |
11.6% |
9.3% |
| 2016/17 |
10.4% |
-1.8% |
10.0% |
9.8% |
7.8% |
13.6% |
7.4% |
18.3% |
5.1% |
9.4% |
14.5% |
7.6% |
| Drug cost of biologics in 2016/17 ($ million) |
$341.3 |
$249.5 |
$115.6 |
$115.2 |
$1,158.6 |
$46.9 |
$43.8 |
$9.5 |
$28.6 |
$3.2 |
$77.2 |
$2,189.5 |
Top 10 biologics by share of drug cost
| Rank |
1 |
2 |
3 |
4 |
5 |
6 |
7 |
8 |
9 |
10 |
|
| Trade name |
Remicade |
Humira |
Lucentis |
Eylea |
Enbrel |
Lantus |
Stelara |
Prolia |
Simponi |
Fragmin |
Total top ten |
| Share of total drug cost |
4.7% |
3.1% |
2.7% |
2.2% |
1.8% |
1.6% |
0.6% |
0.6% |
0.6% |
0.5% |
18.4% |
Note: This analysis only includes data for beneficiaries that met their deductible and received public reimbursement. Historical
results reported reflect this new approach.
Data source: National Prescription Drug Utilization Information System Database, Canadian Institute for Health Information.
An analysis by therapeutic class suggests that over two thirds of the total drug costs in 2016/17 were concentrated in a few classes. Antineoplastic and immunomodulating agents, which had the third highest total drug cost share (16.2%) in 2012/13, had the highest share (21.7%) in 2016/17. Nervous system drugs comprised the second highest share of costs, the same as in 2012/13, although they represented a lower share of the total cost (14.3%) in 2016/17. Cardiovascular system drugs, which, like drugs for the nervous system, include
relatively low-cost drugs used by a large number of active beneficiaries, also represented a lower share of costs in 2016/17; while antineoplastic and immunomodulating agents, which are high-cost drugs generally used by a small number of beneficiaries, had a notably increased drug cost share.
Figure 2.8 compares the top 10 therapeutic classes by their share of drug costs in 2012/13 and 2016/17.
Figure 2.8 Top 10 ATC level 1 therapeutic classes by share of total drug costs, NPDUIS public drug plans*, 2012/13 and 2016/17
Figure description
This butterfly-shaped figure is composed of two bar graphs depicting the share of total drug costs in the NPDUIS public drug plans for each of the top 10 therapeutic classes in level 1 of the Anatomical Therapeutic Chemical Classification System. On the left, the shares for 2012/13 are shown, while shares for 2016/17 are shown on the right. The top five classes are highlighted, illustrating that 72.3% of costs in 2012/13 and 69.4% of costs in 2016/17 were concentrated in these classes.
blank
| Top 10 therapeutic classes |
2012/13 |
2016/17 |
| Antineoplastic and immunomodulating agents |
16.2% |
21.7% |
| Nervous system |
17.8% |
14.3% |
| Alimentary tract and metabolism |
13.2% |
12.4% |
| Cardiovascular system |
19.6% |
11.5% |
| Antiinfectives for systemic use |
5.5% |
9.6% |
| Respiratory system |
7.5% |
6.5% |
| Sensory organs |
5.9% |
6.3% |
| Blood and blood forming organs |
3.6% |
4.8% |
| Musculo-skeletal system |
4.2% |
2.7% |
| Genito urinary system and sex hormones |
3.1% |
1.9% |
Note: This analysis only includes data for beneficiaries that met their deductible and received public reimbursement. Results for Yukon were only included for 2016/17.
* British Columbia, Alberta, Saskatchewan, Manitoba, Ontario, New Brunswick, Nova Scotia, Prince Edward Island, Newfoundland and Labrador, Yukon and the Non-Insured Health Benefits Program.
Data source: National Prescription Drug Utilization Information System Database, Canadian Institute for Health Information.
3. The Drivers of Dispensing Costs, 2015/16 to 2016/17
The rate of change in dispensing costs declined for the second year in a row after three years of strong growth. A smaller increase in the overall volume of units dispensed and a decrease in the overall average dispensing fee contributed to the lower growth in 2016/17.
Like drug costs, changes in dispensing costs are driven by a number of “push” and “pull” effects. The net effect of these opposing forces yields the overall rate of change.
Demographic effect: Changes in the number of active beneficiaries, as well as shifts in the age or gender distribution.
Drug volume effect: Changes in the number of units dispensed to patients.
Fee effect: Changes in the average dispensing fee per prescription.
Prescription size effect: Changes in the number of units dispensed per prescription.
In this section, a comprehensive cost driver analysis is used to determine how much public plan drug costs would have changed between 2015/16 and 2016/17 if only one factor (e.g., the average dispensing fee) was considered while all the others remained the sameFootnote VI.
Figure 3.1 provides insight into the pressures driving changes in dispensing costs over the five-year period from 2012/13 to 2016/17. The demographic effect has followed
a fairly predictable trend, increasing costs by just over 2%, on average, each year over the last four years. Also, while the effect of the size of prescriptions dispensed has
gradually declined over the past five years, it remained virtually unchanged at just less than 1% over the last two years. In contrast, the impact from dispensing fees has
fluctuated from year to year, decreasing costs by 1.1% in 2016/17 after exerting an upward push of 2.8% in 2014/15. The volume effect shrank from a fairly steady increase of
1.3–1.8% to 0.4% in 2016/17, reflecting a slower growth in the number of units dispensed to patients.
Figure 3.1 Dispensing cost drivers, NPDUIS public plans*, 2012/13 to 2016/17
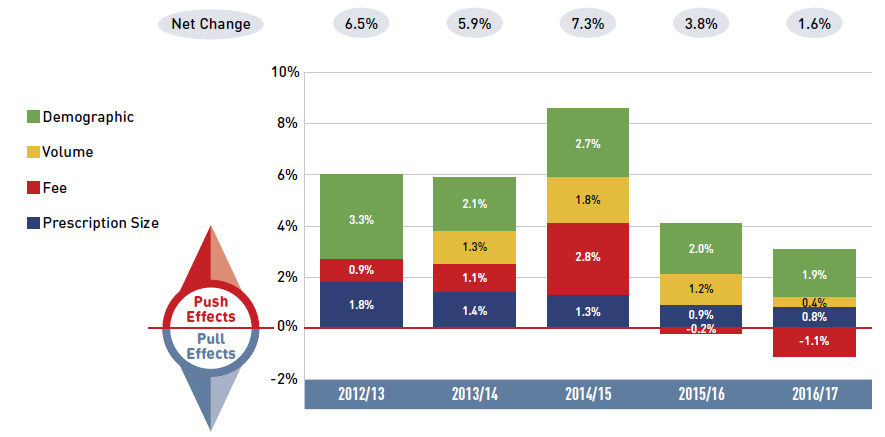
Figure description
This column graph describes the key factors or effects that impacted the rates of change in dispensing costs across all NPDUIS public drug plans for each year from 2012/13 to 2016/17. Each column is broken out to give the positive or negative contribution of each effect: demographic; volume; fee; and prescription size. The net change is shown for each year.
blank
|
2012/13 |
2013/14 |
2014/15 |
2015/16 |
2016/17 |
| Demographic |
3.3% |
2.1% |
2.7% |
2.0% |
1.9% |
| Volume |
0.0% |
1.3% |
1.8% |
1.2% |
0.4% |
| Fee |
0.9% |
1.1% |
2.8% |
-0.2% |
-1.1% |
| Prescription size |
1.8% |
1.4% |
1.3% |
0.9% |
0.8% |
| Net change |
6.5% |
5.9% |
7.3% |
3.8% |
1.6% |
Note: Values may not add to totals due to rounding and the cross effect. Yukon is not reported due to data limitations.
* British Columbia, Alberta, Saskatchewan, Manitoba, Ontario, New Brunswick, Nova Scotia, Prince Edward Island, Newfoundland and Labrador and the Non-Insured Health Benefits Program.
Data source: National Prescription Drug Utilization Information System Database, Canadian Institute for Health Information.
Dispensing costs in the NPDUIS public plans increased by 1.6% or $35.7 million in 2016/17, reaching a total of $2.2 billion. This growth rate was lower than the 3.8% reported in the 2015/16, representing the second year of declining growth after three years of strong rates ranging between 5.9% and 7.3%.
The overall rate of change in dispensing costs varied widely among individual plans (Figure 3.2), from a high of 8.4% in Prince Edward Island to a low of -3.8% in Newfoundland and Labrador. The high growth in Prince Edward Island was driven by a significant increase in the demographic effect following the introduction of the new drug program in 2015. In Newfoundland and Labrador the reduction in dispensing costs was due to a substantial negative volume effect.
Figure 3.2 Rates of change in dispensing costs, NPDUIS public drug plans, 2015/16 to 2016/17
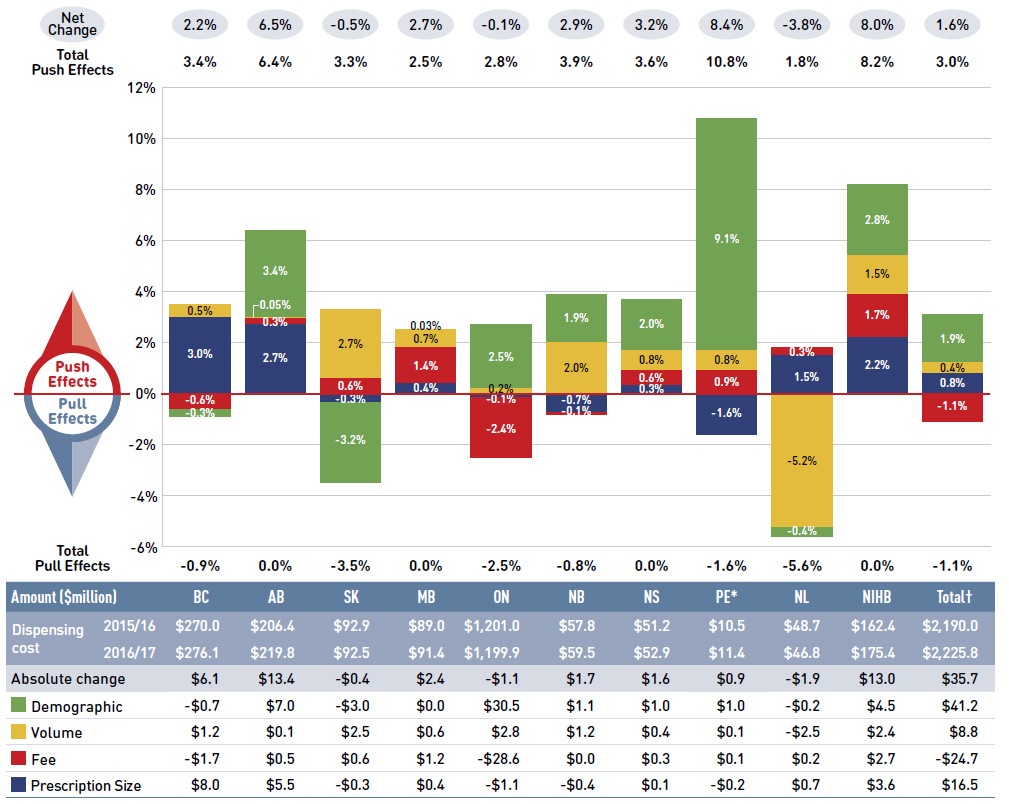
Figure description
This column graph and table describe the key factors or effects that impacted the rates of change in dispensing costs for each of the NPDUIS public drug plans from 2015/16 to 2016/17. Each column is broken out to give the positive or negative contribution of each effect: demographic; volume; fee; and prescription size. Separate rows above and below the bar graph show the total positive push effect, negative pull effect and net change for each year. Total results for all plans are also included.
blank
|
British Columbia |
Alberta |
Saskatchewan |
Manitoba |
Ontario |
New Brunswick |
Nova Scotia |
Prince Edward Island |
Newfoundland and Labrador |
Non-Insured Health Benefits |
Total results for the drug plans reported in this figure |
| Demographic |
-0.3% |
3.4% |
-3.2% |
0.0% |
2.5% |
1.9% |
2.0% |
9.1% |
-0.4% |
2.8% |
1.9% |
| Volume |
0.5% |
0.05% |
2.7% |
0.7% |
0.2% |
2.0% |
0.8% |
0.8% |
-5.2% |
1.5% |
0.4% |
| Fee |
-0.6% |
0.3% |
0.6% |
1.4% |
-2.4% |
-0.1% |
0.6% |
0.9% |
0.3% |
1.7% |
-1.1% |
| Prescription size |
3.0% |
2.7% |
-0.3% |
0.4% |
-0.1% |
-0.7% |
0.3% |
-1.6% |
1.5% |
2.2% |
0.8% |
| Total push effect |
3.4% |
6.4% |
3.3% |
2.5% |
2.8% |
3.9% |
3.6% |
10.8% |
1.8% |
8.2% |
3.0% |
| Total pull effect |
-0.9% |
0.0% |
-3.5% |
0.0% |
-2.5% |
-0.8% |
0.0% |
-1.6% |
-5.6% |
0.0% |
-1.1% |
| Net change |
2.2% |
6.5% |
-0.5% |
2.7% |
-0.1% |
2.9% |
3.2% |
8.4% |
-3.8% |
8.0% |
1.6% |
An accompanying table gives the corresponding changes in millions of dollars, as well as the total dispensing costs in 2015/16 and 2016/17 and the absolute change for each plan.
blank
|
British Columbia |
Alberta |
Saskatchewan |
Manitoba |
Ontario |
New Brunswick |
Nova Scotia |
Prince Edward Island |
Newfoundland and Labrador |
Non-Insured Health Benefits |
Total results for the drug plans reported in this figure |
| Dispensing cost 2015/16 |
$270.0 |
$206.4 |
$92.9 |
$89.0 |
$1,201.0 |
$57.8 |
$51.2 |
$10.5 |
$48.7 |
$162.4 |
$2,190.0 |
| Dispensing cost 2016/17 |
$276.1 |
$219.8 |
$92.5 |
$91.4 |
$1,199.9 |
$59.5 |
$52.9 |
$11.4 |
$46.8 |
$175.4 |
$2,225.8 |
| Absolute change |
$6.1 |
$13.4 |
-$0.4 |
$2.4 |
-$1.1 |
$1.7 |
$1.6 |
$0.9 |
-$1.9 |
$13.0 |
$35.7 |
| Demographic |
-$0.7 |
$7.0 |
-$3.0 |
$0.0 |
$30.5 |
$1.1 |
$1.0 |
$1.0 |
-$0.2 |
$4.5 |
$41.2 |
| Volume |
$1.2 |
$0.1 |
$2.5 |
$0.6 |
$2.8 |
$1.2 |
$0.4 |
$0.1 |
-$2.5 |
$2.4 |
$8.8 |
| Fee |
-$1.7 |
$0.5 |
$0.6 |
$1.2 |
-$28.6 |
$0.0 |
$0.3 |
$0.1 |
$0.2 |
$2.7 |
-$24.7 |
| Prescription size |
$8.0 |
$5.5 |
-$0.3 |
$0.4 |
-$1.1 |
-$0.4 |
$0.1 |
-$0.2 |
$0.7 |
$3.6 |
$16.5 |
Note: Values may not add to totals due to rounding and the cross effect. Yukon is not reported due to data limitations.
* In 2015, PEI introduced a new Generic Drug Program for residents under the age of 65 without insurance, limiting the out-of-pocket costs for eligible generic prescription drugs. This resulted in a large, continued increase in the beneficiary population.
† Total results for the drug plans reported in this figure.
Data source: National Prescription Drug Utilization Information System Database, Canadian Institute for Health Information.
In other jurisdictions the overall growth in dispensing costs was more moderate. In Ontario, the upward pressure from the demographic effect was balanced by a negative fee effect, reflecting the full impact of the decrease in dispensing fees for residents of long-term care facilities implemented in October 2015; this resulted in a net change of -0.1%.
The contribution of the fee effect, which reflects the average dispensing fee per prescription, is directly related to the individual reimbursement policy of each public drug plan.
In 2016/17, the average dispensing fee per prescription slightly increased for most NPDUIS drug plans, while Ontario had a relatively large drop of 2.4% due to the new policy. Over the past five years, Prince Edward Island, Saskatchewan, and Newfoundland and Labrador had the highest growth in fees with compound annual growth rates of 6.9%, 2.9% and 2.5%, respectively.
Table 3.1 reports the average dispensing fee per prescription from 2012/13 to 2016/17, along with the rate of growth between 2015/16 and 2016/17 and the compound annual growth rate for the entire period. The results are an average across all prescriptions and include a range of dispensing fees. An overview of the dispensing fee policies of the NPDUIS public drug plans is available in the Reference Documents section of the NPDUIS Analytical Studies page on the PMPRB website.
Table 3.1 Average dispensing fee per prescription, NPDUIS public drug plans, 2012/13 to 2016/17
| Jurisdiction |
2012/13 |
2013/14 |
2014/15 |
2015/16 |
2016/17 |
Growth rate, 2015/16 to 2016/17 |
CAGR*, 2012/13 to 2016/17 |
| British Columbia |
$7.55 |
$7.40 |
$7.35 |
$7.30 |
$7.26 |
-0.6% |
-1.0% |
| Alberta |
$13.43 |
$13.29 |
$14.13 |
$14.29 |
$14.33 |
0.3% |
1.6% |
| Saskatchewan |
$9.77 |
$10.30 |
$10.82 |
$10.91 |
$10.97 |
0.6% |
2.9% |
| Manitoba |
$8.90 |
$8.97 |
$9.19 |
$9.35 |
$9.48 |
1.4% |
1.6% |
| Ontario |
$7.43 |
$7.54 |
$7.83 |
$7.77 |
$7.59 |
-2.4% |
0.5% |
| New Brunswick |
$10.45 |
$10.36 |
$10.41 |
$10.54 |
$10.54 |
-0.1% |
0.2% |
| Nova Scotia |
$11.08 |
$11.49 |
$11.31 |
$11.19 |
$11.25 |
0.6% |
0.4% |
| Prince Edward Island |
$8.46 |
$10.31 |
$10.21 |
$10.93 |
$11.03 |
0.9% |
6.9% |
| Newfoundland and Labrador |
$11.20 |
$12.20 |
$12.19 |
$12.34 |
$12.39 |
0.3% |
2.5% |
| NIHB |
- |
- |
$8.57 |
$8.60 |
$8.74 |
1.7% |
1.0% |
Note: This analysis only includes data for beneficiaries that met their deductible and received public reimbursement.
Historical results reported reflect this new approach. Yukon is not reported due to data limitations.
*Compound annual growth rate.
Data source: National Prescription Drug Utilization Information System Database, Canadian Institute for Health Information.
The average dispensing fee per prescription is also related to prescription size: plans with lower average dispensing fees generally reimburse prescriptions with shorter days’
supply and vice versa. British Columbia, Manitoba, Ontario and the NIHB, which had some of the lowest dispensing fees in 2016/17, generally reimbursed prescriptions with relatively small average sizes. Decreases in the average days’ supply per prescription can exert an upward pressure on dispensing costs, as a greater number of prescriptions are required to dispense the same volume of drugs.
From 2012/13 to 2016/17, prescription sizes in all public drug plans either remained stable or slightly decreased, with the exception of Prince Edward Island. Since 2015/16, British Columbia and the NIHB had the largest proportional decreases in average prescription size at -3.9% and -3.0%, respectively.
Figure 3.3 depicts the trend in average days’ supply per prescription from 2012/13 to 2016/17. The results represent the average across all prescriptions for oral solid formulations and encompass brand-name and generic drugs for both acute and maintenance therapies.
Figure 3.3 Average days’ supply per prescription, NPDUIS public drug plans, 2012/13 to 2016/17
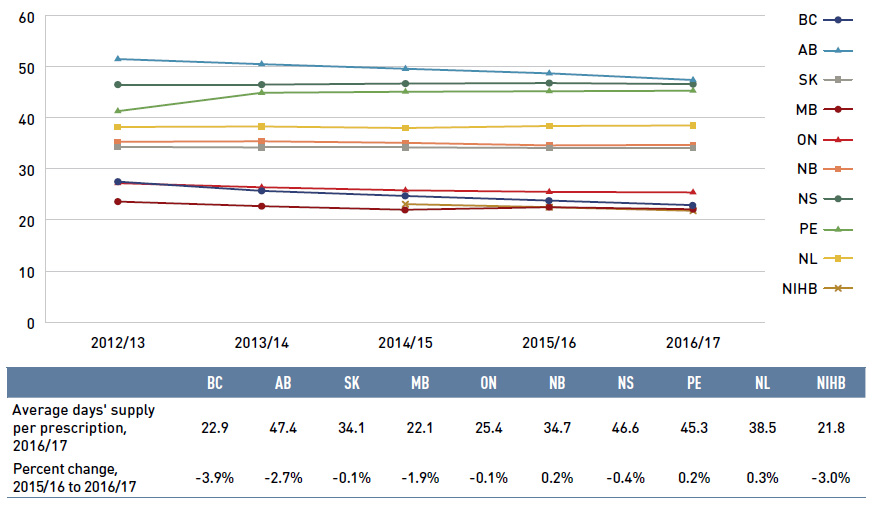
Figure description
This line graph shows the trend in average days’ supply per prescription from 2012/13 to 2016/17 for each NPDUIS public drug plan. A table below the graph shows the average days’ supply per prescription for 2016/17 and the percent change from 2015/16 to 2016/17.
blank
| |
2012/13 |
2013/14 |
2014/15 |
2015/16 |
2016/17 |
Percent change, 2015/16 to 2016/17 |
| British Columbia |
27.5 |
25.7 |
24.7 |
23.8 |
22.9 |
-3.9% |
| Alberta |
51.5 |
50.5 |
49.6 |
48.7 |
47.4 |
-2.7% |
| Saskatchewan |
34.5 |
34.4 |
34.3 |
34.1 |
34.1 |
-0.1% |
| Manitoba |
23.6 |
22.7 |
22.0 |
22.5 |
22.1 |
-1.9% |
| Ontario |
27.2 |
26.4 |
25.8 |
25.5 |
25.4 |
-0.1% |
| New Brunswick |
35.3 |
35.4 |
35.1 |
34.6 |
34.7 |
0.2% |
| Nova Scotia |
46.5 |
46.5 |
46.7 |
46.8 |
46.6 |
-0.4% |
| Prince Edward Island |
41.3 |
44.9 |
45.1 |
45.2 |
45.3 |
0.2% |
| Newfoundland and Labrador |
38.2 |
38.3 |
38 |
38.4 |
38.5 |
0.3% |
| Non-Insured Health Benefits |
-- |
-- |
23.1 |
22.5 |
21.8 |
-3.0% |
Note: This analysis only includes data for beneficiaries that met their deductible and received public reimbursement.
Historical results reported reflect this new approach. Yukon is not reported due to data limitations.
The analysis was limited to data for oral solid formulations.
Data source: National Prescription Drug Utilization Information System Database, Canadian Institute for Health Information.
Although the average days’ supply and dispensing fee per prescription are useful measures for comparison, the roster of drugs covered by each plan also factors into the
average dispensing cost. Comparing the dispensing costs for the same suite of drugs can provide greater insight into the differences between plans.
Figure 3.4 compares the dispensing costs across jurisdictions for the 18 generic drugs reduced to 18% of the equivalent brand-name products through the pCPA. Dispensing costs for one million tablets of each drug are given for two years: 2012/13 and 2016/17. These drugs collectively accounted for 18.4% and 20.3% of the total NPDUIS public drug plan dispensing costs in 2012/13 and 2016/17, respectively.
Dispensing costs between 2012/13 and 2016/17 increased in all provinces except Saskatchewan, Manitoba and Nova Scotia. The NIHB had the highest dispensing costs in 2016/17 at $235,000, taking over the top spot from Saskatchewan, which totaled $260,000 in 2012/13. The highest rates of increase were observed in Alberta and Ontario, while Saskatchewan and Manitoba had the largest decreases.
While the same drugs were studied across all plans, the disease profile of the beneficiary populations and the type of therapy for which the drugs were prescribed (acute or
maintenance) influenced the average days’ supply and, hence, the overall dispensing costs for each plan.
Figure 3.4 Dispensing costs ($thousand) for one million tablets of 18 common generic drugs*, NPDUIS public drug plans, 2012/13 and 2016/17
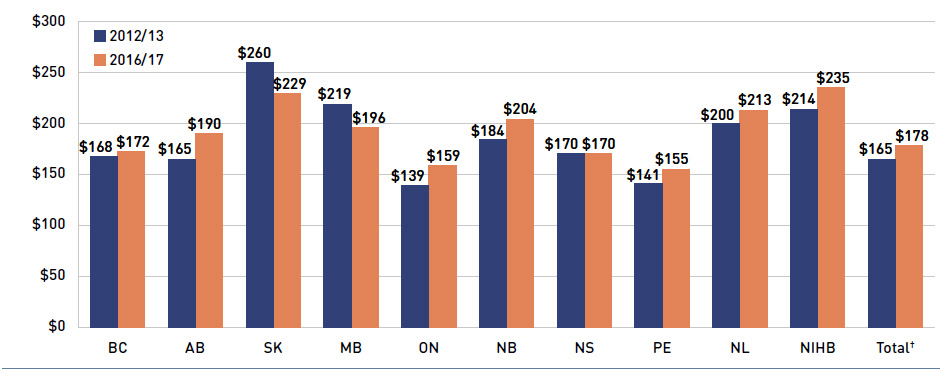
Figure description
This bar graph shows the dispensing cost in thousands of dollars for one million tablets of 18 common generic drugs in 2012/13 and 2016/17 for each NPDUIS public drug plan, as well as total results for all plans.
blank
| |
British Columbia |
Alberta |
Saskatchewan |
Manitoba |
Ontario |
New Brunswick |
Nova Scotia |
Prince Edward Island |
Newfoundland and Labrador |
Non-Insured Health Benefits |
Total results for the drug plans reported in this figure |
| 2012/13 |
$168 |
$165 |
$260 |
$219 |
$139 |
$184 |
$170 |
$141 |
$200 |
$214 |
$165 |
| 2016/17 |
$172 |
$190 |
$229 |
$196 |
$159 |
$204 |
$170 |
$155 |
$213 |
$235 |
$178 |
Note: Long-term care homes were excluded from this analysis, as they may not have a typical dispensing frequency due to the more specialized needs of their patients. The following sub-plans were not included in the analysis: BC: Permanent Residents of Licensed Residential Care Facilities; MB: Personal Home Care/Nursing Homes; NB: Individuals in Licensed Residential Facilities, Nursing Home Residents; ON: Long Term Care, Home Care and Homes for Special Care.
Yukon is not reported due to data limitations.
* Subject to the pCPA policies that reduced the prices of these drugs to 18% of their equivalent brand-name products: atorvastatin, ramipril, venlafaxine, amlodipine, omeprazole, rabeprazole, rosuvastatin, pantoprazole, citalopram, simvastatin, clopidogrel, gabapentin, metformin, olanzapine, donepezil, ezetimibe, quetiapine and zopiclone.
† Total results for the drug plans captured in this figure.
Data source: National Prescription Drug Utilization Information System Database, Canadian Institute for Health Information.
Appendix A: Drug Reviews and Approvals
In Canada, Health Canada, the Patented Medicine Prices Review Board (PMPRB), and the Canadian Agency for Drugs and Technologies in Health (CADTH) are responsible for drug approvals, price reviews, and health technology assessments, respectively. This appendix provides an overview of recent trends in drug reviews and approvalsFootnote VII.
Health Canada
Health Canada grants the authority to market a drug in Canada by issuing a Notice of Compliance (NOC) once it has met the regulatory requirements for safety, efficacy and quality. In 2016, Health Canada issued NOCs for 38 new active substances: 11 biologics and 27 small molecule pharmaceuticals. There was a notable increase in the number of biologics, from 3 and 5 in 2014 and 2015, respectively, to 11 in 2016 (Figure A1)Footnote VIII.
Figure A1 New active substances approved by Health Canada, 2012 to 2016
Figure description
This stacked column graph shows the number of new active substances approved by Health Canada from 2012 to 2016. The number of prescription pharmaceuticals and biologics are given for each year.
blank
| Year |
Prescription pharmaceutical |
Biologic |
Total |
| 2012 |
21 |
2 |
23 |
| 2013 |
36 |
4 |
40 |
| 2014 |
22 |
3 |
25 |
| 2015 |
32 |
5 |
37 |
| 2016 |
27 |
11 |
38 |
Note: “Prescription pharmaceutical” and “biologic” are terms used to define product types when submitting a Notice of Compliance (NOC) to Health Canada.
Data source: Notice of Compliance Database, Health Canada.
Patented Medicine Prices Review Board
The PMPRB reviews the factory-gate prices of patented medicines sold in Canada and ensures that they are not excessive. As part of the price review process, the PMPRB’s Human Drug Advisory Panel (HDAP) evaluates each new medicine and assigns a recommended level of therapeutic improvement.
The PMPRB completed scientific reviews for 124 of the 163 medicines approved by Heath Canada between 2012 and 2016. Over this five-year period, only 14% were classified in the Substantial Improvement or Breakthrough categories. Of the rest, 65% demonstrated Slight or No Improvement over existing therapies, while 21% were classified in the Moderate Improvement category (Figure A2).
Figure A2 New medicines reviewed by the Patented Medicine Prices Review Board by level of therapeutic improvement, 2012 to 2016*
Figure description
This stacked column graph gives the levels of therapeutic improvement of new medicines reviewed by the Patented Medicine Prices Review Board from 2012 to 2016.
blank
| Year |
Breakthrough |
Substantial Improvement |
Moderate Improvement |
Slight or No Improvement |
Other |
Total |
| 2012 |
1 |
4 |
7 |
8 |
3 |
23 |
| 2013 |
4 |
2 |
7 |
25 |
2 |
40 |
| 2014 |
0 |
3 |
2 |
15 |
5 |
25 |
| 2015 |
1 |
1 |
5 |
19 |
11 |
37 |
| 2016 |
1 |
0 |
5 |
14 |
18 |
38 |
Note: Medicines reviewed by the PMPRB prior to the implementation of the 2010 Guidelines have been merged as follows: category 2 medicines are included in the Breakthrough category; category 1 medicines are included in the Slight/No Improvement category; and category 3 medicines are included in the Moderate Improvement category.
* The year of reporting reflects the year in which the Notice of Compliance was issued (Figure A1) rather than the year that the PMPRB conducted its price review.
† New medicines not reported to the PMPRB as of the 2016 Annual Report.
Data source: Notice of Compliance Database, Health Canada; Patented Medicine Prices Review Board (PMPRB).
Canadian Agency for Drugs and Technologies in Health
CADTH’s Common Drug Review (CDR) provides reimbursement recommendations and advice to Canada’s publicly funded drug plans (except for Quebec) based on an evaluation of the clinical, economic and patient evidence of drugs marketed in Canada. The jurisdictions take these recommendations under advisement when making formulary listing decisions
and in price negotiations.
Figure A3 summarizes the CDR recommendations for fiscal years 2012/13 to 2016/17Footnote IX. The total number of CDR recommendations increased from 33 in 2012/13 to 51 in 2016/17. In 2012/13 the number of “reimburse with clinical criteria and/or conditions” and “do not reimburse” recommendations were fairly balanced (18 and 13), but by 2016/17 the proportion had changed, with 45 of the recommendations being “reimburse with clinical criteria and/or conditions” and 5 being “do not reimburse”.
As of April 1, 2016, CADTH no longer accepted confidential drug prices, as the submitted prices are disclosed in the recommendations and reports.
Figure A3 Common Drug Review reimbursement recommendations, 2012/13 to 2016/17
Figure description
The column graph shows the total number of Common Drug Review reimbursement recommendations from 2012/13 to 2016/17 broken out by recommendation.
blank
| Year |
Reimburse |
Reimburse with clinical criteria and/or conditions |
Do not reimburse |
Total |
| 2012/13 |
2 |
18 |
13 |
33 |
| 2013/14 |
0 |
26 |
8 |
34 |
| 2014/15 |
1 |
27 |
10 |
38 |
| 2015/16 |
2 |
41 |
7 |
50 |
| 2016/17 |
1 |
45 |
5 |
51 |
Note: Drugs may have multiple recommendations if they are reviewed for more than one indication.
CADTH currently uses three possible recommendation categories to guide the reimbursement decisions of participating jurisdictions. For this analysis, “Reimburse with clinical criteria and/or conditions” includes recommendations completed prior to May 2016 for “List with clinical criteria and/or conditions”, “List in a similar manner to other drugs in class” and
“Do not list at submitted price”. “Reimburse” is equivalent to the previous “List” category, and likewise, “Do not reimburse” corresponds to “Do not list”.
Data source: CADTH Common Drug Review Reports.
Appendix B: Top 50 Patented Medicines by Drug Cost, NPDUIS Public Drug Plans, 2016/17 ($million)
| Rank |
Trade name (Ingredient) |
Manufacturer |
Total |
BC |
AB |
SK |
MB |
ON |
NB |
NS |
PE |
NL |
YT |
NIHB |
| 1 |
Remicade (infliximab) |
Janssen Inc. |
$396.25 |
$97.28 |
$74.79 |
$34.72 |
$37.14 |
$118.49 |
$8.90 |
$10.20 |
$2.09 |
$4.87 |
$0.52 |
$7.26 |
| 2 |
Harvoni (sofosbuvir, ledipasvir) |
Gilead Sciences Canada Inc. |
$296.06 |
$79.27 |
$18.38 |
$8.31 |
$9.07 |
$149.11 |
$3.48 |
$3.49 |
– |
$2.55 |
$0.95 |
$21.46 |
| 3 |
Humira (adalimumab) |
AbbVie Corporation |
$264.03 |
$76.14 |
$39.80 |
$20.55 |
$22.91 |
$73.93 |
$5.74 |
$8.94 |
$2.41 |
$4.69 |
$0.57 |
$8.34 |
| 4 |
Lucentis (ranibizumab) |
Novartis Pharmaceuticals Canada Inc. |
$230.18 |
– |
$11.13 |
$2.30 |
– |
$207.42 |
$4.07 |
– |
$0.19 |
$2.41 |
$0.02 |
$2.64 |
| 5 |
Eylea (aflibercept) |
Bayer Inc. |
$188.33 |
– |
– |
$3.16 |
– |
$180.66 |
$3.12 |
– |
$0.41 |
$0.30 |
$0.05 |
$0.63 |
| 6 |
Enbrel (etanercept) |
Immunex Corporation |
$159.56 |
$33.62 |
$20.98 |
$9.75 |
$15.39 |
$60.03 |
$3.36 |
$5.01 |
$0.80 |
$1.19 |
$0.39 |
$9.03 |
| 7 |
Advair (salmeterol, fluticasone propionate) |
GlaxoSmithKline Inc. |
$142.60 |
$15.28 |
$18.53 |
$4.80 |
$6.45 |
$82.68 |
$4.39 |
$3.25 |
$0.30 |
$1.70 |
$0.20 |
$5.04 |
| 8 |
Lantus (insulin glargine) |
Sanofi-aventis Canada Inc. |
$137.47 |
$16.01 |
$14.06 |
$9.05 |
$2.26 |
$78.20 |
$2.02 |
$1.90 |
$0.23 |
$0.18 |
$0.07 |
$13.49 |
| 9 |
Revlimid (lenalidomide) |
Celgene Inc. |
$123.58 |
<$0.01 |
<$0.01 |
<$0.01 |
$8.18 |
$98.96 |
$4.95 |
$5.33 |
$0.85 |
$3.85 |
$0.06 |
$1.41 |
| 10 |
Coversyl (perindopril erbumine) |
Servier Canada Inc. |
$104.69 |
$2.98 |
$12.11 |
$4.57 |
$1.80 |
$70.27 |
$3.70 |
$3.32 |
$0.47 |
$1.57 |
$0.03 |
$3.88 |
| 11 |
Janumet (sitagliptin, metformin hydrochloride) |
Merck Canada Inc. |
$100.45 |
$0.01 |
$3.97 |
$1.09 |
$0.09 |
$90.27 |
$1.12 |
$0.27 |
<$0.01 |
$0.01 |
<$0.01 |
$3.63 |
| 12 |
Januvia (sitagliptin) |
Merck Canada Inc. |
$96.86 |
$0.01 |
$4.53 |
$2.14 |
$1.01 |
$80.58 |
$1.50 |
$0.85 |
$0.02 |
$0.13 |
$0.01 |
$6.09 |
| 13 |
Xarelto (rivaroxaban) |
Bayer Inc. |
$86.83 |
$7.90 |
$10.74 |
$3.51 |
$2.16 |
$57.42 |
$1.98 |
$1.29 |
$0.16 |
$0.33 |
<$0.01 |
$1.35 |
| 14 |
Sovaldi (sofosbuvir) |
Gilead Sciences Canada Inc. |
$85.26 |
$19.36 |
$3.51 |
$2.52 |
$3.67 |
$43.79 |
$1.26 |
$0.65 |
– |
$0.56 |
– |
$9.92 |
| 15 |
Eliquis (apixaban) |
Bristol-Myers Squibb Canada |
$82.18 |
$5.14 |
$6.56 |
$2.10 |
$1.58 |
$65.10 |
$0.48 |
$0.50 |
$0.08 |
$0.05 |
$0.01 |
$0.57 |
| 16 |
Invega Sustenna (paliperidone) |
Janssen Inc. |
$76.22 |
$19.04 |
$1.03 |
$2.65 |
$1.49 |
$42.47 |
$2.53 |
$0.39 |
$0.07 |
$0.48 |
$0.03 |
$6.02 |
| 17 |
Symbicort (formoterol fumarate dihydrate, budesonide) |
AstraZeneca Canada Inc. |
$74.39 |
$6.72 |
$11.95 |
$2.67 |
$2.22 |
$45.35 |
$1.16 |
$1.84 |
$0.17 |
$0.62 |
$0.06 |
$1.63 |
| 18 |
Spiriva (tiotropium) |
Boehringer Ingelheim |
$74.11 |
$4.37 |
$9.77 |
$2.84 |
$1.26 |
$50.02 |
$1.75 |
$1.79 |
$0.21 |
$0.50 |
$0.08 |
$1.52 |
| 19 |
Abilify (aripiprazole) |
Otsuka Pharmaceutical Co. Ltd |
$60.97 |
$9.80 |
$1.19 |
$1.03 |
$2.76 |
$43.37 |
$0.71 |
$0.27 |
$0.05 |
$0.07 |
<$0.01 |
$1.72 |
| 20 |
Stelara (ustekinumab) |
Janssen Inc. |
$50.27 |
$7.54 |
$9.44 |
$3.09 |
$3.26 |
$20.25 |
$2.17 |
$1.69 |
$0.22 |
$1.55 |
$0.07 |
$1.00 |
| 21 |
Prolia (denosumab) |
Amgen Canada Inc. |
$49.23 |
$0.75 |
$0.86 |
$0.34 |
$0.27 |
$46.61 |
$0.10 |
$0.15 |
<$0.01 |
<$0.01 |
$0.01 |
$0.13 |
| 22 |
Flovent HFA (fluticasone propionate) |
GlaxoSmithKline Inc. |
$47.89 |
$5.67 |
$1.41 |
$2.45 |
$1.20 |
$23.59 |
$2.16 |
$1.66 |
$0.35 |
$2.11 |
$0.09 |
$7.20 |
| 23 |
Simponi (golimumab) |
Janssen Inc. |
$46.67 |
$8.92 |
$6.32 |
$4.13 |
$2.42 |
$16.92 |
$1.52 |
$1.65 |
$0.31 |
$1.55 |
$0.01 |
$2.90 |
| 24 |
Neupogen (filgrastim) |
Amgen Canada Inc. |
$42.45 |
$6.95 |
$1.47 |
$0.17 |
$0.01 |
$31.10 |
$0.82 |
<$0.01 |
$0.10 |
$1.00 |
$0.06 |
$0.77 |
| 25 |
Pradaxa (dabigatran etexilate) |
Boehringer Ingelheim |
$42.36 |
$2.80 |
$4.75 |
$1.10 |
$0.95 |
$30.77 |
$0.83 |
$0.70 |
$0.07 |
$0.09 |
– |
$0.32 |
| 26 |
Viread (tenofovir disoproxil fumarate) |
Gilead Sciences Canada Inc. |
$39.32 |
$8.32 |
$4.00 |
$0.38 |
$1.38 |
$24.90 |
$0.08 |
$0.11 |
– |
$0.01 |
$0.04 |
$0.11 |
| 27 |
Tecfidera (dimethyl fumarate) |
Biogen Canada Inc. |
$39.24 |
$8.81 |
$7.86 |
$5.78 |
$2.18 |
$8.61 |
$2.61 |
$1.34 |
$0.09 |
$1.29 |
$0.18 |
$0.50 |
| 28 |
Imbruvica (ibrutinib) |
Janssen Inc. |
$38.70 |
– |
– |
– |
$3.56 |
$31.90 |
$1.86 |
$0.57 |
– |
$0.68 |
– |
$0.13 |
| 29 |
Holkira Pak (dasabuvir, paritaprevir, ritonavir) |
AbbVie Corporation |
$38.60 |
$18.02 |
$2.59 |
$1.06 |
$1.23 |
$12.18 |
$0.44 |
$0.25 |
– |
$0.17 |
– |
$2.66 |
| 30 |
Zytiga (abiraterone acetate) |
Janssen Inc. |
$38.14 |
– |
– |
– |
$2.44 |
$33.18 |
$1.02 |
$0.59 |
$0.19 |
$0.55 |
– |
$0.15 |
| 31 |
Soliris (eculizumab) |
Alexion Pharma GmbH |
$37.58 |
– |
$4.85 |
– |
$0.87 |
$31.16 |
$0.19 |
– |
– |
|
– |
$0.52 |
| 32 |
Invokana (canagliflozin) |
Janssen Inc. |
$37.00 |
– |
$1.79 |
$0.76 |
$0.38 |
$31.42 |
$0.31 |
$0.01 |
<$0.01 |
$0.01 |
– |
$2.34 |
| 33 |
Trajenta (linagliptin) |
Boehringer Ingelheim |
$36.49 |
$4.58 |
$1.85 |
$0.80 |
$0.45 |
$27.24 |
$0.50 |
$0.03 |
$0.01 |
$0.02 |
<$0.01 |
$1.00 |
| 34 |
Copaxone (glatiramer acetate) |
Teva Canada Ltd |
$35.28 |
$6.00 |
$10.85 |
$3.70 |
$3.87 |
$8.66 |
$0.66 |
– |
$0.21 |
$0.59 |
$0.11 |
$0.62 |
| 35 |
Novorapid (insulin aspart) |
Novo Nordisk Canada Inc. |
$34.05 |
$3.16 |
$3.07 |
$0.97 |
$1.25 |
$20.82 |
$0.55 |
$1.07 |
$0.45 |
$0.27 |
$0.04 |
$2.40 |
| 36 |
Botox (onabotulinumtoxina) |
Allergan Inc. |
$33.78 |
$4.99 |
$4.27 |
$0.81 |
$1.04 |
$20.51 |
$0.37 |
$0.78 |
– |
– |
$0.06 |
$0.95 |
| 37 |
Orencia (abatacept) |
Bristol-Myers Squibb Canada |
$33.41 |
$10.02 |
$4.91 |
$1.65 |
$1.20 |
$11.79 |
$0.40 |
$1.14 |
$0.14 |
$0.12 |
$0.13 |
$1.89 |
| 38 |
Triumeq (abacavir, lamivudine, dolutegravir) |
ViiV Healthcare ULC |
$33.18 |
– |
– |
$1.21 |
$1.10 |
$28.81 |
$0.68 |
– |
– |
$0.33 |
$0.04 |
$1.00 |
| 39 |
Actonel DR (risedronate sodium) |
Allergan Pharma Co. |
$32.69 |
– |
– |
$0.17 |
– |
$32.52 |
– |
– |
– |
– |
– |
– |
| 40 |
Truvada (tenofovir disoproxil fumarate, emtricitabine) |
Gilead Sciences Canada Inc. |
$31.79 |
– |
– |
$1.49 |
$2.11 |
$21.63 |
$0.68 |
– |
– |
$0.28 |
$0.07 |
$5.53 |
| 41 |
Cymbalta (duloxetine) |
Eli Lilly Canada Inc. |
$31.57 |
$0.32 |
$3.62 |
$1.22 |
$0.69 |
$23.83 |
$0.06 |
$0.07 |
<$0.01 |
$0.01 |
$0.01 |
$1.73 |
| 42 |
Lumigan RC (bimatoprost) |
Allergan Inc. |
$30.56 |
$2.90 |
$2.50 |
$0.84 |
$0.78 |
$21.24 |
$0.45 |
$0.78 |
$0.18 |
$0.34 |
$0.01 |
$0.54 |
| 43 |
Risperdal Consta (risperidone) |
Janssen Inc. |
$29.54 |
$4.20 |
$0.48 |
$1.59 |
$1.51 |
$16.69 |
$1.19 |
$0.30 |
$0.26 |
$0.25 |
$0.03 |
$3.03 |
| 44 |
Oxyneo (oxycodone hydrochloride) |
Purdue Pharma |
$28.96 |
$0.98 |
$7.47 |
$0.97 |
$2.32 |
$15.45 |
$0.62 |
$0.19 |
$0.03 |
$0.19 |
– |
$0.74 |
| 45 |
Lupron Depot (leuprolide acetate) |
AbbVie Corporation |
$26.89 |
$0.87 |
$0.13 |
$0.22 |
$0.19 |
$22.29 |
$0.85 |
$0.78 |
$0.12 |
$0.69 |
– |
$0.75 |
| 46 |
Gilenya (fingolimod) |
Novartis Pharmaceuticals Canada Inc. |
$26.33 |
$8.14 |
$9.93 |
$0.51 |
$1.03 |
$4.11 |
$0.90 |
$0.76 |
$0.34 |
$0.14 |
$0.05 |
$0.41 |
| 47 |
Rituxan (rituximab) |
Hoffmann-La Roche Ltd |
$24.40 |
$8.17 |
$2.97 |
$1.33 |
$2.00 |
$5.74 |
$0.22 |
$0.90 |
$0.04 |
$0.18 |
$0.06 |
$2.79 |
| 48 |
Jakavi (ruxolitinib) |
Novartis Pharmaceuticals Canada Inc. |
$24.33 |
– |
– |
– |
$1.30 |
$21.05 |
$1.04 |
$0.78 |
– |
$0.09 |
– |
$0.07 |
| 49 |
Stribild (tenofovir disoproxil fumarate, emtricitabine, cobicistat, elvitegravir) |
Gilead Sciences Canada Inc. |
$23.11 |
– |
– |
$0.93 |
$1.34 |
$17.73 |
$0.61 |
– |
– |
$0.07 |
$0.03 |
$2.40 |
| 50 |
Tiazac XC (diltiazem hydrochloride) |
Valeant Canada LP/Valeant Canada S.E.C. |
$23.09 |
$1.36 |
$3.24 |
$0.50 |
$0.53 |
$15.29 |
$0.70 |
$0.57 |
$0.10 |
$0.44 |
– |
$0.37 |
| |
|
Total |
$3,866.92 |
$516.41 |
$363.65 |
$155.93 |
$162.31 |
$2,316.11 |
$80.80 |
$66.16 |
$11.71 |
$39.08 |
$4.14 |
$150.58 |
| |
|
Share of all patented medicines |
76% |
81% |
83% |
75% |
76% |
74% |
73% |
76% |
74% |
75% |
71% |
72% |
Data source: National Prescription Drug Utilization Information System Database, Canadian Institute for Health Information.
Appendix C: Top 50 Multi-Source Generic Drugs by Drug Cost, NPDUIS Public Drug Plans, 2016/17 ($million)
| Rank |
Ingredient |
Total |
BC |
AB |
SK |
MB |
ON |
NB |
NS |
PE |
NL |
YT |
NIHB |
| 1 |
Atorvastatin |
$106.48 |
$11.12 |
$11.78 |
$3.77 |
$2.41 |
$65.79 |
$2.23 |
$2.80 |
$0.58 |
$1.47 |
$0.16 |
$4.37 |
| 2 |
Rosuvastatin |
$71.66 |
$5.32 |
$7.74 |
$2.96 |
$1.03 |
$45.31 |
$2.05 |
$2.60 |
$0.54 |
$1.73 |
$0.04 |
$2.34 |
| 3 |
Pantoprazole |
$64.20 |
$3.15 |
$9.78 |
$2.63 |
$0.78 |
$40.45 |
$2.34 |
$1.22 |
$0.24 |
$0.36 |
$0.04 |
$3.20 |
| 4 |
Amlodipine |
$60.14 |
$5.82 |
$6.74 |
$2.34 |
$1.23 |
$38.48 |
$1.07 |
$1.57 |
$0.42 |
$0.37 |
$0.08 |
$2.04 |
| 5 |
Gabapentin |
$40.51 |
$8.74 |
$4.42 |
$1.86 |
$2.01 |
$15.00 |
$1.33 |
$0.87 |
$0.26 |
$0.13 |
$0.05 |
$5.85 |
| 6 |
Ramipril |
$35.75 |
$6.51 |
$3.44 |
$1.51 |
$0.75 |
$18.49 |
$0.78 |
$0.81 |
$0.26 |
$0.68 |
$0.10 |
$2.43 |
| 7 |
Metformin hydrochloride |
$29.14 |
$3.59 |
$3.27 |
$1.55 |
$0.81 |
$15.14 |
$0.67 |
$0.88 |
$0.26 |
$0.57 |
$0.05 |
$2.37 |
| 8 |
Olanzapine |
$28.98 |
$5.03 |
$0.92 |
$0.68 |
$1.38 |
$16.85 |
$1.29 |
$0.44 |
$0.18 |
$0.46 |
$0.02 |
$1.74 |
| 9 |
Rabeprazole sodium |
$28.64 |
$3.00 |
$0.69 |
$1.77 |
$0.75 |
$16.57 |
$0.30 |
$2.04 |
$0.12 |
$1.45 |
$0.01 |
$1.96 |
| 10 |
Pregabalin |
$28.39 |
$0.21 |
– |
$1.42 |
$0.01 |
$24.79 |
$0.29 |
$0.42 |
$0.03 |
$0.09 |
$0.07 |
$1.06 |
| 11 |
Quetiapine |
$25.82 |
$3.21 |
$0.96 |
$0.90 |
$1.18 |
$15.66 |
$1.26 |
$0.43 |
$0.09 |
$0.63 |
$0.01 |
$1.48 |
| 12 |
Clopidogrel |
$25.06 |
$2.12 |
$1.97 |
$0.89 |
$0.94 |
$16.49 |
$0.65 |
$0.79 |
$0.09 |
$0.37 |
$0.02 |
$0.74 |
| 13 |
Venlafaxine |
$24.94 |
$4.67 |
$2.22 |
$1.38 |
$1.08 |
$11.28 |
$1.00 |
$0.74 |
$0.16 |
$0.76 |
$0.02 |
$1.63 |
| 14 |
Omeprazole |
$24.33 |
$0.56 |
$3.35 |
$1.15 |
$2.02 |
$10.11 |
$1.24 |
$1.75 |
$0.31 |
$1.05 |
$0.12 |
$2.68 |
| 15 |
Fentanyl |
$23.94 |
$2.32 |
$1.50 |
$1.46 |
$1.16 |
$16.27 |
$0.31 |
$0.41 |
$0.04 |
$0.06 |
$0.05 |
$0.36 |
| 16 |
Escitalopram |
$23.27 |
$3.68 |
$1.95 |
$0.28 |
$0.13 |
$15.78 |
$0.07 |
$0.10 |
– |
$0.05 |
$0.01 |
$1.20 |
| 17 |
Lansoprazole |
$21.17 |
$0.45 |
$4.28 |
$0.39 |
$0.08 |
$15.08 |
$0.17 |
$0.07 |
<$0.01 |
$0.01 |
$0.01 |
$0.64 |
| 18 |
Sertraline |
$20.11 |
$3.30 |
$1.29 |
$1.06 |
$0.78 |
$10.18 |
$0.76 |
$0.67 |
$0.13 |
$0.59 |
$0.02 |
$1.32 |
| 19 |
Levodopa, carbidopa |
$19.89 |
$2.64 |
$2.03 |
$0.82 |
$0.73 |
$11.95 |
$0.44 |
$0.49 |
$0.11 |
$0.25 |
$0.02 |
$0.40 |
| 20 |
Duloxetine |
$19.43 |
$0.28 |
$1.83 |
$0.84 |
$0.37 |
$15.15 |
$0.07 |
$0.07 |
<$0.01 |
$0.01 |
$0.01 |
$0.79 |
| 21 |
Simvastatin |
$19.13 |
$2.17 |
$2.20 |
$1.00 |
$0.41 |
$10.79 |
$0.55 |
$0.81 |
$0.15 |
$0.50 |
$0.03 |
$0.52 |
| 22 |
Nifedipine |
$18.66 |
$1.13 |
$1.86 |
$0.60 |
$0.71 |
$10.67 |
$1.13 |
$0.72 |
$0.13 |
$0.66 |
$0.02 |
$1.03 |
| 23 |
Metoprolol tartrate |
$17.58 |
$2.19 |
$2.50 |
$1.23 |
$0.82 |
$7.35 |
$0.61 |
$1.09 |
$0.18 |
$0.83 |
$0.02 |
$0.76 |
| 24 |
Diltiazem hydrochloride |
$17.29 |
$2.50 |
$1.46 |
$0.70 |
$0.55 |
$10.02 |
$0.67 |
$0.55 |
$0.14 |
$0.21 |
$0.02 |
$0.46 |
| 25 |
Gliclazide |
$16.94 |
$0.61 |
$1.24 |
$0.70 |
$0.72 |
$10.30 |
$0.42 |
$0.77 |
$0.19 |
$0.43 |
$0.02 |
$1.53 |
| 26 |
Donepezil hydrochloride |
$16.63 |
$1.48 |
$1.08 |
$0.13 |
$0.24 |
$12.70 |
$0.32 |
$0.36 |
$0.07 |
$0.16 |
$0.01 |
$0.07 |
| 27 |
Acetaminophen, oxycodone hydrochloride |
$16.39 |
$0.86 |
$0.73 |
– |
$0.51 |
$12.44 |
$0.19 |
$0.11 |
$0.08 |
$0.41 |
<$0.01 |
$1.07 |
| 28 |
Ranitidine |
$16.39 |
$2.54 |
$0.63 |
$1.07 |
$0.51 |
$7.63 |
$0.50 |
$0.95 |
$0.17 |
$0.92 |
$0.01 |
$1.46 |
| 29 |
Clozapine |
$16.20 |
$8.55 |
$0.43 |
$1.62 |
$2.46 |
– |
$0.89 |
<$0.01 |
$0.03 |
$0.51 |
$0.01 |
$1.70 |
| 30 |
Risperidone |
$16.08 |
$2.90 |
$0.46 |
$1.02 |
$0.94 |
$8.07 |
$0.80 |
$0.31 |
$0.12 |
$0.45 |
$0.01 |
$1.01 |
| 31 |
Salbutamol |
$15.69 |
$2.41 |
$0.63 |
$0.78 |
$0.61 |
$7.88 |
$0.62 |
$0.55 |
$0.12 |
$0.41 |
$0.03 |
$1.65 |
| 32 |
Citalopram |
$15.64 |
$2.47 |
$1.39 |
$0.98 |
$0.70 |
$6.87 |
$0.81 |
$0.77 |
$0.19 |
$0.35 |
$0.02 |
$1.09 |
| 33 |
Hydromorphone hydrochloride |
$15.49 |
$3.26 |
$0.98 |
$1.09 |
$0.57 |
$7.84 |
$0.34 |
$0.49 |
$0.10 |
$0.23 |
$0.01 |
$0.58 |
| 34 |
Ezetimibe |
$15.37 |
$0.01 |
$1.00 |
$0.75 |
$0.12 |
$12.21 |
$0.35 |
$0.34 |
$0.03 |
$0.19 |
<$0.01 |
$0.36 |
| 35 |
Risedronate sodium |
$14.91 |
$0.21 |
$1.61 |
$0.36 |
$0.10 |
$11.56 |
$0.24 |
$0.50 |
$0.03 |
$0.09 |
<$0.01 |
$0.19 |
| 36 |
Nabilone |
$14.82 |
$2.59 |
$0.89 |
$0.02 |
$1.26 |
$9.25 |
$0.35 |
$0.19 |
<$0.01 |
$0.12 |
$0.01 |
$0.15 |
| 37 |
Candesartan cilexetil |
$14.60 |
$1.51 |
$1.56 |
$0.66 |
$0.18 |
$9.07 |
$0.32 |
$0.41 |
$0.07 |
$0.41 |
$0.01 |
$0.39 |
| 38 |
Valsartan |
$14.26 |
$1.19 |
$2.45 |
$0.80 |
$0.26 |
$8.52 |
$0.10 |
$0.37 |
$0.08 |
$0.10 |
$0.01 |
$0.38 |
| 39 |
Fluoxetine |
$13.78 |
$2.68 |
$1.20 |
$0.98 |
$0.79 |
$5.68 |
$0.43 |
$0.32 |
$0.11 |
$0.36 |
$0.01 |
$1.20 |
| 40 |
Paroxetine |
$13.52 |
$1.91 |
$1.02 |
$0.82 |
$0.60 |
$6.34 |
$0.56 |
$0.51 |
$0.10 |
$0.64 |
$0.02 |
$1.00 |
| 41 |
Tamsulosin hydrochloride |
$13.34 |
$1.45 |
$2.54 |
$0.77 |
$0.31 |
$6.84 |
$0.49 |
$0.24 |
$0.09 |
$0.25 |
$0.03 |
$0.32 |
| 42 |
Bupropion hydrochloride |
$13.30 |
$2.60 |
$1.18 |
$0.64 |
$0.61 |
$6.73 |
$0.31 |
$0.25 |
$0.03 |
$0.19 |
$0.02 |
$0.75 |
| 43 |
Nitroglycerin |
$13.01 |
$1.77 |
$1.50 |
$0.62 |
$0.43 |
$6.69 |
$0.47 |
$0.68 |
$0.12 |
$0.33 |
$0.04 |
$0.35 |
| 44 |
Valproic acid |
$12.84 |
$2.87 |
$0.45 |
$0.67 |
$0.76 |
$6.21 |
$0.50 |
$0.19 |
$0.09 |
$0.35 |
$0.01 |
$0.74 |
| 45 |
Ondansetron |
$12.52 |
$1.49 |
$2.67 |
$0.07 |
$1.18 |
$5.24 |
$0.16 |
$0.22 |
<$0.01 |
$0.03 |
$0.01 |
$1.46 |
| 46 |
Cephalexin |
$12.21 |
$1.47 |
$0.87 |
$1.10 |
$0.38 |
$5.38 |
$0.19 |
$0.27 |
$0.06 |
$0.25 |
$0.01 |
$2.24 |
| 47 |
Amoxicillin |
$12.16 |
$1.32 |
$0.81 |
$1.02 |
$0.33 |
$5.88 |
$0.19 |
$0.19 |
$0.08 |
$0.33 |
$0.01 |
$1.99 |
| 48 |
Irbesartan |
$11.92 |
$0.58 |
$1.91 |
$0.45 |
$0.36 |
$7.55 |
$0.18 |
$0.30 |
$0.06 |
$0.11 |
<$0.01 |
$0.39 |
| 49 |
Methotrexate |
$11.58 |
$1.70 |
$1.77 |
$0.49 |
$0.37 |
$5.47 |
$0.29 |
$0.35 |
$0.06 |
$0.17 |
$0.01 |
$0.89 |
| 50 |
Morphine sulfate |
$10.95 |
$0.62 |
$0.89 |
$0.46 |
$0.79 |
$6.21 |
$0.33 |
$0.29 |
$0.07 |
$0.46 |
$0.01 |
$0.82 |
| |
Total |
$1,165.04 |
$134.74 |
$110.06 |
$51.28 |
$38.25 |
$672.21 |
$31.60 |
$32.27 |
$6.60 |
$21.56 |
$1.34 |
$65.14 |
| |
Share of All Multi-Source Generic Drugs |
63% |
62% |
60% |
60% |
53% |
66% |
61% |
61% |
63% |
59% |
55% |
57% |
Data source: National Prescription Drug Utilization Information System Database, Canadian Institute for Health Information.
Appendix D: Top 50 Single-Source Non-Patented Medicines by Drug Cost, NPDUIS Public Drug Plans, 2016/17 ($thousand)
| Rank |
Trade name (ingredient) |
Manufacturer |
Total |
BC |
AB |
SK |
MB |
ON |
NB |
NS |
PE |
NL |
YT |
NIHB |
| 1 |
Fragmin anti-factor Xa (dalteparin sodium) |
Pfizer Canada Inc. |
$39,026 |
$9,585 |
$3,350 |
$861 |
$3,109 |
$19,009 |
$577 |
$1,320 |
$43 |
$6 |
$125 |
$1,041 |
| 2 |
Levemir Penfill (insulin detemir) |
Novo Nordisk Canada Inc. |
$37,158 |
$3,021 |
$4,574 |
$1,132 |
$97 |
$25,294 |
$327 |
$976 |
$64 |
$158 |
$23 |
$1,493 |
| 3 |
Olmetec (olmesartan medoxomil) |
Merck Canada Inc. |
$36,141 |
$1,216 |
$4,365 |
$2,129 |
$1 |
$25,028 |
$1,202 |
$1,134 |
$191 |
– |
$1 |
$874 |
| 4 |
Aubagio (teriflunomide) |
Sanofi Genzyme, a division of Sanofi-aventis Canada Inc. |
$20,860 |
$5,201 |
$1,595 |
$1,866 |
$1,082 |
$7,969 |
$1,442 |
$1,036 |
$94 |
$336 |
$19 |
$219 |
| 5 |
Rebif (interferon beta-1a) |
EMD Serono, a division of EMD Inc. Canada |
$20,533 |
$3,572 |
$4,380 |
$2,315 |
$1,808 |
$6,859 |
$784 |
– |
$183 |
$323 |
$36 |
$272 |
| 6 |
Aranesp HAS-free (darbepoetin alfa) |
Amgen Canada Inc. |
$15,517 |
– |
$7,212 |
$130 |
– |
$4,090 |
$1,166 |
$14 |
– |
$1,102 |
$26 |
$1,776 |
| 7 |
Innohep (tinzaparin sodium) |
Leo Pharma Inc. |
$12,882 |
$386 |
$4,616 |
$1,884 |
$2 |
$5,585 |
$16 |
$4 |
$11 |
– |
– |
$378 |
| 8 |
Lovenox with preservative (enoxaparin sodium) |
Sanofi-aventis Canada Inc. |
$12,296 |
$224 |
$1,311 |
$514 |
$38 |
$9,118 |
$403 |
$63 |
$18 |
$202 |
$1 |
$404 |
| 9 |
Premarin vaginal cream (conjugated estrogens) |
Pfizer Canada Inc. |
$5,932 |
$976 |
$976 |
$414 |
$140 |
$2,631 |
$169 |
$136 |
$46 |
$119 |
$10 |
$315 |
| 10 |
Aggrenox (dipyridamole, acetylsalicylic acid) |
Boehringer Ingelheim |
$5,833 |
$41 |
$605 |
$89 |
$34 |
$4,826 |
$40 |
$49 |
– |
$37 |
$2 |
$110 |
| 11 |
Apo-Mycophenolic Acid (mycophenolic acid) |
Apotex Inc. |
$5,627 |
$22 |
– |
$505 |
$115 |
$4,691 |
$60 |
$9 |
– |
– |
$11 |
$215 |
| 12 |
Remodulin (treprostinil) |
United Therapeutics Corporation |
$4,847 |
$1,940 |
– |
– |
$29 |
$1,813 |
$848 |
– |
– |
– |
– |
$217 |
| 13 |
Trandate (labetalol hydrochloride) |
Paladin Labs Inc. |
$4,287 |
$596 |
$375 |
$241 |
$197 |
$1,949 |
$157 |
$310 |
$57 |
$104 |
$1 |
$301 |
| 14 |
Lamisil (terbinafine hydrochloride) |
Novartis Pharmaceuticals Canada Inc. |
$3,813 |
– |
$266 |
$106 |
$5 |
$3,124 |
$42 |
$45 |
– |
$46 |
$5 |
$175 |
| 15 |
Fucidin (fusidic acid) |
Leo Pharma Inc. |
$3,757 |
$325 |
$171 |
$321 |
$81 |
$2,112 |
$155 |
$61 |
$6 |
$217 |
<$0.1 |
$307 |
| 16 |
Elmiron (pentosan polysulfate sodium) |
Janssen Inc. |
$3,532 |
$1,673 |
$323 |
$90 |
$230 |
$318 |
$207 |
$365 |
$23 |
$92 |
– |
$211 |
| 17 |
Apo-Ciclesonide (ciclesonide) |
Apotex Inc. |
$3,466 |
– |
– |
$8 |
– |
$3,457 |
– |
– |
– |
– |
– |
– |
| 18 |
Fluanxol Depot (flupentixol decanoate) |
Lundbeck Canada Inc. |
$3,178 |
$523 |
$52 |
$203 |
$107 |
$1,948 |
$40 |
$50 |
– |
$49 |
$2 |
$204 |
| 19 |
Nplate (romiplostim) |
Amgen Canada Inc. |
$3,172 |
$153 |
– |
$29 |
– |
$2,956 |
– |
– |
– |
$34 |
– |
– |
| 20 |
Vimizim (elosulfase alfa) |
BioMarin International Ltd |
$3,114 |
– |
– |
– |
– |
$1,412 |
– |
– |
– |
– |
– |
$1,701 |
| 21 |
Humatrope (somatropin, diluent) |
Eli Lilly Canada Inc. |
$3,079 |
$834 |
$245 |
$159 |
$276 |
$831 |
$107 |
– |
– |
$399 |
$8 |
$221 |
| 22 |
Elaprase (idursulfase) |
Shire Human Genetic Therapies Inc. |
$3,013 |
– |
– |
– |
– |
$3,013 |
– |
– |
– |
– |
– |
– |
| 23 |
Lemtrada (alemtuzumab) |
Sanofi Genzyme, a division of Sanofi-aventis Canada Inc. |
$3,003 |
– |
$938 |
$1,024 |
$203 |
$772 |
– |
– |
– |
– |
– |
$66 |
| 24 |
Pentoxifylline SR (pentoxifylline) |
AA Pharma Inc. |
$2,856 |
$439 |
$333 |
$117 |
$55 |
$1,689 |
$23 |
$19 |
$8 |
$95 |
$2 |
$77 |
| 25 |
Codeine Contin controlled release (codeine) |
Purdue Pharma |
$2,837 |
$250 |
– |
$48 |
$138 |
$1,780 |
$125 |
$76 |
$7 |
$19 |
$19 |
$374 |
| 26 |
Inflectra (infliximab) |
Celltrion Healthcare Co. Ltd |
$2,823 |
$639 |
$127 |
$61 |
$53 |
$1,859 |
|
$28 |
– |
– |
$12 |
$44 |
| 27 |
Hp-PAC (lansoprazole, amoxicillin, clarithromycin) |
Takeda Pharmaceuticals America Inc. |
$2,441 |
$409 |
$146 |
$51 |
$12 |
$1,089 |
$2 |
$42 |
– |
$43 |
$1 |
$646 |
| 28 |
Trelstar (triptorelin) |
Allergan Pharma Co. |
$2,415 |
$5 |
– |
– |
– |
$1,882 |
$96 |
$344 |
$66 |
– |
– |
$21 |
| 29 |
Cerezyme (imiglucerase) |
Sanofi Genzyme, a division of Sanofi-aventis Canada Inc. |
$2,400 |
– |
– |
– |
$1,074 |
– |
– |
– |
– |
$903 |
– |
$423 |
| 30 |
Tobradex (dexamethasone, tobramycin) |
Novartis Pharmaceuticals Canada Inc. |
$2,349 |
$269 |
$291 |
$178 |
$22 |
$1,247 |
$47 |
$72 |
$5 |
$65 |
$2 |
$152 |
| 31 |
Apo-Lamivudine HBV (lamivudine) |
Apotex Inc. |
$2,304 |
$1,043 |
$69 |
$28 |
$47 |
$1,023 |
$18 |
$16 |
$1 |
$4 |
– |
$56 |
| 32 |
Humulin (insulin isophane) |
Eli Lilly Canada Inc. |
$2,301 |
$698 |
$142 |
$227 |
$175 |
$500 |
$103 |
$184 |
$23 |
$130 |
$2 |
$116 |
| 33 |
Soriatane (acitretin) |
Actavis Specialty Pharmaceuticals Co. |
$2,293 |
$251 |
$126 |
$102 |
$68 |
$1,342 |
$86 |
$112 |
$13 |
$62 |
– |
$133 |
| 34 |
Depo-Medrol with preservative (methylprednisolone acetate) |
Pfizer Canada Inc. |
$2,181 |
$187 |
$116 |
$40 |
$7 |
$1,538 |
$28 |
$75 |
$38 |
$43 |
$2 |
$106 |
| 35 |
Prolopa (levodopa, benserazide) |
Hoffmann-La Roche Ltd |
$2,094 |
$147 |
$163 |
$30 |
$55 |
$1,618 |
$11 |
$35 |
– |
$14 |
$3 |
$16 |
| 36 |
One-Alpha (alfacalcidol) |
Leo Pharma Inc. |
$1,931 |
$666 |
$53 |
$58 |
$8 |
$906 |
$60 |
$44 |
<$0.1 |
$26 |
$5 |
$105 |
| 37 |
Lotriderm (clotrimazole, betamethasone) |
Merck Canada Inc. |
$1,861 |
– |
$650 |
$379 |
$28 |
– |
$134 |
$300 |
– |
$36 |
– |
$335 |
| 38 |
Apo-Quinapril/HCTZ (quinapril, hydrochlorothiazide) |
Apotex Inc. |
$1,828 |
$202 |
$123 |
$65 |
$25 |
$1,219 |
$14 |
$55 |
$6 |
$68 |
$3 |
$49 |
| 39 |
Cytomel (liothyronine) |
Pfizer Canada Inc. |
$1,733 |
$1,170 |
$360 |
– |
$74 |
$7 |
$27 |
$28 |
– |
$9 |
$2 |
$56 |
| 40 |
Lomotil (diphenoxylate hydrochloride, atropine sulfate) |
Pfizer Canada Inc. |
$1,692 |
$136 |
$335 |
$87 |
$21 |
$973 |
$36 |
$40 |
$2 |
$54 |
$1 |
$7 |
| 41 |
Apo-Flecainide (flecainide acetate) |
Apotex Inc. |
$1,684 |
$154 |
$224 |
$109 |
$49 |
$1,045 |
$33 |
$19 |
$4 |
$2 |
– |
$45 |
| 42 |
Mestinon USP (pyridostigmine bromide) |
Valeant Canada LP/Valeant Canada S.E.C. |
$1,634 |
$203 |
$199 |
$114 |
$87 |
$837 |
$33 |
$73 |
$8 |
$20 |
$2 |
$57 |
| 43 |
Grastofil (filgrastim) |
Apotex Inc. |
$1,620 |
$259 |
– |
– |
– |
$1,361 |
– |
– |
– |
– |
– |
– |
| 44 |
Midodrine (midodrine hydrochloride) |
AA Pharma Inc. |
$1,600 |
$291 |
$116 |
$57 |
$79 |
$924 |
$36 |
$20 |
$2 |
$15 |
$1 |
$59 |
| 45 |
Clopixol Depot (zuclopenthixol decanoate) |
Lundbeck Canada Inc. |
$1,484 |
$474 |
$29 |
$183 |
$22 |
$483 |
$52 |
$13 |
– |
$64 |
– |
$165 |
| 46 |
Thyrogen (thyrotropin alfa) |
Sanofi Genzyme, a division of Sanofi-aventis Canada Inc. |
$1,400 |
– |
$325 |
– |
– |
$987 |
– |
$62 |
– |
– |
– |
$26 |
| 47 |
Benzaclin topical (benzoyl peroxide, clindamycin) |
Valeant Canada LP/Valeant Canada S.E.C. |
$1,396 |
– |
$9 |
$80 |
– |
$1,098 |
– |
– |
– |
$26 |
– |
$185 |
| 48 |
Delatestryl (testosterone enanthate) |
Valeant Canada LP/Valeant Canada S.E.C. |
$1,395 |
$185 |
$217 |
$93 |
$40 |
$713 |
$13 |
$31 |
$3 |
$15 |
<$0.1 |
$85 |
| 49 |
Imipramine (imipramine hydrochloride) |
AA Pharma Inc. |
$1,254 |
$192 |
$130 |
$75 |
$52 |
$615 |
$30 |
$66 |
$13 |
$40 |
$1 |
$39 |
| 50 |
Efudex (fluorouracil) |
Valeant Canada LP/Valeant Canada S.E.C. |
$1,229 |
$127 |
$164 |
$51 |
$15 |
$796 |
$30 |
$25 |
$9 |
$5 |
$1 |
$4 |
| |
|
Total |
$307,101 |
$38,683 |
$39,802 |
$16,252 |
$9,757 |
$166,339 |
$8,778 |
$7,352 |
$944 |
$4,983 |
$328 |
$13,882 |
| |
|
Share of all single-source non-patented drugs |
85% |
80% |
90% |
86% |
83% |
87% |
87% |
84% |
82% |
78% |
49% |
74% |
Data source: National Prescription Drug Utilization Information System Database, Canadian Institute for Health Information.
Appendix E: Top 50 Manufacturers by Drug Cost, NPDUIS Public Drug Plans, 2016/17 ($million)
| Rank |
Company |
Total |
BC |
AB |
SK |
MB |
ON |
NB |
NS |
PE |
NL |
YT |
NIHB |
| 1 |
Janssen Inc. |
$808.69 |
$147.31 |
$96.99 |
$56.59 |
$57.09 |
$360.80 |
$21.73 |
$16.88 |
$3.21 |
$11.15 |
$0.77 |
$36.18 |
| 2 |
Gilead Sciences Canada Inc. |
$509.03 |
$108.26 |
$26.53 |
$14.48 |
$17.88 |
$286.09 |
$6.44 |
$4.25 |
– |
$3.59 |
$1.08 |
$40.43 |
| 3 |
Apotex Inc. |
$498.46 |
$46.10 |
$41.56 |
$19.74 |
$19.40 |
$304.21 |
$12.11 |
$10.96 |
$2.27 |
$9.20 |
$0.53 |
$32.38 |
| 4 |
Novartis Pharmaceuticals Canada Inc. |
$458.40 |
$23.34 |
$39.49 |
$8.00 |
$9.24 |
$345.88 |
$11.38 |
$6.35 |
$0.83 |
$5.54 |
$0.29 |
$8.05 |
| 5 |
Teva Canada Ltd |
$407.17 |
$40.02 |
$38.04 |
$20.39 |
$17.41 |
$237.11 |
$9.50 |
$11.02 |
$2.16 |
$8.86 |
$0.33 |
$22.35 |
| 6 |
AbbVie Corporation |
$337.39 |
$95.03 |
$42.53 |
$21.98 |
$24.79 |
$114.91 |
$7.10 |
$9.96 |
$2.54 |
$5.57 |
$0.67 |
$12.31 |
| 7 |
Bayer Inc. |
$335.53 |
$13.75 |
$16.31 |
$11.58 |
$5.58 |
$266.59 |
$6.90 |
$3.30 |
$0.83 |
$3.26 |
$0.06 |
$7.36 |
| 8 |
Merck Canada Inc. |
$289.74 |
$7.17 |
$16.92 |
$6.78 |
$2.62 |
$233.89 |
$5.15 |
$3.25 |
$0.32 |
$0.78 |
$0.07 |
$12.78 |
| 9 |
Sandoz Canada Inc. |
$255.56 |
$28.89 |
$24.64 |
$11.57 |
$7.29 |
$154.99 |
$4.64 |
$6.83 |
$0.93 |
$3.97 |
$0.33 |
$11.48 |
| 10 |
GlaxoSmithKline Inc. |
$241.00 |
$28.70 |
$24.33 |
$9.62 |
$9.34 |
$135.45 |
$7.39 |
$6.12 |
$0.84 |
$4.34 |
$0.34 |
$14.54 |
| 11 |
Boehringer Ingelheim |
$211.36 |
$18.54 |
$21.15 |
$6.26 |
$4.25 |
$145.70 |
$4.48 |
$4.13 |
$0.58 |
$1.42 |
$0.17 |
$4.67 |
| 12 |
AstraZeneca Canada Inc. |
$192.42 |
$23.19 |
$20.41 |
$8.35 |
$4.16 |
$121.19 |
$2.80 |
$4.60 |
$0.57 |
$1.51 |
$0.24 |
$5.41 |
| 13 |
Sanofi-aventis Canada Inc. |
$186.84 |
$18.97 |
$16.97 |
$11.23 |
$2.89 |
$112.26 |
$3.02 |
$3.01 |
$0.52 |
$0.98 |
$0.09 |
$16.91 |
| 14 |
Pharmascience Inc. |
$186.04 |
$26.65 |
$16.74 |
$11.55 |
$7.10 |
$94.21 |
$5.56 |
$6.08 |
$1.01 |
$4.56 |
$0.28 |
$12.29 |
| 15 |
Immunex Corporation |
$159.56 |
$33.62 |
$20.98 |
$9.75 |
$15.39 |
$60.03 |
$3.36 |
$5.01 |
$0.80 |
$1.19 |
$0.39 |
$9.03 |
| 16 |
Pfizer Canada Inc. |
$156.60 |
$22.10 |
$11.68 |
$5.61 |
$9.97 |
$88.84 |
$3.91 |
$3.90 |
$0.49 |
$1.95 |
$0.25 |
$7.89 |
| 17 |
Servier Canada Inc. |
$145.39 |
$3.35 |
$17.41 |
$7.52 |
$2.68 |
$95.44 |
$5.53 |
$4.79 |
$0.60 |
$2.34 |
$0.04 |
$5.69 |
| 18 |
Sanis Health Inc. |
$143.15 |
$25.35 |
$24.36 |
$9.74 |
$7.35 |
$46.80 |
$7.17 |
$6.62 |
$1.02 |
$4.64 |
$0.53 |
$9.57 |
| 19 |
Bristol-Myers Squibb Canada |
$143.01 |
$15.57 |
$11.92 |
$4.08 |
$4.84 |
$96.42 |
$2.27 |
$2.45 |
$0.29 |
$0.64 |
$0.28 |
$4.25 |
| 20 |
Celgene Inc. |
$138.62 |
$0.01 |
– |
– |
$8.88 |
$112.65 |
$5.02 |
$5.62 |
$0.85 |
$4.03 |
$0.13 |
$1.43 |
| 21 |
Mylan Pharmaceuticals ULC |
$122.48 |
$16.78 |
$11.29 |
$4.11 |
$5.95 |
$67.70 |
$4.20 |
$3.07 |
$0.48 |
$2.22 |
$0.10 |
$6.58 |
| 22 |
Purdue Pharma |
$116.26 |
$8.09 |
$12.11 |
$6.90 |
$6.11 |
$72.63 |
$3.24 |
$2.45 |
$0.18 |
$0.79 |
$0.09 |
$3.67 |
| 23 |
Novo Nordisk Canada Inc. |
$114.57 |
$11.37 |
$13.28 |
$3.46 |
$2.84 |
$66.15 |
$2.24 |
$5.51 |
$0.89 |
$2.74 |
$0.16 |
$5.93 |
| 24 |
Amgen Canada Inc. |
$114.02 |
$8.75 |
$12.35 |
$0.67 |
$0.28 |
$82.32 |
$3.42 |
$0.38 |
$0.10 |
$2.20 |
$0.18 |
$3.38 |
| 25 |
Eli Lilly Canada Inc. |
$103.17 |
$11.74 |
$8.90 |
$6.44 |
$4.39 |
$53.89 |
$2.86 |
$2.42 |
$1.00 |
$3.42 |
$0.16 |
$7.96 |
| 26 |
Actavis Pharma Co. |
$84.05 |
$10.50 |
$8.59 |
$1.92 |
$2.76 |
$52.76 |
$1.33 |
$1.36 |
$0.23 |
$0.76 |
$0.11 |
$3.74 |
| 27 |
Hoffmann-La Roche Ltd |
$83.78 |
$15.93 |
$8.04 |
$4.60 |
$5.76 |
$37.22 |
$2.04 |
$2.36 |
$0.42 |
$1.59 |
$0.13 |
$5.70 |
| 28 |
Otsuka Pharmaceutical Co. Ltd |
$79.33 |
$15.31 |
$1.36 |
$1.87 |
$2.92 |
$53.43 |
$0.97 |
$0.33 |
$0.06 |
$0.16 |
$0.02 |
$2.89 |
| 29 |
Allergan Inc. |
$71.43 |
$9.29 |
$7.90 |
$2.02 |
$2.06 |
$44.46 |
$1.06 |
$1.86 |
$0.24 |
$0.47 |
$0.08 |
$1.99 |
| 30 |
Astellas Pharma Canada Inc. |
$67.58 |
$0.07 |
$1.37 |
$2.00 |
$4.44 |
$52.68 |
$2.38 |
$1.59 |
$0.36 |
$0.55 |
$0.06 |
$2.07 |
| 31 |
Biogen Canada Inc. |
$67.40 |
$14.68 |
$11.23 |
$7.18 |
$6.31 |
$18.19 |
$4.58 |
$1.55 |
$0.32 |
$1.88 |
$0.23 |
$1.25 |
| 32 |
Allergan Pharma Co. |
$56.95 |
$0.84 |
$0.72 |
$0.60 |
$0.20 |
$52.63 |
$0.22 |
$0.56 |
$0.09 |
$0.12 |
<$0.01 |
$0.96 |
| 33 |
Valeant Canada LP/Valeant Canada S.E.C. |
$54.54 |
$6.12 |
$5.93 |
$1.85 |
$1.50 |
$32.53 |
$1.55 |
$1.25 |
$0.23 |
$0.98 |
$0.02 |
$2.58 |
| 34 |
BGP Pharma ULC |
$52.72 |
$7.13 |
$6.68 |
$2.03 |
$1.58 |
$29.41 |
$1.24 |
$1.84 |
$0.28 |
$0.82 |
$0.05 |
$1.66 |
| 35 |
AA Pharma Inc. |
$52.10 |
$11.44 |
$3.50 |
$3.15 |
$1.91 |
$24.84 |
$1.50 |
$1.48 |
$0.30 |
$1.02 |
$0.05 |
$2.92 |
| 36 |
Sivem Pharmaceuticals ULC |
$51.41 |
$10.96 |
$13.54 |
$3.93 |
$4.85 |
<$0.01 |
$3.79 |
$3.68 |
$2.10 |
$0.84 |
– |
$7.72 |
| 37 |
Ranbaxy Pharmaceuticals Canada Inc. |
$48.43 |
$8.63 |
$5.27 |
$1.56 |
$1.09 |
$28.11 |
$0.68 |
$0.58 |
$0.12 |
$0.56 |
$0.12 |
$1.71 |
| 38 |
ViiV Healthcare ULC |
$47.11 |
– |
– |
$2.01 |
$2.27 |
$38.16 |
$1.01 |
– |
– |
$0.48 |
$0.04 |
$3.14 |
| 39 |
Sanofi Genzyme, a division of Sanofi-aventis Canada Inc. |
$42.38 |
$5.20 |
$2.86 |
$3.55 |
$4.05 |
$21.66 |
$1.44 |
$1.16 |
$0.09 |
$1.24 |
$0.02 |
$1.11 |
| 40 |
Leo Pharma Inc. |
$41.99 |
$3.08 |
$6.01 |
$2.86 |
$0.39 |
$25.74 |
$0.46 |
$0.33 |
$0.04 |
$0.39 |
$0.02 |
$2.66 |
| 41 |
Alexion Pharma GmbH |
$37.58 |
– |
$4.85 |
– |
$0.87 |
$31.16 |
$0.19 |
– |
– |
– |
– |
$0.52 |
| 42 |
Taro Pharmaceuticals Inc. |
$37.40 |
$3.31 |
$2.39 |
$1.75 |
$1.54 |
$22.94 |
$0.79 |
$0.95 |
$0.22 |
$0.70 |
$0.03 |
$2.78 |
| 43 |
Shire Pharma Canada ULC |
$27.24 |
$2.71 |
$1.50 |
$1.98 |
$1.01 |
$16.54 |
$0.37 |
$0.15 |
$0.03 |
$0.11 |
$0.02 |
$2.83 |
| 44 |
UCB Canada Inc. |
$25.38 |
$4.68 |
$0.97 |
$1.17 |
$0.60 |
$15.85 |
$0.12 |
$0.64 |
$0.10 |
$0.21 |
$0.04 |
$1.01 |
| 45 |
Pendopharm, a division of Pharmascience Inc. |
$24.56 |
$4.49 |
$1.84 |
$1.48 |
$0.93 |
$12.04 |
$0.59 |
$0.49 |
$0.12 |
$0.37 |
$0.02 |
$2.18 |
| 46 |
Paladin Labs Inc. |
$22.83 |
$5.61 |
$2.61 |
$1.05 |
$0.90 |
$9.09 |
$0.49 |
$0.86 |
$0.14 |
$0.40 |
$0.02 |
$1.65 |
| 47 |
EMD Serono, a division of EMD Inc. Canada |
$22.54 |
$4.33 |
$4.43 |
$2.33 |
$2.16 |
$7.50 |
$0.85 |
– |
$0.18 |
$0.38 |
$0.04 |
$0.35 |
| 48 |
Bristol-Myers Squibb and Gilead Sciences LLC |
$21.89 |
– |
– |
$0.94 |
$0.87 |
$17.79 |
$0.61 |
– |
– |
$0.13 |
$0.11 |
$1.42 |
| 49 |
McNeil Consumer Healthcare, a division of Johnson & Johnson Inc. |
$18.79 |
$13.91 |
$0.02 |
$0.01 |
$0.15 |
$1.32 |
<$0.01 |
$0.02 |
$0.01 |
<$0.01 |
– |
$3.37 |
| 50 |
Auro Pharma Inc. |
$17.71 |
$2.53 |
$1.79 |
$0.58 |
$0.76 |
$10.11 |
$0.29 |
$0.30 |
$0.06 |
$0.26 |
<$0.01 |
$1.01 |
| |
Total |
$7,531.58 |
$943.40 |
$690.29 |
$328.77 |
$309.61 |
$4,412.32 |
$179.98 |
$162.31 |
$29.03 |
$105.32 |
$8.85 |
$361.72 |
Data source: National Prescription Drug Utilization Information System Database, Canadian Institute for Health Information.