Private Drug Plans in Canada:
High-Cost Drugs and Beneficiaries, 2005 to 2017
PDF - 535 kb
The increased availability and use of drugs with treatment costs in excess of $10,000 per year has been fueling the growth in drug expenditures in Canada and raising concerns over the sustainability of private drug plans. This analysis updates previous PMPRB findings, focusing on the increasing impact of high-cost beneficiaries and drugs on private plan expenditures from 2005 to 2017. Results are based on data from the IQVIA™ Private Drug Plan Database.
Canadian private drug plans are the second largest market for prescribed drugs in Canada, accounting for approximately one-third of all prescribed drug spending. The PMPRB has been reporting on this major market to identify the sources of cost pressure and recent trends in price, utilization and costs. The results of this analysis as well as an examination of other major cost drivers will be further detailed in upcoming published reports as part of the PMPRB private drug plan series.
A. High-cost beneficiaries
A1. High-cost beneficiaries increased more than fourfold since 2005
Private drug plans have experienced a marked rise in the number of beneficiaries with annual drug costs greater than $10,000. For an average private drug plan of 100,000 active beneficiaries, the number of high-cost beneficiaries increased from 263 in 2005 to 785 in 2017, with the greatest rate of increase for those with annual drug costs over $20,000. By 2017, high-cost beneficiaries accounted for over one quarter of all private plan drug costs.
Number and cost of high-cost beneficiaries, 2005–2017
Click on image for larger view
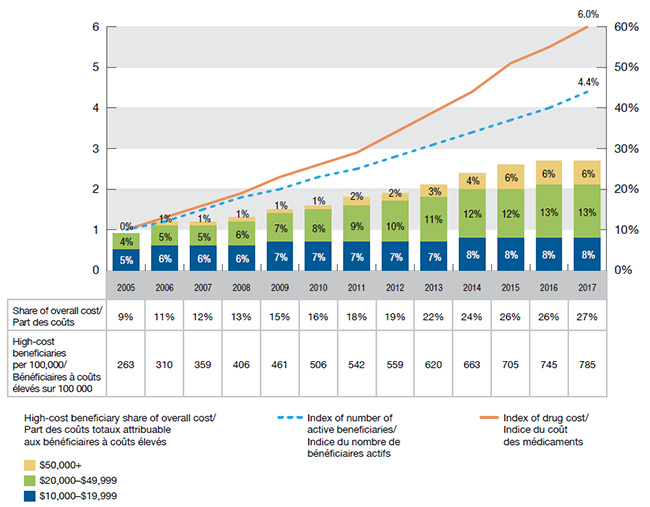
Figure description
This bar graph depicts the trends in the number and cost of high-cost beneficiaries in private drug plans in Canada from 2005 to 2017.
The high-cost beneficiary share of overall costs is represented by bars and is given for each year. Each bar is subdivided into cost bands for beneficiaries with average annual costs of $10,000 to $19,999; $20,000 to $49,999; and $50,000 and greater. The index for the number of active beneficiaries and the index for drug cost are represented by superimposed lines on the graph. Both indices are set to a value of 1.0 for 2005.
blank
| |
2005 |
2006 |
2007 |
2008 |
2009 |
2010 |
2011 |
2012 |
2013 |
2014 |
2015 |
2016 |
2017 |
| Share of overall cost: all high-cost beneficiaries |
9% |
11% |
12% |
13% |
15% |
16% |
18% |
19% |
22% |
24% |
26% |
26% |
27% |
| Share of overall cost: beneficiaries with costs of $10,000 to $19,999 |
5% |
6% |
6% |
6% |
7% |
7% |
7% |
7% |
7% |
8% |
8% |
8% |
8% |
| Share of overall cost: beneficiaries with costs of $20,000 to $49,999 |
4% |
5% |
5% |
6% |
7% |
8% |
9% |
10% |
11% |
12% |
12% |
13% |
13% |
| Share of overall cost: beneficiaries with costs of $50,000 and greater |
0% |
1% |
1% |
1% |
1% |
1% |
2% |
2% |
3% |
4% |
6% |
6% |
6% |
| Index of number of active beneficiaries |
1.0 |
1.2 |
1.5 |
1.8 |
2.0 |
2.3 |
2.5 |
2.8 |
3.1 |
3.4 |
3.7 |
4.0 |
4.4 |
| Index of drug cost |
1.0 |
1.3 |
1.6 |
1.9 |
2.3 |
2.6 |
2.9 |
3.4 |
3.9 |
4.4 |
5.1 |
5.5 |
6.0 |
The accompanying table gives the number of high-cost beneficiaries per 100,000 active beneficiaries for each year.
blank
| |
2005 |
2006 |
2007 |
2008 |
2009 |
2010 |
2011 |
2012 |
2013 |
2014 |
2015 |
2016 |
2017 |
| High-cost beneficiaries per 100,000 |
263 |
310 |
359 |
406 |
461 |
506 |
542 |
559 |
620 |
663 |
705 |
745 |
785 |
A2. Patients are paying a higher share of their expenditures
An average high-cost beneficiary paid $1,427 towards their drug expenditure in 2017, up from $817 in 2005. This is due to both an increase in average drug costs and changes in the cost sharing structures of the plans. The average beneficiary-paid share of expenditures, which includes deductibles, copayments, co-insurances and/or maximums, has increased across all cost bands.
Although high-cost beneficiaries pay for a smaller percentage of their drug costs, they pay more in absolute terms. For example, in 2017, beneficiaries with less than $5,000 in annual costs paid 15% or $68 on average, while beneficiaries with over $50,000 in costs paid 5%, but averaged $3,986 in actual dollar amounts.
Beneficiary-paid share of expenditures, 2005, 2010 and 2017
Click on image for larger view
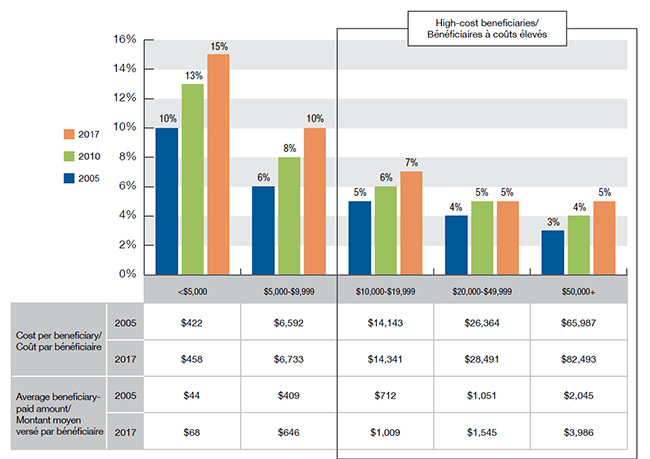
Figure description
This bar graph depicts the beneficiary-paid share of private drug plan expenditures by annual drug cost level for 2005, 2010 and 2017. Five cost levels are considered for each year: less than $5,000; $5,000 to $9,999; $10,000 to $19,999; $20,000 to 49,999; and $50,000 or more.
blank
| |
2005 |
2010 |
2017 |
| Less than $5,000 |
10% |
13% |
15% |
| $5,000 to $9,999 |
6% |
8% |
10% |
| $10,000 to $19,999 |
5% |
6% |
7% |
| $20,000 to $49,999 |
4% |
5% |
5% |
| $50,000 or more |
3% |
4% |
5% |
The table below the graph gives the average cost per beneficiary and beneficiary-paid amount for each of the annual cost levels in 2005 and 2017.
blank
| |
|
Less than $5,000 |
$5,000 to $9,999 |
$10,000 to $19,999 |
$20,000 to $49,999 |
$50,000 or more |
| Cost per beneficiary |
2005 |
$422 |
$6,592 |
$14,143 |
$26,364 |
$65,987 |
| Cost per beneficiary |
2017 |
$458 |
$6,733 |
$14,341 |
$28,491 |
$82,493 |
| Average beneficiary-paid amount |
2005 |
$44 |
$409 |
$712 |
$1,051 |
$2,045 |
| Average beneficiary-paid amount |
2017 |
$68 |
$646 |
$1,009 |
$1,545 |
$3,986 |
A3. High-cost drugs account for 78% of expenditures for high-cost beneficiaries
A beneficiary may reach cost levels of over $10,000 in any given year either because they use high-cost drugs or multiple lower-cost drugs. In 2005, high-cost beneficiaries were a more balanced blend of these two groups, as half their expenditures were for more commonly used drugs, such as statins, antidepressants, drugs for acid-related disorders, antihypertensives, etc. The balance has progressively shifted, resulting in a 20% – 80% split by 2017. This trend is due to both generic drug entries and price reductions, which have lowered prices for more commonly used drugs, as well as a steady increase in the number, use and expenditure of high-cost drugs.
High-cost beneficiary expenditure: high-cost versus other drugs, 2005–2017
Click on image for larger view
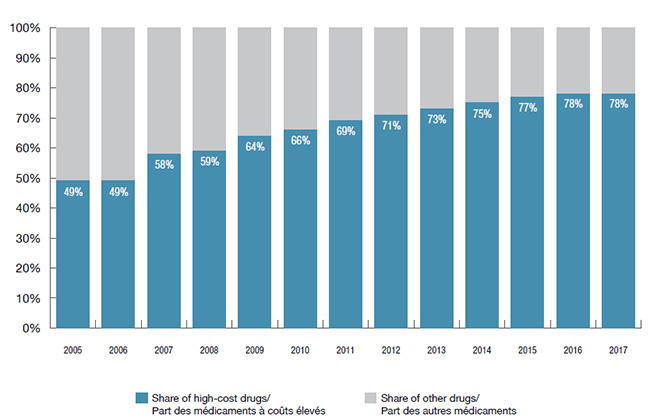
Figure description
This bar graph depicts the share of high-cost drugs used by high-cost beneficiaries by year from 2005 to 2017
blank
| |
2005 |
2006 |
2007 |
2008 |
2009 |
2010 |
2011 |
2012 |
2013 |
2014 |
2015 |
2016 |
2017 |
| Share of high-cost drugs |
49% |
49% |
58% |
59% |
64% |
66% |
69% |
71% |
73% |
75% |
77% |
78% |
78% |
B. High-cost drugs
B1. High-cost drugs represented over 25% of private drug plan costs in 2017
In 2005, there were 23 drugs reimbursed by private plans with an annual average cost per active beneficiary of $10,000 or more, representing approximately 6% of the total private drug plan costs. By 2017, the number of drugs surpassing this threshold grew seven times to 163, representing over one-quarter of the private drug plan costs. While drugs costing over $20,000 per year were an insignificant proportion of private drug plan costs a decade ago, they now represent over one-tenth of expenditures.
Number and cost of high-cost drugs, 2005–2017
Click on image for larger view
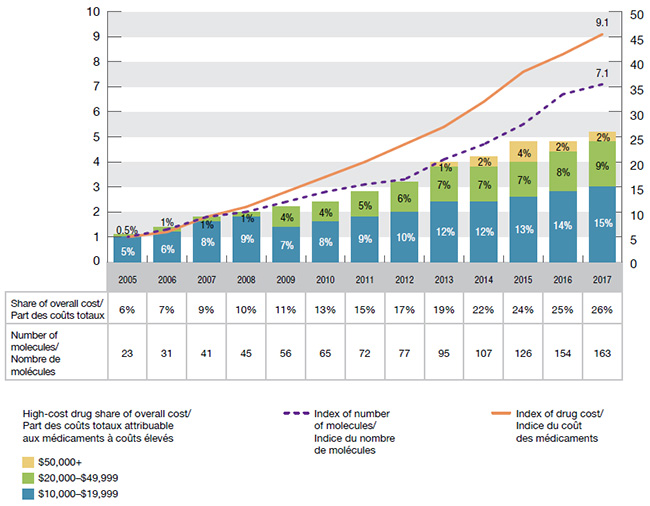
Figure description
This bar graph depicts the trends in the number and cost of high-cost drugs in private drug plans in Canada from 2005 to 2017.
The high-cost drug share of overall costs is represented by bars and is given for each year. Each bar is subdivided into cost bands for drugs with average annual costs of $10,000 to $19,999; $20,000 to $49,999; and $50,000 and greater. The index for the number of molecules and the index for drug cost are represented by superimposed lines on the graph. Both indices are set to a value of 1.0 for 2005.
blank
| |
2005 |
2006 |
2007 |
2008 |
2009 |
2010 |
2011 |
2012 |
2013 |
2014 |
2015 |
2016 |
2017 |
| Share of overall cost: all high-cost drugs |
6% |
7% |
9% |
10% |
11% |
13% |
15% |
17% |
19% |
22% |
24% |
25% |
26% |
| Share of overall cost: drug cost of $10,000 to $19,999 |
5% |
6% |
8% |
9% |
7% |
8% |
9% |
10% |
12% |
12% |
13% |
14% |
15% |
| Share of overall cost: drug cost of $20,000 to $49,999 |
0% |
1% |
1% |
1% |
4% |
4% |
5% |
6% |
7% |
7% |
7% |
8% |
9% |
| Share of overall cost: drug cost of $50,000 and greater |
0% |
0% |
0% |
0% |
0% |
0% |
0% |
0% |
1% |
2% |
4% |
2% |
2% |
| Index of number of molecules |
1.0 |
1.3 |
1.8 |
2.0 |
2.4 |
2.8 |
3.1 |
3.3 |
4.1 |
4.7 |
5.5 |
6.7 |
7.1 |
| Index of drug cost |
1.0 |
1.2 |
1.8 |
2.2 |
2.8 |
3.4 |
4.0 |
4.7 |
5.4 |
6.4 |
7.6 |
8.3 |
9.1 |
The accompanying table gives the number of molecules for each year.
blank
| |
2005 |
2006 |
2007 |
2008 |
2009 |
2010 |
2011 |
2012 |
2013 |
2014 |
2015 |
2016 |
2017 |
| Number of molecules |
23 |
31 |
41 |
45 |
56 |
65 |
72 |
77 |
95 |
107 |
126 |
154 |
163 |
B2. Private drug plans reimbursed 28 drugs costing over 50K in 2017
There has been a sizable increase in the number of high-cost drugs across all cost bands. The number of drugs with an annual cost of more than $50,000, which are generally used to treat rare conditions and impact a small number of patients, has grown from 3 in 2005 to 28 in 2017.
Number of high-cost drugs by average annual cost, 2005–2017
Click on image for larger view
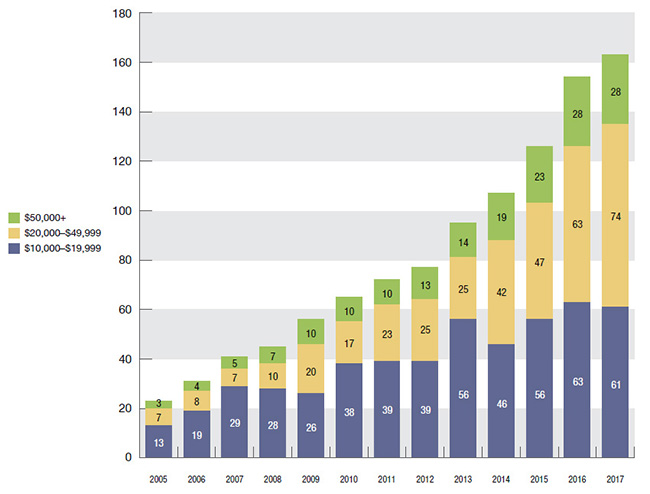
Figure description
This bar graph depicts the trend in the annual number of high-cost drugs in private plans from 2005 to 2017 by three ranges of average annual cost: $10,000 to $19,999; $20,000 to $49,999; and $50,000 or more.
blank
| |
2005 |
2006 |
2007 |
2008 |
2009 |
2010 |
2011 |
2012 |
2013 |
2014 |
2015 |
2016 |
2017 |
| $10,000 to $19,999 |
13 |
19 |
29 |
28 |
26 |
38 |
39 |
39 |
56 |
46 |
56 |
63 |
61 |
| $20,000 to $49,999 |
7 |
8 |
7 |
10 |
20 |
17 |
23 |
25 |
25 |
42 |
47 |
63 |
74 |
| $50,000 or more |
3 |
4 |
5 |
7 |
10 |
10 |
10 |
13 |
14 |
19 |
23 |
28 |
28 |
B3. The 10 top-selling high-cost drugs account for 15% of private drug plan costs
Over half (6) of the top-selling high-cost drugs are immunosuppressants, while the rest fall into four other categories: other systemic drugs for obstructive airway diseases; antivirals for systemic use; intestinal antiinflammatory agents; and parasympathomimetics, which are used in the treatment of multiple sclerosis. With the exception of Gilenya, Epclusa and Tecfidera, all of these drugs are biologics. Remicade, which tops the list of high-cost drugs, has one of the highest average costs per active beneficiary in 2017: $28,804.
Ten top-selling high-cost drugs, 2017
Click on image for larger view
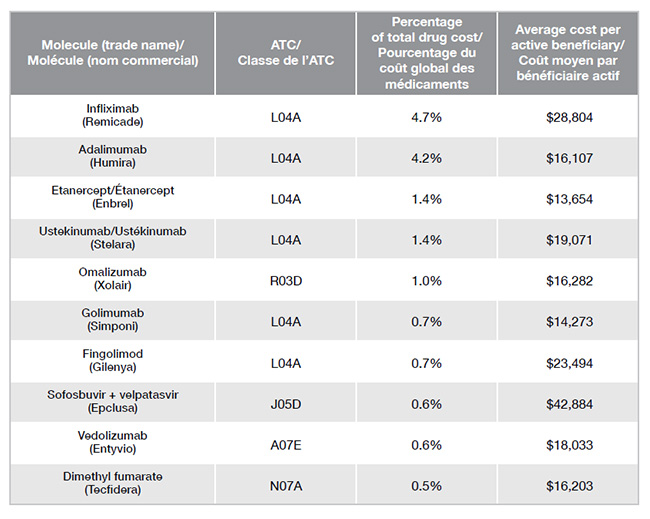
Figure description
blank
| Molecule (trade name) |
ATC |
Percentage of total drug cost |
Average cost per active beneficiary |
Infliximab
(Remicade) |
L04A |
4.7% |
$28,804 |
Adalimumab
(Humira) |
L04A |
4.2% |
$16,107 |
Etanercept
(Enbrel) |
L04A |
1.4% |
$13,654 |
Ustekinumab
(Stelara) |
L04A |
1.4% |
$19,071 |
Omalizumab
(Xolair) |
R03D |
1.0% |
$16,282 |
Golimumab
(Simponi) |
L04A |
0.7% |
$14,273 |
Fingolimod
(Gilenya) |
L04A |
0.7% |
$23,494 |
Sofosbuvir +
velpatasvir
(Epclusa) |
J05D |
0.6% |
$42,884 |
Vedolizumab
(Entyvio) |
A07E |
0.6% |
$18,033 |
Dimethyl fumarate
(Tecfidera) |
N07A |
0.5% |
$16,203 |
Data Source: IQVIA™ Private Pay Direct Drug Plan Database.
Limitation: The average annual cost per active beneficiary at drug level based on private drug plan data may be underestimated, as some beneficiaries may only use the drug during part of the calendar year analyzed.
Disclaimer: Although based on data provided under license by the IQVIA™ Private Pay Direct Drug Plan Database, the statements, findings, conclusions, views and opinions expressed in this report are exclusively those of the PMPRB and are not attributable to IQVIA™.
NPDUIS is a research initiative that operates independently of the regulatory activities of the PMPRB.