Generic Drugs in Canada, 2016
PDF - 477 kb
The average price of generic drugs in Canada has decreased to half of what it was a decade ago primarily due to the implementation of provincial pricing policies and pan-Canadian Pharmaceutical Alliance (pCPA) initiatives. The most recent edition of the PMPRB’s Generics360 publication series provides a snapshot of the Canadian and international generic landscape at the end of 2016. This analysis examines 605 leading generic drugs accounting for 82% of all Canadian generic sales in the fourth quarter of 2016 (Q4-2016). While the results capture many of the generic pricing policies implemented in Canada, they do not reflect price reductions introduced after 2016; these recent policy changes will be monitored and reported in future editions of Generics360.
The international markets examined include the seven countries the PMPRB considers in reviewing the prices of patented drugs (PMPRB7): France, Germany, Italy, Sweden, Switzerland, the United Kingdom (UK) and the United States (US); as well as other countries in the Organisation for Economic Co-operation and Development (OECD).
1. Canada has a strong generics market
Generic drugs in Canada are a $5 billion market that has undergone significant growth over the last decade. Canadians spent more per capita for generic drugs in 2016 than all other OECD members except for the US. This was, in part, due to Canada’s relatively high share of utilization, which increased from 58% of the pharmaceutical retail market in 2006 to 74% in 2016, representing the third highest market share among the OECD countries.
Per capita generic drug spending and market share, OECD, 2016
Click on image for larger view
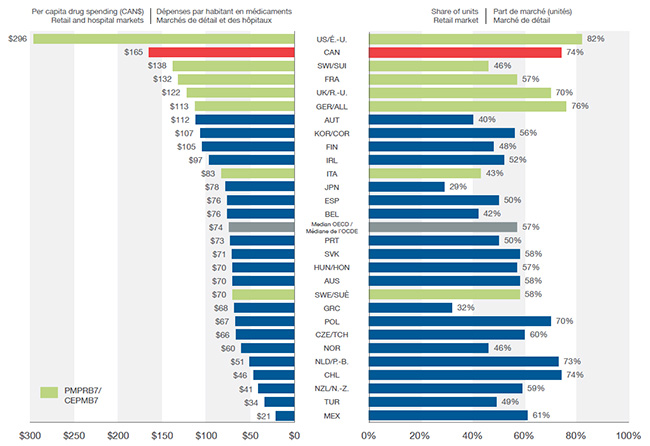
Figure description
This is a split bar graph. For each country in the Organisation for Economic Co-operation and Development, the left side of the graph gives the per capita drug spending for the retail and hospital markets in Canadian dollars. The right side gives the share of units for the retail market.
blank
| Country |
Per capita spending in Canadian dollars |
Share of units for retail market |
| United States |
$296 |
82% |
| Canada |
$165 |
74% |
| Switzerland |
$138 |
46% |
| France |
$132 |
57% |
| United Kingdom |
$122 |
70% |
| Germany |
$113 |
76% |
| Austria |
$112 |
40% |
| South Korea |
$107 |
56% |
| Finland |
$105 |
48% |
| Ireland |
$97 |
52% |
| Italy |
$83 |
43% |
| Japan |
$78 |
29% |
| Spain |
$76 |
50% |
| Belgium |
$76 |
42% |
| OECD Median |
$74 |
57% |
| Portugal |
$73 |
50% |
| Slovakia |
$71 |
58% |
| Hungary |
$70 |
57% |
| Australia |
$70 |
58% |
| Sweden |
$70 |
58% |
| Greece |
$68 |
32% |
| Poland |
$67 |
70% |
| Czech Republic |
$66 |
60% |
| Norway |
$60 |
46% |
| Netherlands |
$51 |
73% |
| Chile |
$46 |
74% |
| New Zealand |
$41 |
59% |
| Turkey |
$34 |
49% |
| Mexico |
$21 |
61% |
2. The generic price decline in Canada has exceeded international comparators
Over the past decade, generic drug prices have declined in all PMPRB7 pharmaceutical markets. Canadian prices dropped by 49%, on par with decreases in Germany and greater than the other comparator countries. The prices of drugs that were reduced to 18% of their reference name-brand prices through the pCPA rule fell even more steeply by 67%.
Price indices for generic drugs, Canada and the PMPRB7, Q4-2007 to Q4-2016
Click on image for larger view
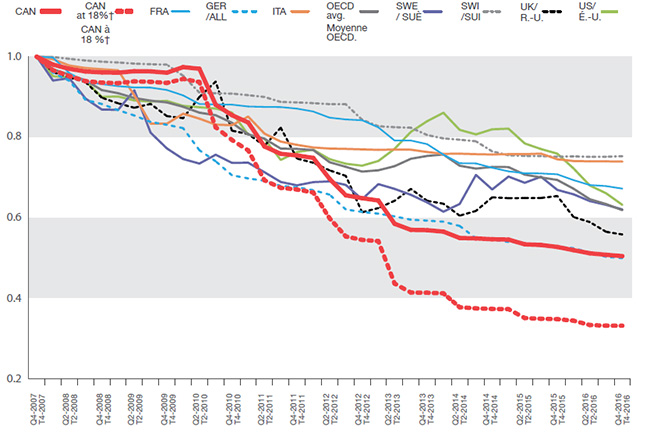
†Includes eighteen of the most common generic drugs priced at 18% of their equivalent brand-name products through the efforts of the pCPA.
Figure description
This line graph gives price indices for Canada and the seven PMPRB comparator countries starting with the fourth quarter of 2007. Two sets of data are provided for Canada: one for all generic drugs and the other for the drugs at 18% of their brand-name price as of the end of 2016.
blank
| Quarter year |
Canada: all |
Canada: generic drugs at 18% |
France |
Germany |
Italy |
OECD
Average |
Sweden |
Switzerland |
United Kingdom |
United States |
| 2007: fourth quarter |
1.00 |
1.00 |
1.00 |
1.00 |
1.00 |
1.00 |
1.00 |
1.00 |
1.00 |
1.00 |
| 2008: first quarter |
0.98 |
0.97 |
1.00 |
0.96 |
0.99 |
0.97 |
0.94 |
1.00 |
0.96 |
0.95 |
| 2008: second quarter |
0.97 |
0.95 |
0.96 |
0.94 |
0.98 |
0.96 |
0.95 |
0.99 |
0.95 |
0.95 |
| 2008: third quarter |
0.96 |
0.94 |
0.94 |
0.89 |
0.97 |
0.94 |
0.90 |
0.99 |
0.94 |
0.94 |
| 2008: fourth quarter |
0.96 |
0.94 |
0.93 |
0.88 |
0.97 |
0.92 |
0.87 |
0.99 |
0.90 |
0.90 |
| 2009: first quarter |
0.96 |
0.93 |
0.93 |
0.87 |
0.97 |
0.91 |
0.87 |
0.99 |
0.88 |
0.90 |
| 2009: second quarter |
0.96 |
0.94 |
0.92 |
0.85 |
0.90 |
0.90 |
0.92 |
0.98 |
0.87 |
0.89 |
| 2009: third quarter |
0.96 |
0.94 |
0.92 |
0.84 |
0.83 |
0.89 |
0.81 |
0.98 |
0.88 |
0.89 |
| 2009: fourth quarter |
0.96 |
0.93 |
0.92 |
0.83 |
0.83 |
0.89 |
0.77 |
0.98 |
0.85 |
0.89 |
| 2010: first quarter |
0.97 |
0.94 |
0.90 |
0.82 |
0.86 |
0.88 |
0.75 |
0.95 |
0.85 |
0.88 |
| 2010: second quarter |
0.97 |
0.94 |
0.88 |
0.77 |
0.85 |
0.86 |
0.73 |
0.91 |
0.90 |
0.87 |
| 2010: third quarter |
0.88 |
0.82 |
0.88 |
0.74 |
0.83 |
0.85 |
0.76 |
0.91 |
0.94 |
0.87 |
| 2010: fourth quarter |
0.85 |
0.79 |
0.88 |
0.71 |
0.83 |
0.84 |
0.74 |
0.91 |
0.82 |
0.86 |
| 2011: first quarter |
0.84 |
0.77 |
0.88 |
0.70 |
0.85 |
0.81 |
0.74 |
0.90 |
0.81 |
0.81 |
| 2011: second quarter |
0.78 |
0.69 |
0.88 |
0.69 |
0.81 |
0.80 |
0.71 |
0.90 |
0.78 |
0.80 |
| 2011: third quarter |
0.76 |
0.67 |
0.87 |
0.68 |
0.79 |
0.77 |
0.69 |
0.89 |
0.82 |
0.74 |
| 2011: fourth quarter |
0.76 |
0.67 |
0.87 |
0.68 |
0.78 |
0.77 |
0.68 |
0.89 |
0.75 |
0.76 |
| 2012: first quarter |
0.75 |
0.66 |
0.86 |
0.67 |
0.77 |
0.77 |
0.69 |
0.88 |
0.74 |
0.77 |
| 2012: second quarter |
0.70 |
0.60 |
0.85 |
0.66 |
0.77 |
0.74 |
0.69 |
0.88 |
0.72 |
0.75 |
| 2012: third quarter |
0.66 |
0.55 |
0.84 |
0.62 |
0.77 |
0.73 |
0.68 |
0.88 |
0.70 |
0.73 |
| 2012: fourth quarter |
0.65 |
0.55 |
0.84 |
0.61 |
0.77 |
0.71 |
0.65 |
0.84 |
0.61 |
0.73 |
| 2013: first quarter |
0.64 |
0.54 |
0.82 |
0.61 |
0.77 |
0.72 |
0.68 |
0.83 |
0.62 |
0.74 |
| 2013: second quarter |
0.59 |
0.44 |
0.79 |
0.60 |
0.77 |
0.73 |
0.67 |
0.83 |
0.64 |
0.77 |
| 2013: third quarter |
0.57 |
0.41 |
0.79 |
0.60 |
0.77 |
0.75 |
0.66 |
0.82 |
0.67 |
0.81 |
| 2013: fourth quarter |
0.57 |
0.41 |
0.78 |
0.59 |
0.76 |
0.75 |
0.64 |
0.81 |
0.64 |
0.84 |
| 2014: first quarter |
0.57 |
0.41 |
0.76 |
0.59 |
0.76 |
0.76 |
0.62 |
0.80 |
0.64 |
0.86 |
| 2014: second quarter |
0.55 |
0.38 |
0.74 |
0.58 |
0.76 |
0.73 |
0.63 |
0.79 |
0.61 |
0.82 |
| 2014: third quarter |
0.55 |
0.38 |
0.74 |
0.55 |
0.76 |
0.72 |
0.71 |
0.79 |
0.62 |
0.81 |
| 2014: fourth quarter |
0.55 |
0.37 |
0.72 |
0.55 |
0.76 |
0.73 |
0.67 |
0.77 |
0.65 |
0.82 |
| 2015: first quarter |
0.55 |
0.37 |
0.72 |
0.54 |
0.76 |
0.73 |
0.70 |
0.76 |
0.65 |
0.82 |
| 2015: second quarter |
0.53 |
0.35 |
0.71 |
0.54 |
0.76 |
0.71 |
0.69 |
0.75 |
0.65 |
0.78 |
| 2015: third quarter |
0.53 |
0.35 |
0.71 |
0.53 |
0.76 |
0.70 |
0.70 |
0.75 |
0.65 |
0.77 |
| 2015: fourth quarter |
0.53 |
0.35 |
0.71 |
0.53 |
0.75 |
0.69 |
0.67 |
0.75 |
0.65 |
0.76 |
| 2016: first quarter |
0.52 |
0.34 |
0.69 |
0.53 |
0.74 |
0.67 |
0.66 |
0.75 |
0.60 |
0.72 |
| 2016: second quarter |
0.51 |
0.33 |
0.68 |
0.51 |
0.74 |
0.65 |
0.64 |
0.75 |
0.59 |
0.68 |
| 2016: third quarter |
0.51 |
0.33 |
0.68 |
0.50 |
0.74 |
0.63 |
0.63 |
0.75 |
0.57 |
0.66 |
| 2016: fourth quarter |
0.51 |
0.33 |
0.67 |
0.50 |
0.74 |
0.62 |
0.62 |
0.75 |
0.56 |
0.63 |
3. Price declines have reined in the rate of growth in generic drug sales in Canada
Over the last decade, sales of generic drugs in Canada grew by 86% from $3.0 billion in 2006 to $5.5 billion in 2016 at a compound annual growth rate of 6.4%, similar to the average OECD increase. Initially, generic sales in Canada grew at double-digit annual rates (reaching 77% by 2010) and surpassing the growth in all of the PMPRB7 countries. However, despite a continued increase in generic utilization since 2010, the sales growth in Canada has slowed and fallen in line with international levels due to the effect of lower prices.
Index in Canadian and international generic drug retail sales, 2006 to 2016
Click on image for larger view
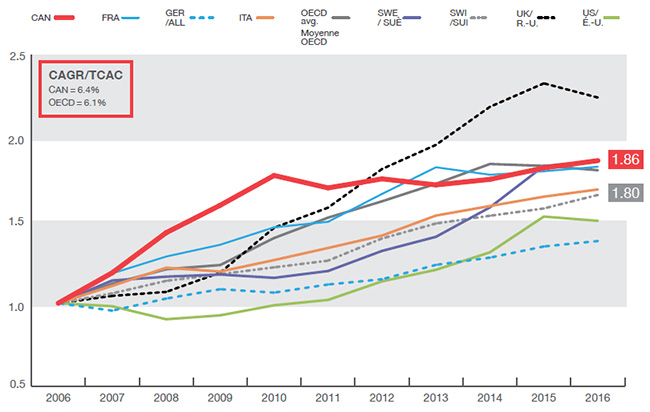
Figure description
This line graph gives the indexed rate of growth of generic retail sales for Canada and the seven PMPRB comparator countries, as well as the average for the Organisation for Economic Co-operation and Development countries. From 2006 to 2016, the compound annual growth rate for Canada was 6.4% and 6.1% for the Organisation for Economic Co-operation and Development countries.
blank
| Country |
2006 |
2007 |
2008 |
2009 |
2010 |
2011 |
2012 |
2013 |
2014 |
2015 |
2016 |
| Canada |
1.00 |
1.18 |
1.42 |
1.59 |
1.77 |
1.69 |
1.75 |
1.71 |
1.75 |
1.81 |
1.86 |
| France |
1.00 |
1.18 |
1.28 |
1.35 |
1.46 |
1.49 |
1.66 |
1.82 |
1.77 |
1.79 |
1.82 |
| Germany |
1.00 |
0.95 |
1.03 |
1.08 |
1.06 |
1.11 |
1.14 |
1.23 |
1.27 |
1.34 |
1.37 |
| Italy |
1.00 |
1.10 |
1.21 |
1.19 |
1.26 |
1.33 |
1.41 |
1.53 |
1.58 |
1.64 |
1.68 |
| Sweden |
1.00 |
1.14 |
1.16 |
1.17 |
1.15 |
1.19 |
1.31 |
1.40 |
1.58 |
1.83 |
1.86 |
| Switzerland |
1.00 |
1.06 |
1.13 |
1.17 |
1.22 |
1.26 |
1.39 |
1.48 |
1.53 |
1.57 |
1.65 |
| United States |
1.00 |
0.98 |
0.90 |
0.93 |
0.99 |
1.02 |
1.13 |
1.20 |
1.31 |
1.52 |
1.50 |
| United Kingdom |
1.00 |
1.04 |
1.07 |
1.18 |
1.45 |
1.58 |
1.81 |
1.95 |
2.18 |
2.32 |
2.24 |
| OECD average |
1.00 |
1.12 |
1.20 |
1.23 |
1.39 |
1.52 |
1.61 |
1.72 |
1.84 |
1.83 |
1.80 |
4. The gap between Canadian and international prices has lessened, but Canadian levels are still higher
Provincial generic pricing policies and pCPA initiatives coupled with a weakening Canadian dollar have reduced the gap between Canadian and median PMPRB7 price levels from 49% in Q4-2010 to 30% in Q4-2016. However, price reductions in other countries have offset any greater gains. In Q4-2016, median OECD generic price levels were 33% lower than in Canada, which had the seventh highest prices for generic drugs.
Foreign-to-Canadian price ratios for generic drugs, OECD, Q4-2016
Click on image for larger view
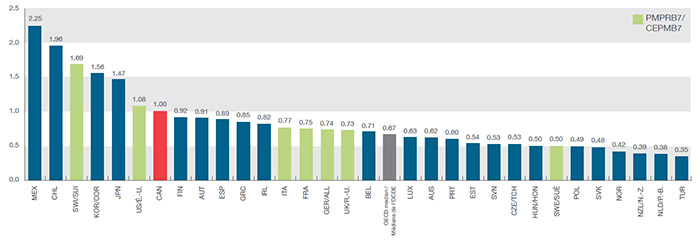
*Note: The OECD median is calculated at the drug level for drugs with prices available in at least three foreign markets.
Figure description
This column graph compares the bilateral foreign-to-Canadian price ratios for Organisation for Economic Co-operation and Development countries for the fourth quarter of 2016. The Canadian generic price level is set to one. Ratios greater than one indicate higher average foreign prices, while ratios less than one indicate lower foreign prices.
blank
| Country |
Foreign-to-Canadian price ratio |
| Mexico |
2.25 |
| Chile |
1.96 |
| Switzerland |
1.69 |
| South Korea |
1.56 |
| Japan |
1.47 |
| United States |
1.08 |
| Finland |
0.92 |
| Austria |
0.91 |
| Spain |
0.89 |
| Greece |
0.85 |
| Ireland |
0.82 |
| Italy |
0.77 |
| France |
0.75 |
| Germany |
0.74 |
| United Kingdom |
0.73 |
| Belgium |
0.71 |
| OECD Median* |
0.67 |
| Luxembourg |
0.63 |
| Australia |
0.62 |
| Portugal |
0.60 |
| Estonia |
0.54 |
| Slovenia |
0.53 |
| Czech Republic |
0.53 |
| Hungary |
0.50 |
| Sweden |
0.50 |
| Poland |
0.49 |
| Slovakia |
0.48 |
| Norway |
0.42 |
| New Zealand |
0.39 |
| Netherlands |
0.38 |
| Turkey |
0.35 |
5. Higher prices for top-selling drugs translated into almost half a billion dollars for public drug plans in 2015/16
To assess the cost implications of foreign-to-Canadian price differentials, 100 top-selling generic drugs were analyzed, accounting for 81% of the total generic drug costs in NPDUIS public plans in 2015/16. Of these, 72 had prices available in three or more PMPRB7 markets in Q4-2016: 59 with lower median foreign prices and 13 with higher prices. If the 59 higher-priced molecules were reduced to the PMPRB7 median price, the potential cost implication would have been $481M or 5.7% of the total NPDUIS public plan drug cost in 2015/16. Conversely, the cost implication of paying lower Canadian prices for the other 13 top-selling drugs was estimated at $89M.
Cost implications ($M) of higher-priced top-selling generic drugs, NPDUIS public plans, 2015/16
Click on image for larger view
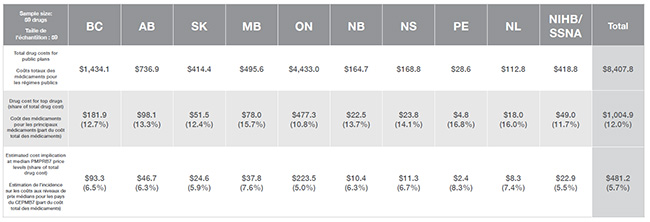
Note: NPDUIS public plans include all provincial public plans (except Quebec) and the federal NIHB plan. Costs based on 2015/16 fiscal year data; median foreign-to-Canadian price ratios for Q4-2016.
Figure description
blank
Sample size:
59 drugs |
British
Columbia |
Alberta |
Saskatchewan |
Manitoba |
Ontario |
New Brunswick |
Nova Scotia |
Prince Edward Island |
Newfoundland
and Labrador |
Non-Insured
Health Benefits |
Total |
| Total drug costs for
public plans |
$1,434.1 |
$736.9 |
$414.4 |
$495.6 |
$4,433.0 |
$164.7 |
$168.8 |
$28.6 |
$112.8 |
$418.8 |
$8,407.8 |
| Drug cost for top drugs (share of total drug cost) |
$181.9
(12.7%) |
$98.1
(13.3%) |
$51.5
(12.4%) |
$78.0
(15.7%) |
$477.3
(10.8%) |
$22.5
(13.7%) |
$23.8
(14.1%) |
$4.8
(16.8%) |
$18.0
(16.0%) |
$49.0
(11.7%) |
$1,004.9
(12.0%) |
| Estimated cost implication at median PMPRB7 price levels (share of total drug cost) |
$93.3
(6.5%) |
$46.7
(6.3%) |
$24.6
(5.9%) |
$37.8
(7.6%) |
$223.5
(5.0%) |
$10.4
(6.3%) |
$11.3
(6.7%) |
$2.4
(8.3%) |
$8.3
(7.4%) |
$22.9
(5.5%) |
$481.2
(5.7%) |
Note: Unless otherwise specified, results reflect manufacturer ex-factory list prices reported in the national retail markets. Price indices are based on local currencies using country-specific sale weights. Average OECD prices and sales are determined by converting all currencies into US dollars.
Source: QuintilesIMS MIDAS™ database. All rights reserved. Public plan drug costs: NPDUIS Database, Canadian Institute for Health Information.
Disclaimer: Although based in part on data provided under license by the QuintilesIMS MIDAS™ Database, the statements, findings, conclusions, views and opinions expressed in this report are exclusively those of the PMPRB and are not attributable to QuintilesIMS.
NPDUIS is a research initiative that operates independently of the regulatory activities of the PMPRB.