Meds Entry Watch, 2015
ISSN: 2560-6204
Catalogue number: H79-12E-PDF
April 2017
PDF - 2.33 MB
The NPDUIS Initiative
The National Prescription Drug Utilization Information System (NPDUIS) is a research initiative established by federal, provincial, and territorial Ministers of Health in September 2001 and is a partnership between the PMPRB and the Canadian Institute for Health Information (CIHI).
Pursuant to section 90 of the Patent Act, the PMPRB has the mandate to generate analysis that provides policy makers and public drug plan managers with critical information and intelligence on price, utilization and cost trends so that Canada’s health care system has more comprehensive and accurate information on how patented and non-patented prescription drugs are being used and on sources of cost pressures.
The specific research topics and methodologies for the NPDUIS reports are established with the guidance of the NPDUIS Advisory Committee and reflect the priorities of the participating jurisdictions. The Advisory Committee is composed of representatives from public drug plans in British Columbia, Alberta, Saskatchewan, Manitoba, Ontario, New Brunswick, Nova Scotia, Prince Edward Island, Newfoundland and Labrador, the Yukon, and Health Canada. It also includes observers from CIHI, the Canadian Agency for Drugs and Technologies in Health (CADTH), the Ministère de la Santé et des Services sociaux Quebec, and the pan-Canadian Pharmaceutical Alliance (pCPA) Office.
Acknowledgements
This report was prepared by the Patented Medicine Prices Review Board (PMPRB) as part of the National Prescription Drug Utilization Information System (NPDUIS).
The PMPRB would like to acknowledge the contributions of:
- The members of the NPDUIS Advisory Committee for their expert oversight and guidance in the preparation of this report.
- PMPRB NPDUIS staff for their contribution to the analytical content of the report:
- Karine Landry – Lead Economic Analyst
- Tanya Potashnik – Director, Policy and Economic Analysis
- Elena Lungu – Manager, NPDUIS
- Gary Warwick – Senior Economic Analyst
- Nevzeta Bosnic – Senior Economic Analyst
- Ai Chau – SAS Analyst
- Carol McKinley – Publications Advisor
Disclaimer
NPDUIS operates independently of the regulatory activities of the Board of the PMPRB. The research priorities, data, statements and opinions expressed or reflected in NPDUIS reports do not represent the position of the PMPRB with respect to any regulatory matter. NPDUIS reports do not contain information that is confidential or privileged under sections 87 and 88 of the Patent Act, and the mention of a drug in a NPDUIS report is not and should not be understood as an admission or denial that the drug is subject to filings under sections 80, 81 or 82 of the Patent Act or that its price is or is not excessive under section 85 of the Patent Act.
Although based in part on data provided under license by the IMS AG MIDAS™ Database, the statements, findings, conclusions, views and opinions expressed in this report are exclusively those of the PMPRB and are not attributable to IMS AG.
Executive Summary
The new PMPRB Meds Entry Watch annual publication explores the market entry dynamics of new drugs launched in Canada and other international markets. This first edition of the report provides both a retrospective analysis of the new drugs launched over a six-year period from 2009 to 2014, and an early analysis of drugs launched in 2015.
The retrospective analysis offers an overview of the historic availability, launch sequence, market penetration, sales and prices of new drugs launched in Canada and other foreign markets from 2009 to 2014. This analysis will be used as a benchmark for subsequent editions, which will report on new drug launches for each respective calendar year.
The early analysis of the drugs launched in 2015 provides detailed drug-level information on their therapeutic profile, international availability and introductory prices. Some of these drugs may already be available in Canada or may be coming soon. The next edition of the Meds Entry Watch will build on this analysis and provide additional up-to-date information on new drugs launched in 2016.
This publication is designed to inform decision makers, researchers and patients of the evolving market dynamics associated with emerging drug therapies in the Canadian and international pharmaceutical environment.
The international markets examined include the seven countries the PMPRB considers in reviewing the prices of patented drugs (PMPRB7): France, Germany, Italy, Sweden, Switzerland, the United Kingdom and the United States.
Key Findings
(A) Meds Entry Watch, 2009 to 2014
1. New active substances (NASs) account for a sizable share of the Canadian and international pharmaceutical market.
- On average, 35 NASs were launched each year between 2009 and 2014, for a total of 210.
- By the last quarter of 2015 (Q4-2015), the sales of these NASs amounted to 21.8% of the total brand-name pharmaceutical market in Canada and the PMPRB7.
- An increasing share of NASs received an orphan drug designation and approval from the US Food and Drug Administration (FDA) and/or the European Medicines Agency (EMA) over the study period: 17% in 2009; an average of 32% from 2010 to 2013; and 47% in 2014.
2. A comparable number of NASs are launched in Canada as in other foreign markets, and all top-selling NASs are available in Canada.
- NAS availability in Canada was similar to the PMPRB7 countries, with more than half of the NASs launched. The NASs available in Canada represented 97% of the total NAS sales for Canada and the PMPRB7 in Q4-2015.
- The average lag time between the initial launch of a NAS and its launch in Canada was comparable to that observed in foreign markets; lag times were shorter for top-selling drugs.
- Canadian list prices for NASs appeared to be in line with those of the European markets analyzed, and markedly lower than those in the US.
3. The top-selling NASs account for most of the sales in Canada and the PMPRB7 and are dominated by the new direct-acting antiviral (DAA) treatments for hepatitis C.
- The 30 top-selling NASs accounted for 74% of the sales in Canada and the PMPRB7, while the 100 top-selling NASs accounted for 98% of sales in Q4-2015.
- The new hepatitis C drugs accounted for 25% of NAS sales and 6% of all drug sales in Canada and the PMPRB7 in Q4-2015.
- Twelve of the 30 top-selling NASs have list prices in hundreds or even thousands of dollars.
(B) Meds Entry Watch, 2015
4. High-priced drugs dominate the NASs launched in 2015, many being biologic, orphan and/or oncology drugs.
- Thirty-five NASs were launched in 2015, consistent with the average in previous years.
- More than half of the NASs launched in the PMPRB7 in 2015 were available in Canada by the end of 2016.
- The share of new drug launches with orphan designations has been on the rise, with 15 (43%) of the NASs launched in 2015 having received an orphan drug designation and approval from the FDA and/or the EMA; this was similar to the share in 2014 but higher than the average in previous years.
- The list prices of most NASs (24 out of 35) were in the hundreds or even thousands of dollars.
Introduction
New drugs enter the Canadian and international markets each year, offering treatment options to patients. While some address unmet medical needs or provide significant therapeutic improvements, many new drugs offer only minor benefits over existing therapies. New drug launches fuel the growth in pharmaceutical costs and put pressure on drug plan expenditures (PMPRB 2017).
The Meds Entry Watch is a new PMPRB annual publication that provides detailed information on recently launched drugs, including their international availability, launch timing, market uptake, sales, and prices, as well as identifies new drugs that may soon be coming to Canada.
These analyses are designed to inform decision makers, researchers and patients of the evolving market dynamics of emerging drug therapies in the Canadian and international pharmaceutical environment.
This first edition of the Meds Entry Watch provides (A) a retrospective analysis of the new drugs launched over a six-year period from 2009 to 2014, which will provide a benchmark for later studies; and (B) a preliminary analysis of drugs launched in 2015. The next edition of the Meds Entry Watch will build on the analysis of the 2015 drug launches and present up-to-date information on new drugs launched in 2016. Subsequent editions of the report will focus on the new drugs launched in each respective calendar year.
Methods
This report identifies the new active substances (NASs) launched in Canada and in other international markets between January 1, 2009, and December 31, 2014, and analyzes their uptake, pricing, sales and availability as of the last quarter of 2015 (Q4-2015). For the purpose of this study, drugs were reported at the active chemical substance level.
The international markets examined include the seven countries the PMPRB considers in reviewing the prices of patented drugs (PMPRB7): France, Germany, Italy, Sweden, Switzerland, the United Kingdom (UK) and the United States (US).
A NAS was considered to be launched if it recorded first sales in the retail or hospital sectors in Canada or in any of the international markets examined, based on the data reported in IMS AG’s MIDAS™ Database. For the Canadian market, NAS availability was further cross-referenced against Health Canada’s Drug Product Database (DPD) and the Notice of Compliance (NOC) database to ensure that all NASs authorized for sale in Canada were accurately identified. Using these criteria, 210 drugs were selected for the retrospective analysis from 2009 to 2014 in Section A; and 35 drugs were identified for the preliminary analysis in Section B.
The main data source for launch dates, drug sales and pricing was IMS AG’s MIDASTM Database (all rights reserved). MIDASTM data reflects the national retail and hospital sectors for each country and includes drug sales, list prices and the physical quantity of drugs used in the public, private and out-of-pocket market segments. The Canadian and international prices reported in MIDASTM are manufacturer ex-factory list prices. Sales and volume data encompass all versions of a substance available in a particular country, produced by any manufacturer in any strength and form. International price comparisons at the individual drug level are restricted to molecules with the same form, strength and volume.
Market spot exchange rates were used to convert foreign currency prices into their Canadian dollar equivalents. Foreign currencies were converted to Canadian dollars using the 12-month or 3-month average exchange rate for the year or the quarter, respectively.
Supplementary information related to the definition and calculation of the measures of central tendency and average foreign-to-Canadian price ratios is available as an online resource (see the Reference Documents section of the Analytical Studies page of the PMPRB website).
Limitations
The identification of drug launches in each country was based on the availability of sales in the MIDAS™ Database. Drugs with low sales may not be reported in the database, and thus, the number of new active substances launched in any given country may be slightly under-reported. However, this should only have a minimal impact on the overall sales results.
While a substance was considered to be launched if it recorded first sales in Canada or in any other international market analyzed during the study period, the substance may have been launched earlier than indicated by the available sales data. In addition, a NAS may have been launched at an earlier date in a foreign market not examined in this report.
For the Canadian market, NAS availability was further cross-referenced against Health Canada’s drug approval information, and it may capture drugs not yet marketed in Canada over the study period.
Canadian and international sales and prices available in the IMS MIDAS™ Database are estimated manufacturer factory-gate list prices and do not reflect off-invoice price rebates and allowances, managed entry agreements, or patient access schemes. Manufacturer list prices may be different from other price points in the distribution chain, such as wholesaler or pharmacy retail prices.
The methodology that MIDAS™ uses for estimating drug prices varies by country depending on the distribution system and the availability of public data. This data includes the manufacturer’s list price, the wholesale price, and the pharmacy price in specific markets. Manufacturer, wholesale or retail prices may represent estimates based on assumed regulated margins and/or markups.
The variations in utilization among countries may be due to differences in relevant market considerations, such as the demographic and disease profiles of the populations, or regulating and/or reimbursement policies.
International sales and pricing data are heavily skewed towards the United States due to its relatively large population, and as a result, the ranking of drugs by international sales generally reflects the order of drug sales in the United States.
Drugs accessed through the Special Access Program (SAP) in Canada are not captured in this report.
A Meds Entry Watch, 2009 to 2014
A1. Overview of Canadian and international markets
On average, 35 new active substances (NASs) were launched annually in Canada and the PMPRB comparator countries from 2009 to 2014, with cumulative sales amounting to over one fifth (21.8%) of the entire brand-name pharmaceutical market by the last quarter of 2015 (Q4-2015). The sales of NASs were highly concentrated, with a small number of drugs accounting for a large proportion of the new drug sales.
The majority of NASs that were launched internationally were also available in Canada; these drugs accounted for almost all (97%) of the NAS sales in the markets analyzed. Canada accounts for a sizable share of the international market for NASs.
The international markets examined include the seven countries the PMPRB considers in reviewing the prices of patented drugs (PMPRB7): France, Germany, Italy, Sweden, Switzerland, the United Kingdom and the United States.
Between 2009 and 2014, 210 NASs were launched in Canada and the PMPRB7, ranging from 27 to 47 NASs per year (Figure A1.1). An increasing share of NASs received an orphan drug designation and approval from the US Food and Drug Administration (FDA) and/or the European Medicines Agency (EMA) over the study period: 17% in 2009; an average of 32% from 2010 to 2013; and 47% in 2014. Figure A1.1 also depicts the cumulative market share for NASs launched in (a) both Canada and the PMPRB7, and (b) Canada only.
Figure A1.1 Cumulative NAS share of all brand-name drug sales, by launch year (2009‒2014), Canada and the PMPRB7*
Click on image for larger view
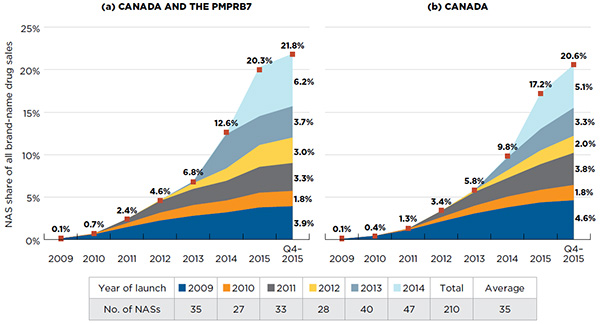
Figure description
This figure consists of two area graphs depicting the new active substance cumulative share of total brand-name drug sales. It focuses on new active substances launched from 2009 to 2014 and gives the percentage of their yearly sales up to the fourth quarter of 2015. The first graph is for both Canada and the PMPRB comparator countries and the second is for Canada alone. The appended table shows the number of new active substances introduced in Canada and the PMPRB comparator countries each year.
blank
| Year of introduction |
Number of new active substances |
| 2009 |
35 |
| 2010 |
27 |
| 2011 |
33 |
| 2012 |
28 |
| 2013 |
40 |
| 2014 |
47 |
| Total |
210 |
Share of sales for Canada and PMPRB comparator countries
blank
| Year of introduction |
2009 |
2010 |
2011 |
2012 |
2013 |
2014 |
2015 |
2015 fourth quarter |
| 2009 |
0.1% |
0.6% |
1.4% |
2.2% |
2.7% |
3.1% |
3.8% |
3.9% |
| 2010 |
|
0.1% |
0.5% |
0.9% |
1.2% |
1.4% |
1.7% |
1.8% |
| 2011 |
|
|
0.5% |
1.4% |
1.9% |
2.3% |
3.0% |
3.3% |
| 2012 |
|
|
|
0.1% |
0.7% |
1.5% |
2.6% |
3.0% |
| 2013 |
|
|
|
|
0.2% |
4.1% |
3.4% |
3.7% |
| 2014 |
|
|
|
|
|
0.2% |
5.8% |
6.2% |
| Total |
0.1% |
0.7% |
2.4% |
4.6% |
6.8% |
12.6% |
20.3% |
21.8% |
Share of sales for Canada alone
blank
| Year of introduction |
2009 |
2010 |
2011 |
2012 |
2013 |
2014 |
2015 |
2015 fourth quarter |
| 2009 |
0.1% |
0.4% |
1.1% |
2.1% |
3.0% |
3.8% |
4.3% |
4.6% |
| 2010 |
|
0.0% |
0.1% |
0.5% |
0.9% |
1.3% |
1.5% |
1.8% |
| 2011 |
|
|
0.0% |
0.7% |
1.6% |
2.2% |
3.0% |
3.3% |
| 2012 |
|
|
|
0.0% |
0.2% |
0.9% |
1.6% |
3.0% |
| 2013 |
|
|
|
|
0.0% |
1.5% |
2.5% |
3.7% |
| 2014 |
|
|
|
|
|
0.1% |
4.2% |
6.2% |
| Total |
0.1% |
0.4% |
1.3% |
3.4% |
5.8% |
9.8% |
17.2% |
20.6% |
Note: New active substances (NASs) launched between 2009 and 2014. A NAS was considered to be launched in a particular country once sales data was available in MIDAS™. For this analysis, launches in the Canadian market were solely based on available MIDAS™ sales.
Sales are based on manufacturer list prices.
*France, Germany, Italy, Sweden, Switzerland, United Kingdom and the United States.
Source: MIDAS™ Database, 2009 to 2015, IMS AG. All rights reserved.
In any given year, the impact of NASs on pharmaceutical sales depends on the number and therapeutic relevance of the drugs being launched. For instance, the NASs launched in 2014 had a very high impact on sales, mainly driven by the new direct-acting antiviral (DAA) treatments for hepatitis C. Harvoni alone accounted for 4.0% of the total brand-name drug sales for all of the markets analysed in 2015. In Canada, the sales for Harvoni reached $595 million in 2015, representing 3.8% of all brand-name drug sales.
Cumulatively, NASs had a steep year-over-year uptake in sales. By Q4-2015, NAS sales reached 21.8% of the total brand-name pharmaceutical market for Canada and the PMPRB7, and 20.6% for Canada.
Canada accounts for a sizable share of the international market for NASs. Figure A1.2 reports the country-specific market share for (a) NASs and (b) all brand-name drugs in Q4-2015. In terms of sales, Canada’s share of the international market for NASs (2.8%) is comparable to its share of the brand-name drug market in general (3.0%). Canada’s share of the PMPRB7 market in terms of utilization (quantity) is greater than its share of sales both for NASs and for all brand-name drugs (7.5% and 5.8%, respectively).
Figure A1.2 Market share by country for NASs and all brand-name drugs, by volume of sales and units, Canada and the PMPRB7*, Q4-2015
Click on image for larger view
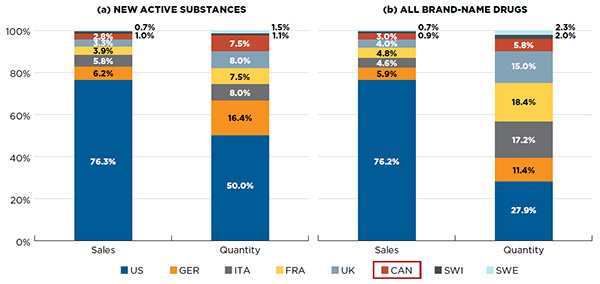
Figure description
This stacked bar graph depicts the market share for Canada and the seven PMPRB comparator countries by sales and quantity for (a) new active substances and (b) all brand-name drugs in the last quarter of 2015.
New active substances
| |
Canada |
France |
Germany |
Italy |
Sweden |
Switzerland |
United Kingdom |
United States |
| Sales |
2.8% |
3.9% |
6.2% |
5.8% |
0.7% |
1.0% |
3.3% |
76.3% |
| Quantity |
7.5% |
7.5% |
16.4% |
8.0% |
1.5% |
1.1% |
8.0% |
50.0% |
All brand-name drugs
| |
Canada |
France |
Germany |
Italy |
Sweden |
Switzerland |
United Kingdom |
United States |
| Sales |
3.0% |
4.8% |
5.9% |
4.6% |
0.7% |
0.9% |
4.0% |
76.2% |
| Quantity |
5.8% |
18.4% |
11.4% |
17.2% |
2.3% |
2.0% |
15.0% |
27.9% |
Note: New active substances (NASs) launched between 2009 and 2014. A NAS was considered to be launched in a particular country once sales data was available in MIDAS™. For this analysis, launches in the Canadian market were solely based on available MIDAS™ sales.
Sales are based on manufacturer list prices.
*France, Germany, Italy, Sweden, Switzerland, United Kingdom and the United States.
Source: MIDAS™ Database, 2015, IMS AG. All rights reserved.
In general, pharmaceutical sales are highly concentrated, with a small number of drugs accounting for a large proportion of sales. This also applies to NASs. Figure A1.3 depicts the sales concentration of the 210 NASs launched from 2009 to 2014. The 30 top-selling NASs accounted for three-quarters (74%) of the total NAS sales in Q4-2015. These drugs had individual drug-level sales exceeding $250 million in Canada and the PMPRB7 in Q4-2015.
Most of the remaining sales (24%) were accounted for by the 70 NASs with Q4-2015 sales ranging from $25 million to $250 million. NASs with drug-level sales of less than $25 million made up the majority (110) of the drugs, but only represented 2% of the total sales.
Figure A1.3 Sales concentration of NASs, Canada and the PMPRB7*, Q4-2015
Click on image for larger view
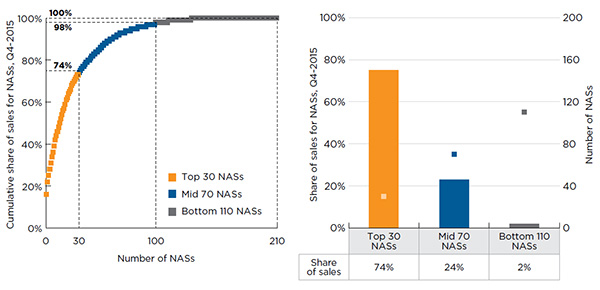
Figure description
These two graphs depict the sales concentration of new active substances in Canada and the PMPRB7 as of the fourth quarter of 2015. Both graphs show the distribution in the share of sales for the top 30, mid 70 and bottom 110 selling new active substances. The first is a plotted graph that shows a parabolic curve of the cumulative distribution of new active substances from highest to lowest share of sales. The second is a bar graph.
blank
| |
Top 30 new active substances |
Mid 70 new active substances |
Bottom 110 new active substances |
| Share of sales |
74% |
24% |
2% |
Note: New active substances (NASs) launched between 2009 and 2014. A NAS was considered to be launched in a particular country once sales data was available in MIDAS™. For this analysis, launches in the Canadian market were solely based on available MIDAS™ sales.
Sales are based on manufacturer list prices.
*France, Germany, Italy, Sweden, Switzerland, United Kingdom and the United States.
Source: MIDAS™ Database, 2009 to 2015, IMS AG. All rights reserved.
A closer look at the availability of NASs by country suggests that while larger markets tend to launch more drugs, Canada launched an appreciable number of NASs relative to its population. Furthermore, the drugs launched in Canada accounted for all but 3% of the total NAS sales in the markets analyzed.
Figure A1.4 reports the number and share of NASs launched between 2009 and 2014 by country, along with their corresponding share of total NAS sales for Canada and the PMPRB7 in Q4-2015. The countries are ranked by the number of NASs launched, and the population of each country is given in the accompanying table.
Figure A1.4 Number of NASs launched and their respective share of NAS sales in Canada and the PMPRB7*, Q4-2015
Click on image for larger view
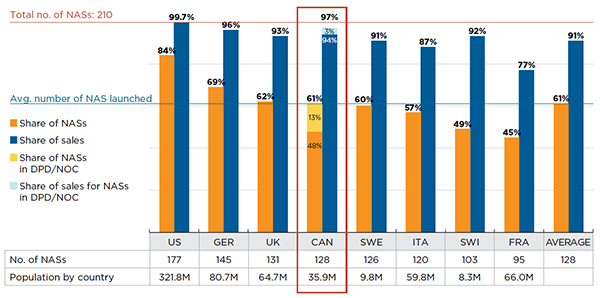
Figure description
This bar graph gives the share of the number and sales of the 210 new active substances launched between 2009 and 2014 in Canada and the PMPRB7 for each of the countries analyzed, as of the fourth quarter of 2015. For Canada, the total shares include substances identified using the MIDAS Database as well as additional new active substances identified using Health Canada’s Drug Product Database and the Notice of Compliance database. For example, 61% of the new active substances were available in Canada, of this 48% were identified using MIDAS and 13% were identified using the other databases. This 61% represented a total share of 97% of sales, of which 94% were identified through MIDAS. A table below the graph gives the number of new active substances launched as well as the population of each country.
blank
| |
United States |
Germany |
United Kingdom |
Canada |
Sweden |
Italy |
Switzerland |
France |
Average |
| Share of new active substances |
84% |
69% |
62% |
61% total |
60% |
57% |
49% |
45% |
61% |
| Share of sales for new active substances |
99.7% |
96% |
93% |
97% total |
91% |
87% |
92% |
77% |
91% |
| Number of new active substances launched |
177 |
145 |
131 |
128 |
126 |
120 |
103 |
95 |
128 |
| Population (millions) |
321.8 |
80.7 |
64.7 |
35.9 |
9.8 |
59.8 |
8.3 |
66.0 |
|
Note: New active substances (NASs) launched between 2009 and 2014. A NAS was considered to be launched in a particular country once sales data was available in MIDAS™. For the Canadian market, Health Canada’s Drug Product Database (DPD) and the Notice of Compliance (NOC) database were cross-referenced to ensure that all NASs authorized for sale in Canada were accurately identified.
Sales are based on manufacturer list prices.
*France, Germany, Italy, Sweden, Switzerland, United Kingdom and the United States.
Sources: MIDAS™ Database, 2009 to 2015, IMS AG. All rights reserved.
Health Canada’s Drug Product Database and Notice of Compliance database.
The results indicate that Canadian NAS availability is in line with the other markets analyzed. Of the 210 NASs launched, 61% (128) were available in Canada. Of these drugs, 101 had MIDAS™ sales data and the other 27Footnote 1 were identified as either marketed or approved for sale in Canada based on Health Canada’s Drug Product Database and the Notice of Compliance database. While the US market launched the most new drugs (84%), the results suggest that no country launched all NASs.
The drugs that were available in Canada accounted for 97% of the total NAS sales, while those that were not available as of Q4-2015 represented only 3% of the NAS sales.
These results suggest that while the size of the market may be an important consideration in where a NAS is launched, it is not the only one.
Appendix I reports the share of the 210 NASs launched between 2009 and 2014 by OECD country (Organisation for Economic Co-operation and Development), along with their corresponding share of total NAS OECD sales in Q4-2015.
A drug-level analysis indicates that all 30 top-selling drugs depicted in Figure A1.3 were launched in Canada, as well as in the United States, Germany and Switzerland. The remaining PMPRB7 countries launched fewer top-selling drugs, ranging from 23 to 29 NASs. Section A4 provides additional insight into the uptake and timing of the launches of the 30 top-selling NASs.
In terms of which NASs are available, Canada has the greatest similarity to the United StatesFootnote 2. Figure A1.5 provides bilateral results of the overlap between the NASs launched in Canada and in each of the PMPRB7 countries. For example, of the 128 NASs available in Canada, 123 were also launched in the US; 5 were available in Canada but not in the US; and 54 additional NASs were launched in the US but not in Canada.
Figure A1.5 Comparison of the number of NASs available in Canada with those launched in PMPRB7*, Q4-2015
Click on image for larger view
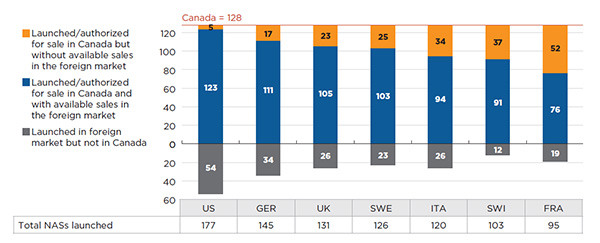
Figure description
This bar graph compares the number of new active substances available in Canada in the fourth quarter of 2015 (128) with the number launched in each of the PMPRB comparator countries.
blank
| |
United States |
Germany |
United Kingdom |
Sweden |
Italy |
Switzerland |
France |
| Launched/authorized for sale in Canada but without available sales in the foreign market |
5 |
17 |
23 |
25 |
34 |
37 |
52 |
| Launched/authorized for sale in Canada and with available sales in the foreign market |
123 |
111 |
105 |
103 |
94 |
91 |
76 |
| Launched in foreign market but not in Canada |
54 |
34 |
26 |
23 |
26 |
12 |
19 |
| Total new active substances launched |
177 |
145 |
131 |
126 |
120 |
103 |
95 |
Note: New active substances (NASs) launched between 2009 and 2014. A NAS was considered to be launched in a particular country once sales data was available in MIDAS™. For the Canadian market, Health Canada’s Drug Product Database and the Notice of Compliance database were cross-referenced to ensure that all NASs authorized for sale in Canada were accurately identified.
*France, Germany, Italy, Sweden, Switzerland, United Kingdom and the United States.
Source: MIDAS™ Database, October‒December 2015, IMS AG. All rights reserved.
A2. International launch sequence and lag time
Canada falls well within the range of the PMPRB7 countries with respect to both the launch sequence and lag time of NASs. Drugs are generally launched in Canada before Switzerland, Italy and France, but after the United States, Sweden, Germany and the United Kingdom. The time taken between the initial launch of an NAS internationally and its launch in Canada is comparable to the average launch lag time for the PMPRB7 countries. Top-selling drugs tend to have a shorter lag time to launch in Canada.
The first country of launch for 86% of the NASs was either the United States or Sweden. The US market, which had the highest share of NAS sales in Q4-2015 (76.3% - see Figure A1.2), was the first market of launch for 67.1% of the NASs. In contrast, Sweden, which was the smallest market analyzed (0.7% of sales), was the first market for most of the remaining launches (19.0%). Germany, the second largest market in Q4-2015 (6.2% of NAS sales), was the first country of launch for a smaller share of the drugs (3.8%). Two drugs were first launched in Canada, one of which is a top-selling product. Section A4 provides detailed information on the launch sequence for the top-selling NASs (Table A4.2).
These results suggest that the size of the market is not always a determinant in the launching sequence, which may also depend on other business and market dynamic considerations.
Figure A2.1 Number of NASs launched by the country of first launch and respective market share,
Canada and the PMPRB7*, Q4-2015
Click on image for larger view
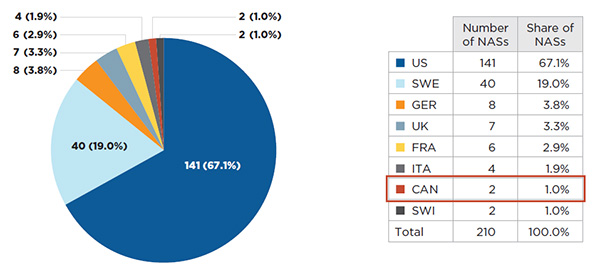
Figure description
This pie chart gives the number of new active substances launched by the country of first launch, along with the respective market share in Canada and seven PMPRB comparator countries for the fourth quarter of 2015.
blank
| Country |
Number of new active substances |
Share of new active substances |
| United States |
141 |
67.1% |
| Sweden |
40 |
19.0% |
| Germany |
8 |
3.8% |
| United Kingdom |
7 |
3.3% |
| France |
6 |
2.9% |
| Italy |
4 |
1.9% |
| Canada |
2 |
1.0% |
| Switzerland |
2 |
1.0% |
| Total |
210 |
100.0% |
Note: New active substances (NASs) launched between 2009 and 2014. A NAS was considered to be launched in a particular country once sales data was available in MIDAS™. For this analysis, launches in the Canadian market were solely based on available MIDAS™ sales.
Sales are based on manufacturer list prices.
*France, Germany, Italy, Sweden, Switzerland, United Kingdom and the United States.
Source: MIDAS™ Database, October‒December 2015, IMS AG. All rights reserved.
The majority of NASs were launched in Canada before they were launched in Switzerland, Italy and France; while the United States, Sweden, Germany and the United Kingdom tended to have earlier availability than Canada. Table A2.1 reports the number and share of NASs launched in Canada before being launched in a specific foreign market. For instance, of the 101 NASs launched in Canada between 2009 and 2014, 6 drugs (6%) were launched in Canada before the US, while 57 drugs (69%) were launched in Canada before being launched in Italy.
Table A2.1 Number and share of NASs launched in Canada before foreign markets by country, PMPRB7*
| |
Number of NASs |
Share of NASs |
Sample size
(NASs available in both Canada and
comparator country) |
| United States |
6 |
6% |
99 |
| Sweden |
17 |
19% |
88 |
| United Kingdom |
30 |
33% |
92 |
| Germany |
36 |
39% |
92 |
| France |
47 |
68% |
69 |
| Switzerland |
50 |
58% |
86 |
| Italy |
57 |
69% |
83 |
| Any PMPRB7 country |
2 |
2% |
101 |
Note: New active substances (NASs) launched between 2009 and 2014. A NAS was considered to be launched in a particular country once sales data was available in MIDAS™. For this analysis, launches in the Canadian market were solely based on available MIDAS™ sales.
*France, Germany, Italy, Sweden, Switzerland, United Kingdom and the United States.
Source: MIDAS™ Database, October‒December 2015, IMS AG. All rights reserved.
For the 210 NASs analyzed, the median lag time to launch in Canada fell within the middle of the range for the PMPRB7. The lag time is the number of months from the first launch in any of the markets analyzed to the launch in a particular country. The lag time was determined at the product level.
For this analysis, launches in the Canadian market were solely based on the 101 NASs with sales data available in the MIDAS™ Database.
Table A2.2 reports the sales-weighted average and median lag time to launch by country for the NASs in each sample. The country of first launch was excluded from the analysis for that market. For instance, the small sample size for the US market (36) is due to the fact that the United States was the country of first launch for most NASs (141).
The United States, Sweden, Germany and the United Kingdom, which were among the first countries to launch NASs, have the shortest lag times to launch for the remaining drugs, with a weighted average and a median of up to 9 months. The Canadian weighted average lag time was 8 months and the median was 11 months, which was similar to Switzerland and shorter than France and Italy (up to 15 months).
Table A2.2 Lag time to launch* for NASs, by country, Canada and the PMPRB7†
| |
Weighted average
lag (months) |
Median lag (months) |
Number of NASs in
sample‡ |
| United States |
9 |
8 |
36 |
| Sweden |
5 |
6 |
86 |
| France |
13 |
15 |
89 |
| Canada |
8 |
11 |
99 |
| Switzerland |
11 |
11 |
101 |
| Italy |
14 |
15 |
116 |
| United Kingdom |
7 |
7 |
124 |
| Germany |
8 |
6 |
137 |
| Total Canada and PMPRB7 |
10 |
10 |
210 |
Note: New active substances (NASs) launched between 2009 and 2014. A NAS was considered to be launched in a particular country once sales data was available in MIDAS™. For this analysis, launches in the Canadian market were solely based on available MIDAS™ sales.
*The number of months from the first launch in any of the markets analyzed (Canada and the PMPRB7) determined at the product and country level.
†France, Germany, Italy, Sweden, Switzerland, United Kingdom and the United States.
‡The country of first launch was excluded from the analysis for that market.
Source: MIDAS™ Database, October‒December 2015, IMS AG. All rights reserved.
While Table A2.2 provides an overall assessment of the lag time to launch for all NASs, results vary greatly by drug. Figure A2.2 reports the Canadian lag time to launch for NASs by market share and indicates that lag times are shorter for drugs with higher sales. The 10 top-selling NASs, which accounted for 44% of all NAS sales in Q4-2015, were launched in Canada within approximately 3 months of their first international launch. In contrast, the rest of the drugs, had a median lag time of 11 months.
Figure A2.2 Canadian lag time to launch for NASs by market share, Q4-2015
Click on image for larger view

Figure description
This line graph depicts the relationship between the Canadian lag time to launch for new active substances and their share of sales in Canada and PMPRB comparator countries. The results are based on five sales groupings: top 10; 11 to 30; 31 to 50; 51 to 70; and 71 to 101.
blank
| |
Top 10 |
11 to 30 |
31 to 50 |
51 to 70 |
71 to 101 |
| Share of sales |
44% |
30% |
12% |
5% |
3% |
| Canadian average lag (months) |
3 |
11 |
10 |
9 |
12 |
Note: New active substances (NASs) launched between 2009 and 2014. A NAS was considered to be launched in a particular country once sales data was available in MIDAS™. For this analysis, launches in the Canadian market were solely based on available MIDAS™ sales.
*France, Germany, Italy, Sweden, Switzerland, United Kingdom and the United States.
Source: MIDAS™ Database, 2009 to 2015, IMS AG. All rights reserved.
The PMPRB's scientific review process provides recommendations on the level of therapeutic improvement of new patented drug productsFootnote 3. Based on this information, an analysis of the launch lag time by level of therapeutic improvement was also carried out. The results suggest that there is no appreciable difference in the lag time to launch based on the level of therapeutic improvement over existing drugs. The 10 NASs that were categorized as breakthrough drugs or as providing a substantial improvement had a median lag time of 10 months; while the NASs categorized as having a moderate improvement or slight to no improvement also had a median lag of 10 months.
A3. International price comparison
Canadian prices for new drugs are generally in line with those observed in the European markets analyzed, and considerably below those in the US market.
This section reports the average foreign-to-Canadian price ratios for a variety of bilateral and multilateral measuresFootnote 4. Bilateral price ratios compare the list price levels for an individual country to those available in Canada. Multilateral ratios compare the list prices across all countries analyzed to those available in Canada.
The bilateral foreign-to-Canadian price ratios for Q4-2015 are reported in Figure A3.1. The results are expressed as an index with the Canadian price set to a value of one, and the international measures reported relative to this value; a result above the value of one indicates correspondingly higher average prices in foreign markets.
While the prices of patented drugs in most of the foreign markets analyzed generally tend to be lower than in Canada (PMPRB 2016), the foreign prices for NASs are either in line or slightly above the Canadian levels. These results suggest that at introduction Canadian prices are in line with international levels, but as drug markets mature, foreign prices decline relative to Canadian levels. Prices in the United States are markedly higher than in Canada and the other PMPRB7 markets for both NASs and patented drugs in general.
Figure A3.1 Average bilateral foreign-to-Canadian price ratios for NASs
PMPRB7*, Q4-2015
Click on image for larger view
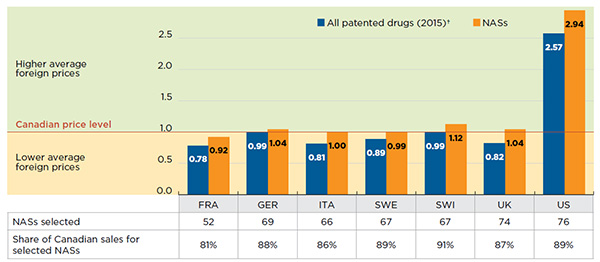
Figure description
This column graph shows the average bilateral foreign-to-Canadian price ratios for (1) all patented drugs in 2015 and (2) new active substances in the fourth quarter of 2015. Ratios are expressed as an index with the Canadian price level set to one. The number of new active substances selected for analysis and their share of Canadian NAS sales is given in an accompanying table.
blank
| |
France |
Germany |
Italy |
Sweden |
Switzerland |
United Kingdom |
United States |
| Foreign-to-Canadian price ratios for all patented drugs |
0.78 |
0.99 |
0.81 |
0.89 |
0.99 |
0.82 |
2.57 |
| Foreign-to-Canadian price ratios for new active substances |
0.92 |
1.04 |
1.00 |
0.99 |
1.12 |
1.04 |
2.94 |
| Number of new active substances selected |
52 |
69 |
66 |
67 |
67 |
74 |
76 |
| Share of Canadian sales for selected substances |
81% |
88% |
86% |
89% |
91% |
87% |
89% |
Note: New active substances (NASs) launched between 2009 and 2014. A NAS was considered to be launched in a particular country once sales data was available in MIDAS™. For this analysis, launches in the Canadian market were solely based on available MIDAS™ sales.
Prices reported are manufacturer list prices.
*France, Germany, Italy, Sweden, Switzerland, United Kingdom and the United States.
†PMPRB Annual Report 2015.
Source: MIDAS™ Database, October‒December 2015, IMS AG. All rights reserved.
The Q4-2015 multilateral foreign-to-Canadian price ratios are reported in Figure A3.2 and include results based on the mean, median, minimum and maximum foreign prices. Two sets of results are presented: (i) for all PMPRB7 markets; and (ii) for all PMPRB7 markets except the United States, which limits the results to markets with price regulations.
The median foreign prices for new drugs are 6% above the Canadian levels when all PMPRB7 countries are considered, but only 2% above when the United States is excluded.
Figure A3.2 Average multilateral foreign-to-Canadian price ratios for NASs
PMPRB7*, Q4-2015
Click on image for larger view
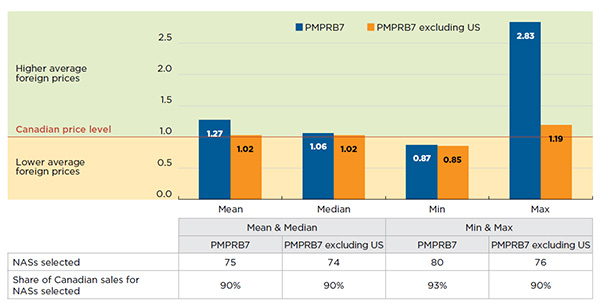
Figure description
This column graph depicts the average multilateral foreign-to-Canadian price ratios for new active substances in the fourth quarter of 2015. Ratios are expressed as an index with the Canadian price level set to one. One set of bars shows the mean, median, minimum and maximum for all of the PMPRB comparator countries, while the other set gives the price ratios for all of the PMPRB comparator countries except the United States.
blank
| |
Mean |
Median |
Minimum |
Maximum |
| PMPRB comparator countries |
1.27 |
1.06 |
0.87 |
2.83 |
| PMPRB comparator countries except the United States |
1.02 |
1.02 |
0.85 |
1.19 |
| Number of new active substances selected |
75 |
74 |
80 |
76 |
| Share of Canadian sales for new active substances selected |
90% |
90% |
93% |
90% |
Note: New active substances (NASs) launched between 2009 and 2014. A NAS was considered to be launched in a particular country once sales data was available in MIDAS™. For this analysis, launches in the Canadian market were solely based on available MIDAS™ sales.
The minimum and maximum values were calculated for drugs with prices available in at least two foreign markets.
The mean and median values were calculated for drugs with prices available in at least three foreign markets.
Prices reported are manufacturer list prices.
*France, Germany, Italy, Sweden, Switzerland, United Kingdom and the United States.
Source: MIDAS™ Database, October‒December 2015, IMS AG. All rights reserved.
A4. Drug-level analysis of Canadian launches
Most of the 210 NASs launched in foreign markets from 2009 to 2014 were also launched in Canada by the end of 2015 (61%). Those that were launched in Canada accounted for almost all of the Canadian and PMPRB7 NAS sales (97%).
Click on image for larger view

Figure description
These two pie charts show the share and number of new active substances launched in Canada versus those not launched in Canada along with their corresponding share of sales in Canada and PMPRB comparator countries.
blank
| |
Launched in Canada |
Not launched in Canada |
| Share of new active substances |
61% |
39% |
| Number of new active substances |
128 |
82 |
| Share of sales in Canada and the PMPRB comparator countries |
97% |
3% |
Note: New active substances (NASs) launched between 2009 and 2014. A NAS was considered to be launched in a particular country once sales data was available in MIDAS™. For the Canadian market, Health Canada’s Drug Product Database and the Notice of Compliance database were cross-referenced to ensure that all NASs authorized for sale in Canada were accurately identified.
*France, Germany, Italy, Sweden, Switzerland, United Kingdom and the United States.
Source: MIDAS™ Database, 2015, IMS AG. All rights reserved.
The drugs launched in the Canadian market included many of the top-selling NASs, with the 30 top-selling drugs accounting for nearly three quarters of the NAS sales. A close examination of these drugs suggests that only a few offer a substantial or moderate level of improvement over existing drugs, while the majority offer a slight or no improvement. These drugs generally received conditional listing recommendations in Canada following their health technology assessments, and were usually reimbursed by the majority of the Canadian public drug plansFootnote 5.
While the NASs launched in Canada and the PMPRB7 from 2009 to 2014 covered a broad spectrum of therapeutic classes, their sales were concentrated within only a few. Figure A4.1 reports the share of NASs launched in Canada by anatomical classification, as well as the respective share of sales in Canada and the PMPRB7. The results are presented for the top 10 therapeutic classes at level 2 of the Anatomical Classification of Pharmaceutical ProductsFootnote 6.
Figure A4.1 NASs by the top 10 anatomical classifications*, Canada and the PMPRB7†, Q4-2015
Click on image for larger view
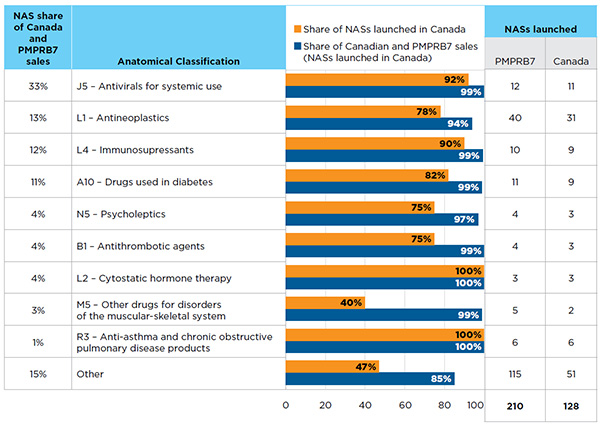
Figure description
This horizontal bar graph and associated table depict the share of new active substances launched in Canada in the fourth quarter of 2015 by top 10 therapeutic classes. The associated share of sales in Canada and the PMPRB comparator countries is also given.
blank
| Anatomical Classification |
New active substances share of sales, Canada and PMPRB7 |
Share of new active substances launched in Canada |
Share of sales for Canada and PMPRB comparator countries for new active substances launched in Canada |
Number of new active substances launched in the PMPRB comparator countries |
Number of new active substances launched in Canada |
| J5 - Antivirals for systemic use |
33% |
92% |
99% |
12 |
11 |
| L1 - Antineoplastics |
13% |
78% |
94% |
40 |
31 |
| L4 - Immunosupressants |
12% |
90% |
99% |
10 |
9 |
| A10 - drugs used in diabetes |
11% |
82% |
99% |
11 |
9 |
| N5 - Psycholeptics |
4% |
75% |
97% |
4 |
3 |
| B1 - Antithrombotic agents |
4% |
75% |
99% |
4 |
3 |
| L2 - Cytostatic hormone therapy |
4% |
100% |
100% |
3 |
3 |
| M5 - Other drugs for disorders of the muscular-skeletal system |
3% |
40% |
99% |
5 |
2 |
| A2 - Anti-asthma and chronic obstructive pulmonary disease products |
1% |
100% |
100% |
6 |
6 |
| Other |
15% |
47% |
85% |
115 |
51 |
| Total |
|
|
|
210 |
128 |
Note: New active substances (NASs) launched between 2009 and 2014. A NAS was considered to be launched in a particular country once sales data was available in MIDAS™. For the Canadian market, Health Canada’s Drug Product Database and the Notice of Compliance database were cross-referenced to ensure that all NASs authorized for sale in Canada were accurately identified.
Sales are based on manufacturer list prices.
*IMS AG Anatomical Therapeutic Classification level 2.
†France, Germany, Italy, Sweden, Switzerland, United Kingdom and the United States.
Source: MIDAS™ Database, 2009 to 2015, IMS AG. All rights reserved.
Antivirals, which include the new direct-acting antiviral (DAA) treatments for hepatitis C, are at the top of the list, accounting for the largest share of NAS sales (33%) in Q4-2015. Antineoplastic agents, immunosuppressants and diabetes drugs also had a high share of sales, accounting for 13%, 12% and 11%, respectively.
Most of the NASs in the top-selling therapeutic classes were available in Canada. For example, 11 of the 12 NASs (92%) in the antivirals class and 9 out of 10 NASs (90%) in the immunosuppressant class were launched in Canada. Other top-selling classes with high rates of availability in Canada (75% to 82%) included: antineoplastics, drugs used in diabetes, psycholeptics and antithrombotic agents. All of the NASs related to cytostatic hormone therapy and anti-asthma and chronic obstructive pulmonary disease products were available in Canada. The NASs available in Canada accounted for 94% or more of the total sales within their respective class.
For the “other” therapeutic class category with lower sales levels, less than half of the NASs were available in Canada, but those that were available accounted for an average of 85% of the sales in their respective classes.
Table A4.1 focuses a lens on the 30 top-selling NASs launched in Canada and the PMPRB7 from 2009 to 2014. These drugs represented 74.5% of the total NAS sales in all countries analyzed and 85.7% of Canadian sales in Q4-2015.
Table A4.1 The 30 top-selling NASs, Canada and PMPRB7*, Q4-2015
Click on image for larger view
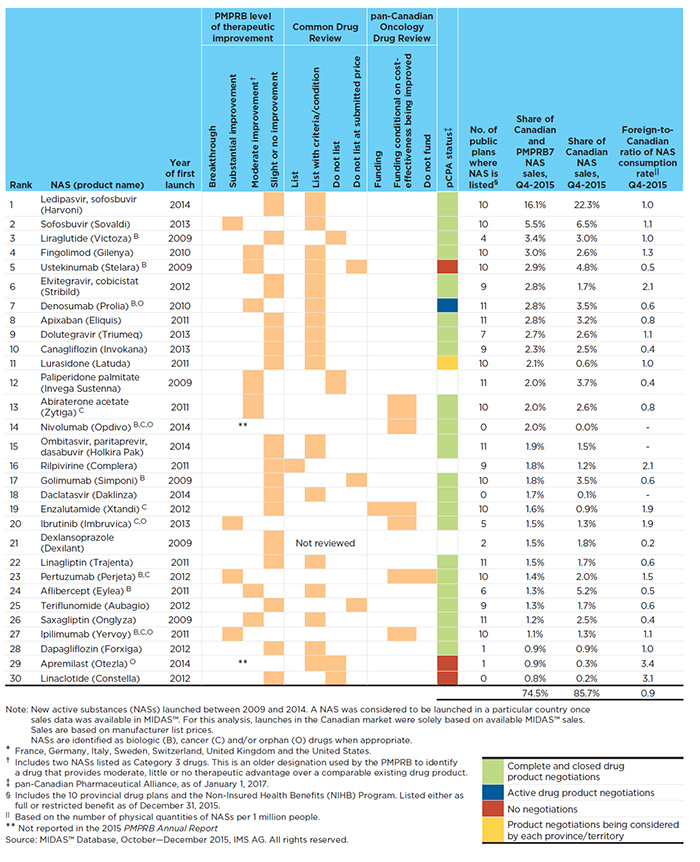
Figure description
Table A4.1 The 30 top-selling NASs, Canada and PMPRB7*, Q4-2015
Rank /
NAS (product name) |
Year
of first
launch |
PMPRB level of therapeutic improvement |
Common Drug Review |
pan-Canadian Oncology Drug Review |
pCPA status‡ |
Break-
through |
Sub-
stantial
improve-
ment |
Moderate improvement† |
Slight
or no
improve-
ment |
List |
List
with
criteria/
condition |
Do not list |
Do not list
at sub-
mitted
price |
Funding |
Funding
conditional
on cost-
effectiveness
being
improved |
Does not recommend funding |
| 1. Ledipasvir, sofosbuvir (Harvoni) |
2014 |
|
|
|
X |
|
X |
|
|
|
|
|
i |
| 2. Sofosbuvir (Sovaldi) |
2013 |
|
X |
|
|
|
X |
|
|
|
|
|
i |
| 3. Liraglutide (Victoza)B |
2009 |
|
|
|
X |
|
|
X |
|
|
|
|
i |
| 4. Fingolimod (Gilenya) |
2010 |
|
|
X |
|
|
X |
|
|
|
|
|
i |
| 5. Ustekinumab (Stelara)B |
2009 |
|
|
X |
|
|
X |
|
X |
|
|
|
ii |
| 6. Elvitegravir, cobicistat (Stribild) |
2012 |
|
|
|
X |
|
X |
|
|
|
|
|
i |
| 7. Denosumab (Prolia)B,O |
2010 |
|
|
X |
|
|
X |
|
|
|
|
|
iii |
| 8. Apixaban (Eliquis) |
2011 |
|
|
|
X |
|
X |
|
|
|
|
|
i |
| 9. Dolutegravir (Triumeq) |
2013 |
|
|
|
X |
|
X |
|
|
|
|
|
i |
| 10. Canagliflozin (Invokana) |
2013 |
|
|
|
X |
|
X |
|
|
|
|
|
i |
| 11. Lurasidone (Latuda) |
2011 |
|
|
|
X |
|
X |
|
|
|
|
|
iv |
| 12. Paliperidone palmitate (Invega Sustenna) |
2009 |
|
|
X |
|
|
|
X |
|
|
|
|
|
| 13. Abiraterone acetate (Zytiga)C |
2011 |
|
|
X |
|
|
|
|
|
|
X |
|
i |
| 14. Nivolumab (Opdivo)B,C,O |
2014 |
** |
|
|
|
|
|
X |
|
i |
| 15. Ombitasvir, paritaprevir, dasabuvir (Holkira Pak) |
2014 |
|
|
|
X |
|
X |
|
|
|
|
|
i |
| 16. Rilpivirine (Complera) |
2011 |
|
|
|
X |
X |
|
|
|
|
|
|
|
| 17. Golimumab (Simponi)B |
2009 |
|
|
|
X |
|
|
|
X |
|
|
|
i |
| 18. Daclatasvir (Daklinza) |
2014 |
|
|
|
X |
|
X |
|
|
|
|
|
i |
| 19. Enzalutamide (Xtandi)C |
2012 |
|
|
|
X |
|
|
|
|
X |
X |
|
i |
| 20. Ibrutinib (Imbruvica)C,O |
2013 |
|
X |
|
|
|
|
|
|
|
X |
|
i |
| 21. Dexlansoprazole (Dexilant) |
2009 |
|
|
|
X |
Not reviewed |
|
|
|
|
| 22. Linagliptin (Trajenta) |
2011 |
|
|
|
X |
|
X |
|
|
|
|
|
i |
| 23. Pertuzumab (Perjeta)B,C |
2012 |
|
X |
|
|
|
|
|
|
|
X |
X |
i |
| 24. Aflibercept (Eylea)B |
2011 |
|
|
X |
|
|
X |
|
|
|
|
|
i |
| 25. Teriflunomide (Aubagio) |
2012 |
|
|
|
X |
|
|
|
X |
|
|
|
i |
| 26. Saxagliptin (Onglyza) |
2009 |
|
|
X |
|
|
X |
|
|
|
|
|
i |
| 27. Ipilimumab (Yervoy)B,C,O |
2011 |
|
X |
|
|
|
|
|
|
|
X |
|
i |
| 28. Dapagliflozin (Forxiga) |
2012 |
|
|
|
X |
|
X |
|
|
|
|
|
i |
| 29. Apremilast (Otezla)O |
2014 |
** |
|
X |
X |
|
|
|
|
ii |
| 30. Linaclotide (Constella) |
2012 |
|
|
|
X |
|
|
X |
|
|
|
|
ii |
pCPA Status:
- i Complete and closed drug product negotiations
- ii No negotiations
- iii Active drug product negotiations
- iv Product negotiations being considered by each province/territory
Table A4.1 (continued)
Rank /
NAS (product name) |
Year of first launch |
No. of public plans where NAS is listed§ |
Q4-2015 |
| Share of Canadian & PMPRB7 NAS sales |
Share of Canadian NAS sales |
Foreign-to-Canadian ratio of NAS consumption rateǁ |
| 1. Ledipasvir, sofosbuvir (Harvoni) |
2014 |
10 |
16.1% |
22.3% |
1.0 |
| 2. Sofosbuvir (Sovaldi) |
2013 |
10 |
5.5% |
6.5% |
1.1 |
| 3. Liraglutide (Victoza)B |
2009 |
4 |
3.4% |
3.0% |
1.0 |
| 4. Fingolimod (Gilenya) |
2010 |
10 |
3.0% |
2.6% |
1.3 |
| 5. Ustekinumab (Stelara)B |
2009 |
10 |
2.9% |
4.8% |
0.5 |
| 6. Elvitegravir, cobicistat (Stribild) |
2012 |
9 |
2.8% |
1.7% |
2.1 |
| 7. Denosumab (Prolia)B,O |
2010 |
11 |
2.8% |
3.5% |
0.6 |
| 8. Apixaban (Eliquis) |
2011 |
11 |
2.8% |
3.2% |
0.8 |
| 9. Dolutegravir (Triumeq) |
2013 |
7 |
2.7% |
2.6% |
1.1 |
| 10. Canagliflozin (Invokana) |
2013 |
9 |
2.3% |
2.5% |
0.4 |
| 11. Lurasidone (Latuda) |
2011 |
10 |
2.1% |
0.6% |
1.0 |
| 12. Paliperidone palmitate (Invega Sustenna) |
2009 |
11 |
2.0% |
3.7% |
0.4 |
| 13. Abiraterone acetate (Zytiga)C |
2011 |
10 |
2.0% |
2.6% |
0.8 |
| 14. Nivolumab (Opdivo)B,C,O |
2014 |
0 |
2.0% |
0.0% |
|
| 15. Ombitasvir, paritaprevir, dasabuvir (Holkira Pak) |
2014 |
11 |
1.9% |
1.5% |
|
| 16. Rilpivirine (Complera) |
2011 |
9 |
1.8% |
1.2% |
2.1 |
| 17. Golimumab (Simponi)B |
2009 |
10 |
1.8% |
3.5% |
0.6 |
| 18. Daclatasvir (Daklinza) |
2014 |
0 |
1.7% |
0.1% |
|
| 19. Enzalutamide (Xtandi)C |
2012 |
10 |
1.6% |
0.9% |
1.9 |
| 20. Ibrutinib (Imbruvica)C,O |
2013 |
5 |
1.5% |
1.3% |
1.9 |
| 21. Dexlansoprazole (Dexilant) |
2009 |
2 |
1.5% |
1.8% |
0.2 |
| 22. Linagliptin (Trajenta) |
2011 |
11 |
1.5% |
1.7% |
0.6 |
| 23. Pertuzumab (Perjeta)B,C |
2012 |
10 |
1.4% |
2.0% |
1.5 |
| 24. Aflibercept (Eylea)B |
2011 |
6 |
1.3% |
5.2% |
0.5 |
| 25. Teriflunomide (Aubagio) |
2012 |
9 |
1.3% |
1.7% |
0.6 |
| 26. Saxagliptin (Onglyza) |
2009 |
11 |
1.2% |
2.5% |
0.4 |
| 27. Ipilimumab (Yervoy)B,C,O |
2011 |
10 |
1.1% |
1.3% |
1.1 |
| 28. Dapagliflozin (Forxiga) |
2012 |
1 |
0.9% |
0.9% |
1.0 |
| 29. Apremilast (Otezla)O |
2014 |
1 |
0.9% |
0.3% |
3.4 |
| 30. Linaclotide (Constella) |
2012 |
0 |
0.8% |
0.2% |
3.1 |
| |
74.5% |
85.7% |
0.9 |
Note: New active substances (NASs) launched between 2009 and 2014. A NAS was considered to be launched in a particular country once sales data was available in MIDAS™. For this analysis, launches in the Canadian market were solely based on available MIDAS™ sales.
Sales are based on manufacturer list prices.
NASs are identified as biologic (B), cancer (C) and/or orphan (O) drugs when appropriate.
*France, Germany, Italy, Sweden, Switzerland, United Kingdom and the United States.
†Includes two NASs listed as Category 3 drugs. This is an older designation used by the PMPRB to identify a drug that provides moderate, little or no therapeutic advantage over a comparable existing drug product.
‡pan-Canadian Pharmaceutical Alliance, as of January 1, 2017.
§Includes the 10 provincial drug plans and the Non-Insured Health Benefits (NIHB) Program. Listed either as full or restricted benefit as of December 31, 2015.
ǁBased on the number of physical quantities of NASs per 1 million people.
**Not reported in the 2015 PMPRB Annual Report.
Source: MIDAS™ Database, October‒December 2015, IMS AG. All rights reserved.
Harvoni and Sovaldi, new DAA drugs offering a curative treatment for hepatitis C, were the two top-selling NASs launched during the study period. Together, these two drugs accounted for 21.6% of all NAS sales and 6.4% of all brand-name drug sales in Canada and the PMPRB7. In Canada alone, these drugs accounted for 28.8% of all NAS sales and 4.9% of all brand-name drug sales.
Of the top 30 NASs, six were oncology drugs and eight were biologics, accounting for 9.6% and 16.6%, respectively, of the total NAS sales in the countries analyzed.
The table also indicates the level of therapeutic improvement of each drug, as determined by the PMPRB as part of its current price review process. Of the 30 top-selling NASs, four were deemed to offer a substantial improvement over drugs already on the market, while seven offered a moderate improvement level. Two drugs were not reported in the 2015 PMPRB Annual Report, and the rest of the 17 drugs, which accounted for 47.0% of the NAS sales, were deemed to offer slight or no improvement over existing drugsFootnote 7.
Recommendations from the Common Drug Review (CDR) and the pan-Canadian Oncology Drug Review (pCODR) are also reported in Table A4.1. Note that there are more recommendations than drugs reviewed, given that some drugs are considered for more than one indication. The majority of the drugs reviewed by the CDR (17 out of 23) received a recommendation of list with criteria/condition. A few drugs received the recommendations of list (1), do not list (4), and do not list at the submitted price (3). The six oncology drugs reviewed by pCODR received a recommendation for funding on the condition that their cost effectiveness was improved to an acceptable level. One of these drugs also received a funding recommendation for one of its indications, while another drug also received a does not recommend funding for one of its indications.
The table also indicates the number of public formularies in which each NAS is listedFootnote 8. The results suggest that the majority of top-selling NASs (22 of the 30 NASs) are generally reimbursed by most (6 or more) of the Canadian public drug plans.
An analysis of the consumption rates for the top-selling NASs suggests that Canada’s use of these drugs, relative to its population, is comparable to the use in foreign markets. Table A4.1 reports the foreign-to-Canadian rate of drug consumption per capita at drug level for Q4-2015.
Consumption rates are determined based on the quantity of units of drugs sold in a country and are reported on a per capita basis. The results are presented as a ratio, with the consumption rate in Canada set equal to one, and the rates in other countries determined relative to this measure. A ratio above one indicates correspondingly higher consumption rates in foreign markets, and may flag drugs that have growth potential in Canada. A ratio below one indicates correspondingly lower consumption rates in foreign markets, and may signal greater market penetration in Canada. This may be due to the timing of launch (e.g., Stelara was first launched in Canada), as well as the demographic and disease profiles of the population, and the use of other drugs.
The average foreign-to-Canadian ratio for the top 30 drugs is 0.9, suggesting that the consumption of NASs in foreign markets was, on average, 10% lower than in Canada.
The results of this table can be interpreted as follows: Harvoni had the highest sales share in Q4-2015, accounting for 16.1% of the total NAS sales in all countries analyzed and 22.3% of NAS sales in Canada. It was granted a slight or no improvement level by the PMPRB therapeutic review over its comparators (Sovaldi and Galexos) and was recommended to be listed with clinical criteria and/or conditions by the CDR. The pan-Canadian Pharmaceutical Alliance (pCPA) completed the price negotiation for this product, which is being reimbursed by almost all (10 out of 11) Canadian public drug plans. The foreign-to-Canadian consumption ratio is 1.0, suggesting that consumption rates in Canada are on par with those in the PMPRB7.
In terms of the launch sequence, the United States was typically the country of first introduction for the 30 top-selling NASs (Table A4.2). Twenty-three of the top 30 drugs were first launched in the United States, while Sweden was a distant second with six of the top-sellers first launched. Canada was the first country to launch one of the top-selling drugs, Stelara, and launched the novel hepatitis C drug Harvoni within the same month as the United States. Canada was the second country of launch for approximately one third of the 30 top-selling drugs.
Table A4.2 Launch sequence for the 30 top-selling NASs, Canada and PMPRB7*, Q4-2015
| Rank |
NAS (product name) |
Year of first launch |
Launch order (lag in months) |
Year of Canadian launch |
Canadian lag (months) |
Foreign median lag (months) |
| 1st |
2nd |
3rd |
4th |
5th |
6th |
7th |
8th |
| 1 |
Ledipasvir, sofosbuvir (Harvoni) |
2014 |
US |
CAN (0) |
SWE (1) |
GER (2) |
UK (2) |
FRA (2) |
SWI (3) |
ITA (7) |
2014 |
0 |
2 |
| 2 |
Sofosbuvir (Sovaldi) |
2013 |
US |
UK (0) |
SWE (1) |
FRA (1) |
CAN (1) |
GER (2) |
SWI (4) |
ITA (12) |
2014 |
1 |
2 |
| 3 |
Liraglutide (Victoza) |
2009 |
SWE |
GER (1) |
UK (1) |
SWI (7) |
US (8) |
FRA (10) |
CAN (11) |
ITA (14) |
2010 |
11 |
8 |
| 4 |
Fingolimod (Gilenya) |
2010 |
US |
ITA (1) |
SWI (5) |
SWE (6) |
CAN (7) |
GER (7) |
UK (7) |
FRA (15) |
2011 |
7 |
7 |
| 5 |
Ustekinumab (Stelara) |
2009 |
CAN |
GER (1) |
UK (1) |
SWE (3) |
US (8) |
ITA (13) |
FRA (15) |
SWI (25) |
2009 |
0 |
8 |
| 6 |
Elvitegravir, cobicistat (Stribild) |
2012 |
US |
CAN (3) |
SWE (8) |
GER (9) |
UK (9) |
SWI (14) |
FRA (17) |
ITA (19) |
2012 |
3 |
12 |
| 7 |
Denosumab (Prolia) |
2010 |
SWE |
UK (1) |
US (1) |
GER (2) |
CAN (3) |
SWI (4) |
ITA (17) |
FRA (20) |
2010 |
3 |
3 |
| 8 |
Apixaban (Eliquis) |
2011 |
SWE |
GER (1) |
UK (4) |
SWI (5) |
CAN (9) |
ITA (12) |
FRA (14) |
US (20) |
2012 |
9 |
9 |
| 9 |
Dolutegravir (Triumeq) |
2013 |
US |
CAN (3) |
SWE (5) |
UK (5) |
GER (6) |
SWI (9) |
ITA (14) |
FRA (15) |
2013 |
3 |
8 |
| 10 |
Canagliflozin (Invokana) |
2013 |
US |
SWE (7) |
UK (9) |
SWI (10) |
GER (11) |
CAN (13) |
ITA (18) |
|
2014 |
13 |
10 |
| 11 |
Lurasidone (Latuda) |
2011 |
US |
CAN (20) |
SWI (32) |
UK (42) |
GER (46) |
|
|
|
2012 |
20 |
42 |
| 12 |
Paliperidone palmitate (Invega Sustenna) |
2009 |
US |
CAN (12) |
SWE (19) |
UK (20) |
SWI (20) |
GER (21) |
ITA (31) |
FRA (41) |
2010 |
12 |
21 |
| 13 |
Abiraterone acetate (Zytiga) |
2011 |
US |
CAN (3) |
SWE (4) |
UK (4) |
GER (5) |
SWI (5) |
ITA (6) |
FRA (13) |
2011 |
3 |
5 |
| 14 |
Nivolumab (Opdivo) |
2014 |
US |
ITA (5) |
UK (5) |
SWE (6) |
GER (7) |
FRA (8) |
CAN (11) |
SWI (12) |
2015 |
11 |
7 |
| 15 |
Ombitasvir, paritaprevir, dasabuvir (Holkira Pak) |
2014 |
US |
CAN (1) |
SWE (1) |
UK (1) |
FRA (2) |
GER (2) |
SWI (2) |
ITA (5) |
2015 |
1 |
2 |
| 16 |
Rilpivirine (Complera) |
2011 |
US |
CAN (4) |
SWE (5) |
UK (6) |
GER (7) |
FRA (15) |
ITA (20) |
SWI (22) |
2011 |
4 |
11 |
| 17 |
Golimumab (Simponi) |
2009 |
US |
CAN (2) |
SWE (6) |
GER (7) |
ITA (18) |
SWI (18) |
UK (18) |
FRA (41) |
2009 |
2 |
18 |
| 18 |
Daclatasvir (Daklinza) |
2014 |
SWE |
GER (1) |
UK (1) |
ITA (2) |
SWI (11) |
US (11) |
CAN (13) |
|
2015 |
13 |
2 |
| 19 |
Enzalutamide (Xtandi) |
2012 |
US |
CAN (9) |
SWE (9) |
UK (9) |
GER (12) |
SWI (15) |
FRA (17) |
ITA (18) |
2013 |
9 |
14 |
| 20 |
Ibrutinib (Imbruvica) |
2013 |
US |
SWE (11) |
UK (11) |
CAN (12) |
GER (12) |
FRA (12) |
SWI (15) |
ITA (21) |
2014 |
12 |
12 |
| 21 |
Dexlansoprazole (Dexilant) |
2009 |
US |
CAN (18) |
GER (62) |
SWI (65) |
|
|
|
|
2010 |
18 |
64 |
| 22 |
Linagliptin (Trajenta) |
2011 |
US |
SWE (3) |
CAN (4) |
GER (5) |
UK (5) |
ITA (12) |
SWI (12) |
|
2011 |
4 |
5 |
| 23 |
Pertuzumab (Perjeta) |
2012 |
US |
SWI (2) |
ITA (4) |
SWE (9) |
UK (9) |
GER (10) |
CAN (11) |
FRA (16) |
2013 |
11 |
9 |
| 24 |
Aflibercept (Eylea) |
2011 |
US |
SWE (11) |
SWI (11) |
GER (12) |
UK (12) |
ITA (17) |
FRA (23) |
CAN (24) |
2013 |
24 |
12 |
| 25 |
Teriflunomide (Aubagio) |
2012 |
US |
SWE (11) |
GER (13) |
SWI (15) |
CAN (16) |
UK (17) |
ITA (23) |
FRA (26) |
2014 |
16 |
16 |
| 26 |
Saxagliptin (Onglyza) |
2009 |
US |
SWE (2) |
UK (2) |
CAN (3) |
GER (3) |
SWI (7) |
FRA (13) |
ITA (13) |
2009 |
3 |
5 |
| 27 |
Ipilimumab (Yervoy) |
2011 |
US |
FRA (3) |
SWE (3) |
GER (4) |
UK (4) |
SWI (6) |
CAN (7) |
ITA (23) |
2011 |
7 |
4 |
| 28 |
Dapagliflozin (Forxiga) |
2012 |
SWE |
GER (11) |
UK (11) |
US (24) |
SWI (34) |
CAN (36) |
ITA (39) |
|
2015 |
36 |
24 |
| 29 |
Apremilast (Otezla) |
2014 |
US |
CAN (9) |
SWE (9) |
GER (10) |
UK (10) |
SWI (15) |
|
|
2015 |
9 |
10 |
| 30 |
Linaclotide (Constella) |
2012 |
SWE |
US (1) |
UK (4) |
GER (6) |
SWI (9) |
ITA (16) |
CAN (18) |
|
2014 |
18 |
6 |
Note: New active substances (NASs) launched between 2009 and 2014. A NAS was considered to be launched in a particular country once sales data was available in MIDAS™. For this analysis, launches in the Canadian market were solely based on available MIDAS™ sales.
*France, Germany, Italy, Sweden, Switzerland, United Kingdom and the United States.
Source: MIDAS™ Database, October‒December 2015, IMS AG. All rights reserved.
A close look at the price of the top-selling new drugs substantiates the findings from Section A3, namely that at introduction, Canadian drugs prices are in line with the median foreign levels, with a few notable exceptions. Table A4.3 reports the multilateral foreign-to-Canadian price differentials for the 30 top-selling NASs at form and strength level. The United States had the maximum price for all of the 30 top-selling NASs, while France had the lowest price for 11 of these drugs.
A few top-selling new drugs have lower foreign median prices than in Canada. These include Onglyza and Trajenta, for which the median foreign prices in Q4-2015 were 0.74 and 0.83, respectively, of the Canadian level. Appendix II provides bilateral price ratios for the 30 top-selling NASs.
Appendix III focuses a lens on the NASs launched in international markets in 2014 and authorized for sale in Canada as of Q4-2015.
Table A4.3 Multilateral foreign-to-Canadian price ratios for Canadian new drug launches — Top 30 NASs by sales in Canada and the PMPRB7*, Q4-2015
Click on image for larger view
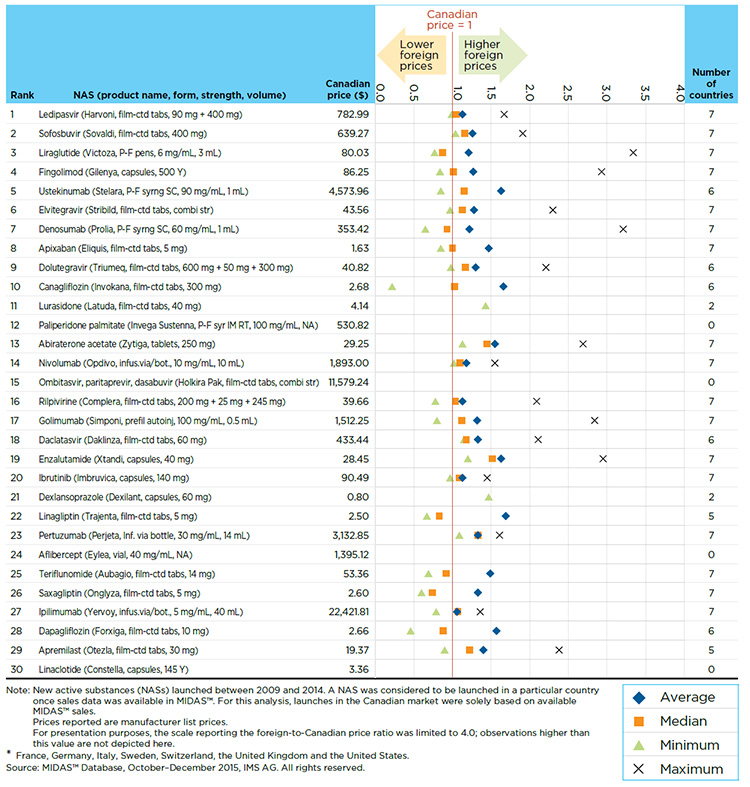
Figure description
blank
| Rank |
NAS (Product name, form, strength, volume) |
Canadian price ($) |
Mean |
Median |
Minimum |
Maximum |
Number of Countries |
| 1 |
Ledipasvir (Harvoni, film-ctd tabs, 90 mg + 400 mg) |
782.99 |
1.13 |
1.05 |
0.99 |
1.67 |
7 |
| 2 |
Sofosbuvir (Sovaldi, film-ctd tabs, 400 mg) |
639.27 |
1.26 |
1.16 |
1.04 |
1.91 |
7 |
| 3 |
Liraglutide (Victoza, P-F pens, 6 mg/mL, 3 mL) |
80.03 |
1.21 |
0.87 |
0.77 |
3.34 |
7 |
| 4 |
Fingolimod (Gilenya, capsules, 500 Y) |
86.25 |
1.27 |
1.01 |
0.84 |
2.93 |
7 |
| 5 |
Ustekinumab (Stelara, P-F syrng SC, 90 mg/mL, 1 mL) |
4,573.95 |
1.63 |
1.15 |
0.85 |
4.47 |
6 |
| 6 |
Elvitegravir (Stribild, film-ctd tabs, combi str) |
43.56 |
1.28 |
1.13 |
0.97 |
2.30 |
7 |
| 7 |
Denosumab (Prolia, P-F syrng SC, 60 mg/mL, 1 mL) |
353.42 |
1.22 |
0.93 |
0.65 |
3.21 |
7 |
| 8 |
Apixaban (Eliquis, film-ctd tabs, 5 mg) |
1.63 |
1.47 |
1.00 |
0.85 |
4.17 |
7 |
| 9 |
Dolutegravir (Triumeq, film-ctd tabs, 600 mg + 50 mg + 300 mg) |
40.82 |
1.30 |
1.17 |
0.98 |
2.21 |
6 |
| 10 |
Canagliflozin (Invokana, film-ctd tabs, 300 mg) |
2.68 |
1.66 |
1.03 |
0.22 |
5.56 |
6 |
| 11 |
Lurasidone (Latuda, film-ctd tabs, 40 mg) |
4.14 |
|
|
1.43 |
8.37 |
2 |
| 12 |
Paliperidone palmitate (Invega Sustenna, P-F syr IM RT, 100 mg/mL, NA) |
530.82 |
|
|
|
|
0 |
| 13 |
Abiraterone acetate (Zytiga, tablets, 250 mg) |
29.25 |
1.55 |
1.45 |
1.13 |
2.69 |
7 |
| 14 |
Nivolumab (Opdivo, infus.via/bot., 10 mg/mL, 10 mL) |
1,893.00 |
1.18 |
1.10 |
1.02 |
1.55 |
7 |
| 15 |
Ombitasvir, paritaprevir, dasabuvir (Holkira Pak, film-ctd tabs, combi str) |
11,579.24 |
|
|
|
|
0 |
| 16 |
Rilpivirine (Complera, film-ctd tabs, 200 mg + 25 mg + 245 mg) |
39.66 |
1.13 |
1.04 |
0.78 |
2.09 |
7 |
| 17 |
Golimumab (Simponi, prefil autoinj, 100 mg/mL, 0.5 mL) |
1,512.25 |
1.32 |
1.12 |
0.80 |
2.84 |
7 |
| 18 |
Daclatasvir (Daklinza, film-ctd tabs, 60 mg) |
433.44 |
1.33 |
1.18 |
1.15 |
2.11 |
6 |
| 19 |
Enzalutamide (Xtandi, capsules, 40 mg) |
28.45 |
1.63 |
1.52 |
1.20 |
2.95 |
7 |
| 20 |
Ibrutinib (Imbruvica, capsules, 140 mg) |
90.49 |
1.13 |
1.09 |
0.97 |
1.45 |
7 |
| 21 |
Dexlansoprazole (Dexilant, capsules, 60 mg) |
0.80 |
|
|
1.47 |
11.46 |
2 |
| 22 |
Linagliptin (Trajenta, film-ctd tabs, 5 mg) |
2.50 |
1.69 |
0.83 |
0.67 |
5.34 |
5 |
| 23 |
Pertuzumab (Perjeta, Inf. via bottle, 30 mg/mL, 14 mL) |
3,132.85 |
1.33 |
1.33 |
1.09 |
1.61 |
7 |
| 24 |
Aflibercept (Eylea, infus.via/bot., 40 mg/mL, NA) |
1,395.12 |
|
|
|
|
0 |
| 25 |
Teriflunomide (Aubagio, film-ctd tabs, 14 mg) |
53.36 |
1.49 |
0.92 |
0.69 |
4.65 |
7 |
| 26 |
Saxagliptin (Onglyza, film-ctd tabs, 5 mg) |
2.60 |
1.33 |
0.74 |
0.60 |
5.16 |
7 |
| 27 |
Ipilimumab (Yervoy, infus.via/bot., 5 mg/mL, 40 mL) |
22,421.81 |
1.06 |
1.07 |
0.79 |
1.36 |
7 |
| 28 |
Dapagliflozin (Forxiga, film-ctd tabs, 10 mg) |
2.66 |
1.57 |
0.88 |
0.46 |
5.64 |
6 |
| 29 |
Apremilast (Otezla, film-ctd tabs, 30 mg) |
19.37 |
1.40 |
1.22 |
0.90 |
2.38 |
5 |
| 30 |
Linaclotide (Constella, capsules, 145 Y) |
3.36 |
|
|
|
|
0 |
Note: New active substances (NASs) launched between 2009 and 2014. A NAS was considered to be launched in a particular country once sales data was available in MIDAS™. For this analysis, launches in the Canadian market were solely based on available MIDAS™ sales.
Prices reported are manufacturer list prices.
For presentation purposes, the scale reporting the foreign-to-Canadian price ratio was limited to 4.0; observations higher than this value are not depicted here.
*France, Germany, Italy, Sweden, Switzerland, United Kingdom and the United States.
Source: MIDAS™ Database, October‒December 2015, IMS AG. All rights reserved.
B Meds Entry Watch, 2015
Thirty-five NASs were launched in foreign markets in 2015, consistent with the average in recent years. The United States was the country of first launch for most of these drugs (28). Many of the 2015 NASs were specialty drugs, including biologics (14), orphan drugs (15) and/or oncology products (14). More than half (20) of the NASs were available in Canada by the end of 2016. An analysis of these products suggests that the unit prices of most NASs are in the hundreds of dollars, with the most expensive orphan drugs costing thousands of dollars.
In terms of the number of new drugs launched, 2015 was a typical year; with 35 launches it was consistent with the average over the previous years, but lower than in 2014 (47) – Figure B.1. The share of orphan drugs in 2015 (43%) was higher than the average from 2009 to 2014 (33%), but just below the 2014 share of 47%.
Figure B1 Number of NASs by year of launch,
Canada and the PMPRB7*, 2009 to 2015
Click on image for larger view
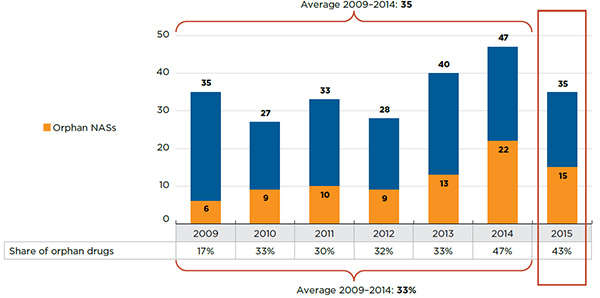
Figure description
This stacked bar graph depicts the number of new active substances by year of launch for Canada and the PMPRB comparator countries from 2009 to 2015. The number and share of drugs with an orphan indication is also given. Between 2009 and 2014, the average number of new active substances was 35 and 33% were orphan drugs.
blank
| |
2009 |
2010 |
2011 |
2012 |
2013 |
2014 |
2015 |
| Total new active substances |
35 |
27 |
33 |
28 |
40 |
47 |
35 |
| Orphan new active substances |
6 |
9 |
10 |
9 |
13 |
22 |
15 |
| Share of orphan new active substances |
17% |
33% |
30% |
32% |
33% |
47% |
43% |
Note: New active substances (NASs) launched between 2009 and 2015. A NAS was considered to be launched in a particular country once sales data was available in MIDAS™. For this analysis, launches in the Canadian market were solely based on available MIDAS™ sales.
*France, Germany, Italy, Sweden, Switzerland, United Kingdom and the United States.
Source: MIDAS™ Database, 2009 to 2015, IMS AG. All rights reserved.
Table B1 lists the NASs launched in Canada and the PMPRB7 in 2015. The table also reports the country of first launch for each NAS, and indicates whether it was available in Canada. The share of sales for Q4-2015 is reported for countries with available sales. Note that this information reflects the early uptake and availability of these products in emerging markets.
Table B1 NASs launched in Canada and the PMPRB7* in 2015 and corresponding share of sales, Q4-2015
| NAS (product name) |
Anatomical Classification |
Country of first launch |
Month of first launch |
Canadian availability† |
Share of Canadian and PMPRB7 sales, Q4-2015 |
| CAN |
FRA |
GER |
ITA |
SWE |
SWI |
UK |
US |
| Edoxaban (Lixiana) |
B1-Antithrombotic agents |
US |
Jan |
Nov-16‡ |
|
|
32.2% |
|
|
3.6% |
0.2% |
63.9% |
| Secukinumab (Cosentyx)B |
D5-Nonsteroidal products for inflammatory skin disorders |
SWE |
Jan |
Apr-15 |
3.8% |
|
11.1% |
|
0.5% |
1.1% |
0.8% |
82.7% |
| Susoctocog alfa (Obizur)B,O |
B2-Blood coagulation system, other products |
US |
Jan |
Nov-16 |
|
|
|
|
|
|
|
|
| Suvorexant (Belsomra) |
N5-Psycholeptics |
US |
Jan |
|
|
|
|
|
|
|
|
100% |
| Palbociclib (Ibrance)C |
L1-Antineoplastics |
US |
Feb |
Apr-16 |
|
|
|
|
|
|
|
100% |
| Vaccine, human papillomavirus type-6,11,16,18,31,33,45,52,58 (Gardasil 9)B |
J7-Vaccines |
US |
Feb |
Mar-15 |
1.3% |
|
|
|
|
|
|
98.7% |
| Cangrelor (Kengreal) |
B1-Antithrombotic agents |
SWE |
Mar |
|
|
|
1.7% |
|
2.8% |
|
0.4% |
95.1% |
| Panobinostat (Farydak)O,C |
L1-Antineoplastics |
US |
Mar |
|
|
|
25.9% |
|
0.3% |
|
0.7% |
73.2% |
| Avibactam (Avycaz) |
J1-Systemic antibacterials |
US |
Apr |
|
|
|
|
|
|
|
|
100% |
| Isavuconazonium (Cresemba)O |
J2-Systemic agents for fungal infections |
US |
Apr |
|
|
|
<0.1% |
|
|
|
|
100% |
| Lenvatinib (Lenvima)O,C |
L1-Antineoplastics |
FRA |
Apr |
Mar-16 |
|
<0.1% |
89.4% |
|
2.4% |
5.9% |
1.8% |
0.5% |
| Safinamide (Xadago) |
N4-Anti-parkinson drugs |
GER |
May |
|
|
|
99.8% |
|
|
0.2% |
|
|
| Alirocumab (Praluent)B |
C10-Lipid-regulating/anti-atheroma preparations |
US |
July |
Apr-16 |
|
|
8.3% |
|
<0.1% |
|
0.1% |
91.5% |
| Brexpiprazole (Rexulti) |
N5-Psycholeptics |
US |
July |
|
|
|
|
|
|
|
|
100% |
| Dinutuximab (Unituxin)B,O,C |
L1-Antineoplastics |
US |
July |
|
|
|
|
|
|
|
|
100% |
| Evolocumab (Repatha)B,O |
C10-Lipid-regulating/anti-atheroma preparations |
SWE |
July |
Sep-15 |
0.8% |
|
16.4% |
|
0.4% |
|
0.3% |
82.1% |
| Lumacaftor (Orkambi)O |
R7-Other respiratory system products |
US |
July |
Jan-16 |
|
|
3.3% |
|
|
|
|
96.7% |
| Sacubitril (Entresto) |
C9-Agents acting on the renin-angiotensin system |
US |
July |
Nov-15 |
0.6% |
|
|
|
|
1.3% |
<0.1% |
98.1% |
| Cobimetinib (Cotellic)O,C |
L1-Antineoplastics |
SWI |
Sept |
Apr-16 |
|
|
37.4% |
|
|
33.2% |
|
29.4% |
| Asfotase alfa (Strensiq)B,O |
A16-Other alimentary tract and metabolism products |
GER |
Oct |
Oct-15 |
|
|
82.6% |
|
|
|
6.7% |
10.8% |
| Eluxadoline (Viberzi) |
A3-Functional gastro-intestinal disorder drugs |
US |
Oct |
|
|
|
|
|
|
|
|
100% |
| Flibanserin (Addyi) |
G2-Other gynaecologicals |
US |
Oct |
|
|
|
|
|
|
|
|
100% |
| Idarucizumab (Praxbind)B |
V3-All other therapeutic products |
US |
Oct |
May-16 |
|
|
|
|
1.0% |
|
|
99.0% |
| Sonidegib (Odomzo)B,C |
L1-Antineoplastics |
US |
Oct |
|
|
|
|
|
|
|
|
100% |
| Tipiracil (Lonsurf)C |
L1-Antineoplastics |
US |
Oct |
|
|
|
|
|
|
|
|
100% |
| Daratumumab (Darzalex)B,O,C |
L1-Antineoplastics |
US |
Nov |
Jul-16 |
|
|
|
|
|
|
|
100% |
| Elotuzumab (Empliciti)B,O,C |
L1-Antineoplastics |
US |
Nov |
Jun-16‡ |
|
|
|
|
|
|
|
100% |
| Ixazomib (Ninlaro)O,C |
L1-Antineoplastics |
US |
Nov |
Sep-16 |
|
|
|
|
|
|
|
100% |
| Mepolizumab (Nucala)B,O |
R3-Anti-asthma and chronic obstructive pulmonary disease |
US |
Nov |
Mar-16 |
|
|
|
|
|
|
|
100% |
| Necitumumab (Portrazza)B,C |
L1-Antineoplastics |
US |
Nov |
|
|
|
|
|
|
|
|
100% |
| Osimertinib (Tagrisso)O,C |
L1-Antineoplastics |
US |
Nov |
Jul-16 |
|
|
|
|
|
|
|
100% |
| Rolapitant (Varubi) |
A4-Antiemetics and antinauseants |
US |
Nov |
|
|
|
|
|
|
|
|
100% |
| Talimogene laherparepvec (Imlygic)B,C |
L1-Antineoplastics |
US |
Nov |
|
|
|
|
|
|
|
|
100% |
| Tenofovir alafenamide (Genvoya) |
J5-Antivirals for systemic use |
US |
Nov |
Feb-16 |
|
|
|
|
0.1% |
|
<0.1% |
99.9% |
| Alectinib (Alecensaro)O,C |
L1-Antineoplastics |
US |
Dec |
Oct-16 |
|
|
|
|
|
|
|
100% |
Note: A NAS was considered to be launched in a particular country once sales data was available in MIDAS™. For the Canadian market, Health Canada’s Drug Product Database and the Notice of Compliance database were cross-referenced to ensure that all NASs authorized for sale in Canada were accurately identified.
Sales are based on manufacturer list prices.
NASs are identified as biologic (B), cancer (C) and/or orphan (O) drugs when appropriate.
*France, Germany, Italy, Sweden, Switzerland, United Kingdom and the United States.
†Available in Canada as of December 31, 2016.
‡Notice of Compliance (NOC) issued but not yet marketed.
Source: MIDAS™ Database, October‒December 2015, IMS AG. All rights reserved.
Table B2 reports the prices available as of Q4-2015 for the NASs launched in Canada and the PMPRB7 in 2015. The prices are reported for the highest selling form and strength of each drug at the time of the analysis. Note that for some recently launched NASs, price information may not yet be available in MIDAS™.
Table B2 Q4-2015 prices (CAD$) for NASs launched in 2015 in Canada and PMPRB7*
| NAS (product, form, strength, volume) |
CAN |
FRA |
GER |
ITA |
SWE |
SWI |
UK |
US |
| Edoxaban (Lixiana, film-ctd tabs, 60 mg) |
|
|
3.22 |
|
|
3.74 |
3.72 |
11.58 |
| Secukinumab (Cosentyx, prefil autoinj, 150 mg/mL, 1 mL)B |
816.58 |
|
1,122.25 |
|
868.59 |
1,104.10 |
1,079.76 |
2,355.78 |
| Susoctocog alfa (Obizur, FPB vial dry, 500 IU)B,O |
|
|
No sales
Q4-2015 |
|
|
|
|
| Suvorexant (Belsomra, film-ctd tabs, 10 mg) |
|
|
|
|
|
|
|
11.08 |
| Palbociclib (Ibrance, capsules, 125 mg)C |
|
|
|
|
|
|
|
597.39 |
| Vaccine, human papillomavirus type-6,11,16,18,31,33,45,52,58 (Gardasil 9, comb. str.)B |
157.83 |
|
|
|
|
|
|
207.06 |
| Cangrelor (Kengrexal, vial dry, 50 mg) |
|
|
511.33 |
|
498.53 |
|
443.04 |
945.42 |
| Panobinostat (Farydak, capsules, 20 mg)O,C |
|
|
1,446.08 |
|
949.39 |
|
1,375.20 |
1,466.49 |
| Avibactam (Avycaz, inf dry bottle, 500 mg + 2 g) |
|
|
|
|
|
|
|
359.71 |
| Isavuconazonium (Cresemba, capsules, 186 mg)O |
|
|
|
|
|
|
|
85.92 |
| Lenvatinib (Lenvima, capsules, 10 mg)O,C |
|
|
104.70 |
|
82.31 |
93.30 |
84.89 |
|
| Safinamide (Xadago, film-ctd tabs, 50 mg) |
|
|
7.81 |
|
|
8.03 |
|
|
| Alirocumab (Praluent, prefil autoinj, 75 mg/mL, 1 mL)B |
|
|
422.50 |
|
|
|
297.72 |
694.31 |
| Brexpiprazole (Rexulti, tablets, 2 mg) |
|
|
|
|
|
|
|
36.64 |
| Dinutuximab (Unituxin, infus.via/bot., 3.5 mg/mL, 5 mL)B,O,C |
|
|
|
|
|
|
|
9,903.46 |
| Evolocumab (Repatha, prefil autoinj, 140 mg/mL, 1 mL)B,O |
278.62 |
|
422.23 |
|
306.28 |
|
301.39 |
671.04 |
| Lumacaftor (Orkambi, film-ctd tabs, 125 mg + 200 mg)O |
|
|
161.99 |
|
|
|
|
196.56 |
| Sacubitril (Entresto, film-ctd tabs, 48.6 mg + 51.4 mg) |
3.75 |
|
|
|
|
|
2.93 |
|
| Cobimetinib (Cotellic, film-ctd tabs, 20 mg)O,C |
|
|
134.47 |
|
|
118.12 |
|
123.42 |
| Asfotase alfa (Strensiq, vial SC, 40 mg/mL, 0.7 mL)B,O |
|
|
3,431.43 |
|
|
|
|
|
| Eluxadoline (Viberzi, coated tablets, 100 mg) |
|
|
|
|
|
|
|
12.33 |
| Flibanserin (Addyi, film-ctd tabs, 100 mg) |
|
|
|
|
|
|
|
33.74 |
| Idarucizumab (Praxbind, vial IV, 50 mg/mL, 50mL)B |
|
|
|
|
|
|
|
2,211.89 |
| Sonidegib (Odomzo, capsules, 200 mg)B,C |
|
|
|
|
|
|
|
437.70 |
| Tipiracil (Lonsurf, film-ctd tabs, 8.19 mg + 15 mg)C |
|
|
|
|
|
|
|
177.62 |
| Daratumumab (Darzalex, infus.via/bot., 20 mg/mL, 20 mL)B,O,C |
|
|
|
|
|
|
|
2,228.76 |
| Elotuzumab (Empliciti, inf dry bottle, 300 mg)B,O,C |
|
|
|
|
|
|
|
2,225.87 |
| Ixazomib (Ninlaro, capsules, 4 mg)O,C |
|
|
|
|
|
|
|
3,196.67 |
| Mepolizumab (Nucala, vial dry, 100 mg)B,O |
|
|
|
|
|
|
|
3,214.67 |
| Necitumumab (Portrazza, infus.via/bot., 16 mg/mL, 50 mL)B,C |
|
|
|
|
|
|
|
5,231.23 |
| Osimertinib (Tagrisso, film-ctd tabs, 80 mg)O,C |
|
|
|
|
|
|
|
546.32 |
| Rolapitant (Varubi, film-ctd tabs, 90 mg) |
|
|
|
|
|
|
|
278.20 |
| Talimogene laherparepvec (Imlygic, vial, 1M/mL, 1 mL)B,C |
|
|
|
|
|
|
|
3,036.21 |
| Tenofovir alafenamide (Genvoya, film-ctd tabs, combi str) |
|
|
|
|
46.59 |
|
51.96 |
105.44 |
| Alectinib (Alecensaro, capsules, 150 mg)O,C |
|
|
|
|
|
|
|
66.98 |
Note: This table reports manufacturer list prices. For some recently launched NASs, price information may not yet be available in MIDAS™.
NASs are identified as biologic (B), cancer (C) and/or orphan (O) drugs when appropriate.
*France, Germany, Italy, Sweden, Switzerland, United Kingdom and the United States.
†Authorized for sale in Canada as of December 31, 2016.
Source: MIDAS™ Database, October‒December 2015, IMS AG. All rights reserved.
The second edition of the Meds Entry Watch will provide a more detailed analysis of the NASs launched in 2015, including drug-level information related to the PMPRB level of therapeutic improvement and recommendations from the Common Drug Review and the pan-Canadian Oncology Drug Review, as well as the status of public reimbursement and pan-Canadian Pharmaceutical Alliance price negotiations. The international launch sequence, lag time and an international price comparison will be reported for NASs launched in 2015, which can be assessed against the benchmark retrospective analysis for the 2009‒2014 period provided in Section A of this report.
References
Health Canada. 2016. Health Canada New Drug Authorizations: 2015 Highlights. Ottawa: Health Canada. Available at: https://www.canada.ca/en/health-canada/services/publications/drugs-health-products/health-canada-new-drug-authorizations-2015-highlights.html
PMPRB. 2016. PMPRB Annual Report 2015. Ottawa: Patented Medicines Prices Review Board. Available at: http://www.pmprb-cepmb.gc.ca/en/reporting/annual-reports
PMPRB. 2017. CompassRx: Annual Public Drug Plan Expenditure Report, 2015/16. Ottawa: Patented Medicines Prices Review Board. [Forthcoming: April 2017]
FDA. 2015. Novel Drugs 2014. Silver Spring, Maryland: U.S. Food and Drug Administration, Center of Drug Evaluation and Research. Available at: http://www.fda.gov/Drugs/DevelopmentApprovalProcess/DrugInnovation/ucm429247.htm
FDA. 2016. Novel Drugs 2015. Silver Spring, Maryland: U.S. Food and Drug Administration, Center for Drug Evaluation and Research. Available at: http://www.fda.gov/Drugs/DevelopmentApprovalProcess/DrugInnovation/ucm430302.htm
Appendices
Appendix I: NASs launched in OECD countries, 2009‒2014
Figure I.1 Share of NASs launched by OECD country, Q4-2015
Click on image for larger view
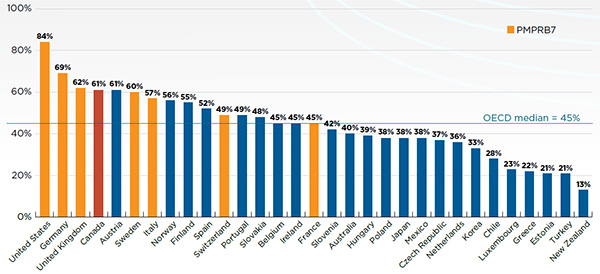
Figure description
This bar graph depicts the share of new active substances launched by each country in the Organisation for Economic Co-operation and Development as of the fourth quarter of 2015.
blank
| Country |
Share of new active substances launched |
| United States |
84% |
| Germany |
69% |
| United Kingdom |
62% |
| Canada |
61% |
| Austria |
61% |
| Sweden |
60% |
| Italy |
57% |
| Norway |
56% |
| Finland |
55% |
| Spain |
52% |
| Switzerland |
49% |
| Portugal |
49% |
| Slovakia |
48% |
| Belgium |
45% |
| Ireland |
45% |
| France |
45% |
| Slovenia |
42% |
| Australia |
40% |
| Hungary |
39% |
| Poland |
38% |
| Japan |
38% |
| Mexico |
38% |
| Czech Republic |
37% |
| Netherlands |
36% |
| Korea |
33% |
| Chile |
28% |
| Luxembourg |
23% |
| Greece |
22% |
| Estonia |
21% |
| Turkey |
21% |
| New Zealand |
13% |
| Organisation for Economic Co-operation and Development median |
45% |
Note: New active substances (NASs) launched between 2009 and 2014 in Canada and the PMPRB7. A NAS was considered to be launched in a particular country once sales data was available in MIDAS™. For the Canadian market, Health Canada’s Drug Product Database and the Notice of Compliance database were cross-referenced to ensure that all NASs authorized for sale in Canada were accurately identified.
Source: MIDAS™ Database, October‒December 2015, IMS AG. All rights reserved.
Figure I.2 Share of NAS sales*by OECD country, Q4-2015
Click on image for larger view
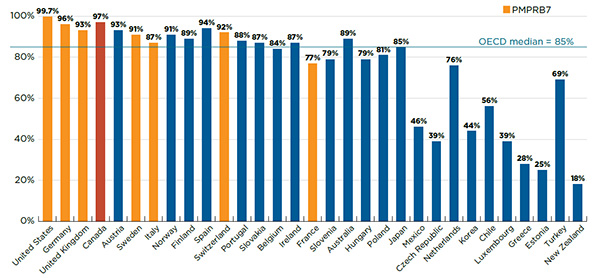
Figure description
This bar graph depicts the share of sales for new active substances launched by each country in the Organisation for Economic Co-operation and Development as of the fourth quarter of 2015.
blank
| Country |
Share of new active substance sales |
| United States |
99.7% |
| Germany |
96% |
| United Kingdom |
93% |
| Canada |
97% |
| Austria |
93% |
| Sweden |
91% |
| Italy |
87% |
| Norway |
91% |
| Finland |
89% |
| Spain |
94% |
| Switzerland |
92% |
| Portugal |
88% |
| Slovakia |
87% |
| Belgium |
84% |
| Ireland |
87% |
| France |
77% |
| Slovenia |
79% |
| Australia |
89% |
| Hungary |
79% |
| Poland |
81% |
| Japan |
85% |
| Mexico |
46% |
| Czech Republic |
39% |
| Netherlands |
76% |
| Korea |
44% |
| Chile |
56% |
| Luxembourg |
39% |
| Greece |
28% |
| Estonia |
25% |
| Turkey |
69% |
| New Zealand |
18% |
| Organisation for Economic Co-operation and Development median |
85% |
Note: New active substances (NASs) launched between 2009 and 2014 in Canada and the PMPRB7. A NAS was considered to be launched in a particular country once sales data was available in MIDAS™. For the Canadian market, Health Canada’s Drug Product Database and the Notice of Compliance database were cross-referenced to ensure that all NASs authorized for sale in Canada were accurately identified.
Sales are based on manufacturer list prices.
*Sales of all OECD countries.
Source: MIDAS™ Database, October‒December 2015, IMS AG. All rights reserved.
Appendix II: Bilateral price comparison of top-selling NASs, 2009‒2014
Table II.1 Bilateral foreign-to-Canadian price ratios for NASs launched in Canada
Top 30 NASs by Canadian and PMPRB7* sales, Q4-2015
Click on image for larger view
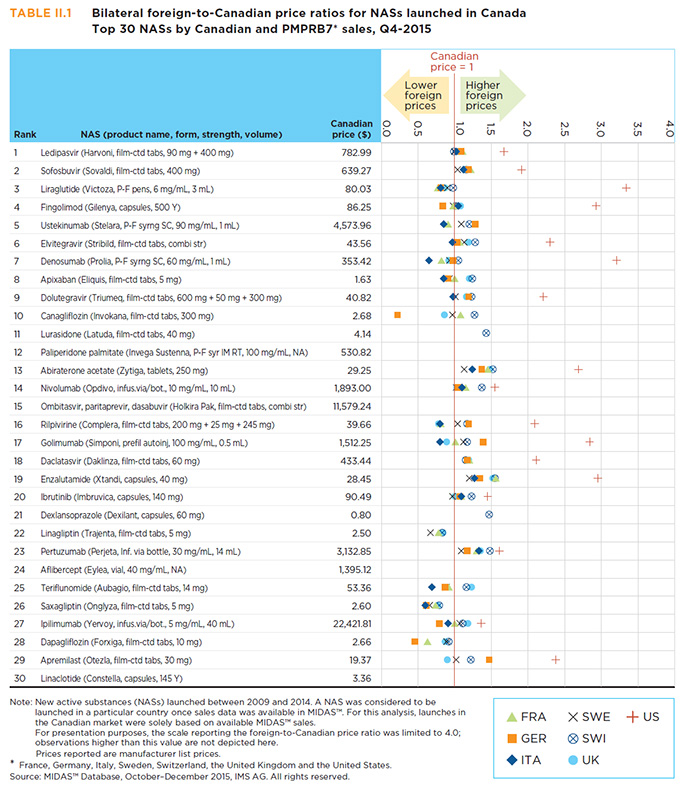
Figure description
Table II.1 Bilateral foreign-to-Canadian price ratios for NASs launched in Canada
Top 30 NASs by Canadian and PMPRB7* sales, Q4-2015
| Rank |
NAS (product name, form, strength, volume) |
Canadian price ($) |
FRA |
GER |
ITA |
SWE |
SWI |
UK |
US |
| 1 |
Ledipasvir (Harvoni, film-ctd tabs, 90 mg + 400 mg) |
782.99 |
1.02 |
1.09 |
1.11 |
1.00 |
0.99 |
1.05 |
1.67 |
| 2 |
Sofosbuvir (Sovaldi, film-ctd tabs, 400 mg) |
639.27 |
1.12 |
1.19 |
1.22 |
1.04 |
1.16 |
1.15 |
1.91 |
| 3 |
Liraglutide (Victoza, P-F pens, 6 mg/mL, 3 mL) |
80.03 |
0.81 |
0.81 |
0.77 |
0.90 |
0.98 |
0.87 |
3.34 |
| 4 |
Fingolimod (Gilenya, capsules, 500 Y) |
86.25 |
1.05 |
0.84 |
0.98 |
0.98 |
1.01 |
1.08 |
2.93 |
| 5 |
Ustekinumab (Stelara, P-F syrng SC, 90 mg/mL, 1 mL) |
4,573.95 |
0.85 |
1.28 |
0.91 |
1.09 |
1.20 |
|
4.47 |
| 6 |
Elvitegravir (Stribild, film-ctd tabs, combi str) |
43.56 |
0.97 |
1.03 |
1.07 |
1.13 |
1.28 |
1.19 |
2.30 |
| 7 |
Denosumab (Prolia, P-F syrng SC, 60 mg/mL, 1 mL) |
353.42 |
0.65 |
0.98 |
0.82 |
0.93 |
1.05 |
0.92 |
3.21 |
| 8 |
Apixaban (Eliquis, film-ctd tabs, 5 mg) |
1.63 |
0.85 |
0.91 |
1.00 |
0.93 |
1.24 |
1.20 |
4.17 |
| 9 |
Dolutegravir (Triumeq, film-ctd tabs, 600 mg + 50 mg + 300 mg) |
40.82 |
0.98 |
1.19 |
|
1.01 |
1.23 |
1.16 |
2.21 |
| 10 |
Canagliflozin (Invokana, film-ctd tabs, 300 mg) |
2.68 |
|
0.22 |
1.08 |
0.97 |
1.27 |
0.86 |
5.56 |
| 11 |
Lurasidone (Latuda, film-ctd tabs, 40 mg) |
4.14 |
|
|
|
|
1.43 |
|
8.37 |
| 12 |
Paliperidone palmitate (Invega Sustenna, P-F syr IM RT, 100 mg/mL, NA) |
530.82 |
|
|
|
|
|
|
|
| 13 |
Abiraterone acetate (Zytiga, tablets, 250 mg) |
29.25 |
1.24 |
1.37 |
1.45 |
1.13 |
1.52 |
1.48 |
2.69 |
| 14 |
Nivolumab (Opdivo, infus.via/bot., 10 mg/mL, 10 mL) |
1,893.00 |
1.10 |
1.05 |
1.15 |
1.02 |
1.37 |
1.03 |
1.55 |
| 15 |
Ombitasvir, paritaprevir, dasabuvir (Holkira Pak, film-ctd tabs, combi str) |
11,579.24 |
|
|
|
|
|
|
|
| 16 |
Rilpivirine (Complera, film-ctd tabs, 200 mg + 25 mg + 245 mg) |
39.66 |
0.80 |
1.19 |
0.81 |
1.04 |
1.17 |
0.78 |
2.09 |
| 17 |
Golimumab (Simponi, prefil autoinj, 100 mg/mL, 0.5mL) |
1,512.25 |
0.80 |
1.39 |
1.01 |
1.12 |
1.17 |
0.89 |
2.84 |
| 18 |
Daclatasvir (Daklinza, film-ctd tabs, 60 mg) |
433.44 |
|
1.17 |
1.20 |
1.17 |
1.15 |
1.19 |
2.11 |
| 19 |
Enzalutamide (Xtandi, capsules, 40 mg) |
28.45 |
1.27 |
1.34 |
1.56 |
1.20 |
1.55 |
1.52 |
2.95 |
| 20 |
Ibrutinib (Imbruvica, capsules, 140 mg) |
90.49 |
1.09 |
1.07 |
1.09 |
0.97 |
1.23 |
1.00 |
1.45 |
| 21 |
Dexlansoprazole (Dexilant, capsules, 60 mg) |
0.80 |
|
|
|
|
1.47 |
|
11.46 |
| 22 |
Linagliptin (Trajenta, film-ctd tabs, 5 mg) |
2.50 |
|
|
0.78 |
0.67 |
0.83 |
0.84 |
5.34 |
| 23 |
Pertuzumab (Perjeta, Inf. via bottle, 30 mg/mL, 14 mL) |
3,132.85 |
1.33 |
1.17 |
1.30 |
1.09 |
1.48 |
1.35 |
1.61 |
| 24 |
Aflibercept (Eylea, vial, 40 mg/mL, NA) |
1,395.12 |
|
|
|
|
|
|
|
| 25 |
Teriflunomide (Aubagio, film-ctd tabs, 14 mg) |
53.36 |
0.69 |
0.87 |
0.92 |
0.89 |
1.16 |
1.23 |
4.65 |
| 26 |
Saxagliptin (Onglyza, film-ctd tabs, 5 mg) |
2.60 |
0.60 |
0.61 |
0.74 |
0.66 |
0.79 |
0.77 |
5.16 |
| 27 |
Ipilimumab (Yervoy, infus.via/bot., 5 mg/mL, 40 mL) |
22,421.81 |
0.91 |
0.79 |
1.00 |
1.07 |
1.11 |
1.18 |
1.36 |
| 28 |
Dapagliflozin (Forxiga, film-ctd tabs, 10 mg) |
2.66 |
|
0.46 |
0.63 |
0.89 |
0.92 |
0.87 |
5.64 |
| 29 |
Apremilast (Otezla, film-ctd tabs, 30 mg) |
19.37 |
|
1.47 |
|
1.02 |
1.22 |
0.90 |
2.38 |
| 30 |
Linaclotide (Constella, capsules, 145 Y) |
3.36 |
|
|
|
|
|
|
|
Note: New active substances (NASs) launched between 2009 and 2014. A NAS was considered to be launched in a particular country once sales data was available in MIDAS™. For this analysis, launches in the Canadian market were solely based on available MIDAS™ sales.
For presentation purposes, the scale reporting the foreign-to-Canadian price ratio was limited to 4.0; observations higher than this value are not depicted here.
Prices reported are manufacturer list prices.
*France, Germany, Italy, Sweden, Switzerland, the United Kingdom and the United States.
Source: MIDAS™ Database, October‒December 2015, IMS AG. All rights reserved.
Appendix III: 2014 NASs available in Canada as of Q4-2015
This appendix focuses on the 28 NASs launched in international markets in 2014 that were authorized for sale in Canada as of Q4-2015.
Table III.1 NASs launched in 2014 in Canada and the PMPRB7*, and authorized for sale in Canada as of Q4-2015
| NAS (product name) |
Anatomical Classification |
Country of first launch |
Share of Canadian and PMPRB7 sales |
Share of Canadian and PMPRB7 sales, by country,
Q4-2015 |
| CAN |
FRA |
GER |
ITA |
SWE |
SWI |
UK |
US |
| Ledipasvir, sofosbuvir (Harvoni) |
J5-Antivirals for systemic use |
US |
16.1% |
3.8% |
2.4% |
3.8% |
8.7% |
0.6% |
0.5% |
1.6% |
78.7% |
| Nivolumab (Opdivo)B,O |
L1-Antineoplastics |
US |
2.0% |
<0.1% |
8.6% |
4.5% |
0.3% |
0.4% |
<0.1% |
0.3% |
85.8% |
| Ombitasvir, paritaprevir, dasabuvir (Holkira Pak) |
J5-Antivirals for systemic use |
US |
1.9% |
2.2% |
3.1% |
9.4% |
34.2% |
0.4% |
1.4% |
1.7% |
47.6% |
| Daclatasvir (Daklinza) |
J5-Antivirals for systemic use |
SWE |
1.7% |
0.1% |
|
7.3% |
29.5% |
2.4% |
1.4% |
3.9% |
55.4% |
| Apremilast (Otezla)O |
L4-Immunosuppressants |
US |
0.9% |
0.9% |
|
3.8% |
|
0.5% |
0.7% |
0.9% |
93.1% |
| Vedolizumab (Entyvio)B |
L4-Immunosuppressants |
SWE |
0.7% |
1.1% |
5.5% |
11.0% |
|
1.6% |
1.5% |
3.7% |
75.6% |
| Pembrolizumab (Keytruda)B,O |
L1-Antineoplastics |
US |
0.7% |
0.5% |
11.1% |
11.0% |
0.1% |
0.2% |
1.3% |
2.4% |
73.5% |
| Peginterferon beta-1a (Plegridy)B |
L3-Immunostimulants |
SWE |
0.6% |
<0.1% |
<0.1% |
18.3% |
0.8% |
0.4% |
0.2% |
0.9% |
79.3% |
| Dulaglutide (Trulicity)B |
A10-Drugs used in diabetes |
US |
0.5% |
|
|
11.3% |
|
0.2% |
0.4% |
0.3% |
87.8% |
| Empagliflozin (Jardiance) |
A10-Drugs used in diabetes |
SWE |
0.5% |
0.9% |
|
4.9% |
1.1% |
0.2% |
0.6% |
0.8% |
91.4% |
| Nintedanib (Ofev)O |
L1-Antineoplastics |
US |
0.5% |
0.5% |
1.3% |
11.5% |
|
0.2% |
0.4% |
4.8% |
81.2% |
| Efinaconazole (Jublia) |
D1-Antifungals, dermatological |
US |
0.4% |
4.2% |
|
|
|
|
|
|
95.8% |
| Ramucirumab (Cyramza)B,O |
L1-Antineoplastics |
US |
0.3% |
<0.1% |
|
7.7% |
0.5% |
<0.1% |
<0.1% |
0.3% |
91.5% |
| Umeclidinium bromide (Incruse Ellipta) |
R3-Anti-asthma and chronic obstructive pulmonary disease products |
US |
0.2% |
1.3% |
|
4.7% |
1.0% |
0.1% |
0.9% |
5.6% |
86.3% |
| Albiglutide (Eperzan)B |
A10-Drugs used in diabetes |
US |
0.2% |
† |
|
<0.1% |
|
|
|
|
100% |
| Idelalisib (Zydelig)O |
L1-Antineoplastics |
FRA |
0.2% |
0.3% |
10.9% |
17.2% |
2.8% |
0.9% |
2.5% |
8.0% |
57.5% |
| Efmoroctocog alfa (Eloctate)B,O |
B2-Blood coagulation system, other products |
US |
0.1% |
† |
|
|
|
|
|
|
100% |
| Ceritinib (Zykadia)O |
L1-Antineoplastics |
US |
0.1% |
1.9% |
10.6% |
8.6% |
|
1.0% |
|
0.7% |
77.2% |
| Elosulfase alfa (Vimizim)B,O |
A16-Other alimentary tract and metabolism products |
US |
0.1% |
|
20.0% |
6.6% |
|
0.5% |
|
|
72.9% |
| Blinatumomab (Blincyto)B,O |
L1-Antineoplastics |
US |
0.1% |
† |
|
4.5% |
|
|
|
|
95.5% |
| Naloxegol (Movantik) |
A6-Drugs for constipation and bowel cleansers |
SWE |
0.1% |
0.3% |
|
1.3% |
|
0.2% |
|
0.1% |
98.2% |
| Eftrenonacog alfa (Alprolix)B,O |
B2-Blood coagulation system, other products |
US |
0.1% |
|
|
|
|
|
|
|
100% |
| Ceftolozane (Zerbaxa) |
J1-Systemic antibacterials |
US |
<0.1% |
† |
|
0.7% |
|
<0.1% |
|
0.6% |
98.6% |
| Tedizolid (Sivextro) |
J1-Systemic antibacterials |
US |
<0.1% |
† |
|
|
|
0.2% |
|
0.7% |
99.1% |
| Siltuximab (Sylvant)B,O |
L1-Antineoplastics |
US |
<0.1% |
|
|
6.9% |
|
0.5% |
|
2.4% |
90.2% |
| Simoctocog alfa (Nuwiq)B |
B2-Blood coagulation system, other products |
SWE |
<0.1% |
|
|
15.4% |
63.3% |
3.2% |
|
18.1% |
|
| Ambrosia psilostachya (Ragwitek)B |
V1-Allergens |
US |
<0.1% |
21.8% |
|
|
|
|
|
|
78.2% |
| Catridecacog (Tretten)B |
B2-Blood coagulation system, other products |
ITA |
<0.1% |
|
|
|
100% |
|
|
|
|
| |
|
|
28.0% |
|
|
|
|
|
|
|
|
Note: New active substances (NASs) launched between 2009 and 2014. A NAS was considered to be launched in a particular country once sales data was available in MIDAS™. For the Canadian market, Health Canada’s Drug Product Database and the Notice of Compliance database were cross-referenced to ensure that all NASs authorized for sale in Canada were accurately identified.
Sales are based on manufacturer list prices.
NASs are identified as biologic (B) and/or orphan (O) drugs when appropriate.
*France, Germany, Italy, Sweden, Switzerland, United Kingdom and the United States.
†Notice of Compliance issued, but not yet marketed.
Source: MIDAS™ Database, October–December 2015, IMS AG. All rights reserved.
Table III.2 Prices (CAD$) for NASs launched in 2014 in Canada and the PMPRB7*, and authorized for sale in Canada as of Q4-2015
| NAS (product name, form, strength, volume) |
CAN |
FRA |
GER |
ITA |
SWE |
SWI |
UK |
US |
| Ledipasvir (Harvoni, film-ctd tabs, 90 mg + 400 mg) |
783.05 |
800.99 |
851.05 |
862.00 |
781.96 |
775.37 |
822.54 |
1,362.75 |
| Nivolumab (Opdivo, infus.via/bot., 10 mg/mL, 10 mL) |
1,893.00 |
2,080.41 |
1,995.07 |
2,174.24 |
1,936.36 |
2,595.67 |
1,943.75 |
2,932.26 |
| Ombitasvir, paritaprevir, dasabuvir (Holkira Pak, film-ctd tabs, combi str) |
11,563.49 |
|
|
|
|
|
|
|
| Daclatasvir (Daklinza, film-ctd tabs, 60 mg) |
433.44 |
|
506.29 |
521.76 |
505.43 |
499.06 |
517.26 |
912.44 |
| Apremilast (Otezla, film-ctd tabs, 30 mg) |
19.37 |
|
28.54 |
|
19.73 |
23.71 |
17.41 |
46.13 |
| Vedolizumab (Entyvio, inf dry bottle, NA intstr) |
3,184.72 |
|
|
|
|
|
|
|
| Pembrolizumab (Keytruda, inf dry bottle, 50 mg) |
2,245.09 |
2,607.72 |
2,490.41 |
2,900.70 |
2,526.05 |
2,852.28 |
2,330.40 |
2,633.66 |
| Peginterferon beta-1a (Plegridy, Pf Autoinj Ret, NA, NA) |
842.96 |
|
|
|
|
|
|
|
| Dulaglutide (Trulicity, P-F pens, 3 mg/mL, 0.5 mL) |
|
|
45.29 |
|
42.24 |
46.02 |
34.27 |
169.46 |
| Empagliflozin (Jardiance, film-ctd tabs, 10 mg) |
2.68 |
|
2.09 |
1.86 |
2.02 |
2.34 |
2.32 |
14.95 |
| Nintedanib (Ofev, capsules, 150 mg) |
55.80 |
51.73 |
71.18 |
|
49.94 |
69.06 |
63.54 |
171.24 |
| Efinaconazole (Jublia, liquid.topical, 10%, 6 mL) |
10.98 |
|
|
|
|
|
|
|
| Ramucirumab (Cyramza, vial IV, 10 mg/mL, 50 mL) |
4,107.00 |
|
|
|
|
|
|
|
| Umeclidinium bromide (Incruse Ellipta, U-D pwd n-ref, 74.2Y/dose) |
2.05 |
|
|
|
1.49 |
1.89 |
1.62 |
9.82 |
| Albiglutide (Tanzeum, dry P-F pen Rt, 30 mg) |
|
|
|
|
|
|
|
126.71 |
| Idelalisib (Zydelig, film-ctd tabs, 150 mg) |
69.52 |
|
109.57 |
97.40 |
88.46 |
110.84 |
92.00 |
162.85 |
| Efmoroctocog alfa (Eloctate, inf dry bottle, 3K) |
|
|
|
|
|
|
|
2.70 |
| Ceritinib (Zykadia, capsules, 150 mg) |
7.14 |
65.32 |
71.25 |
|
50.21 |
|
58.17 |
114.95 |
| Elosulfase alfa (Vimizim, infus.via/bot., 1 mg/mL, 5 mL) |
|
1,673.55 |
1,095.00 |
|
1,201.55 |
|
|
1,250.67 |
| Blinatumomab (Blincyto, inf dry bottle, 35Y) |
|
|
|
|
|
|
|
4,136.21 |
| Naloxegol (Movantik, film-ctd tabs, 25 mg) |
5.98 |
|
4.66 |
|
3.49 |
|
3.26 |
10.49 |
| Eftrenonacog Alfa (Alprolix, inf dry bottle, 3K) |
|
|
|
|
|
|
|
4.53 |
| Ceftolozane (Zerbaxa, inf dry bottle, 1.5 G + 500 mg) |
|
|
|
|
|
|
|
108.81 |
| Tedizolid (Sivextro, film-ctd tabs, 200 mg) |
|
|
|
|
252.55 |
|
254.59 |
354.38 |
| Siltuximab (Sylvant, inf dry bottle, 400 mg) |
|
2,938.57 |
|
|
|
|
2,943.58 |
4,049.73 |
| Simoctocog alfa (Nuwiq, vial dry, 2K) |
|
2,556.63 |
|
1,899.21 |
|
|
2,693.69 |
|
| Ambrosia psilostachya (Ragwitek, subling tabs) |
3.86 |
|
|
|
|
|
|
10.47 |
| Catridecacog (Novothirteen, vial dry, 2.5K) |
|
|
|
294.47 |
|
|
|
|
Note: New active substances (NASs) launched between 2009 and 2014. A NAS was considered to be launched in a particular country once sales data was available in MIDAS™. For the Canadian market, Health Canada’s Drug Product Database and the Notice of Compliance database were cross-referenced to ensure that all NASs authorized for sale in Canada were accurately identified.
Prices reported are manufacturer list prices.
*France, Germany, Italy, Sweden, Switzerland, the United Kingdom and the United States.
Source: MIDAS™ Database, October–December 2015, IMS AG. All rights reserved.