A Review of Public Coverage of CDR Reviewed drugs
PDF - 337 kb
The issue of a national pharmacare program has been debated in Canada for decades, and recently discussions about major reforms have resurfaced, with a wide range of opinions proposed by various stakeholders. To inform the dialogue related to the potential composition of a Canadian national formulary, the PMPRB has conducted an analysis into the current drug coverage, commonalities and differences across public drug plans in Canada.
The analysis focuses on a selection of 206 relevant drugs (active substances) evaluated by the Common Drug Review (CDR) through national health technology assessment process from December 2003 to June 2015.
The analysis reports on the number and percentage of drugs listed in each of the CDR participating public drug plans, in the public drug plan for Quebec, and in Canadian private drug plans as of December 31, 2015. Weighted listing rates, based on Canadian national retail sales in 2015, were used to determine the relative importance of the drugs listed.
Key Findings
1. Formulary listing rates in public drug plans are relatively high
On average, Canadian public drug plans listed 59% of the 206 drugs, representing 86% of the retail sales for the CDR reviewed drugs in Canada in 2015. Of the selected drugs, 175 (or 85%) were listed in at least one plan, accounting for 97% of the Canadian sales.
Ontario and Quebec public drug plans had the highest percentage of formulary listings (70% and 73%, respectively), accounting for most of the sales (94% and 91%, respectively).
The private drug plan aggregate data indicates that almost all selected drugs (98%) were available in one or more of the plans. Although this rate was higher than for the public drug plans, the sales-weighted coverage rates were fairly comparable.
Formulary listing rates for CDR reviewed drugs in public drug plans and availability in private drug plans, 2015
Click on image for larger view
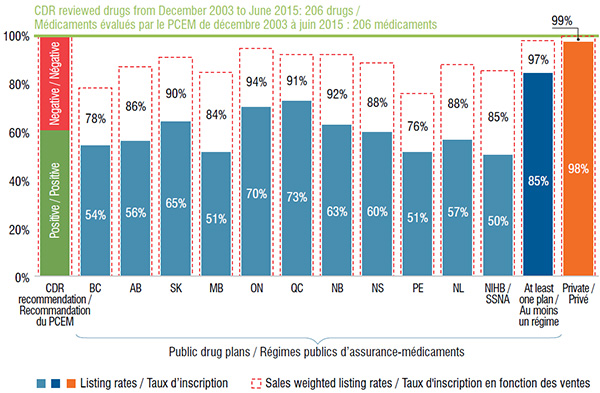
Figure description
This bar graph depicts the percentage of the 206 selected drugs that were listed in the formulary of (1) each public drug plan analyzed; (2) at least one public plan analyzed; and (3) in Canadian private plans at the end of December 2015. The listing rates and sales-weighted rates are given for each plan or group of plans. Of the 206 drugs, 61% received a positive CDR recommendation.
blank
| Drug plan |
Listing rates |
Sales-weighted listing rates |
| British Columbia |
54% |
78% |
| Alberta |
56% |
86% |
| Saskatchewan |
65% |
90% |
| Manitoba |
51% |
84% |
| Ontario |
70% |
94% |
| Quebec |
73% |
91% |
| New Brunswick |
63% |
92% |
| Nova Scotia |
60% |
88% |
| Prince Edward Island |
51% |
76% |
| Newfoundland and Labrador |
57% |
88% |
| Non-Insured Health Benefit |
50% |
85% |
| At least one plan |
85% |
97% |
| Private plans |
98% |
99% |
2. The top-selling CDR reviewed drugs are available in the majority of Canadian public drug plans
The majority (63%) of the select drugs were listed in 6 or more of the 11 public drug plan formularies: 21% were listed in all public plans, while 42% were listed in 6 to 10 formularies. These drugs accounted for 90% of the Canadian sales for the CDR reviewed drugs in 2015.
A small proportion of the drugs (15%) were not approved for coverage under any of the public drug plans; most of these had received a negative CDR recommendation. These drugs accounted for an even smaller share (3%) of the total national sales in 2015. More than one third belonged to the nervous system therapeutic class, and the majority of these drugs were pain medications. Other therapeutic categories with three or more drugs not listed on any public formularies included the antiinfectives for systemic use, alimentary tract and metabolism and cardiovascular system classes.
CDR reviewed drugs listed in public drug plans, by number of plans, 2015
Click on image for larger view
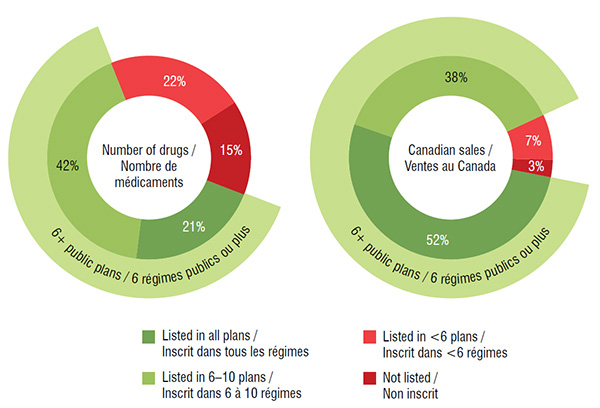
Figure description
These two side-by-side circle graphs give the percentage of drugs analyzed and their sales by the number of public drug plans in which they were listed in 2015: (1) listed in all drug plans; (2) listed in six to ten drug plans; (3) in less than six drug plans; and (4) not listed in any public drug plan. Of the select drugs, 63% were listed in six or more plans, representing 90% of the total sales.
blank
|
Share of select drugs |
Share of Canadian sales for select drugs |
| Listed in all plans |
21% |
52% |
| Listed in 6 to 10 plans |
42% |
38% |
| Listed in less than 6 plans |
22% |
7% |
| Not listed in any plan |
15% |
3% |
3. The degree of drug coverage in public drug plans varies by therapeutic class
An analysis of the seven main therapeutic categories accounting for more than 90% of the total national market for the drugs reviewed by the CDR highlights variations in the formulary listings of public drug plans. Antiinfectives for systemic use had the greatest coverage, with an average of 74% of the drugs having a formulary listing, while the nervous system and alimentary tract and metabolism classes had some of the lowest listing rates at 47% and 54%, respectively.
The coverage for specific therapeutic classes differed among the public drug plans. While all top therapeutic classes exhibited some level of disparity, the listings for the antiinfectives for systemic use class were the most closely aligned among public plans.
CDR reviewed drugs listed in public drug plans, by main therapeutic category, 2015
Click on image for larger view
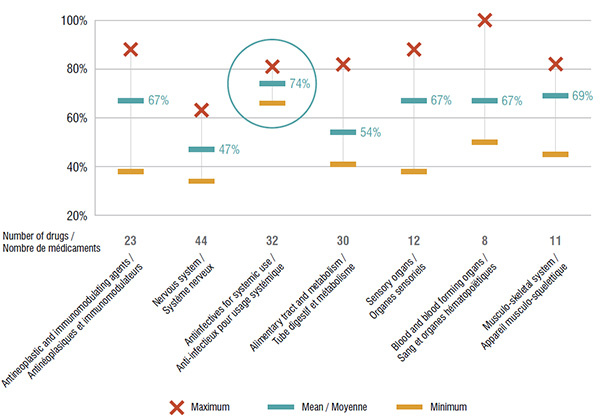
Figure description
This graph depicts the degree of drug coverage for the seven main therapeutic categories in the public plans analyzed. The minimum, maximum and average percentage of listing for selected drugs is given for each therapeutic class.
blank
| Therapeutic class |
No. of drugs |
Maximum |
Minimum |
Average |
| Antineoplastic and immunomodulating agents |
23 |
88% |
38% |
67% |
| Nervous system |
44 |
63% |
34% |
47% |
| Antiinfectives for systemic use |
32 |
81% |
66% |
74% |
| Alimentary tract and metabolism |
30 |
82% |
41% |
54% |
| Sensory organs |
12 |
88% |
38% |
67% |
| Blood and blood forming organs |
8 |
100% |
50% |
67% |
| Musculo-skeletal system |
11 |
82% |
45% |
69% |
4. The majority of the selected drugs listed in Ontario are covered by other public formularies
Ontario, which had the largest public drug program, had one of the highest numbers of listings at 145. In comparison, Quebec listed 128 of the same drugs as Ontario; Ontario covered 17 drugs that were not listed in Quebec; and Quebec listed 23 additional drugs not covered in Ontario. All the other public drug plans listed the majority of drugs covered by Ontario.
The drugs listed in Ontario that were not covered by other plans accounted for up to 18.8% of the Canadian sales for CDR reviewed drugs. Other provinces also covered a small number of drugs not listed in Ontario; these had a very low share of national sales of up to 2.8%.
Gaps and overlaps of drugs listed in Ontario and other public drug plans, 2015
Click on image for larger view
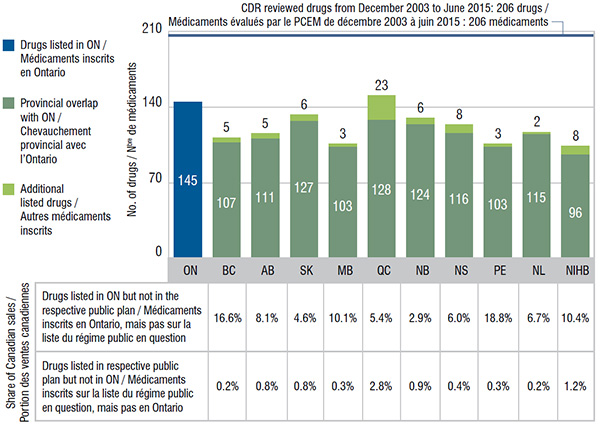
Figure description
This bar graph compares the number of selected drugs listed on the Ontario formulary (145) with the numbers in the other drug plans analyzed. The share of Canadian sales for drugs available in Ontario but not in other plans is also given, along with the share of sales of drugs available in each of the other plans but not in Ontario.
blank
| Drug plan |
Provincial overlap with Ontario (number of drugs) |
Additional drugs not listed in Ontario |
Share of Canadian sales of drugs not listed in Ontario |
Share of Canadian sales of drugs listed in Ontario, but not in this plan |
| British Columbia |
107 |
5 |
0.2% |
16.6% |
| Alberta |
111 |
5 |
0.8% |
8.1% |
| Saskatchewan |
127 |
6 |
0.8% |
4.6% |
| Manitoba |
103 |
3 |
0.3% |
10.1% |
| Quebec |
128 |
23 |
2.8% |
5.4% |
| New Brunswick |
124 |
6 |
0.9% |
2.9% |
| Nova Scotia |
116 |
8 |
0.4% |
6.0% |
| Prince Edward Island |
103 |
3 |
0.3% |
18.8% |
| Newfoundland and Labrador |
115 |
2 |
0.2% |
6.7% |
| Non-Insured Health Benefit |
96 |
8 |
1.2% |
10.4% |
5. The formulary listing agreement for the selected drugs is relatively high
The degree of listing alignment between all public drug plans was calculated based on 55 bilateral public drug plan combinations. The results indicate relatively high rates of coverage agreement among the public drug plans, with a range of 67%–91% for unweighted rates. Adjusting for the sales weight, the average agreement rates increased to 74%–96%.
An analysis of the drugs with positive CDR recommendations suggests similar rates of formulary agreement.
Unweighted and sales-weighted coverage agreement rates of CDR reviewed drugs, Canadian public drug plans, 2015
| Drugs/Description |
Agreement rates |
Mean |
Median |
Maximum |
Minimum |
Standard deviation |
| All CDR reviewed drugs |
Unweighted |
80% |
81% |
91% |
67% |
6% |
| |
Weighted |
88% |
89% |
96% |
74% |
5% |
| Positive CDR recommendations |
Unweighted |
80% |
79% |
92% |
66% |
6% |
| |
Weighted |
91% |
91% |
98% |
77% |
5% |
6. Atlantic Canada has better drug coverage alignment than other Canadian regions
The listing decision agreement rates between provincial drug plans in the Atlantic region were higher than in any other region in Canada. For 139 drugs listed in the Atlantic Provinces, the average rate of interprovincial coverage agreement was 87%, higher than the Canadian average, while with expenditure weighting, the rate was 89%. The average rates of agreement weighted by sales were high and comparable among the regions.
Interprovincial coverage agreement rates by region, 2015
Click on image for larger view
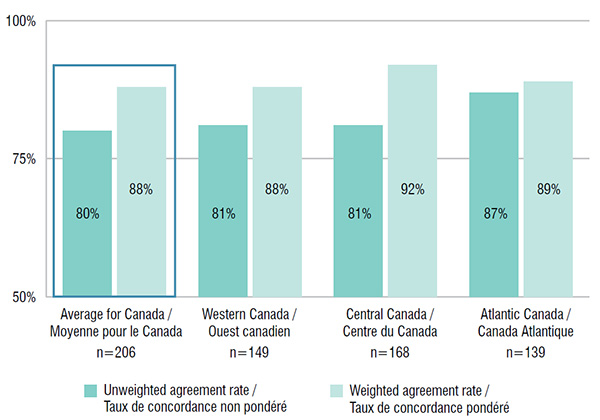
Figure description
This bar graph depicts the rate of interprovincial agreement in coverage within the major regions in Canada for the selected drugs. The average and weighted average are given for each region along with the number of drugs used in the calculation.
blank
| Region |
Number of drugs |
Unweighted agreement rate |
Weighted agreement rate |
| Average for Canada |
206 |
80% |
88% |
| Western Canada |
149 |
81% |
88% |
| Central Canada |
168 |
81% |
92% |
| Atlantic Canada |
139 |
87% |
89% |
Note: Drugs for rare diseases, drugs withdrawn from the market, and some older drugs evaluated for new, niche indications were excluded from the analysis. Drugs were selected irrespective of their CDR recommendations. Quebec does not participate in the CDR process.
Limitations: Variation in drug coverage across public plans may be impacted by differences in the plan designs, demographics and the disease profiles of the eligible beneficiary populations.
Data Sources:
- NPDUIS Database, Canadian Institute for Health Information (CIHI)
- IMS Brogan IMAM Database
- IMS Brogan Payer Insights
- IMS Brogan Private Drug Plan Database
- MIDAS™ Database, Manufacturer Ex-factory Sales in Retail and Hospital, IMS AG. All Rights Reserved.
- Other publicity available data sources including Common Drug Review website
Disclaimer: Although based in part on data provided by the Canadian Institute for Health Information (CIHI) and under license from the IMS AG’s MIDAS™ Database, IMS Brogan’s IMAM Database, IMS Brogan’s Payer Insights, and IMS Brogan’s Private Drug Plan Database, the statements, findings, conclusions, views and opinions expressed in this report are exclusively those of the PMPRB and are not attributable to CIHI, IMS AG or IMS Brogan.
NPDUIS is a research initiative that operates independently of the regulatory activities of the PMPRB.