The Canadian Market for Biologic Response Modifier Agents, 2015
PDF - 304 kb
The market for biologic disease-modifying antirheumatic drugs (DMARDs) has been rapidly evolving over the last two decades, with new drugs and indications continuously reshaping it and fueling a remarkable growth both domestically and internationally. The first edition of the PMPRB Market Intelligence Report series focuses a lens on this class of drugs, providing insight into the uptake in utilization, market shares, pricing, annual treatment costs and the broader drug portfolio of the manufacturers operating in this space. The report explores Canadian markets from the national and public and private payer perspectives, positioning them within an international context.
International comparisons focus on the seven countries the PMPRB considers in reviewing the prices of patented drugs (PMPRB7): France, Germany, Italy, Sweden, Switzerland, the United Kingdom (UK) and the United States (US). Some of the analyses also include other countries in the Organisation for Economic Co-operation and Development (OECD).
Key Findings
1. The sales and use of biologic DMARDS are higher in Canada than in most comparable international markets
Biologic DMARDS accounted for 10.3% of the Canadian pharmaceutical market in 2015. This market share was higher than in almost all the PMPRB7 countries (ranging from 4.1% to 7.7%); Sweden was the only exception at 11.6%.
The growth in Canadian sales of biologic DMARDS nearly doubled from 2010 to 2015. This increase was greater than in all of the PMPRB7 countries except for the US.
Canada has one of the highest per capita consumption rates of biologic DMARDS compared to the PMPRB7 countries. This may be due to differences in the demographic and disease profiles of the populations, among other things.
Biologic DMARD market shares of total pharmaceutical sales*, Canada and the PMPRB7, 2010 to 2015
Click on image for larger view
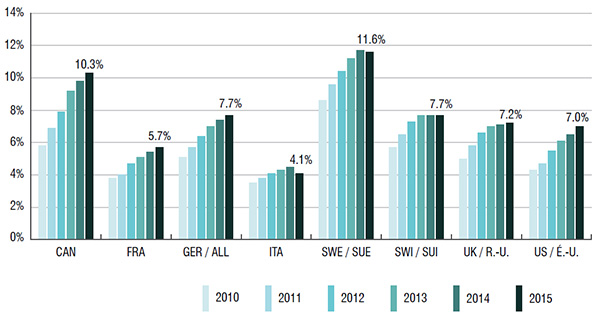
*Manufacturer price levels.
Figure description
This bar graph depicts the biologic DMARD market share of total pharmaceutical sales for Canada and the PMPRB7 countries from 2010 to 2015:
blank
| |
2010 |
2011 |
2012 |
2013 |
2014 |
2015 |
| Canada |
5.8% |
6.9% |
7.9% |
9.2% |
9.8% |
10.3% |
| France |
3.8% |
4.0% |
4.7% |
5.1% |
5.4% |
5.7% |
| Germany |
5.1% |
5.7% |
6.4% |
7.0% |
7.4% |
7.7% |
| Italy |
3.5% |
3.8% |
4.1% |
4.3% |
4.5% |
4.1% |
| Sweden |
8.6% |
9.6% |
10.4% |
11.2% |
11.7% |
11.6% |
| Switzerland |
5.7% |
6.5% |
7.3% |
7.7% |
7.7% |
7.7% |
| United Kingdom |
5.0% |
5.8% |
6.6% |
7.0% |
7.1% |
7.2% |
| United States |
4.3% |
4.7% |
5.5% |
6.1% |
6.5% |
7.0% |
2. Canadians primarily use biologic DMARDS with the highest domestic treatment costs
The three top-selling biologic DMARDS in Canada, which accounted for over three quarters of the sales in 2015, had the highest average annual costs per patient.
Based on public plan data, the average annual costs of Remicade ($27.3K), Humira ($15.8K) and Enbrel ($14.6K) were significantly higher than other drugs in this class (ranging from $11.3K to $13.4K).
Remicade accounted for nearly 40% of the Canadian market for biologic DMARDS and cost close to 50% more per patient than the class average based on 2015 public drug plan data.
Distribution of sales by biologic DMARD, Canada and the PMPRB7, 2015
Click on image for larger view
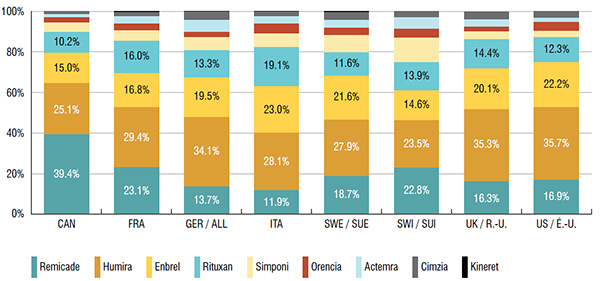
Figure description
This bar graph gives the 2015 sales of each drug as a percentage of the total biologic DMARD sales for Canada and each of the PMPRB7 countries:
blank
|
Remicade |
Humira |
Enbrel |
Rituxan |
Simponi |
Orencia |
Actemra |
Cimzia |
Kineret |
| Canada |
39.4% |
25.1% |
15.0% |
10.2% |
4.8% |
2.4% |
1.7% |
1.4% |
0.1% |
| France |
23.1% |
29.4% |
16.8% |
16.0% |
5.1% |
3.2% |
3.6% |
2.2% |
0.5% |
| Germany |
13.7% |
34.1% |
19.5% |
13.3% |
6.4% |
2.7% |
5.7% |
4.2% |
0.3% |
| Italy |
11.9% |
28.1% |
23.0% |
19.1% |
6.9% |
4.7% |
3.7% |
2.2% |
0.4% |
| Sweden |
18.7% |
27.9% |
21.6% |
11.6% |
8.5% |
3.4% |
4.0% |
3.9% |
0.5% |
| Switzerland |
22.8% |
23.5% |
14.6% |
13.9% |
12.2% |
4.2% |
5.7% |
3.1% |
0.0% |
| United Kingdom |
16.3% |
35.3% |
20.1% |
14.4% |
4.0% |
2.2% |
3.6% |
3.9% |
0.2% |
| United States |
16.9% |
35.7% |
22.2% |
12.3% |
3.1% |
4.5% |
1.9% |
3.4% |
0.1% |
Annual treatment costs in public drug plans, by biologic DMARD, 2010 to 2015
Click on image for larger view
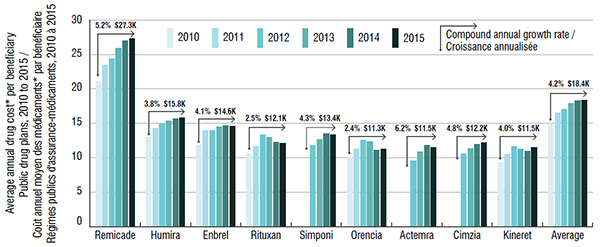
*Markups and dispensing costs are excluded; costs reported reflect amounts accepted for reimbursement.
Figure description
This bar graph gives the average annual treatment cost per beneficiary (excluding markup and dispensing costs) in public drug plans from 2010 to 2015. Treatment costs are given for each biologic DMARD and for the class average.
blank
|
2010 |
2011 |
2012 |
2013 |
2014 |
2015 |
Annualized growth rate |
| Remicade |
$21.1K |
$23.5K |
$24.4K |
$25.9K |
$27.0K |
$27.3K |
5.2% |
| Humira |
$13.1K |
$14.3K |
$14.9K |
$15.4K |
$15.7K |
$15.8K |
3.8% |
| Enbrel |
$11.9K |
$14.0K |
$14.0K |
$14.5K |
$14.7K |
$14.6K |
4.1% |
| Rituxan |
$10.7K |
$11.7K |
$13.4K |
$13.0K |
$12.3K |
$12.1K |
2.5% |
| Simponi |
– |
– |
$11.8K |
$12.7K |
$13.5K |
$13.4K |
4.3% |
| Orencia |
$10.1K |
$11.3K |
$12.6K |
$12.4K |
$11.1K |
$11.3K |
2.4% |
| Actemra |
– |
– |
$9.6K |
$10.9K |
$11.8K |
$11.5K |
6.2% |
| Cimzia |
– |
– |
$10.6K |
$11.4K |
$12.0K |
$12.2K |
4.8% |
| Kineret |
$9.4K |
$10.5K |
$11.7K |
$11.3K |
$11.0K |
$11.5K |
4.0% |
| Class average |
$15.0K |
$16.5K |
$17.1K |
$17.9K |
$18.3K |
$18.4K |
4.2% |
3. The top-selling biologic DMARD, Remicade, has the highest annual cost per patient and list price in Canada
The median price of Remicade in the PMPRB7 countries was 25% lower than in Canada. This price difference translates into $224 million in drug sales or 1.0% of the entire Canadian pharmaceutical market.
Foreign-to-Canadian price ratios for Remicade, Canada versus the PMPRB7 and other OECD countries, 2015
Click on image for larger view
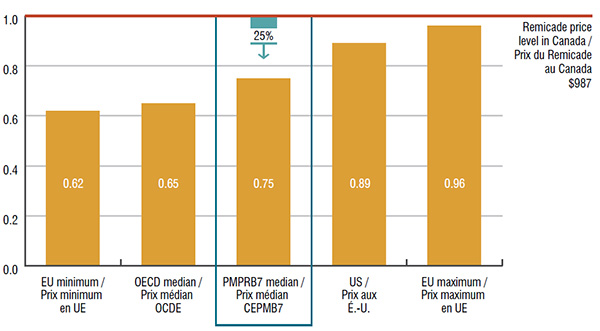
Figure description
This graph depicts the foreign-to-Canadian price ratios for Remicade in 2015. Foreign prices reflect the price levels in the seven PMPRB comparator countries and other Organisation for Economic Co-operation and Development countries. The $987 Canadian price level for Remicade is equal to one.
blank
| European minimum |
Organisation for Economic Co-operation and Development median |
PMPRB7 median |
United States |
European maximum |
| 0.62 |
0.65 |
0.75 |
0.89 |
0.96 |
In Canada, Remicade infusions are almost exclusively delivered in manufacturer-sponsored infusion centres, while in other countries, the infusions are generally delivered in hospitals.
4. The price of the infliximab biosimilar in Canada is comparable to foreign markets and offers the potential for important savings
In 2015, the list price of the infliximab biosimilar in Canada was $525, representing 53% of the Canadian price for Remicade.
Since the infliximab biosimilar was only recently launched in Canada, the uptake in sales has been relatively modest. If the use in Canada had mirrored the median OECD use in 2015 (10.1%), it would have translated into a $41.7 million reduction in drug expenditures. Similarly, if the uptake in Canada was in line with Norway (with the lowest biosimilar price and one of the highest uptakes at 67.8%), the cost implications would be substantial: a reduction of $280.1 million in drug expenditures, or 1.3% of the entire pharmaceutical market in Canada.
Pricing of biosimilars for Remicade, Canada versus the PMPRB7 and other OECD countries*, 2015
Click on image for larger view
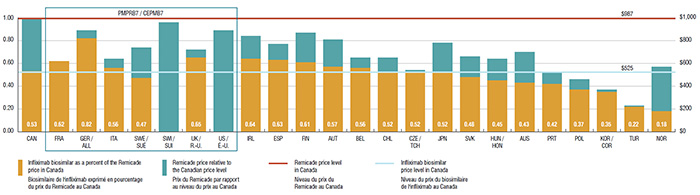
*France, Germany, Italy, Sweden, Switzerland, the United Kingdom, the United States, Ireland, Spain, Finland, Austria, Belgium, Chili, the Czech Republic, Japan, Slovakia, Hungry, Australia, Portugal, Poland, South Korea, Turkey and Norway.
Figure description
This bar graph illustrates the pricing of the biosimilar for Remicade in Canada versus the PMPRB7 and select Organisation for Economic Co-operation and Development countries in 2015. The Remicade price level in Canada – $978 – is given as one. The biosimilar price in Canada is $525.
blank
|
Infliximab biosimilar as a percent of the Remicade price in Canada |
Remicade price above the price of the infliximab biosimilar |
| Canada |
0.53 |
0.47 |
| France |
0.62 |
0.00 |
| Germany |
0.82 |
0.07 |
| Italy |
0.56 |
0.08 |
| Sweden |
0.47 |
0.27 |
| Switzerland |
– |
0.96 |
| United Kingdom |
0.65 |
0.07 |
| United States |
– |
0.89 |
| Ireland |
0.64 |
0.20 |
| Spain |
0.63 |
0.14 |
| Finland |
0.61 |
0.26 |
| Austria |
0.57 |
0.24 |
| Belgium |
0.56 |
0.09 |
| Chili |
0.52 |
0.13 |
| Czech Republic |
0.52 |
0.02 |
| Japan |
0.52 |
0.26 |
| Slovakia |
0.48 |
0.18 |
| Hungry |
0.45 |
0.19 |
| Australia |
0.43 |
0.27 |
| Portugal |
0.42 |
0.10 |
| Poland |
0.37 |
0.09 |
| South Korea |
0.35 |
0.02 |
| Turkey |
0.22 |
0.01 |
| Norway |
0.18 |
0.39 |
5. Canadian public and private drug plans pay for most of the costs related to biologic DMARDS
Over 90% of the costs of biologic DMARDS are reimbursed through either public or private plans, with a balanced split.
Both the public and private market segments have seen a remarkable growth in the total cost of biologic DMARDS in recent years, mainly fueled by the top-selling drug Remicade.
Trends in public drug plan costs* for biologic DMARDS, 2010 to 2015
Click on image for larger view
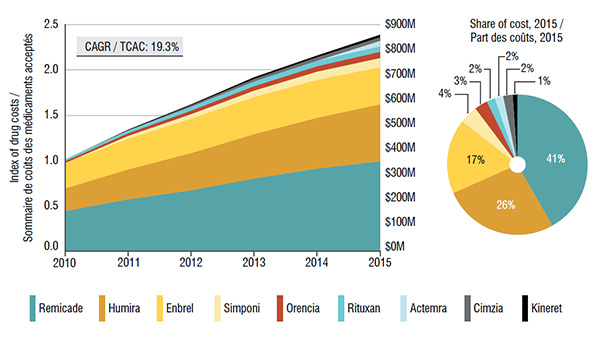
*Markups and dispensing costs are excluded.
Figure description
These two graphs depict the trends in public drug plan costs for biologic DMARDS from 2010 to 2015.
The area graph shows growth in drug costs in public drug plans (compound annual growth rate of 19.3%) as an index, with 2010 set to a value of one. The area is further broken down into the contribution of each drug. The total sales for all drugs are also given for each year.
blank
|
2010 |
2011 |
2012 |
2013 |
2014 |
2015 |
| Remicade |
0.44 |
0.57 |
0.67 |
0.80 |
0.91 |
0.99 |
| Humira |
0.25 |
0.33 |
0.41 |
0.49 |
0.56 |
0.63 |
| Enbrel |
0.28 |
0.34 |
0.38 |
0.41 |
0.42 |
0.41 |
| Simponi |
0.00 |
0.03 |
0.05 |
0.07 |
0.09 |
0.10 |
| Orencia |
0.02 |
0.03 |
0.04 |
0.05 |
0.06 |
0.07 |
| Rituxan |
0.02 |
0.03 |
0.04 |
0.05 |
0.06 |
0.06 |
| Actemra |
0.00 |
0.00 |
0.00 |
0.00 |
0.00 |
0.06 |
| Cimzia |
0.00 |
0.00 |
0.02 |
0.03 |
0.04 |
0.04 |
| Kineret |
0.00 |
0.01 |
0.01 |
0.02 |
0.02 |
0.03 |
| Total |
1.00 |
1.34 |
1.63 |
1.93 |
2.17 |
2.39 |
| Actual sales |
$337.4M |
$452.5M |
$551.3M |
$650.8M |
$732.9M |
$814.2M |
The accompanying pie chart gives the share of costs for each drug in 2015:
blank
|
Share of costs |
| Remicade |
41% |
| Humira |
26% |
| Enbrel |
17% |
| Simponi |
4% |
| Orencia |
3% |
| Rituxan |
2% |
| Actemra |
2% |
| Cimzia |
2% |
| Kineret |
1% |
Limitations: The report was published under the NPDUIS initiative and provides information on drug price, utilization and cost trends. The report does not analyze disease incidence and prevalence, the effectiveness of treatments, or the impact of disease on the health-care system and society as a whole.
Foreign and Canadian national sales and prices are based on manufacturer list prices and do not capture off-invoice price rebates and allowances, managed entry agreements, or patient access schemes.
Data sources: The main data include IMS AG’s MIDAS™ Database (All rights reserved); the Canadian Institute for Health Information’s (CIHI) NPDUIS Database; IMS Brogan’s Private Drug Plan Database; IMS Brogan’s Payer Insight Database; and the PMPRB Human Drug Advisory Panel reviews. Additional data was obtained from Health Canada’s Drug Product Database; the European Medicines Agency’s orphan drug database; the Canadian Agency for Drugs and Technologies in Health (CADTH) Common Drug Review reports; and the United Nation’s world population statistics.
Disclaimer: Although based in part on data obtained from the CIHI and under license from IMS AG’S MIDAS™ Database, the IMS Brogan Payer Insight Database, and the IMS Brogan Private Drug Plan Database, the statements, findings, conclusions, views and opinions expressed in this report are exclusively those of the PMPRB and are not attributable to CIHI, IMS AG, or IMS Brogan.
NPDUIS is a research initiative that operates independently of the regulatory activities of the PMPRB.