Private Drug Plans in Canada: Cost Drivers, 2008 to 2015
PDF - 400 kb
After a few years of slow growth, there has been an increasingly upward pressure on prescription drug spending in Canada. This report analyzes the recent trends in expenditures from the perspective of Canadian private drug plans, with a focus on drug costs in 2015. It explores the drivers of change, identifying the most important cost pressures and measuring their impact on expenditure levels. This study complements the annual PMPRB CompassRx report, which provides a similar analysis of the public drug plan environment.
This is one of three reports in a PMPRB series that analyzes the trends in Canadian private drug plans. This series provides policy makers and other stakeholders with valuable insights into the sources of cost pressures in private drug plans and supports them in predicting future trends and identifying cost-saving opportunities.
The cost-driver analysis used in this study isolates five main factors contributing to the growth in drug expenditures: changes in the beneficiary population (demographic effect); changes in the volume of drugs used (volume effect); shifts in the use of drugs (drug-mix effect); changes in drug pricing (price effect); and changes in the use of generics (generic substitution effect).
Recent trends in private drug plans point toward a marked increase in drug costs driven largely by newer and more expensive drugs. The generic price reductions and greater availability of generic molecules that pulled expenditures downward in previous years now have a less pronounced impact and are no longer able to offset the increasing cost pressures of the demographic and drug-mix effects.
Push Effects / Pull Effects
Click on image for larger view
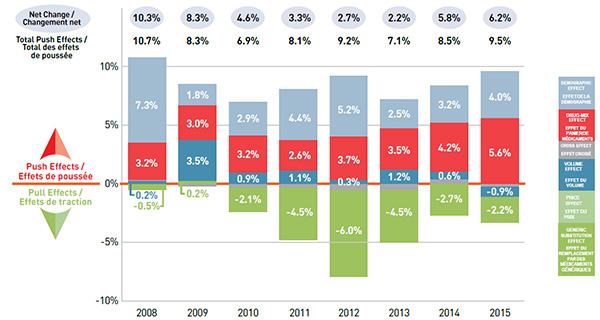
Figure description
This graph describes the factors that impacted the rates of change in drug cost in Canadian private drug plans from 2008 to 2015.
| Year |
Demographic effects |
Drug-mix effects |
Volume effects |
Price effects |
Cross effects |
Net change |
Total push effects |
| 2008 |
7.3% |
3.2% |
0.2% |
-0.5% |
0.1% |
10.3% |
10.7% |
| 2009 |
1.8% |
3.0% |
3.5% |
0.2% |
-0.2% |
8.3% |
8.3% |
| 2010 |
2.9% |
3.2% |
0.9% |
-2.1% |
-0.3% |
4.6% |
6.9% |
| 2011 |
4.4% |
2.6% |
1.1% |
-4.5% |
-0.3% |
3.3% |
8.1% |
| 2012 |
5.2% |
3.7% |
0.3% |
-6.0% |
-0.5% |
2.7% |
9.2% |
| 2013 |
2.5% |
3.5% |
1.2% |
-4.5% |
-0.5% |
2.2% |
7.1% |
| 2014 |
3.2% |
4.2% |
0.6% |
-2.7% |
0.4% |
5.8% |
8.5% |
| 2015 |
4.0% |
5.6% |
-0.9% |
-2.2% |
-0.2% |
6.2% |
9.5% |
Demographic Effect Up 4.0%
Changes in the beneficiary population pushed drug costs upward by 4.0% in 2015.
This was mainly due to a 3.3% growth in the number of active beneficiaries. Aging also emerged as a contributing factor, pushing costs upward by 0.7% as more active beneficiaries entered the 55-64 age group, accounting for an increased share of the beneficiary population (17.4% in 2015, up from 13.2% in 2005). This group has the highest average spending per active beneficiary (about $1,000) in private drug plans. The senior population (65+) is also an emerging age group in private drug plans, making up 7.3% of the beneficiary population in 2015. However, the average spending per senior in private plans is relatively low (about $600), reflecting incomplete utilization and cost due to the coordination with their publicly reimbursed benefits.
The cost per active beneficiary has been on the rise in the last three years for all age groups. This follows a notable decline from 2010 to 2012 when the patent cliff impact and major generic price reductions lowered the costs for chronic medications mainly used by older age groups.
Demographic effect
Click on image for larger view
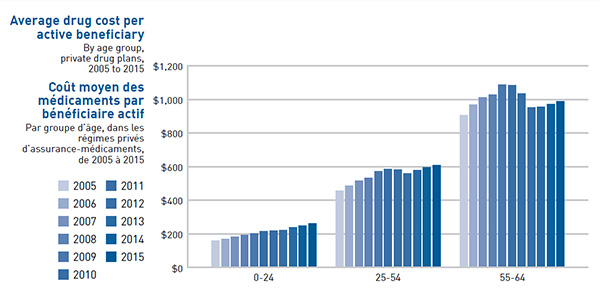
Figure description
This bar graph depicts the annual average drug cost per active beneficiary from 2005 to 2015 for three age groups: 0 to 24 years of age; 25 to 54 years of age; and 55 to 64 years of age.
| Year |
0‒24 age group |
25‒54 age group |
55‒64 age group |
| 2005 |
159.3 |
456.6 |
906.6 |
| 2006 |
169.1 |
487.1 |
969.5 |
| 2007 |
183.6 |
515.7 |
1,013.4 |
| 2008 |
191.1 |
533.2 |
1,027.2 |
| 2009 |
203.7 |
570.9 |
1,089.3 |
| 2010 |
214.9 |
585.9 |
1,084.8 |
| 2011 |
219.8 |
582.7 |
1,036.4 |
| 2012 |
221.8 |
560.5 |
951.9 |
| 2013 |
239.1 |
580.5 |
956.0 |
| 2014 |
248.6 |
595.6 |
973.2 |
| 2015 |
260.8 |
607.7 |
989.9 |
Drug-Mix Effect Up 5.6%
The impact of the drug-mix effect has been increasingly pronounced in recent years (2012–2015). Highercost drugs entering the market and shifts in use from lower- to higher-cost drugs increased costs by 4.2% in 2014 and 5.6% in 2015, up from approximately 3% per year in 2008 to 2011.
The top five drugs contributing to cost growth had a greater impact in 2015 than in 2014. This is mainly due to the new hepatitis C treatments, Sovaldi and Harvoni, which made a significant contribution to drug costs, pushing the overall levels up by 1.0% in 2014 (Sovaldi) and 2.0% (Harvoni) in 2015. The increased use of established biologics also had a notable influence on the drug-mix effect.
Drug-Mix Effect
Click on image for larger view
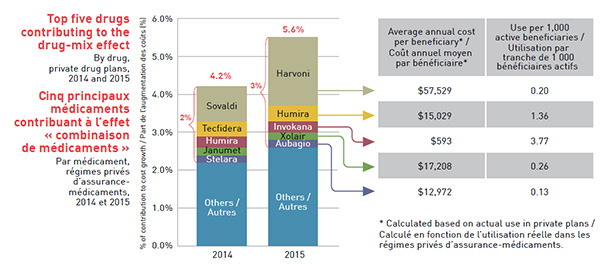
Figure description
This segmented bar graph illustrates how the five top-selling drugs impacted the growth in drug costs for 2014 and 2015.
The left-hand bar for 2014 shows a 4.2% growth in costs attributable to the drug-mix effect. The five top-selling drugs for that year were responsible for approximately 2% of this growth.
| 2014 |
Contribution to cost growth (%) |
| Sovaldi |
0.9 |
| Tecfidera |
0.4 |
| Humira |
0.3 |
| Janumet |
0.2 |
| Stelara |
0.2 |
The right-hand bar for 2015 shows a 5.6% growth in costs attributable to the drug-mix effect. The five top-selling drugs for that year were responsible for approximately 3% of this growth. The cost per beneficiary and use per 1,000 active beneficiaries is also given for each of these drugs in a table beside the graph.
| 2015 |
Contribution to cost growth (%) |
Average annual cost per beneficiary based on actual use in private drug plans |
Use per 1,000 active beneficiaries |
| Harvoni |
1.8 |
$57,529 |
0.20 |
| Humira |
0.4 |
$15,029 |
1.36 |
| Invokana |
0.3 |
$593 |
3.77 |
| Xolair |
0.2 |
$17,208 |
0.26 |
| Aubagio |
0.2 |
$12,972 |
0.13 |
Cross Effect Down 0.2%
The cross effect results from the interaction between the individual effects.
Volume Effect Down 0.9%
A decrease in the number of prescriptions in some jurisdictions pulled drug costs down by 0.9% in 2015.
The pull effect on costs was mainly the result of decreases in the volume of prescriptions at the beneficiary level in Newfoundland and Labrador and Manitoba.
Price Effect Down 0.3%
The offsetting influences of generic price reductions and brand-name price increases resulted in a minimal pull down pricing effect of 0.3% in 2015.
While the pricing effect had an important impact on cost level reductions several years ago, mainly due to the introduction of major generic pricing policies, it was only responsible for a slight pull in drug costs in 2015.
Although the lower generic pricing achieved through provincial policies benefit the private drug plans, some top-selling generics are not subject to the provincial pricing rules and have relatively high prices.
Price Effect
Click on image for larger view
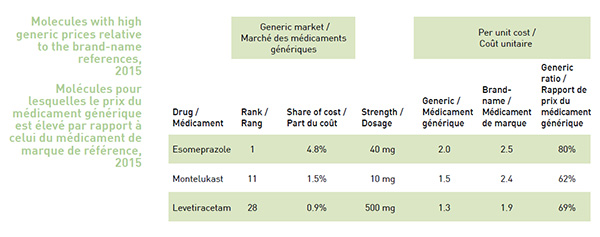
Figure description
Molecules with high generic prices relative to the brand-name references, 2015
Drug
(Generic Market) |
Rank
(Generic Market) |
Share of Cost
(Generic Market) |
Strength
(Generic Market) |
Generic
(Per Unit Cost) |
Brand-name
(Per Unit Cost) |
Generic Ratio
(Per Unit Cost) |
| Esomeprazole |
1 |
4.8% |
40 mg |
2.0 |
2.5 |
80% |
| Montelukast |
11 |
1.5% |
10 mg |
1.5 |
2.4 |
62% |
| Levetiracetam |
28 |
0.9% |
500 mg |
1.3 |
1.9 |
69% |
Generic Substitution Effect Down 1.9%
Greater generic substitution in private drug plans had a moderate pull down effect of 1.9% in 2015.
The shift from higher-cost brandname drugs to lower-cost generics had a less pronounced effect in 2015 than in previous years. This is mainly due to the decreasing impact of the patent cliff as it comes to an end.
Even though the generic substitution rate for top-selling products in private drug plans is high, mirroring that in public plans and ranging from 93% to 97%, limiting the reimbursement of brand-name drugs to generic price levels could result in cost savings in private drug plans, as the non-patented brand-name products are reimbursed at much higher unit cost levels.
Generic Substitution Effect
Click on image for larger view
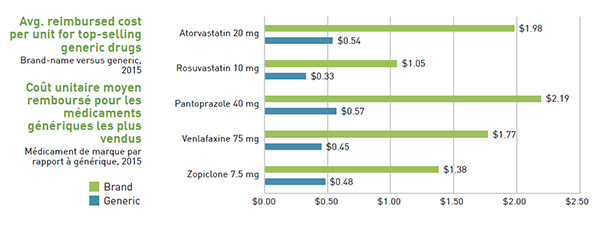
Figure description
This bar graph compares the average amount reimbursed for the brand-name and relevant generic versions of five top-selling generic drugs in 2015 in private drug plans
| |
Brand-name (average cost per unit) |
Generic (average cost per unit) |
| Atorvastatin 20 mg |
$1.98 |
$0.54 |
| Rosuvastatin 10 mg |
$1.05 |
$0.33 |
| Pantoprazole 40 mg |
$2.19 |
$0.57 |
| Venlafaxine 75 mg |
$1.77 |
$0.45 |
| Zopiclone 7.5 mg |
$1.38 |
$0.48 |
Data Source: IMS Brogan Private Pay Direct Drug Plan Database. Capture rate: 85.7%.
Methods: The cost driver analysis follows the approach detailed in the PMPRB report The Drivers of Prescription Drug Expenditures: A Methodological Report, 2013.
Disclaimer: Although based in part on data provided under license by IMS Brogan, the statements, findings, conclusions, views and opinions expressed in this report are exclusively those of the PMPRB and are not attributable to IMS Brogan.
NPDUIS is a research initiative that operates independently of the regulatory activities of the PMPRB.