Private Drug Plans in Canada - Part 1: Generic Market 2005–2013
Acknowledgements
This report was prepared by the Patented Medicine Prices Review Board (PMPRB) as part of the National Prescription Drug Utilization Information System (NPDUIS).
The PMPRB would like to acknowledge the contributions of:
- The members of the NPDUIS Advisory Committee, for their expert oversight and guidance in the preparation of this report.
- The PMPRB NPDUIS staff for their contribution to the analytical content of the report:
- Tanya Potashnik – Director, Policy and Economic Analysis
- Elena Lungu – Manager, NPDUIS
- Carol McKinley – Communication Advisor
- The PMPRB scientific and editing groups
Disclaimer
NPDUIS is a research initiative that operates independently of the regulatory activities of the Board of the PMPRB. The statements and opinions expressed in this NPDUIS report do not represent the position of the PMPRB with respect to any regulatory matter.
Parts of this material are based on data and information provided by the Canadian Institute for Health Information. However, the analyses, conclusions and/or statements expressed herein are not those of the Canadian Institute for Health Information.
Although based in part on data obtained under license from the IMS Brogan Private Pay Direct Drug Plan Database and IMS AG’s MIDAS™ Database, the statements, findings, conclusions, views and opinions expressed in this report are exclusively those of the PMPRB and are not attributable to either IMS Brogan or IMS AG.
Contact Information
Patented Medicine Prices Review Board
Standard Life Centre
Box L40
333 Laurier Avenue West
Suite 1400
Ottawa, ON K1P 1C1
Telephone: 1-877-861-2350
TTY: 613-288-9654
Email: PMPRB.Information-Renseignements.CEPMB@pmprb-cepmb.gc.ca
Executive Summary
Significant developments in the generic drug market have recently shaped the drug expenditure landscape in Canada. Many blockbuster brand-name drugs have lost patent protection and are now facing generic competition. In addition, most provincial governments have implemented generic pricing policies that have reduced the price of generic drugs in Canada. Both trends have undoubtedly resulted in important cost savings and have slowed the growth of drug expenditures in Canada.
This report focuses on these trends from the perspective of Canadian private drug plans, providing insight into the evolving generic market shares and the reimbursed unit costs, as well as dispensing patterns and their impact on overall prescription costs. A comparative analysis with Canadian public drug plans and select international markets is also included in the study. The reporting focuses on the 2013 calendar year, with a retrospective look at the trends since 2005.
This is the first of three reports in a PMPRB series that analyzes trends in Canadian private drug plans. The other two reports focus on cost drivers and high-cost drugs. The series provides policy makers and researchers with insights into relevant trends, sources of cost pressures, and possible areas for cost-saving opportunities. Private insurance is the second largest market for prescribed drugs in Canada, accounting for an estimated 34.5% ($10.1 billion) of prescribed drug spending in 2013 (CIHI 2014).
Previous PMPRB reports analyzed the generic market and drug plans in Canada from various perspectives. A recent report examined the reduction in generic prices, and concluded that Canadian generic drug price levels in 2013 continued to be higher than those of other industrialized countries (PMPRB 2014). Another study analyzed the cost drivers in public drug plans and found that generic substitution and price reductions exerted an important pull-down effect on drug costs in public drug plans in 2012/13 (PMPRB 2015).
The main data source for this report was the IMS Brogan Private Pay Direct Drug Plan Database. The results for private plans were compared with a select number of public drug plans in the National Prescription Drug Utilization Information System Database, Canadian Institute for Health Information. The IMS AG MIDAS™ Database was used for the international market analysis.
Key Findings
Despite significant differences in plan design and beneficiary populations, the use and cost of generic drugs in most private plans were similar to those in public plans in 2013. Private plans in Quebec were a notable exception, with lower generic market shares and higher prescription costs compared to other private and public plans. The frequency of dispensing was a key factor in driving differences in the prescription costs for generic drugs, especially in private plans in Quebec, where it resulted in higher costs being reimbursed for the dispensing of any given quantity of drugs. Most other private plans had a lower dispensing frequency than their corresponding public plans, resulting in lower prescription costs for generics.
Canada had one of the highest generic market shares in 2013.
Compared to the other seven industrialized countries that the PMPRB considers in reviewing the prices of patented drug products, Canada had the third highest generic market share in terms of drug volume (70%) after Germany (72%) and the US (78%).
The generic market share in private plans increased in recent years, but continued to be lower than in public plans.
The generic share of prescriptions in private plans has increased markedly in recent years, from 37% in 2005 to 55% in 2013. Despite this increase, the share remained lower than in public plans, which was 71% in 2013.
The differences in generic market shares in private and public plans reflected the demographic and disease profiles of the populations.
There are differences in the demographic and disease profiles of the beneficiary populations in private and public plans which explain, for the most part, the differences in generic market shares. However, at drug level, the generic market share in most private plans closely mirrors those in corresponding public plans. A complete alignment of the use of generics between private and public plans would only result in marginal increases in private generic market shares and any related cost-savings.
Limiting the reimbursement of brand-name drugs to the generic price level would have resulted in important cost savings in all private plans.
In 2013, if the private plans had limited the reimbursement of brand-name drugs in oral solid form to the generic price level, up to 9.6% of prescriptions would have been impacted. This would have increased the share of prescriptions reimbursed at the generic price level to 65%, resulting in an estimated reduction of up to 5.7% in retail drug costs.
Generic Share of Prescriptions in Private Plans, 2013
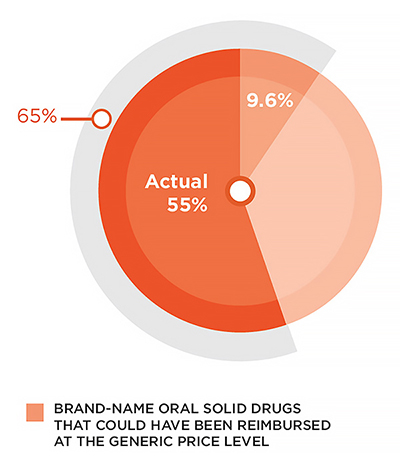
Figure description
This pie graph illustrates the share of generic prescriptions for oral solid drugs in Canadian private plans. In 2013, generic drugs represented 55% of all prescriptions. An additional 9.6% of prescriptions were for brand-name drugs with available generic equivalents. If these drugs had been reimbursed at the generic price level, this would have brought the total generic share to 65%.
Note: Estimated results are restricted to oral solid drugs with both brand and generic availability and with over 1,000 annual prescriptions.
Data source: IMS Brogan Private Pay Direct Drug Plan Database.
Provincial generic pricing policies resulted in significant cost savings for private plans.
Generic pricing policies introduced by most provincial governments markedly reduced the prices of generic drugs reimbursed by private plans from an average of 63% of the brand-reference in 2010 to 42% in 2013. These reductions resulted in important cost savings for private plans, ranging from 8% to 13% of the overall retail drug cost in 2013, depending on the province.
Public and private plans reimburse approximately the same retail drug cost for generic drugs.
At a provincial level, private and public plans reimbursed comparable average retail drug costs per unit for generic drugs. Private plans in New Brunswick, Nova Scotia and Alberta were notable exceptions, with higher retail unit cost levels (5% to 8%), suggesting higher markups than in the corresponding public plans. Interprovincial variations in 2013 resulted from the evolving provincial generic pricing policies.
Private plans reimbursed a lower cost per prescription for generic drugs due to less frequent dispensing.
The full prescription cost is composed of both the retail drug cost and the dispensing cost. For generics, the dispensing cost may make up a sizable portion of the prescription cost, especially when small quantities of low-cost generic drugs are being dispensed. The frequency of dispensing was relatively low in private compared to public plans, as suggested by larger prescription sizes (average number of units per prescription). This resulted in fewer fees being reimbursed in private plans for the dispensing of any given quantity of drugs. Hence, in 2013 the average prescription cost was 5% to 12% lower in private compared to public plans, depending on the province.
In 2013, private plans in Quebec had low generic market shares and considerably high prescription costs relative to private and public plans in all other provinces.
The generic share of prescriptions in Quebec was 53% in 2013, the lowest in Canada. If private plans in this province had limited the reimbursement of brand-name drugs in oral solid form to the generic price level, up to 12.2% of prescriptions would have
been impacted. This would have increased the share of prescriptions reimbursed at the generic price level to 65%, resulting in an estimated reduction of up to 6.9% in overall prescription costs.
Generic Share of prescriptions in Quebec Private Plans, 2013
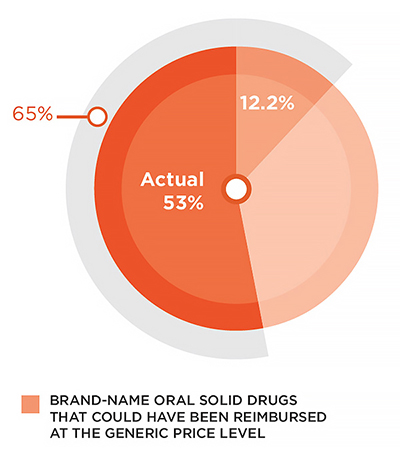
Figure description
This pie graph illustrates the share of generic prescriptions for oral solid drugs in private plans in Quebec. In 2013, generic drugs represented 53% of all prescriptions. An additional 12.2% of prescriptions were for brand-name drugs with available generic equivalents. If these drugs had been reimbursed at the generic price level, this would have brought the total generic share in Quebec to 65%.
Note: Estimated results are restricted to oral solid drugs with both brand and generic availability and with over 1,000 annual prescriptions.
Data source: IMS Brogan Private Pay Direct Drug Plan Database.
The frequency of dispensing was a key factor in driving the prescription costs for generics in private plans in Quebec to levels 64% higher than those in Ontario. On average, 35 units of oral solid medication were dispensed per prescription in private plans
in Quebec, which was much less than the Ontario average of 64.
Note that the results of this study represent a snapshot in time with a focus on 2013. Since then, the generic market landscape in Canada has evolved in terms of both generic drug launches and policy changes.
- CIHI. 2014. Prescribed Drug Spending in Canada, 2013: A Focus on Public Drug Programs. Ottawa: Canadian Institute for Health Information, page vii.
- PMPRB. 2014. Generic Drugs in Canada, 2013. Ottawa: Patented Medicine Prices Review Board.
- PMPRB. 2015. NPDUIS CompassRx: Annual Public Drug Plan Expenditure Report, 1st Edition. Ottawa: Patented Medicine Prices Review Board.
Introduction
While prescription drug spending represents a significant component of the overall health care costs in Canada, the annual rate of change has been gradually declining in recent years. In 2013 it reached an estimated 2.3%—the second-lowest rate in more than two decades (CIHI 2014). Generic drugs have played an important part in attenuating this growth. Many blockbuster brand-name drugs have lost patent protection and are now facing generic competition. In addition, most provincial governments have implemented generic pricing policies which have reduced the price of generic drugs in Canada and have resulted in important cost savings (Appendix B).
This report focuses on these developments from the perspective of private drug plans in Canada, providing insight into evolving generic market shares, reimbursed unit costs, as well as dispensing patterns and their impact on overall prescription costs. Results are for the 2013 calendar year, with a retrospective look at the trends since 2005. A comparative analysis with Canadian public drug plans, as well as select international markets, is also included in the report. The analysis identifies cost-saving opportunities through increased generic substitution, while highlighting the impact of dispensing patterns on the overall prescription costs for generics.
This is the first of three reports in a PMPRB series that analyzes the trends in Canadian private drug plans. Other reports will focus on cost drivers and high-cost drugs. The series provides policy makers and other stakeholders with valuable insights into the sources of cost pressures in private drug plans and identifies cost-saving opportunities.
Previous PMPRB reports have analyzed the generic market in Canada from various perspectives. A recent report concluded that Canadian generic drug price levels in 2013 continued to be higher than those of other industrialized countries (PMPRB 2014) despite the significant domestic price reductions attained through pan-Canadian efforts. Another study analyzed the cost drivers in public drug plans and found that generic substitution and price reductions exerted an important pull-down effect on drug costs in these plans in 2012/13 (PMPRB 2015).
This report is divided into six sections: Section 1 presents a brief overview of generic drug use and market shares in Canadian private and public drug plans, as well as in international markets. Through a therapeutic analysis of generic drug use, Section 2 provides further insight into the differences in market shares between private and public plans. Section 3 estimates the potential cost-savings that could be achieved through increased generic substitution. In Section 4, the average reimbursed unit costs in private markets are compared with those in public plans. Section 5 highlights the effect of prescription size on generic drug expenditures in private and public drug plans. To further illustrate the findings of the report, a case study of the top-selling generic drug atorvastatin is presented in Section 6.
Backgrounder - Private Drug Plans in Canada
Private drug plans play an important role in drug reimbursement in Canada and are key stakeholders in the health-care system.
Prescription drug costs in Canada are covered by a blend of public and private drug plans, as well as out-of-pocket payers. While all provinces and territories provide prescription drug coverage to specific population groups (typically seniors, lower-income earners or those with high drug costs in relation to their income), for the most part, private drug plans cover working-age beneficiaries and their dependants.
Drugs are only one component of the privately delivered supplementary health benefits, which also include hospital accommodation, vision care, travel insurance, paramedical services and dental care. Employers balance all of their benefits to attract and retain employees, as well as to ensure a healthy and productive workforce.
Canadians can purchase private insurance directly or they can receive coverage through their employer benefits package (the more usual option). Employers can choose different coverage structures: (i) fully insured – the risk rests with the insurer, (ii) administrative services only (A.S.O.) – the risk rests with the employer, or (iii) hybrid plans – insurer and employer share the risk.
Private plans generally cover all prescription drugs, although private formulary plans also exist. Cost sharing structures take the form of co-insurance, co-payments, deductibles, and maximums. Recent concerns over the long-term sustainability of private plans in Canada have resulted in an increased use of cost management mechanisms, such as, mandatory generic substitution, greater use of managed formularies, prior authorization and multi-tiering (promoting the use of more cost-effective medicines), preferred pharmacy networks, increased cost sharing, pooling of high-cost beneficiaries and the elimination of retiree benefits, among others.
Private insurance is the second largest market for prescribed drugs in Canada, accounting for an estimated 34.5% ($10.1 billion) of the spending in 2013 (CIHI 2014). The data reported in this study pertains to a large sample of Canadian private pay direct drug plans, covering 133 million prescriptions and $8.0 billion in total prescription cost (drug cost, markup and dispensing fees).
Methods
The main data source for this report is the IMS Brogan Private Pay Direct Drug Plan DatabaseFootnote 1 for the calendar years 2005 through 2013. This data is used to report on results at the national and provincial levels for the private drug plans. All Canadian provinces are included in this dataset.
The report also analyzes information contained in the National Prescription Drug Utilization Information System (NPDUIS) Database, developed by the Canadian Institute for Health Information (CIHI). This database houses pan-Canadian information on public drug programs, including de-identified prescription claims-level data collected from the plans participating in the NPDUIS initiative. Results are restricted to the public drug plans whose data was available at the time of the study: Alberta, Saskatchewan, Manitoba, Ontario, New Brunswick, Nova Scotia and Prince Edward Island.
The MIDAS™ database from IMS AG (All Rights Reserved) is used for the international comparative analysis. The foreign markets analyzed are the seven that the PMPRB considers in reviewing the prices of patented drug products (PMPRB7): France, Germany, Italy, Sweden, Switzerland, the United Kingdom and the United States.
The report analyzes various measures of cost. The retail drug cost includes the drug cost and markup accepted for reimbursement by the private or public plans analyzed and excludes the dispensing costs. The prescription cost includes all three cost components— drug costs, markups and dispensing costs—and is reflective of both plan-paid and patient-paid portions.
The acquisition cost is based on the average drug cost per unit accepted for reimbursement by public plans, excluding markups and dispensing costs. This is an assumed cost, as it reflects the amount accepted for reimbursement, which may differ from the amount claimed by a pharmacy.
Retail Drug Cost = Drug Cost + Markup
Prescription Cost =
Drug Cost + Markup + Dispensing Cost
Acquisition Cost =
Drug Cost in Public Plan / Units
Retail Drug Cost Per Unit =
(Drug Cost + Markup) / Units
Prescription Cost Per Unit =
(Drug Cost + Markup + Dispensing Cost) / Units
These amounts refer to what was accepted for reimbursement by the drug plans. See Appendix A for definitions.
A wholesale upcharge amount may be captured in the acquisition cost, depending on the specific reimbursement policies of each drug plan (Appendix C).
The acquisition cost is used to derive estimates of the private drug plan markups. This cost may vary between private and public plans and across provinces due to differences in the pharmacy level costs, which depend on the wholesaler upcharges and established distribution networks.
Analyses of the average cost per unit in Sections 3, 4 and 5 are restricted to oral solid drugs due to the inconsistency in unit reporting for other types of formulations (e.g., inhalers, infusions, etc.). The drugs in oral solid form account for the majority of the prescriptions (89%) for generic drugs and their related costs (91%).
The therapeutic classification used in the analysis is based on the World Health Organization Anatomical Therapeutic Chemical Classification System (ATC). The second ATC level is reported, which relates to the therapeutic main group.
In this report the term “drug” refers to any unique combination of active ingredient, strength and form. The generic market analysis is based on the IMS Brogan and IMS MIDAS™ identifications of “generic drug”. The brand-name and generic identification available in the IMS Brogan Private Pay Direct Drug Plan Database was extended to the NPDUIS Database, CIHI.
Limitations
The results in this report represent a snapshot in time, with a focus on 2013. Since then, the generic market landscape in Canada has evolved, both in terms of additional brand-name drugs facing generic competition, and also in terms of policy changes. Specifically, the impact of recent provincial pricing policies is not fully reflected in the results (Appendix B). In addition, Bill 28Footnote 2, passed by the Quebec government, allows private plans to limit the reimbursement of brand-name drugs for which a generic exists, starting on October 1, 2015.
The comparative analysis of the average provincial retail drug cost per unit does not include private plans in Quebec, as the available retail drug cost for this province includes the dispensing cost component. Consequently, only the results for the total prescription cost are reported for private plans in Quebec.
Private drug plan data was available for all provinces; however, at the time of the study, public drug plan data was only available for Alberta, Saskatchewan, Manitoba, Ontario, New Brunswick, Nova Scotia and Prince Edward Island. Comparative analyses are limited to the provinces for which both private and public drug plan data was available.
The results presented may vary by province and plan partly due to differences in the demographic and disease profiles of the active beneficiary populations. The variation in the availability of specific sub-plans in the public data also limits the comparability of the results across plans.
1. Overview of the Generic Market
The market share of generic drugs in private plans has increased markedly in recent years, from 37% in 2005 to 55% in 2013. Despite this increase, it remained lower than the market share in public plans, which was 71% in 2013. Private plans in Quebec had the lowest rate of generic use in Canada in 2013 (53%). Compared to foreign markets, Canada had one of the highest market shares of generic drugs.
Following the loss of patent protection for many blockbuster drugs, generics have captured an increasing share of the market in recent years. Figure 1.1 reports the trend in market share for generics in private drug plans in terms of prescriptions, retail drug cost and prescription cost.
Generic drugs are generally less costly than brand-name drugs. In 2013, they accounted for 55% of prescriptions, but only 23% of the retail drug cost and 28% of the prescription cost. While the share of prescriptions for generic drugs has been increasing in recent years, the share of the retail drug cost has been on a slight decline following the implementation of provincial generic pricing policies. The generic share of the prescription cost (including dispensing costs) has remained constant since 2010, at 28%, despite the evolving market dynamics.
Figure 1.1 Generic market share in private drug plans, 2005–2013
Click on image for larger view
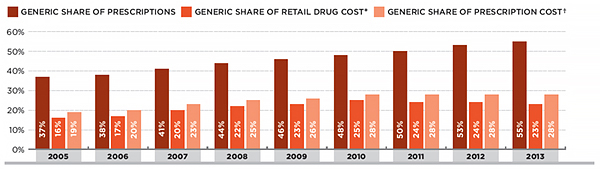
Figure description
This is a bar graph depicting the trend in market share for generics in private drug plans in Canada in terms of prescriptions, retail drug cost and prescription cost. The generic share of prescriptions in 2005, in percent, was 37. 2006: 38; 2007: 41; 2008: 44; 2009: 46; 2010: 48; 2011: 50; 2012: 53; 2013: 55.
The generic share of retail drug cost (which includes drug cost and markup, but excludes dispensing cost) in 2005, in percent, was 16. 2006: 17; 2007: 20; 2008: 22; 2009: 23; 2010: 25; 2011: 24; 2012: 24; 2013: 23.
The generic share of prescription cost (which includes drug cost, markup and dispensing cost) in 2005, in percent, was 19; 2006: 20; 2007: 23; 2008: 25; 2009: 26; 2010: 28; 2011: 28; 2012: 28; 2013: 28.
* Includes drug cost and markup; excludes dispensing cost.
† Includes drug cost, markup and dispensing cost.
Data source: IMS Brogan Private Pay Direct Drug Plan Database.
Although generic drug use in private plans has increased in recent years, in 2013, the market share of generic drugs was still lower than in public plans, 55% versus 71% of prescriptions (Figure 1.2). The generic share of retail drug costs was also lower in private plans (23%) compared to public plans (27%). The generic capture rates may vary by province and plan partly due to differences in the demographic and disease profiles of the active beneficiary populations. The variations in the availability of specific sub-plans in the public data also limit the comparability of the generic capture rates across plans.
Figure 1.2 Generic market share in private versus public drug plans, 2013
Click on image for larger view
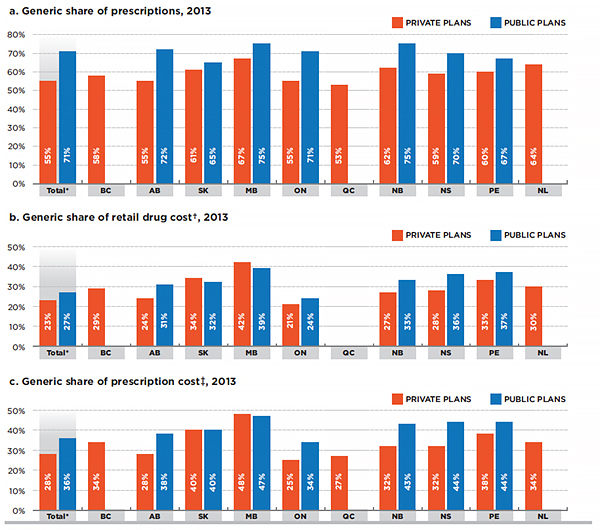
Figure description
This is a series of three bar graphs comparing the generic market share in private and public drug plans in 2013. Results are given for individual provinces as well as for the total of all provinces reported. The first graph gives the share of prescriptions; the second gives the share of retail cost; and the third gives the share of prescription cost.
a) Generic share of prescriptions, 2013
For all private plans reported, generic drugs made up 55% of the total prescriptions in 2013. For British Columbia generics represented 58% of prescriptions. In percent, Alberta: 55; Saskatchewan: 61; Manitoba: 67; Ontario: 55; Quebec: 53; New Brunswick: 62; Nova Scotia: 59; Prince Edward Island: 60; Newfoundland and Labrador: 64.
For all public plans reported, generic drugs made up 71% of the total prescriptions in 2013. For British Columbia, public drug plan data was not available. In percent, Alberta: 72; Saskatchewan: 65; Manitoba: 75; Ontario: 71; Quebec: not available; New Brunswick: 75; Nova Scotia: 70; Prince Edward Island: 67; Newfoundland and Labrador: not available.
b) Generic share of retail drug cost, 2013
For all private plans reported, the total generic share of retail drug cost (which includes drug cost and markup but excludes dispensing cost) was 23% in 2013. For British Columbia, the generic share of retail drug cost in private plans was 29%. In percent, Alberta: 24; Saskatchewan: 34; Manitoba: 42; Ontario: 21; Quebec: not available; New Brunswick: 27; Nova Scotia: 28; Prince Edward Island: 33; Newfoundland and Labrador: 30.
For all public plans reported, the total generic share of retail drug cost (which includes drug cost and markup but excludes dispensing cost) was 27% in 2013. For British Columbia, no information was available. In percent, Alberta: 31; Saskatchewan: 32; Manitoba: 39; Ontario: 24; Quebec: not available; New Brunswick: 33; Nova Scotia: 36; Prince Edward Island: 37; Newfoundland and Labrador: not available.
c) Generic share of prescription cost, 2013
For all private plans reported, the total generic share of the prescription cost (which includes drug cost, markup and dispensing cost) was 28% in 2013. For British Columbia, the generic share of prescription cost was 34%. In percent, Alberta: 28; Saskatchewan: 40; Manitoba: 48; Ontario: 25; Quebec: 27; New Brunswick: 32; Nova Scotia: 32; Prince Edward Island: 38; Newfoundland and Labrador: 34.
For all public plans reported, the total generic share of prescription cost (which includes, drug cost, markup and dispensing cost) was 36% in 2013. For British Columbia, information on the generic share of prescription cost was unavailable. By percent, Alberta: 38; Saskatchewan: 40; Manitoba: 47; Ontario: 34; Quebec: not available; New Brunswick: 43; Nova Scotia: 44; Prince Edward Island: 44; Newfoundland and Labrador: not available.
* Total results for the plans reported in this figure.
† Includes drug cost and markup; excludes dispensing cost.
‡ Includes drug cost, markup and dispensing cost.
Data source: IMS Brogan Private Pay Direct Drug Plan Database;
National Prescription Drug Utilization Information System Database, Canadian Institute for Health Information.
Compared to international markets, Canada had one of the highest generic utilization rates in 2013 (MIDAS™, IMS AG. All Rights Reserved). The analyzed data reflects all prescription drug sales to the pharmacy sector at manufacturer prices by country. Note that, unlike the share of prescriptions presented in Figures 1.1 and 1.2, the volume of units (physical quantities of drugs) was used to compare the international rates of generic drug use in Figure 1.3. These two measures may yield slightly different results in terms of the generic share of the market.
Figure 1.3 Generic drug market shares, Canada and the PMPRB7*, 2013
Click on image for larger view
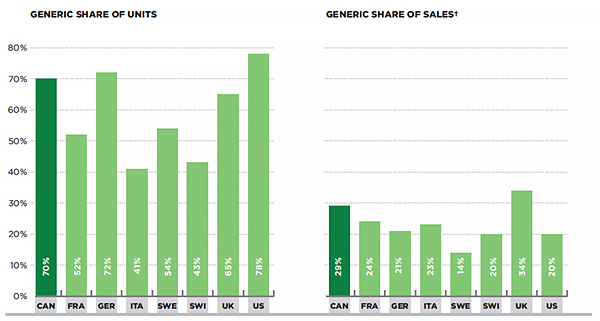
Figure description
This figure is composed of two bar graphs that compare the 2013 generic share of units and sales in Canada with those of the Patented Medicine Prices Review Board comparator countries.
The volume of units (physical quantities of drugs) was used as the basis for comparison. The market share of generics in Canada by units was 70%. In percent, France: 52; Germany: 72; Italy: 41; Sweden: 54; Switzerland: 43; United Kingdom: 65; United States: 78.
The market share of generics in terms of sales at the manufacturer price level in Canada was 29%. In percent, France: 24; Germany: 21; Italy: 23; Sweden: 14; Switzerland: 20; United Kingdom: 34; United States: 20.
* France, Germany, Italy, Sweden, Switzerland, the United Kingdom and the United States.
Results are restricted to the retail market (excluding hospital sales) and prescription bound products.
† At manufacturer price levels.
Data source: MIDAS™, IMS AG All Rights Reserved.
In terms of units, the market share of generics in Canada was the third highest (70%) among the seven foreign markets analyzedFootnote 3 in 2013, after Germany (72%) and the US (78%). The market share of generics in terms
of sales at the manufacturer price level is the second highest in Canada (29%), after the UK (34%). The generic share of sales by country reflects the rates of generic use relative to brand-name use, as well as the price levels for generic and brand-name drugs.
2. Therapeutic Analysis of the Generic Market
Two main factors seem to explain the relatively low generic market shares in private compared to public plans:
- The variations in the demographic and disease profiles of the beneficiary populations resulted in differences in the therapeutic mix, with a higher use of certain therapeutic categories that had limited generic availability in private plans.
- There was a greater tendency in private plans to use single-source brand-name drugs that did not have generic equivalent.
When a generic option was available, the generic substitution rates at drug level in private plans (except Quebec) closely mirrored those in public plans in 2013.
Therapeutic Mix
There are important differences in the demographic and disease profiles of the beneficiary populations in private and public plans. Figure 2.1 lists the top therapeutic classes for private and public plans along with the corresponding share of prescriptions. It also indicates the share of prescriptions for multi-source drugsFootnote 4 and the generic market share for each therapeutic class. The analysis was conducted at the Anatomical Therapeutic Chemical Classification System (ATC) level 2, which relates to the therapeutic main group.
The results suggest that private drug plan beneficiaries have a higher use of therapeutic classes with a relatively low share of multi-source drugs and generic penetration in both private and public plans. For example, the category of sex hormones and modulators of the
genital system accounted for 6.1% of the prescriptions in private plans and for only 0.7% in public plans in 2013. Within this category, the share of prescriptions for multi-source drugs was relatively low compared to the other categories, at 65% and 73% in private and public plans, respectively. The generic penetration was even lower at 10% and 23% in private and public plans, respectively. Similar findings are observed for obstructive airway disease drugs.
The results suggest that differences in the demographic and disease profiles of the populations in private versus public plans, as well as the availability of generics in certain therapeutic classes, result in a higher use of certain therapeutic classes with limited generic availability in private plans.
Single-Source Versus Multi-Source Drugs
Private plans tend to have a lower use of drugs that have generic availability than public plans for several important therapeutic classes. For instance, for psychoanaleptics, 75% of prescriptions were for multi-source drugs in private plans (including brand-name and generic drugs); whereas in public plans, the utilization rate was 81%. The difference of 25% and 19%, respectively, represents the share of single-source drugsFootnote 5. In other words, there seems to be a greater tendency to use drugs without generic availability in private plans.
Figure 2.1 Generic market share of prescriptions for multi-source drugs for top therapeutic classes — Private and public plans, 2013
Click on image for larger view
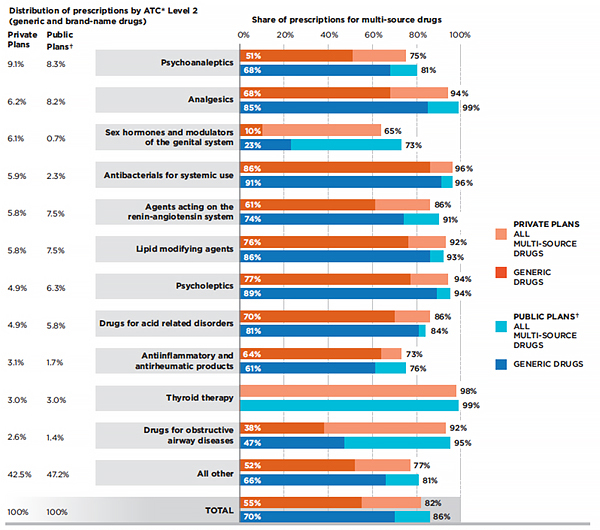
Figure description
This bar graph lists the top therapeutic classes for private and public drug plans in Canada in 2013 along with the corresponding share of prescriptions. Therapeutic divisions correspond to the World Health Organization Anatomical, Therapeutic, Chemical classification system level 2. The graph indicates the share of prescriptions for multi-source drugs and the generic market share for each therapeutic class. Note that the public drug plan data was from Alberta, Saskatchewan, Manitoba, Ontario, New Brunswick, Nova Scotia and Prince Edward Island.
Under private plans, psychoanaleptics represented 9.1% of prescriptions in 2013. The share of prescriptions for all multi-source drugs was 75%; the share of prescriptions for generic drugs was 51%.
Under public plans, psychoanaleptics represented 8.3% of prescriptions in 2013. The share of prescriptions for all multi-source drugs was 81%; the share of prescriptions for generic drugs was 68%.
Under private plans, analgesics represented 6.2% of prescriptions in 2013. The share of prescriptions for all multi-source drugs was 94%; the share of prescriptions for generic drugs was 68%.
Under public plans, analgesics represented 8.2% of prescriptions in 2013. The share of prescriptions for all multi-source drugs was 99%; the share of prescriptions for generic drugs was 85%.
Under private plans, sex hormones and modulators of the genital system represented 6.1% of prescriptions in 2013. The share of prescriptions for all multi-source drugs was 65%; the share of prescriptions for generic drugs was 10%.
Under public plans, sex hormones and modulators of the genital system represented 0.7% of prescriptions in 2013. The share of prescriptions for all multi-source drugs was 73%; the share of prescriptions for generic drugs was 23%.
Under private plans, antibacterials for systemic use represented 5.9% of prescriptions in 2013. The share of prescriptions for all multi-source drugs was 96%; the share of prescriptions for generic drugs was 86%.
Under public plans, antibacterials for systemic use represented 2.3% of prescriptions in 2013. The share of prescriptions for all multi-source drugs was 96%; the share of prescriptions for generic drugs was 91%.
Under private plans, agents acting on the renin-angiotensin system represented 5.8% of prescriptions in 2013. The share of prescriptions for all multi-source drugs was 86%; the share of prescriptions for generic drugs was 61%.
Under public plans, agents acting on the renin-angiotensin system represented 7.5% of prescriptions in 2013. The share of prescriptions for all multi-source drugs was 91%; the share of prescriptions for generic drugs was 74%.
Under private plans, lipid modifying agents represented 5.8% of prescriptions in 2013. The share of prescriptions for all multi-source drugs was 92%; the share of prescriptions for generic drugs was 76%.
Under public plans, lipid modifying agents represented 7.5% of prescriptions in 2013. The share of prescriptions for all multi-source drugs was 93%; the share of prescriptions for generic drugs was 86%.
Under private plans, psycholeptics represented 4.9% of prescriptions in 2013. The share of prescriptions for all multi-source drugs was 94%; the share of prescriptions for generic drugs was 77%.
Under public plans, psycholeptics represented 6.3% of prescriptions in 2013. The share of prescriptions for all multi-source drugs was 94%; the share of prescriptions for generic drugs was 89%.
Under private plans, drugs for acid related disorders represented 4.9% of prescriptions in 2013. The share of prescriptions for all multi-source drugs was 86%; the share of prescriptions for generic drugs was 70%.
Under public plans, drugs for acid related disorders represented 5.8% of prescriptions in 2013. The share of prescriptions for all multi-source drugs was 84%; the share of prescriptions for generic drugs was 81%.
Under private plans, anti-inflammatory and anti-rheumatic products represented 3.1% of prescriptions in 2013. The share of prescriptions for all multi-source drugs was 73%; the share of prescriptions for generic drugs was 64%.
Under public plans, anti-inflammatory and anti-rheumatic products represented 1.7% of prescriptions in 2013. The share of prescriptions for all multi-source drugs was 76%; the share of prescriptions for generic drugs was 61%.
Under private plans, thyroid therapy represented 3.0% of prescriptions in 2013. The share of prescriptions for all multi-source drugs was 98%; the share of prescriptions for generic drugs was 0%.
Under public plans, thyroid therapy represented 3.0% of prescriptions in 2013. The share of prescriptions for all multi-source drugs was 99%; the share of prescriptions for generic drugs was 0%.
Under private plans, drugs for obstructive airway diseases represented 2.6% of prescriptions in 2013. The share of prescriptions for all multi-source drugs was 92%; the share of prescriptions for generic drugs was 38%.
Under public plans, drugs for obstructive airway diseases represented 1.4% of prescriptions in 2013. The share of prescriptions for all multi-source drugs was 95%; the share of prescriptions for generic drugs was 47%.
Under private plans, all other drugs represented 42.5% of prescriptions in 2013. The share of prescriptions for all multi-source drugs was 77%; the share of prescriptions for generic drugs was 52%.
Under public plans, all other drugs represented 47.2% of prescriptions in 2013. The share of prescriptions for all multi-source drugs was 81%; the share of prescriptions for generic drugs was 66%.
Under private plans, total drugs represented 100% of prescriptions in 2013. The share of prescriptions for all multi-source drugs was 82%; the share of prescriptions for generic drugs was 55%.
Under public plans, total drugs represented 100% of prescriptions in 2013. The share of prescriptions for all multi-source drugs was 86%; the share of prescriptions for generic drugs was 70%.
* Anatomical Therapeutic Chemical classification system maintained by the World Health Organization Collaborating Centre for Drug Statistics Methodology.
† Alberta, Saskatchewan, Manitoba, Ontario, New Brunswick, Nova Scotia and Prince Edward Island.
Data source: IMS Brogan Private Pay Direct Drug Plan Database;
National Prescription Drug Utilization Information System Database, Canadian Institute for Health Information.
These variations may be due to differences in the disease profiles of the populations, as single-source and multi-source drugs within a therapeutic group may be used to treat different indications. Variations in drug coverage between private and public plans through the use of formularies may also play a role. These aspects, however, are not assessed in this study.
Note that the single-source generics, which account for a small market share, are not captured in the results presented in Figure 2.1. Hence, the 70% total multi-source generic market share is correspondingly lower than the 71% market share for generics reported in Figure 1.2.
Generic Substitution
When analyzing the drugs that have generic availability, the generic capture rate is lower in private than in public plans. For instance, 51% of the prescriptions for psychoanaleptic drugs reimbursed by private plans were for generic multi-source drugs; whereas, in public
plans, the generic capture rate was 68% in 2013 (Figure 2.1). Similar results are observed in many other classes.
A closer look at individual molecules and their province-specific generic market shares indicates that, generally, private plans Quebec had the lowest generic substitution rates in 2013. This partly explains the lower generic market shares in private compared to public plans. Private plans in other provinces more closely mirrored the generic penetration in public plans.
Table 2.1 compares the generic market shares in private and public plans for 10 top-selling molecules. For instance, for atorvastatin calcium, which accounted for the largest share of generic costs in 2013, the capture rate for the generic version was 84.8% in private plans in Quebec, 92.1% in other private plans and 96.0% in public plans. The brand-name product Lipitor accounted for the remaining shares. Similar findings were observed for all other top 10 drugs.
Table 2.1 Generic market share for top 10 generic drugs* — Private versus public plans, 2013
|
Generics share of prescriptions |
Generics share of retail drug cost† |
| Quebec Private Plans |
Other Private Plans |
Public Plans† |
Quebec Private Plans |
Other Private Plans |
Public Plans† |
| 1 |
Atorvastatin calcium |
84.8% |
92.1% |
96.0% |
63.8% |
75.9% |
93.2% |
| 2 |
Rosuvastatin calcium |
70.1% |
81.2% |
88.6% |
46.9% |
62.4% |
84.5% |
| 3 |
Pantoprazole sodium |
89.7% |
96.2% |
99.4% |
76.7% |
87.3% |
98.0% |
| 4 |
Venlafaxine hydrochloride |
80.5% |
94.8% |
98.1% |
60.7% |
82.1% |
95.5% |
| 5 |
Zopiclone |
90.8% |
97.1% |
99.6% |
79.5% |
90.8% |
99.1% |
| 6 |
Amlodipine besylate |
86.5% |
93.7% |
96.9% |
69.2% |
79.5% |
94.4% |
| 7 |
Metformin hydrochloride |
91.1% |
89.9% |
94.5% |
75.2% |
62.5% |
91.1% |
| 8 |
Citalopram hydrobromide |
86.2% |
96.9% |
99.1% |
73.3% |
91.8% |
97.9% |
| 9 |
Ramipril |
85.8% |
97.9% |
99.4% |
69.2% |
91.4% |
98.6% |
| 10 |
Valacyclovir hydrochloride |
86.8% |
96.0% |
98.2% |
73.0% |
88.2% |
97.3% |
* Top generic drugs based on retail drug cost levels in 2013. The analysis was restricted to generic drugs with brand availability.
† Includes the drug cost and markup; excludes the dispensing cost.
‡ Alberta, Saskatchewan, Manitoba, Ontario, New Brunswick, Nova Scotia and Prince Edward Island.
Data source: IMS Brogan Private Pay Direct Drug Plan Database;
National Drug Utilization Information System Database, Canadian Institute for Health Information.
While at drug-level, the generic substitution rates were generally high in private and public plans, they varied across drugs. A drug-mix component may also have played a role in the relatively low generic market shares in private compared to public plans, as drugs with higher generic penetration may have been used more in public plans.
Figure 2.2 provides a more detailed analysis of the monthly uptake in the market share for generic atorvastatin calcium over a 24-month period. After an initial uptake period, the generic capture rate in most private and public plans was very high, reaching an average of 97%. Toward the end of the period analyzed, the generic capture rates have been on a gradual decline, principally due to the influence of the private and public plans in Ontario. A discussion on loyalty cards, which may explain this trend, is provided in the next section.
Figure 2.2 Generic share of units for atorvastatin calcium, private and public drug plans
Click on image for larger view
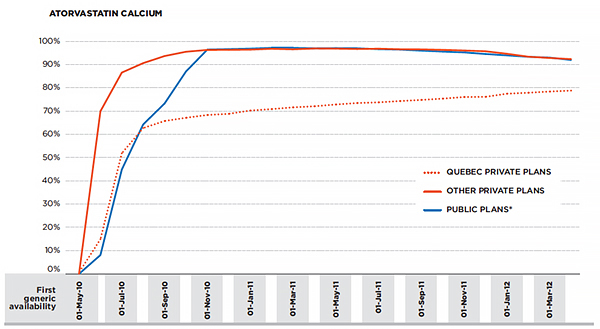
Figure description
This is a line graph depicting the generic share of units for atorvastatin calcium in Quebec private plans, other Canadian private plans and Canadian public drug plans from May 1, 2010, to April 1, 2012. On May 1, 2010, there was no the generic market share of units for atorvastatin calcium in any of the plans. All shares are expressed as percentages.
June 1, 2010 – Quebec private plans: 15; other private plans; 70; public plans: 8.
July 1, 2010 – Quebec private plans: 52; other private plans: 87; public plans: 45.
August 1, 2010 – Quebec private plans: 63; other private plans: 91; public plans: 64.
September 1, 2010 – Quebec private plans: 66; other private plans: 94; public plans: 73.
October 1, 2010 – Quebec private plans: 67; other private plans: 95; public plans: 87.
November 1, 2010 – Quebec private plans: 68; other private plans: 96; public plans: 96.
December 1, 2010 – Quebec private plans: 69; other private plans: 96; public plans: 97.
January 1, 2011 – Quebec private plans: 70; other private plans: 96; public plans: 97.
February 1, 2011 – Quebec private plans: 71; other private plans: 97; public plans: 97.
March 1, 2011 – Quebec private plans: 72; other private plans: 97; public plans: 97.
April 1, 2011 – Quebec private plans: 72; other private plans: 97; public plans: 97.
May 1, 2011 – Quebec private plans: 73; other private plans: 97; public plans: 97.
June 1, 2011 – Quebec private plans: 73; other private plans: 97; public plans: 97.
July 1, 2011 – Quebec private plans: 74; other private plans: 97; public plans: 97.
August 1, 2011 – Quebec private plans: 74; other private plans: 97; public plans: 96.
September 1, 2011 – Quebec private plans: 75; other private plans: 97; public plans: 96.
October 1, 2011 – Quebec private plans: 75; other private plans: 96; public plans: 96.
November 1, 2011 – Quebec private plans: 76; other private plans: 96; public plans: 95.
December 1, 2011 – Quebec private plans: 76; other private plans: 96; public plans: 95.
January 1, 2012 – Quebec private plans: 77; other private plans: 95; public plans: 94.
February 1, 2012 – Quebec private plans: 78; other private plans: 93; public plans: 93.
March 1, 2012 – Quebec private plans: 78; other private plans: 93; public plans: 93.
April 1, 2012 – Quebec private plans: 79; other private plans: 92; public plans: 92.
* Alberta, Saskatchewan, Manitoba, Ontario, New Brunswick, Nova Scotia and Prince Edward Island.
Data Source: IMS Brogan Private Pay Direct Drug Plan Database; National Prescription Drug Utilization Information System Database, Canadian Institute for Health Information.
Private plans in Quebec are the notable exception—the uptake was more gradual, as it took two years for the generic molecule to capture nearly 80% of the market.
An in-depth analysis of the prescription costs related to atorvastatin calcium in 2013 in private and public plans is provided in Section 6.
In recent years, the use of mandatory generic substitutionFootnote 6 has increased in private plans, mirroring the policies already in effect in public drug plans (Lynas 2012). An analysis of the top 15 established generic molecules (available since 2008 or earlier) demonstrates the generic uptake effect of these policies, pointing toward an increased generic market share in recent years for established molecules (Figure 2.3).
Figure 2.3 Generic market uptake in terms of prescriptions for the top 15 generic drugs* in private plans, 2005–2013
Click on image for larger view
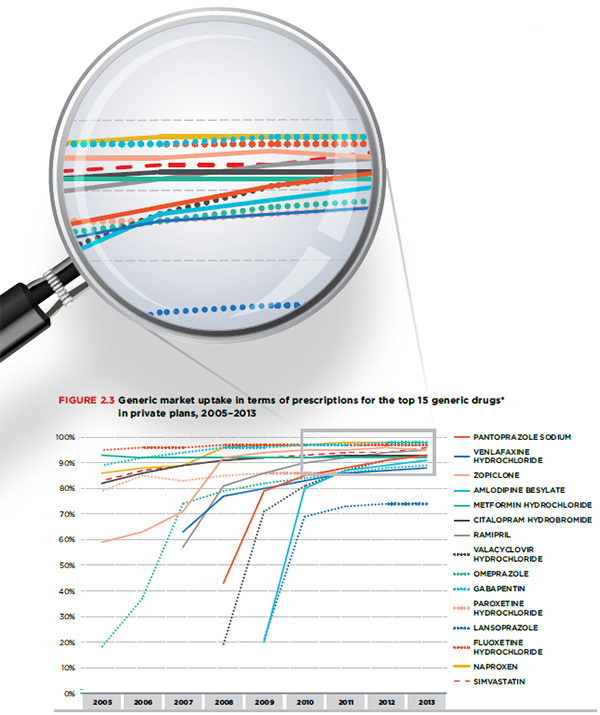
Figure description
This is a line graph depicting the generic market uptake in terms of prescriptions for the top 15 generic drugs in Canadian private plans between 2005 and 2013. Top generic drugs were determined based on their retail cost levels in 2013. The analysis was restricted to established generic molecules (available since 2008 or earlier) with brand availability.
In 2005, the generic market uptake of simvastatin was 83%. In percent, 2006: 87; 2007: 89; 2008: 91; 2009: 92; 2010: 93; 2011: 94; 2012: 94; 2013: 96.
In 2005, the generic market uptake of naproxen was 86%. In percent, 2006: 88; 2007: 89; 2008: 96; 2009: 97; 2010: 97; 2011: 98; 2012; 98; 2013: 98.
In 2005, the generic market uptake of fluoxetine hydrochloride was 95%. In percent, 2006: 96; 2007: 96; 2008: 97; 2009: 97; 2010: 97; 2011: 97; 2012: 97; 2013: 97.
In 2005, the generic market uptake of lansoprazole was not available. In percent, 2006: not available; 2007: not available; 2008: not available; 2009: 21; 2010: 69; 2011: 73; 2012: 74; 2013: 74.
In 2005, the generic market uptake of paroxetine hydrochloride was 79%. In percent, 2006: 85; 2007: 83; 2008: 85; 2009: 86; 2010: 86; 2011: 86; 2012: 87; 2013: 88.
In 2005, the generic market uptake of gabapentin was 89%. In percent, 2006: 92; 2007: 94; 2008: 96; 2009: 96; 2010: 97; 2011: 97; 2012: 98; 2013: 98.
In 2005, the generic market uptake of omeprazole was 18%. In percent, 2006: 37; 2007: 74; 2008: 79; 2009: 82; 2010: 84; 2011: 86; 2012: 88; 2013: 89.
In 2005, the generic market uptake of valacyclovir hydrochloride was not available. In percent, 2006: not available; 2007: not available; 2008: 19; 2009: 71; 2010: 81; 2011: 87; 2012: 91; 2013: 93.
In 2005, the generic market uptake of ramipril was not available. In percent, 2006: not available; 2007: 57; 2008: 81; 2009: 86; 2010: 90; 2011: 92; 2012: 94; 2013: 95.
In 2005, the generic market uptake of citalopram hydrobromide was 82%. In percent, 2006: 86; 2007: 89; 2008: 91; 2009: 92; 2010: 92; 2011: 93; 2012: 93; 2013: 93.
In 2005, the generic market uptake of metformin hydrochloride was 93%. In percent, 2006: 92; 2007: 92; 2008: 92; 2009: 92; 2010: 92; 2011: 92; 2012: 92; 2013: 92.
In 2005, the generic market uptake of amlodipine besylate was not available. In percent, 2006: not available; 2007: not available; 2008: not available; 2009: 20; 2010: 80; 2011: 87; 2012: 89; 2013: 91.
In 2005, the generic market uptake of zopiclone was 59%. In percent, 2006: 63; 2007: 71; 2008: 92; 2009: 94; 2010: 95; 2011: 95; 2012: 96; 2013: 95.
In 2005, the generic market uptake of venlafaxine hydrochloride was not available. In percent, 2006: not available; 2007: 63; 2008: 77; 2009: 80; 2010: 83; 2011: 86; 2012: 87; 2013: 88.
In 2005, the generic market uptake of pantoprazole sodium was not available. In percent, 2006: not available; 2007: not available; 2008: 43; 2009: 79; 2010: 85; 2011: 88; 2012: 91; 2013: 93.
* Top generic drugs were determined based on their retail cost levels in 2013. The analysis was restricted to established generic molecules (available since 2008 or earlier) with brand availability.
Data source: IMS Brogan Private Pay Direct Drug Plan Database.
3. Generic Cost Saving Opportunities
Closing the gap between the generic market shares at drug level in private and public plans would have resulted in marginal cost savings for most private plans, as their generic capture rates were already closely aligned with those in public plans. The notable exception is Quebec, where an increase in the generic capture rates to mirror those prevailing in public plans would have resulted in a marked increase in the generic market share (6.6%) and important cost savings (4.3% of the overall prescription cost).
On the other hand, if private plans across Canada had limited the reimbursement of brand-name drugs in oral solid form to the generic price level, as in public plans, up to 9.6% of prescriptions for brand-name products would have been reimbursed at the generic price level, representing cost savings of up to 5.7% of the overall retail drug costs.
This section explores two scenarios that may allow private plans to take an increased advantage of the current generic competition:
(i) Substituting brand-name products for their generic version to the same extent as public plans
Figure 3.1 reports the provincial variations in the estimated generic market share for private plans if they had had the same generic capture rates as public plans at the individual drug level. The analysis assumes, for instance, that in the case of atorvastatin calcium reported in Table 2.1, the market share in private plans for Quebec would have increased from 84.8% to 96.0%, equalling the market share in public plans. A similar assumption was applied for all oral solid drugs with over 1,000 annual prescriptions used in both private and public plans.
The results suggest that the overall generic market shares for private plans would have increased to 59%, resulting in an estimated reduction of 2.7% in overall retail drug costs, equating to an average cost saving of $12,873 per 1,000 beneficiaries. Most of these savings would have been realized by private plans in Quebec.
Figure 3.1 Generic market share of prescriptions, private and public plans — Actual and estimated based on the generic substitution rates for oral solid drugs in public plans, 2013
Click on image for larger view
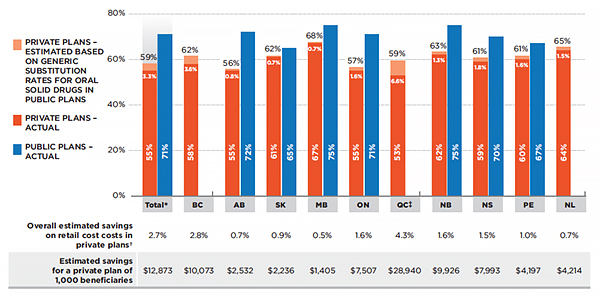
Figure description
This bar graph depicts the provincial variations in the generic market share of prescriptions for Canadian public and private plans in 2013. Shares for individual provinces are included as well as the total for all provinces reported. In particular, the graph gives the actual market share for private plans as well as the estimated share if the private plans had had the same generic capture rates as the public plans at the individual drug level for oral solid drugs with both generic and brand-name availability and with over 1,000 annual prescriptions.
The estimated total generic market share of prescriptions for private plans, estimated based on generic substitution rates for oral solid drugs in public plans, is 59%. The actual generic market share of prescriptions under private plans is 55%, a difference of 3.3%. The total, actual generic market share of prescriptions for public plans is 71%.
The estimated generic market share of prescriptions under private plans in British Columbia is 62%. The actual generic market share of prescriptions under private plans in British Columbia is 58%, a difference of 3.6%. No data was available for prescriptions under public plans in British Columbia.
The estimated generic market share of prescriptions under private plans in Alberta is 56%. The actual generic market share of prescriptions under private plans in Alberta is 55%, a difference of 0.8%. The generic market share of prescriptions under public plans in Alberta is 72%.
The estimated generic market share of prescriptions under private plans in Saskatchewan is 62%. The actual generic market share of prescriptions under private plans in Saskatchewan is 61%, a difference of 0.7%. The generic market share of prescriptions under public plans in Saskatchewan is 65%.
The estimated generic market share of prescriptions under private plans in Manitoba is 68%. The actual generic market share of prescriptions under private plans in Manitoba is 67%, a difference of 0.7%. The generic market share of prescriptions under public plans in Manitoba is 75%.
The estimated generic market share of prescriptions under private plans in Ontario is 57%. The actual generic market share of prescriptions under private plans in Ontario is 55%, a difference of 1.6%. The generic market share of prescriptions under public plans in Ontario is 71%.
The estimated generic market share of prescriptions under private plans in Quebec is 59%. The actual generic market share of prescriptions under private plans in Quebec is 53%, a difference of 6.6%. Estimates for Quebec are based on the prescription cost, including the drug cost, markup and dispensing cost. There is no information available on the generic market share of prescriptions under public plans in Quebec.
The estimated generic market share of prescriptions under private plans in New Brunswick is 63%. The actual generic market share of prescriptions under private plans in New Brunswick is 62%, a difference of 1.3%. The generic market share of prescriptions under public plans in New Brunswick is 75%.
The estimated generic market share of prescriptions under private plans in Nova Scotia is 61%. The actual generic market share of prescriptions under private plans in Nova Scotia is 59%, a difference of 1.8%. The generic market share of prescriptions under public plans in Nova Scotia is 70%.
The estimated generic market share of prescriptions under private plans in Prince Edward Island is 61%. The actual generic market share of prescriptions under private plans in Prince Edward Island is 60%, a difference of 1.6%. The generic market share of prescriptions under public plans in Prince Edward Island is 67%.
The estimated generic market share of prescriptions under private plans in Newfoundland and Labrador is 65%. The actual generic market share of prescriptions under private plans in Newfoundland and Labrador is 64%, a difference of 1.5%. There is no information available on the generic market share of prescriptions under public plans in Newfoundland and Labrador.
Below the bar graph, a corresponding table gives the overall estimated savings on retail costs in private plans as well as the estimated savings for a private plan of 1,000 beneficiaries for each of the provinces and the total of all provinces reported. The savings represent the difference between the actual and estimated generic market share for each market.
In total, the overall estimated savings on retail costs (which includes drug cost and markup, but excludes dispensing cost) in private plans was 2.7%. In percent, British Columbia: 2.8; Alberta: 0.7; Saskatchewan: 0.9; Manitoba: 0.5; Ontario: 1.6; Quebec: 4.3; New Brunswick: 1.6; Nova Scotia: 1.5; Prince Edward Island: 1.0; Newfoundland and Labrador: 0.7.
In total, the estimated savings for a private plan of 1,000 beneficiaries, in dollars, was 12,873. British Columbia: 10,073; Alberta: 2,532; Saskatchewan: 2,236; Manitoba: 1,405; Ontario: 7,507. Quebec: 28,940; New Brunswick: 9,926; Nova Scotia: 7,993; Prince Edward Island: 4,197; Newfoundland and Labrador: 4,214.
Note: Estimated results are restricted to oral solid drugs with both brand and generic availability and with over 1,000 annual prescriptions.
* Total results for the plans reported in this figure.
† Includes drug cost and markup; excludes dispensing cost.
‡ Estimates for Quebec are based on the prescription cost, including the drug cost, markup and dispensing cost.
Data source: IMS Brogan Private Pay Direct Drug Plan Database; National Prescription Drug Utilization Information System Database, Canadian Institute for Health Information.
For the private plans in British Columbia, Quebec and Newfoundland and Labrador, the generic capture rates are based on the rates for all public plans analyzed, as provincial-specific public drug plan data for these provinces was not available at the time of the analysis.
Note that even if private plans substituted brand-name drugs for the generic versions to the same extent as the public plans, the generic market share in private plans would have climbed by only 3.3% up to 59%, still remaining lower than in public plans (71%). This is due to inherent differences in the public and private markets. Differences in the demographic and disease profiles of the beneficiary populations may translate into a different share or mix of generic drugs being used (methadone, for instance, is used more in public than in private plans).
This scenario, however, does not take into account the fact that public plans actually reimburse brand-name drugs with generic availability at levels close to the generic cost levels due to mandatory generic substitutionFootnote 7 (Figure 3.2). In the case of atorvastatin calcium, this would apply to the 4.0% of the prescriptions for the brand-name Lipitor, as 96.0% of the prescriptions were for generics.
Figure 3.2 Average retail drug cost* per unit for the top 10 selling generic drugs† in private plans, 2013 (largest utilized strength–form combination)
Click on image for larger view
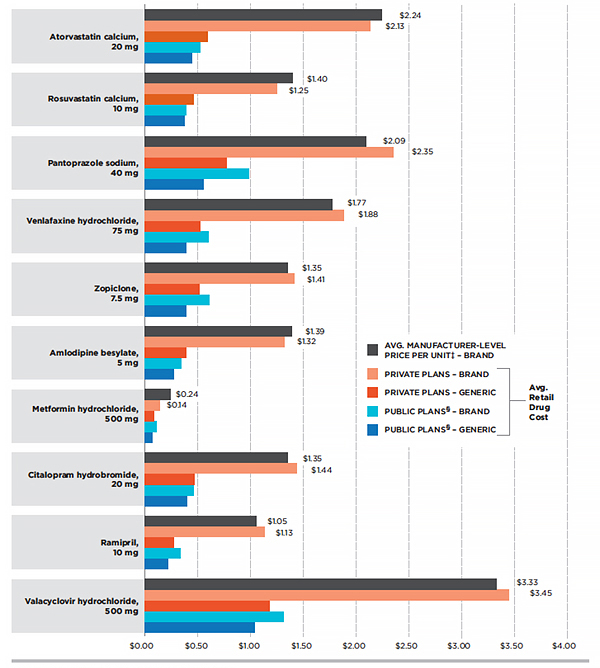
Figure description
This is a bar graph depicting the average retail drug cost per unit for the top 10 selling generic drugs in private plans in 2013. Determination of the average retail drug cost included the drug cost and markup, but excluded the dispensing cost. The top generic drugs were selected based on retail drug cost levels in 2013. Public plan data were taken from Alberta, Saskatchewan, Manitoba, Ontario, New Brunswick and Prince Edward Island.
For brand-name atorvastatin calcium, 20 mg, the average manufacturer-level price per unit (excluding markups and dispensing costs) in dollars was 2.24. Brand name under private plans: 2.13; generic under private plans: 0.59; brand name under public plans: 0.52; generic under public plans: 0.44.
For brand-name rosuvastatin calcium, 10 mg, the average manufacturer-level price per unit (excluding markups and dispensing costs) in dollars was 1.40. Brand name under private plans: 1.25; generic under private plans: 0.46; brand name under public plans: 0.39; generic under public plans: 0.37.
For brand-name pantoprazole sodium, 40 mg, the average manufacturer-level price per unit (excluding markups and dispensing costs) in dollars was 2.09. Brand name under private plans: 2.35; generic under private plans: 0.77; brand name under public plans: 0.98; generic under public plans: 0.55.
For brand-name venlafaxine hydrochloride, 75 mg, the average manufacturer-level price per unit (excluding markups and dispensing costs) in dollars was 1.77. Brand name under private plans: 1.88; generic under private plans: 0.52; brand name under public plans: 0.60; generic under public plans: 0.39.
For brand-name zopiclone, 7.5 mg, the average manufacturer-level price per unit (excluding markups and dispensing costs) in dollars was 1.35. Brand name under private plans: 1.41; generic under private plans: 0.51; brand name under public plans: 0.61; generic under public plans: 0.39.
For brand-name amlodipine besylate, 5 mg, the average manufacturer-level price per unit (excluding markups and dispensing costs) in dollars was 1.39. Brand name under private plans: 1.32; generic under private plans: 0.39; brand name under public plans: 0.34; generic under public plans: 0.27.
For brand-name metformin hydrochloride, 500 mg, the average manufacturer-level price per unit (excluding markups and dispensing costs) in dollars was 0.24. Brand name under private plans: 0.14; generic under private plans: 0.08; brand name under public plans: 0.11; generic under public plans: 0.07.
For brand-name citalopram hydrobromide, 20 mg, the average manufacturer-level price per unit (excluding markups and dispensing costs) in dollars was 1.35. Brand name under private plans: 1.44; generic under private plans: 0.47; brand name under public plans: 0.46; generic under public plans: 0.40.
For brand-name ramipril, 10 mg, the average manufacturer-level price per unit (excluding markups and dispensing costs) in dollars was 1.05. Brand name under private plans: 1.13; generic under private plans: 0.27; brand name under public plans: 0.33; generic under public plans: 0.22.
For brand-name valacyclovir hydrochloride, 500 mg, the average manufacturer-level price per unit (excluding markups and dispensing costs) in dollars was 3.33. Brand name under private plans: 3.45; generic under private plans: 1.18; brand name under public plans: 1.31; generic under public plans: 1.04.
* Includes drug cost and markup; excludes dispensing cost.
† Top generic drugs based on retail drug cost levels in 2013. The analysis was restricted to generic drugs with brand availability.
‡ Excludes markups and dispensing costs.
§ Alberta, Saskatchewan, Manitoba, Ontario, New Brunswick, Nova Scotia and Prince Edward Island.
Data source: MIDAS™, IMS AG All Rights Reserved; IMS Brogan Private Pay Direct Drug Plan Database; National Prescription Drug Utilization Information System Database, Canadian Institute for Health Information.
In private plans, on the other hand, brand-name drugs with a genericized molecule were reimbursed at unit cost levels comparable or slightly lower than the average manufacturer unit price (Figure 3.2). Note that the average retail drug cost includes the markup, whereas the average manufacturer unit price excludes the markup components (wholesale and pharmacy). For drugs with a lower average retail cost, a portion of the prescriptions may have been reimbursed by private plans with mandatory generic substitution, limiting the reimbursement to the generic unit price level.
Loyalty Cards
The retail costs reported in this analysis do not include amounts paid through manufacturer-issued patient reimbursement loyalty cards, also referred to as drug discount cards or coupons.
Loyalty cards are offered to patients by some brand-name manufacturers for some drugs, and can be used to cover the cost difference related to the purchase of a brand-name product.
Drug plans that have mandatory generic substitution* reimburse brand-name drugs with generic availability at the generic cost level. If the beneficiary uses a loyalty card, the drug manufacturer covers the difference in cost between the brand-name and the generic drug. The amounts paid using loyalty cards may be reimbursed through the adjudication process as a coordination-of-benefits (COB) or through a direct refund by Visa debit card.
In drug plans that do not have mandatory generic substitution, loyalty cards have no bearing on the amount that the private plans will accept for reimbursement, i.e., brand-name products are reimbursed at the brand-name price level. The use of loyalty cards may result in a reduced generic market share, as brand-name drugs are able to retain or gain market share. While the generic market share for drugs with generic availability may be determined by pharmacy practice of dispensing generic drugs, this may be influenced by the beneficiaries requesting the brand-name drug through the use of loyalty cards.
The IMS Brogan Private Pay Direct Drug Plan Database does not flag the plans that have mandatory generic substitution or the prescriptions for which a loyalty card may have been used. The retail costs reported reflect the amounts accepted for reimbursement by private plans. In the case of plans with mandatory generic substitution this would be limited to the generic price level. The data does not include COB claims, meaning that amounts reimbursed by a secondary payer or through loyalty cards by manufacturers are not captured.
As indicated in Figure 3.2, the average retail cost for brand-name drugs in private plans for top-selling molecules with generic availability was lower than the average manufacturer unit price. This suggests that a portion of the prescriptions reimbursed by private plans had mandatory generic substitution and were capped at the generic price level. However, the portion of these prescriptions that was partly paid through loyalty cards cannot be determined.
*Mandatory generic substitution is a drug plan feature that encourages beneficiaries to utilize the lower cost interchangeable generic drugs by limiting the reimbursement of the brand-name drugs to the generic price level.
(ii) Limiting the reimbursement of brand-name drugs to the generic price level
If private plans across Canada had limited the reimbursement of brand-name drugs in oral solid form to the generic price level, as in public plans (complete generic mandatory substitution), up to 9.6% of the prescriptions would have been impacted in 2013, resulting in a total of 65% of the prescriptions in private plans being reimbursed at the generic price level. This would have generated up to an estimated 5.7% reduction in overall retail drug costs, representing a cost savings of up to $31,405 per average plan of 1,000 beneficiaries. Figure 3.3 reports on provincial variations in these results.
Figure 3.3 Generic market share of prescriptions, private plans — Actual and estimated share based on mandatory generic substitution for oral solid drugs in all plans, 2013
Click on image for larger view
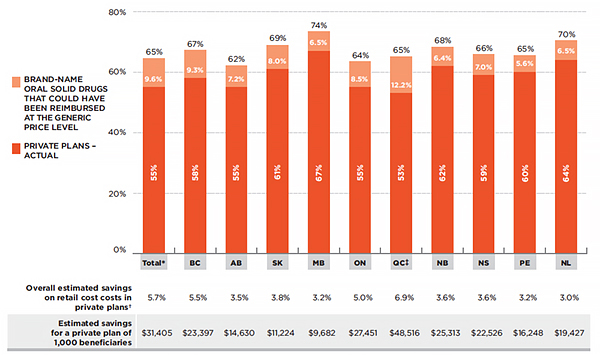
Figure description
This is a bar graph depicting the actual and estimated generic market share of prescriptions under private plans in 2013. Estimated values are based on mandatory generic substitution for all oral solid drugs (with both brand and generic availability and with over 1,000 annual prescriptions) that could have been reimbursed at the generic price level. Shares for individual provinces are included, as well as the total for all provinces reported.
In total, the actual generic market share for prescriptions of oral solid drugs under private plans was 55%. The estimated share of brand-name oral solid drugs that could be reimbursed at the generic price level is 65%, an increase of 9.6%.
In British Columbia, the actual generic market share was 55%. The estimated share was 67%, an increase of 9.3%.
In Alberta, the actual generic market share was 55%. The estimated share was 62%, an increase of 7.2%.
In Saskatchewan, the actual generic market share was 61%. The estimated share was 69%, an increase of 8.0%.
In Manitoba, the actual generic market share was 67%. The estimated share was 74%, an increase of 6.5%.
In Ontario, the actual generic market share was 55%. The estimated share was 64%, an increase of 8.5%.
In Quebec, the actual generic market share was 53%. The estimated share was 65%, an increase of 12.2%. Estimates for Quebec are based on the prescription cost, including the drug cost, markup and dispensing cost.
In New Brunswick, the actual generic market share was 62%. The estimated share was 68%, an increase of 6.4%.
In Nova Scotia, the actual generic market share was 59%. The estimated share was 66%, an increase of 7.0%.
In Prince Edward Island, the actual generic market share was 60%. The estimated share was 65%, an increase of 5.6%.
In Newfoundland and Labrador, the actual generic market share was 64%. The estimated share was 70%, an increase of 6.5%.
Below the bar graph, a corresponding table gives the overall estimated savings on retail costs in private plans as well as the estimated savings for a private plan of 1,000 beneficiaries for each of the provinces and the total of all provinces reported. The savings represent the difference between the actual and estimated generic market share for each market.
In total, the overall estimated savings on retail cost costs in private plans (includes drug cost and markup, but excludes dispensing cost) was 5.7%. In percent, British Columbia: 5.5; Alberta: 3.5; Saskatchewan: 3.8; Manitoba: 3.2; Ontario: 5.0; Quebec: 6.9; New Brunswick: 3.6; Nova Scotia: 3.6; Prince Edward Island: 3.2; Newfoundland and Labrador: 3.0.
In total, the estimated savings for a private plan of 1,000 beneficiaries in dollars was 31,405; British Columbia: 23,397; Alberta: 14,630; Saskatchewan: 11,224; Manitoba: 9,682; Ontario: 27,451; Quebec: 48,516; New Brunswick: 25,313; Nova Scotia: 22,526; Prince Edward Island: 16,248; Newfoundland and Labrador: 19,427.
Note: Estimated results are restricted to oral solid drugs with both brand and generic availability and with over 1,000 annual prescriptions.
* Total results for the plans reported in this figure.
† Includes drug cost and markup; excludes dispensing cost.
‡ Estimates for Quebec are based on the prescription cost, including the drug cost, markup and dispensing cost.
Data source: IMS Brogan Private Pay Direct Drug Plan Database; National Prescription Drug Utilization Information System Database, Canadian Institute for Health Information.
Private plans in Quebec could have benefitted the most from cost savings through increased generic substitution. If they had implemented mandatory generic substitution in all plans in 2013, up to 12.2% of prescriptions for brand-name products would have been substituted for their generic versions, increasing the generic market share to 65% and resulting in an estimated 6.9% reduction in overall prescription costs.
The assessment of generic cost saving opportunities provided in this section was restricted to drugs in oral solid form due to the inconsistency in unit reporting for other types of formulations (e.g., inhalers, infusions, etc.). The potential savings may actually be much higher if mandatory generic substitution was extended to drugs in non-oral solid form.
These results represent a snapshot in time as of 2013. Since then, the generic market landscape in Canada has evolved, both in terms of additional brand-name drugs facing generic competition and in terms of policy changes. In particular, Bill 28Footnote 8, passed by the Quebec government, allows private plans to limit the reimbursement for brand-name drugs for which a generic exists, starting on October 1, 2015.
4. Retail Drug Costs of Generic Drugs
Generic pricing policies introduced by most provincial governments since 2010 markedly reduced the prices of generic drugs reimbursed by private plans, from 0.63 of the brand-reference in 2010 to 0.42 in 2013. This has resulted in important cost savings, ranging from 8% to 13% of the overall retail drug cost in private plans in 2013.
At the provincial level, private and public plans reimbursed comparable average retail drug costs per unit for generic drugs. Interprovincial variations reflect the evolving provincial generic pricing policies.
From 2005 to 2010, the average generic retail drug cost per unit in private plans across Canada was stable, ranging from 0.63 to 0.66 of the reference-brand level (Figure 4.1). However, since 2011, generic prices have been on decline, as most provincial governments implemented generic pricing policies which have reduced the price of generic drugs in all markets, including private plans. Consequently, by 2013, generic prices reached a low of 0.42 of the reference-brand level.
Figure 4.1 Generic-to-brand average retail drug cost per unit in private plans, 2005–2013
Click on image for larger view
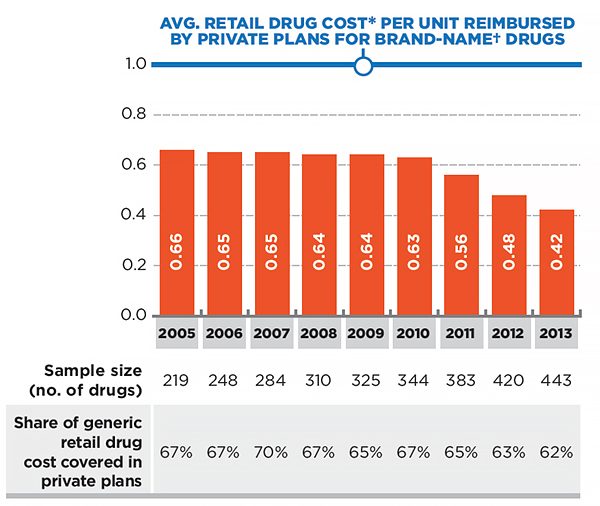
Figure description
This bar graph depicts the trend in the generic-to-brand ratio for the average retail drug cost per unit in Canadian private plans from 2005 to 2013. The brand-name average retail drug cost per unit in the year prior to the generic entry was used as a reference to determine the relative generic cost level for all the years following generic entry.
Ratios of generic-to-brand retail cost are given per year. 2005: 0.66; 2006: 0.65; 2007: 0.65; 2008: 0.64; 2009: 0.64; 2010: 0.63; 2011: 0.56; 2012: 0.48; 2013: 0.42.
The number of drugs (sample size) and corresponding share of the retail drug cost covered by the private plans are given in a table under the bar graph.
Number of drugs by year is 2005; 219; 2006: 248; 2007: 284; 2008: 310; 2009: 325; 2010: 344; 2011: 383; 2012: 420; 2013: 443.
Share of generic retail drug cost, in percent, by year is 2005: 67; 2006: 67; 2007: 70; 2008: 67; 2009: 65; 2010: 67; 2011: 65; 2012: 63; 2013: 62.
Note: Results are restricted to oral solid drugs with both brand and generic availability, with over 1,000 annual prescriptions and that are used in all provinces.
* Includes drug cost and markup; excludes dispensing cost.
† The brand-name average retail drug cost per unit in the year prior to generic entry was used as a reference to determine the relative generic cost level for all the years following generic entry.
Data source: IMS Brogan Private Pay Direct Drug Plan Database.
The average retail drug cost per unit relative to the brand-name cost reimbursed by private plans has decreased in all provinces, from a range of 0.58–0.67 in 2010 to a range of 0.36–0.45 in 2013. These reductions reflect the implementation of provincial generic pricing policies, which have resulted in significant cost savings. Specifically, in 2013, cost reductions for the 443 drugs analyzed in this report (which accounted for 62% of the generic retail drug costs in 2013) resulted in estimated savings in the range of 8–13% of the total retail drug cost, depending on the province.
The extent of the savings is a function of the decrease in the generic retail drug cost per unit, as well as the generic share of the overall retail drug cost in the market (Figure 1.2). For example, the impact on the Ontario private market is dependent on the fact that not only
does this province has some of the lowest retail drug cost levels for generics, but also that the Ontario private plans have one of the lowest rates of generic use (Figure 1.2).
The results in Figure 4.1 and 4.2 were restricted to multi-source drugs in oral solid form with both brand and generic availability and with over 1,000 annual prescriptions. Note that the sample size of the drugs analyzed increased over time, from 219 drugs in 2005 to 433 in 2013, reflecting the increased availability of generic drugs. These drugs accounted for 62% of the generic retail drug costs in 2013.
Figure 4.2 Province-specific ratio of generic-to-brand average retail drug cost per unit for generic drugs — Private plans, 2005–2013
Click on image for larger view
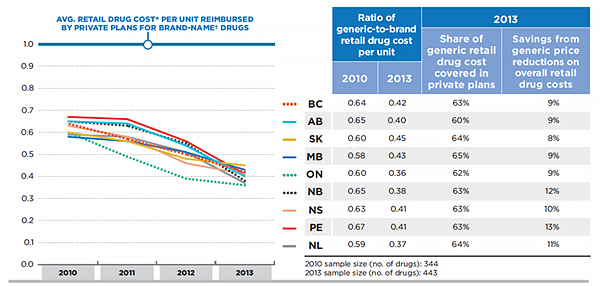
Figure description
This bar graph depicts the trend in the average ratio of the generic-to-brand retail drug cost per unit for generic drugs in select provincial private plans from 2005 to 2013. This was based on a sample size of 344 drugs in 2010 and 443 drugs in 2013.
In 2010, the ratio of generic-to brand retail drug cost per unit in British Columbia was 0.64; Alberta: 0.65; Saskatchewan: 0.60; Manitoba: 0.58; Ontario: 0.60; New Brunswick: 0.65; Nova Scotia: 0.63; Prince Edward Island: 0.67; Newfoundland and Labrador: 0.59.
In 2013, the ratio of generic-to-brand retail drug cost per unit in British Columbia was 0.42; Alberta: 0.40; Saskatchewan: 0.45; Manitoba: 0.43; Ontario: 0.36; New Brunswick: 0.38; Nova Scotia: 0.41; Prince Edward Island: 0.41; Newfoundland and Labrador: 0.37.
In 2013, the share of generic retail drug cost covered in private plans in British Columbia was 63%. In percent, Alberta: 60; Saskatchewan: 64; Manitoba: 65; Ontario: 62; New Brunswick: 63; Nova Scotia: 63; Prince Edward Island: 63; Newfoundland and Labrador: 64.
In 2013, the savings from generic price reductions on overall retail drug costs in British Columbia was 9%. In percent, Alberta: 9; Saskatchewan: 8; Manitoba: 9; Ontario: 9; New Brunswick: 12; Nova Scotia: 10; Prince Edward Island: 13; Newfoundland and Labrador: 11.
Note: Results are restricted to oral solid drugs with both brand and generic availability, with over 1,000 annual prescriptions and that are used in all provinces.
* Includes drug cost and markup; excludes dispensing cost.
† The brand-name average retail drug cost per unit in the year prior to generic entry was used as a reference to determine the relative generic cost level for all the years following generic entry.
Data Source: IMS Brogan Private Pay Direct Drug Plan Database; National Prescription Drug Utilization Information System Database, Canadian Institute for Health Information.
The average retail drug costs per unit reimbursed by private plans were generally in line with the respective levels in provincial public plans. Figure 4.3 reports the province-specific ratio of private-to-public average retail drug costs per unit for generic and brand-name drugs in 2013. These results are based on province-specific acquisition cost levels for the public plans. The results reported in this figure are restricted to provinces for which both private and public plan data were available.
Figure 4.3 Province-specific ratio of private-to-public average retail drug cost* per unit, generic and brand-name drugs, by province, 2013
Click on image for larger view
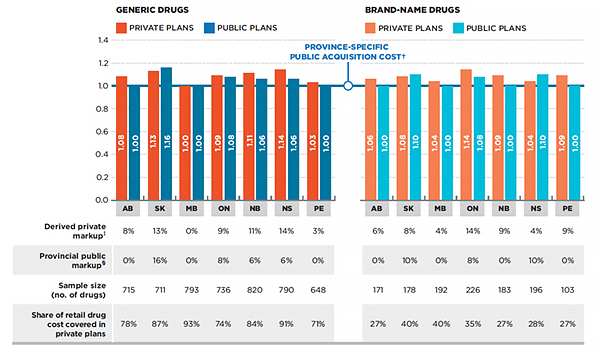
Figure description
These are two bar graphs that depict the province-specific ratio of private-to-public average retail drug costs per unit for generic and brand-name drugs in 2013. The province-specific public acquisition cost is given as 1.
For generic drugs, the ratios are as follows:
Alberta private plans 1.08; public plans 1.00.
Saskatchewan private plans 1.13; public plans 1.16.
Manitoba private plans 1.00; public plans 1.00.
Ontario private plans 1.09; public plans 1.08.
New Brunswick private plans 1.11; public plans 1.06.
Nova Scotia private plans 1.14; public plans 1.06.
Prince Edward Island private plans 1.03; public plans 1.00.
For brand-name drugs the ratios are as follows:
Alberta private plans 1.06; public plans 1.00.
Saskatchewan private plans 1.08; public plans 1.10.
Manitoba private plans 1.04; public plans 1.00.
Ontario private plans 1.14; public plans 1.08.
New Brunswick private plans 1.09; public plans 1.00.
Nova Scotia private plans 1.04; public plans 1.10.
Prince Edward Island private plans 1.09; public plans 1.00.
A table below the graphs gives additional information.
For generic drugs:
In Alberta, the derived private markup for generic drugs (the percent difference between the average retail drug cost per unit in private plans and the public acquisition cost) was 8%. In percent, Saskatchewan: 13; Manitoba: 0; Ontario: 9; New Brunswick: 11; Nova Scotia: 14; Prince Edward Island: 3.
In Alberta, the provincial public markup amount as a percentage of the public acquisition cost of generic drugs was 0%. In percent, Saskatchewan: 16; Manitoba: 0; Ontario: 8; New Brunswick: 6; Nova Scotia: 6; Prince Edward Island: 0.
In Alberta, the sample size (number of generic drugs) was 715. Saskatchewan: 711; Manitoba: 793; Ontario: 736; New Brunswick: 820; Nova Scotia: 790; Prince Edward Island: 648.
In Alberta, the corresponding share of retail drug cost covered in private plans for generic drugs was 78%. In percent, Saskatchewan: 87; Manitoba: 93; Ontario: 74; New Brunswick: 84; Nova Scotia: 91; Prince Edward Island: 71.
For brand-name drugs:
In Alberta, the derived private markup for brand-name drugs (the percent difference between the average retail drug cost per unit in private plans and the public acquisition cost) was 6%. In percent, Saskatchewan: 8; Manitoba: 4; Ontario: 14; New Brunswick: 9; Nova Scotia: 4; Prince Edward Island: 9.
In Alberta, the provincial public markup amount as a percentage of the public acquisition cost of brand-name drugs was 0%. In percent, Saskatchewan: 10; Manitoba: 0; Ontario: 8; New Brunswick: 0; Nova Scotia: 10; Prince Edward Island: 0.
In Alberta, the sample size (number of brand-name drugs) was 171. Saskatchewan: 178; Manitoba: 192; Ontario: 226; New Brunswick: 183; Nova Scotia: 196; Prince Edward Island: 103.
In Alberta, the share of retail drug cost covered in private plans for brand-name drugs was 27%. In percent, Saskatchewan: 40; Manitoba: 40; Ontario: 35; New Brunswick: 27; Nova Scotia: 28; Prince Edward Island: 27.
Note: Results are restricted to oral solid drugs with over 1,000 annual prescriptions. The brand-name drug analysis was also restricted to single-source drugs.
* Includes drug cost and markup; excludes dispensing cost.
† Determined based on the average drug cost per unit accepted for reimbursement by the public plans, excluding the markup and dispensing cost.
‡ Percent difference between the average retail drug cost per unit in private plans and the public acquisition cost.
§ The public markup amount as a percentage of the public acquisition cost.
Data source: IMS Brogan Private Pay Direct Drug Plan Database; National Prescription Drug Utilization Information System Database, Canadian Institute for Health Information.
While private and public plans generally pay the same retail drug cost for generics, in some provinces the cost is higher in private plans, pointing towards higher markups. In Alberta, for instance, where the public markup is 0%, the private market reimbursed the retail drug cost at 1.08 of the acquisition cost, implying an 8% markup. In New Brunswick and Nova Scotia, the assumed private markups were 5% and 8% more than the public markup, respectively. Saskatchewan is the only province where the public plan reimbursed slightly higher retail drug costs than the private plans, which appears to be due to higher markups in public plans.
Acquisition Cost =
Drug Cost in Public Plan / Units
Retail Drug Cost Per Unit =
(Drug Cost + Markup) / Units
These amounts refer to what was accepted for reimbursement by the drug plans.
The acquisition cost of a drug is based on the average drug cost per unit accepted for reimbursement by the public plans and does not include markups or dispensing costs. This amount may differ from the pharmacy’s actual acquisition cost if the submitted amounts exceed what was accepted by the public plan. See Appendix A for definitions.
The acquisition cost in public plans was used to derive estimates for private drug plan markups. This acquisition cost may vary between private and public plans and across provinces. These variations are due to differences in the cost at the pharmacy level and may depend on wholesaler upcharges and established distribution networks.
The timing of the implementation of specific provincial generic pricing policies resulted in variations in the average retail drug cost per unit for generic drugs (Appendix B). Figure 4.4 highlights these variations by comparing the average generic retail drug costs in private plans to those in the Ontario public plan, the Ontario Drug Benefit (ODB) Programs. In 2013, the ODB reimbursed prices that reflected the policies that reduced the generic price for most drugs to a maximum of 25% of the reference-brand price, and 18% for six of the most common generic drugs (Council of the Federation 2014).
Figure 4.4 Ratio of private-to-Ontario public average retail drug cost* per unit, generic and brand-name drugs, by province, 2013
Click on image for larger view
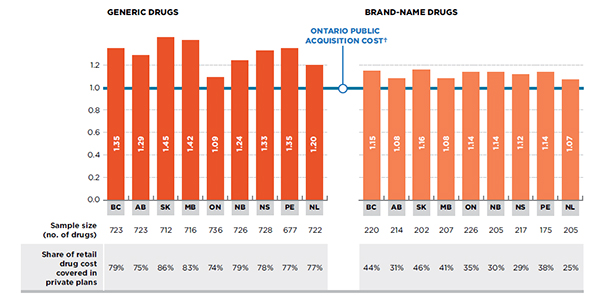
Figure description
These two bar graphs depict the ratio of private-to-Ontario public average retail drug costs per unit for generic and brand-name drugs by province, in 2013. The Ontario public acquisition cost is given as 1.0. The retail drug cost includes the drug cost and markup, but excludes the dispensing cost.
For generic drugs:
For private plans in British Columbia, the average retail drug cost per unit was 1.35 of the Ontario public acquisition cost. In Alberta: 1.29; Saskatchewan: 1.45; Manitoba: 1.42; Ontario: 1.09; New Brunswick: 1.24; Nova Scotia; 1.33: Prince Edward Island: 1.35; Newfoundland and Labrador: 1.20.
The sample size (number of generic drugs) for British Columbia was 723; Alberta: 723; Saskatchewan: 712; Manitoba: 716: Ontario: 736; New Brunswick: 726; Nova Scotia: 728; Prince Edward Island: 677; Newfoundland and Labrador: 722.
The corresponding share of retail drug cost covered in private plans was 79% for British Columbia. In percent, Alberta: 75; Saskatchewan: 86; Manitoba: 83; Ontario: 74; New Brunswick: 79; Nova Scotia: 78; Prince Edward Island: 77; Newfoundland and Labrador: 77.
For brand-name drugs:
For private plans in British Columbia, the average retail drug cost per unit was 1.15 of Ontario public acquisition cost. In Alberta: 1.08; Saskatchewan: 1.16; Manitoba: 1.08; Ontario: 1.14; New Brunswick: 1.14; Nova Scotia: 1.12; Prince Edward Island: 1.14; Newfoundland and Labrador: 1.07.
The sample size (number of brand-name drugs) for British Columbia was 220; Alberta: 214; Saskatchewan: 202; Manitoba: 207; Ontario: 226; New Brunswick: 205; Nova Scotia: 217; Prince Edward Island: 175; Newfoundland and Labrador: 205.
The corresponding share of retail drug cost covered in private plans was 44% for British Columbia. In percent, Alberta: 31; Saskatchewan: 46; Manitoba: 41; Ontario: 35; New Brunswick: 30; Nova Scotia: 29; Prince Edward Island: 38; Newfoundland and Labrador: 25.
Note: Results are restricted to oral solid drugs with over 1,000 annual prescriptions. The brand-name drug analysis was also restricted to single-source drugs.
* Includes drug cost and markup; excludes dispensing cost.
† Determined based on the average drug cost per unit accepted for reimbursement by the public plans, excluding the markup and dispensing cost.
Data source: IMS Brogan Private Pay Direct Drug Plan Database; National Prescription Drug Utilization Information System Database, Canadian Institute for Health Information.
The acquisition cost reported for the Ontario public plan does not include wholesale or pharmacy markups, as per the markup reimbursement policies in Ontario (Appendix C).
The results suggest that the average retail drug cost per unit in private plans was markedly higher than the acquisition costs reimbursed by the Ontario public plan. Differences in the average retail drug cost per unit reimbursed across private and public provincial markets depend on the prices charged by manufacturers, the jurisdictional generic pricing policies, and the allowed wholesale and pharmacy markups. Important generic pricing policies have been implemented since 2013, which are not captured in these results.
Compared to the generic costs, the brand-name average retail drug costs per unit in private plans are more consistent across provinces, although differences still exist.
The results based on retail drug cost are not reported for private plans in Quebec, as the available amounts contain the dispensing cost component.
5. The Role of Prescription Size
The prescription cost is composed of both the retail drug cost and related dispensing cost. For generics, the dispensing cost may make up a sizable portion of the prescription cost, especially when small quantities of low-cost generic drugs are being dispensed.
In private plans, more physical units of a drug were reimbursed per prescription than in public plans (55 versus 46 in 2013), and fewer prescriptions were dispensed for a given quantity of generic drugs. This resulted in fewer fees and a lower average prescription cost per unit in private compared to public plans, ranging from 5–12% in 2013, depending on the province.
The previous section concluded that in 2013, the average retail drug costs per unit reimbursed by private plans were generally in line with the public plans. Nevertheless, when the dispensing cost is taken into account, the amounts reimbursed by private plans were actually lower than those in public plans.
Figure 5.1 compares the cost per unit in private and public plans using two distinct measures: (a) the average retail drug cost per unit—including markup but excluding dispensing costs; and (b) the average prescription cost per unit—including markup and dispensing costs.
Retail Drug Cost Per Unit =
(Drug Cost + Markup) / Units
Prescription Cost Per Unit =
(Drug Cost + Markup + Dispensing Cost) / Units
These amounts refer to what was accepted for reimbursement by the drug plans. See Appendix A for definitions.
The results in Figure 5.1a are presented in the form of private-to-public average retail cost per unit ratios. They suggest that for generics, the average retail drug costs per unit reimbursed in private plans were either slightly below (Saskatchewan 0.98), at level (Manitoba and Ontario—1.00 and 1.01, respectively), or above (Prince Edward Island, New Brunswick, Nova Scotia and Alberta—1.03, 1.05, 1.07 and 1.08, respectively) those reimbursed by the public plans. Similar results are presented for most provinces for the brand-name drugs.
However, the corresponding results in Figure 5.1b show that, for generics, the average prescription costs per unit reimbursed were consistently lower in private plans, ranging from 0.88 to 0.95 of the corresponding public plan levels, depending on the province. For the brand market, the prescription costs per unit in private plans were in line with those of public plans.
Figure 5.1 Ratio of private-to-public average cost per unit at retail and prescription level, generic and brand-name drugs, by province, 2013
Click on image for larger view
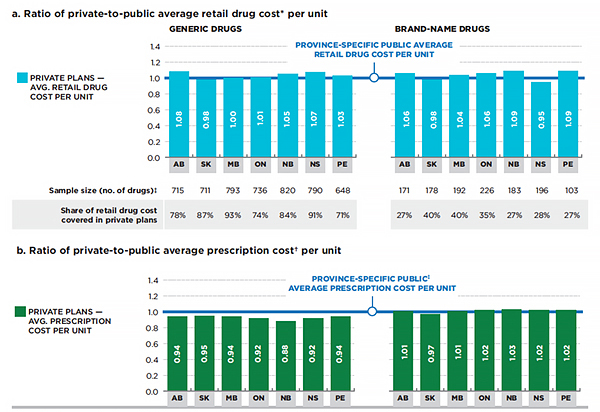
Figure description
These two bar graphs compare the cost per unit in private and public plans in Canada using two distinct measures for the provinces reported: (a) the average retail drug cost per unit – including markup but excluding dispensing costs; and (b) the average prescription cost per unit – including markup and dispensing costs.
The results for Figure 5.1a
On the graph, these results are presented in the form of private-to-public average retail cost per unit ratios in 2013. The province-specific public average retail drug cost per unit is fixed at 1.0.
Generic drugs:
In Alberta, the average retail drug cost per unit for generic drugs under private plans was 1.08; Saskatchewan: 0.98; Manitoba: 1.00; Ontario: 1.01; New Brunswick: 1.05; Nova Scotia: 1.07; Prince Edward Island: 1.03.
The sample size (number of generic drugs) for Alberta was 715; Saskatchewan: 711; Manitoba: 793; Ontario: 736; New Brunswick: 820; Nova Scotia: 790; Prince Edward Island: 648.
In Alberta, the corresponding share of retail drug cost for generic drugs covered in private plans was 78%. In percent, Saskatchewan: 87; Manitoba: 93; Ontario: 74; New Brunswick: 84; Nova Scotia: 91; Prince Edward Island: 71.
Brand-name drugs:
In Alberta, the average retail drug cost per unit for brand-name drugs was 1.06. Saskatchewan: 0.98; Manitoba: 1.04; Ontario: 1.06; New Brunswick: 1.09; Nova Scotia: 0.95; Prince Edward Island: 1.09.
The sample size (number of brand-name drugs) for Alberta was 171; Saskatchewan: 178; Manitoba: 192; Ontario: 226; New Brunswick: 183; Nova Scotia: 196; Prince Edward Island: 103.
In Alberta, the corresponding share of retail drug cost for brand-name drugs covered in private plans was 27%. In percent, Saskatchewan: 40; Manitoba: 40; Ontario: 35; New Brunswick: 27; Nova Scotia: 28; Prince Edward Island: 27.
The results for Figure 5.1b
On the graph, these results are presented in the form of private-to-public average prescription cost per unit ratios in 2013. The province-specific public average prescription cost per unit is fixed at 1.0.
Generic drugs:
In Alberta, the average prescription cost per unit for generic drugs under private plans was 0.94; Saskatchewan: 0.95; Manitoba: 0.94; Ontario: 0.92; New Brunswick: 0.88; Nova Scotia: 0.92; Prince Edward Island: 0.94.
Brand-name drugs:
In Alberta, the average prescription cost per unit for brand-name drugs under private plans was 1.01; Saskatchewan: 0.97; Manitoba: 1.01; Ontario: 1.02; New Brunswick: 1.03; Nova Scotia: 1.02; Prince Edward Island: 1.02.
Note: Results are restricted to oral solid drugs with over 1,000 in annual prescriptions. The brand-name drug analysis was also restricted to single-source drugs.
* Includes drug cost and markup; excludes dispensing cost.
† Includes drug cost, markup and dispensing cost.
‡ Public plan Ontario data on Long Term Care, Home Care and Homes for Special Care was excluded from this analysis due to the potential for an increased frequency of dispensing specific to the beneficiaries in these plans.
Data source: IMS Brogan Private Pay Direct Drug Plan Database; National Prescription Drug Utilization Information System Database, Canadian Institute for Health Information.
At the provincial level, the most significant differences in results between the retail drug cost approach in 5.1a and the prescription cost approach in 5.1b are observed in Alberta, Ontario, New Brunswick, Nova Scotia and PEI. The first three of these provinces were also highlighted in the PMPRB CompassRx report (PMPRB 2015) as having had prescription size reductions in recent years.
Even when compared with the Ontario public plan, which reimburses some of the lowest generic acquisition cost levels, there was an increased alignment between the private and public cost levels across all provinces. For instance, the retail drug cost per unit for generics in private plans in British Columbia was 1.35 of the Ontario acquisition cost, but when the dispensing cost is factored in, the prescription cost per unit was on par with the Ontario cost.
Similar conclusions can be drawn from Figure 5.2 for the other provinces, namely, that the prescription cost per unit in private plans was often on par or lower than that in the Ontario public plan. The most notable exceptions are the private plans in Quebec. These plans reimbursed the highest prescription cost per unit for generics, with average levels 51% or 64% higher than the corresponding levels in the Ontario public and private plans, respectively.
Figure 5.2 Ratio of private-to-Ontario public average cost per unit at retail and prescription level, generic drugs, by province 2013
Click on image for larger view
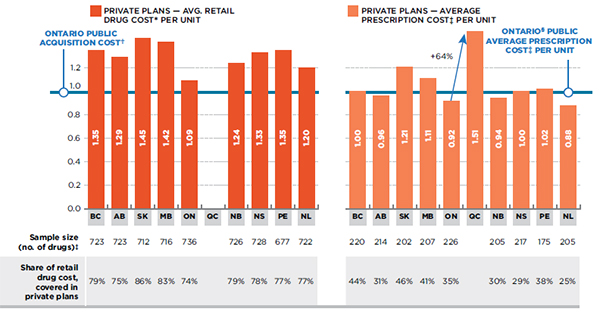
Figure description
These two bar graphs depict the ratio of private-to-Ontario public average cost per unit at retail and prescription level for generics drugs by reported province in 2013.
The first graph depicts the ratio of private-to-Ontario public average cost per unit at retail level (includes drug cost and markup but excludes dispensing cost). The private plan retail drug costs are compared to the Ontario public acquisition cost, which is set to 1.0.
In British Columbia, the average retail drug cost per unit for generics in private plans was 1.35 of the Ontario acquisition cost. In Alberta: 1.29; Saskatchewan: 1.45; Manitoba: 1.42; Ontario 1.09: Quebec: not available; New Brunswick: 1.24; Nova Scotia: 1.33; Prince Edward Island: 1.35; Newfoundland and Labrador: 1.20.
The sample size (number of drugs) for British Columbia was 723; Alberta: 723; Saskatchewan: 712; Manitoba: 716; Ontario: 736; Quebec: not available; New Brunswick: 726; Nova Scotia: 728; Prince Edward Island: 677; Newfoundland and Labrador: 722.
The corresponding share of retail drug cost was 79% for British Columbia. In percent, Alberta: 75; Saskatchewan: 86; Manitoba: 83; Ontario: 74; Quebec: not available; New Brunswick: 79; Nova Scotia: 78; Prince Edward Island: 77; Newfoundland and Labrador: 77.
The second graph depicts the ratio of private-to-Ontario public average prescription cost (includes drug cost, markup and dispensing cost). The private plan prescription costs are compared to the Ontario public average prescription cost per unit, which is set to 1.0.
In British Columbia, the average prescription cost per unit was 1.00 of the Ontario public cost. In Alberta: 0.96; Saskatchewan: 1.21; Manitoba: 1.11; Ontario: 0.92; Quebec: 1.51 (a 64% increase over the Ontario private cost); New Brunswick: 0.94; Nova Scotia: 1.00; Prince Edward Island: 1.02; Newfoundland and Labrador: 0.88.
The sample size (number of drugs) for British Columbia was 220; Alberta: 214; Saskatchewan: 202; Manitoba: 207; Ontario: 226; Quebec: not available; New Brunswick: 205; Nova Scotia: 217; Prince Edward Island: 175; Newfoundland and Labrador: 205.
The corresponding share of retail drug cost was 44% for British Columbia. In percent, Alberta: 31; Saskatchewan: 46; Manitoba: 41; Ontario: 35; Quebec: not available; New Brunswick: 30; Nova Scotia: 29; Prince Edward Island: 38; Newfoundland and Labrador: 25.
Note: Results are restricted to oral solid drugs with over 1,000 in annual prescriptions.
* Includes drug cost and markup; excludes dispensing cost.
† Determined based on the average drug cost per unit accepted for reimbursement by the public plans, excluding the markup and dispensing cost.
‡ Includes drug cost, markup and dispensing cost.
§ Public plan Ontario data on Long Term Care, Home Care and Homes for Special Care was excluded from this analysis due to the potential for an increased frequency of dispensing specific to the beneficiaries in these plans.
Data source: IMS Brogan Private Pay Direct Drug Plan Database; National Prescription Drug Utilization Information System Database, Canadian Institute for Health Information.
Private plans in Ontario reimbursed a prescription cost that was 8% lower than the Ontario public level, mainly due to a reduced frequency of dispensing as substantiated in the next few figures. Note that the Ontario data on Long Term Care, Home Care and Homes for Special Care was excluded from this analysis due to the potential for frequent dispensing specific to beneficiaries in these plans.
The lower average prescription cost per unit in private plans is explained by a relatively low dispensing cost due to less frequent dispensing.
As Figure 5.3 highlights, with the exception of Alberta, Saskatchewan and Prince Edward Island, the average prescription size in private plans was higher than in public plans in 2013. On average, 55 generic oral solids were dispensed to private plan beneficiaries for every dispensing fee, whereas, only 46 were dispensed to public plan beneficiaries. Ontario public had a relatively low average prescription size of 39 units, second lowest only to Quebec’s private plans. A more in-depth analysis of the prescription size in public plans is provided in the PMPRB CompassRx report (PMPRB 2015).
Figure 5.3 Average number of units per prescription for generic drugs in oral solid form, private versus public plans, by province, 2013
Click on image for larger view
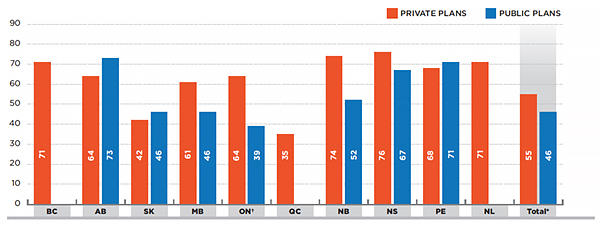
Figure description
This bar graph depicts the average number of units per prescription for generic drugs in oral solid form, in private versus public plans, by province, in 2013. The bar graph also gives the total for all provinces reported.
British Columbia private plans 71; public plans had no information available for 2013
Alberta private plans 64; public plans 73.
Saskatchewan private plans 42; public plans 46.
Manitoba private plans 61; public plans 46.
Ontario private plans 64; public plans: 39. Public plan Ontario data on Long Term Care, Home Care and Homes for Special Care was excluded from this analysis due to the potential for an increased frequency of dispensing specific to the beneficiaries in these plans.
Quebec private plans 35; public plans had no information available for 2013.
New Brunswick private plans 74; public plans 52.
Nova Scotia private plans 76; public plans 67.
Prince Edward Island private plans 68; public plans 71.
Newfoundland and Labrador private plans 71; under public plans had no information available for 2013.
In total for all provinces in this analysis, the average number of units per prescription for generic drugs in oral solid form under Canadian private plans was 55; under public plans it was 46. These are the total results for the plans reported in this figure.
Note: The analysis was restricted to oral solids drugs.
* Total results for the plans reported in this figure.
† Public plan Ontario data on Long Term Care, Home Care and Homes for Special Care was excluded from this analysis due to the potential for an increased frequency of dispensing specific to the beneficiaries in these plans.
Data source: IMS Brogan Private Pay Direct Drug Plan Database; National Prescription Drug Utilization Information System Database, Canadian Institute for Health Information
Note that unlike private drug plans, public plans are represented by a large senior population that may require more frequent drug dispensing and monitoring, which may explain the relatively smaller prescription size in public plans. In addition, provincial variations in prescription size may be due to a number of factors including, but not limited to, the disease profile of the population, prescribing and dispensing patterns and variations in related provincial policies.
The prescription cost for generics in private plans in Quebec was 64% higher than in private plans in Ontario. This was most likely due to the much higher frequency of dispensing, as suggested by the relatively small prescription size in Quebec (35 units compared to 64 units for Ontario private plans).
A reduced prescription size translates into more dispensing fees being reimbursed for any given quantity of drugs. Consequently, dispensing costs account for an increased share of the prescription cost. In the case of generic drugs, the dispensing cost can become a sizable portion of the prescription cost, given the relatively low price of generic drugs, especially if a small quantity of drugs is dispensed.
The less frequent dispensing of drugs in private plans resulted in a lower concentration of dispensing costs in the overall prescription cost for generics in 2013. Figure 5.4 reports the dispensing cost as a share of prescription cost in private plans versus public plans for generic and brand-name drugs. In the case of generic drugs, the dispensing cost accounted for 28% of the prescription cost in private plans and 39% in public plans in 2013.
Figure 5.4 Dispensing cost as a share of prescription cost*, private versus public plans, by province, 2013
Click on image for larger view
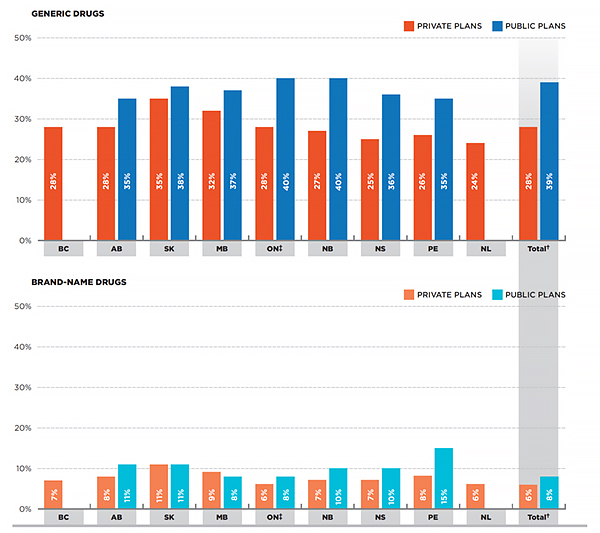
Figure description
These are two bar graphs depicting the dispensing cost as a share of prescription cost (including drug cost, markup and dispensing cost) for generic and brand-name drugs in Canadian private and public plans, by province, in 2013. The graphs also give the total share for all provinces reported.
Generic drugs
The first bar graph depicts the dispensing cost as a share of prescription for generic drugs.
In British Columbia, under private plans, the dispensing cost of generic drugs as a share of prescription cost was 28%. In percent, Alberta: 28; Saskatchewan: 35; Manitoba: 32; Ontario: 28; New Brunswick: 27; Nova Scotia: 25; Prince Edward Island: 26; Newfoundland and Labrador: 24; total for all provinces: 28.
In British Columbia, under public plans, the dispensing cost of generic drugs as a share of prescription cost was not available in 2013. In percent, Alberta: 35; Saskatchewan: 38; Manitoba: 37; Ontario: 40; New Brunswick: 40; Nova Scotia: 36; Prince Edward Island: 35; Newfoundland and Labrador: not available in 2013; total for all provinces: 39.
Brand-name drugs
The second bar graph depicts the dispensing cost as a share of prescription for brand-name drugs.
In British Columbia, under private plans, the dispensing cost of brand-name drugs as a share of prescription cost was 7%. In percent, Alberta: 8; Saskatchewan: 11; Manitoba: 9; Ontario: 6; New Brunswick: 7; Nova Scotia: 7; Prince Edward Island: 8; Newfoundland and Labrador: 6; total for all provinces: 6.
In British Columbia, under public plans, the dispensing cost of brand-name drugs as a share of prescription cost was not available in 2013. In percent, Alberta: 11; Saskatchewan: 11; Manitoba: 8; Ontario: 8; New Brunswick: 10; Nova Scotia: 10; Prince Edward Island: 15; Newfoundland and Labrador: not available in 2013; total for all provinces: 8.
Note: Both the generic and the brand-name drug analyses were restricted to oral solids drugs. The brand-name drug analysis was also restricted to single-source drugs.
* Composed of drug cost, markup and dispensing cost.
† Total results for the plans reported in this figure.
‡ Public plan Ontario data on Long Term Care, Home Care and Homes for Special Care was excluded from this analysis due to the potential for an increased frequency of dispensing specific to the beneficiaries in these plans.
Data source: IMS Brogan Private Pay Direct Drug Plan Database; National Prescription Drug Utilization Information System Database, Canadian Institute for Health Information.
In the case of brand-name drugs, the dispensing cost represented a much smaller share of the prescription cost, given the relatively high cost of brand-name drugs. Nevertheless, the share of dispensing costs was, on average, still lower in private (6%) than in public plans (8%). Note that these variations are also a function of the retail drug cost of the brand-name drugs utilized, as a higher use of more expensive drugs would result in a low relative share of dispensing costs.
The average dispensing fee per prescription in public plans ($8.24) was lower than in private plans ($9.54), largely due to the relatively low level reimbursed by the public plan in Ontario ($7.42)—Figure 5.5.
Figure 5.5 Average dispensing fee per prescription for generic drugs in oral solid form, private versus public plans, by province, 2013
Click on image for larger view
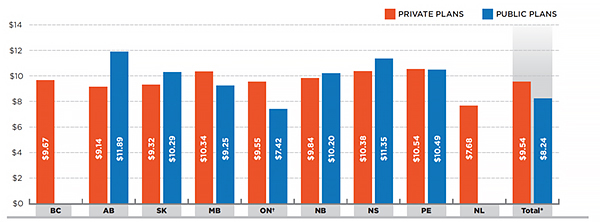
Figure description
This is a bar graph depicting the average dispensing fee per prescription for generic drugs in oral solid form in Canadian private and public plans, by province, in 2013. The graph also gives the average fee for all provinces reported.
In British Columbia, under private plans, the average dispensing fee was $9.67. In dollars, Alberta: 9.14; Saskatchewan: 9.32; Manitoba: 10.34; Ontario: 9.55; New Brunswick: 9.84; Nova Scotia: 10.38; Prince Edward Island: 10.54; Newfoundland and Labrador: 7.68; total for all provinces: 9.54.
In British Columbia, under public plans, the average dispensing fee was not available for 2013. In dollars, Alberta: 11.89; Saskatchewan: 10.29; Manitoba: 9.25; Ontario: 7.42; New Brunswick: 10.20; Nova Scotia: 11.35; Prince Edward Island: 10.49; Newfoundland and Labrador: not available; total for all provinces: 8.24.
Note: The analysis was restricted to oral solids drugs.
* Total results for the plans reported in this figure.
† Public plan Ontario data on Long Term Care, Home Care and Homes for Special Care was excluded from this analysis due to the potential for an increased frequency of dispensing specific to the beneficiaries in these plans.
Data source: IMS Brogan Private Pay Direct Drug Plan Database; National Prescription Drug Utilization Information System Database, Canadian Institute for Health Information
At a provincial level, even though the average dispensing fee may have been higher in private plans, the larger average prescription size resulted in a reduced average prescription cost per unit for generics.
In both Figures 5.5 and 5.3, Alberta and Saskatchewan are the two notable exceptions, with higher average dispensing fees and larger prescription sizes in public plans.
6. The Prescription Cost of Generic Atorvastatin: A Case Study
The frequency of dispensing resulted in a relatively low prescription drug cost for generic atorvastatin calcium (atorvastatin) 20 mg tablets in private compared to public plans. This was the top generic drug in private plans in terms of retail cost in 2013.
The analysis provided in Section 2 identified atorvastatin as the top generic drug in terms of retail drug costs in 2013. This section analyzes the largest utilized strength of this drug (20 mg) to demonstrate the role of prescription size in the overall prescription cost of generics. It provides a comparative analysis across provinces as well as private and public plans of the prescription cost of 1 million units of generic atorvastatin calcium, in 20 mg tablet, in 2013.
Figure 6.1 reports that, at a provincial level, private plans closely mirror the public plan retail drug cost levels for the generic atorvastatin 20 mg tablet. The Manitoba markets appear to have reimbursed the lowest retail drug cost levels at $0.41 a tablet.
Figure 6.1 Average retail drug cost* per unit for generic atorvastatin 20 mg tablets, private versus public plans, by province, 2013
Click on image for larger view
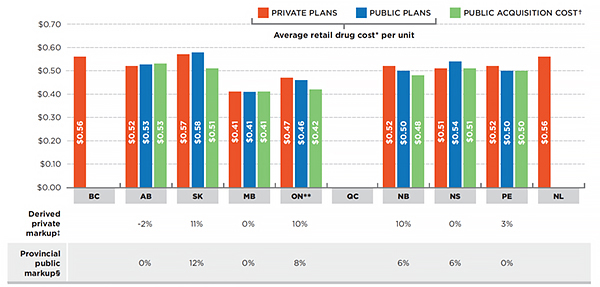
Figure description
This is a bar graph depicting the average retail drug cost per unit for generic atorvastatin 20 mg tablets in Canadian private and public plans by province in 2013. Note that the average retail drug costs include the drug cost and markup, but exclude the dispensing cost. These retail costs are compared to the public acquisition cost, which is based on the average drug cost per unit accepted for reimbursement by the public plans, excluding the markup and dispensing cost. Note that the Public plan Ontario data on Long Term Care, Home Care and Homes for Special Care was excluded from this analysis due to the potential for an increased frequency of dispensing specific to beneficiaries in these plans.
In British Columbia, under private plans, the average retail drug cost was $0.56. In dollars, Alberta: 0.52; Saskatchewan: 0.57; Manitoba: 0.41; Ontario: 0.47; Quebec: not available; New Brunswick: 0.52; Nova Scotia: 0.51; Prince Edward Island: 0.52; Newfoundland and Labrador: 0.56.
In British Columbia, under public plans, the average retail drug cost was not available. In dollars, Alberta: 0.53; Saskatchewan: 0.58; Manitoba: 0.41; Ontario: 0.46; Quebec: not available; New Brunswick: 0.50; Nova Scotia: 0.54; Prince Edward Island: 0.50; Newfoundland and Labrador: not available.
In British Columbia, the public acquisition cost was not available. In dollars, Alberta: 0.53; Saskatchewan: 0.51; Manitoba: 0.41; Ontario: 0.42; Quebec: not available; New Brunswick: 0.48; Nova Scotia: 0.51; Prince Edward Island: 0.50; Newfoundland and Labrador: not available.
A table under the graph gives the corresponding derived private markup where available. This is the percent difference between the average retail cost per unit in private plans and the public assumed acquisition cost. The table also gives the provincial public markup (if available) as a percentage of the public assumed acquisition cost.
In British Columbia, the derived private markup is not available. In percent, Alberta: -2; Saskatchewan: 11; Manitoba: 0; Ontario: 10; Quebec: not available; New Brunswick: 10; Nova Scotia: 0; Prince Edward Island: 3; Newfoundland and Labrador: not available.
In British Columbia, the provincial public markup is not available. In percent, Alberta: 0; Saskatchewan: 12; Manitoba: 0; Ontario: 8; Quebec: not available; New Brunswick: 6; Nova Scotia: 6; Prince Edward Island: 0; Newfoundland and Labrador: not available.
* Includes drug cost and markup; excludes dispensing cost.
† Determined based on the average drug cost per unit accepted for reimbursement by the public plans, excluding the markup and dispensing cost.
‡ Percent difference between the average retail cost per unit in private plans and the public assumed acquisition cost.
§ The public markup as a percentage of the public assumed acquisition cost.
** Public plan Ontario data on Long Term Care, Home Care and Homes for Special Care was excluded from this analysis due to the potential for an increased frequency of dispensing specific to beneficiaries in these plans.
Data source: IMS Brogan Private Pay Direct Drug Plan Database; National Prescription Drug Utilization Information System Database, Canadian Institute for Health Information.
The provincial variations in the average retail drug cost per unit for generic atorvastatin 20 mg coincide with the timing of the implementation of provincial generic pricing policies, with many price reductions taking place in 2013. As noted earlier, generic prices have evolved since 2013, and the results may not reflect the current reimbursed costs in private or public plans.
Figure 6.2 suggests that, generally, the number of dispensing fees reimbursed for 1 million tablets of generic atorvastatin 20 mg was much smaller in private than in public plans, in the range of 13,162 to 14,490 in most provinces (except for Quebec, Saskatchewan and Manitoba). In Albert and Saskatchewan, the number of fees in private plans mirrored those in public plans. The highest number of fees for dispensing this quantity of drugs was in Quebec private plans (31,951).
Figure 6.2 Number of fees for the dispensing of 1 million tablets of generic atorvastatin 20 mg, private versus public plans, by province, 2013
Click on image for larger view
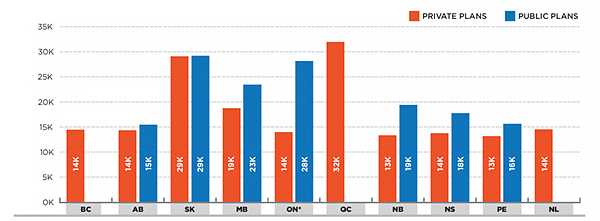
Figure description
This is a bar graph depicting the number of fees for the dispensing of 1 million tablets of generic atorvastatin 20 mg in Canadian private and public plans by province in 2013. Note that the Public plan Ontario data on Long Term Care, Home Care and Homes for Special Care was excluded from this analysis due to the potential for an increased frequency of dispensing specific to beneficiaries in these plans.
In British Columbia, under private plans, there were 14,000 fees. In Alberta: 14,000; Saskatchewan: 29,000; Manitoba: 19,000; Ontario: 14,000; Quebec: 32,000; New Brunswick: 13,000; Nova Scotia: 14,000; Prince Edward Island: 13,000; Newfoundland and Labrador: 14,000.
In British Columbia, under public plans, the number of fees for was not available; Alberta: 15,000; Saskatchewan: 29,000; Manitoba: 23,000; Ontario: 28,000; Quebec: not available; New Brunswick: 19,000; Nova Scotia: 18,000; Prince Edward Island: 16,000, Newfoundland and Labrador: not available.
* Public plan Ontario data on Long Term Care, Home Care and Homes for Special Care was excluded from this analysis due to the potential for an increased frequency of dispensing specific to beneficiaries in these plans.
Data source: IMS Brogan Private Pay Direct Drug Plan Database; National Prescription Drug Utilization Information System Database, Canadian Institute for Health Information.
These findings point toward less frequent dispensing in private plans, and consequently, lower related costs, as reported in Figure 6.3. Note that the dispensing costs exclude the drug cost and markups.
Figure 6.3 Dispensing costs for 1 million tablets of generic atorvastatin 20 mg, private versus public plans, by province, 2013
Click on image for larger view
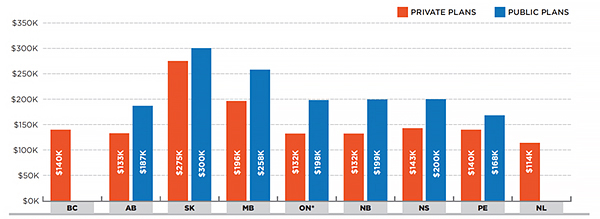
Figure description
This is a bar graph depicting the dispensing costs for 1 million tablets of generic atorvastatin 20 mg in Canadian private and public plans by province in 2013. Note that the Public plan Ontario data on Long Term Care, Home Care and Homes for Special Care was excluded from this analysis due to the potential for an increased frequency of dispensing specific to beneficiaries in these plans.
In British Columbia, under private plans, the dispensing cost was $140,000. In dollars, Alberta: 133,000; Saskatchewan: 275,000; Manitoba: 196,000; Ontario: 132,000; New Brunswick: 132,000; Nova Scotia: 143,000; Prince Edward Island; 140,000; Newfoundland and Labrador: 114,000.
In British Columbia, under public plans, the dispensing cost was not available in 2013. In dollars, Alberta; 187,000; Saskatchewan: 300,000; Manitoba: 258,000; Ontario: 198,000; New Brunswick: 199,000; Nova Scotia: 200,000; Prince Edward Island: 168,000; Newfoundland and Labrador: not available.
* Public plan Ontario data on Long Term Care, Home Care and Homes for Special Care was excluded from this analysis due to the potential for an increased frequency of dispensing specific to beneficiaries in these plans.
Data source: IMS Brogan Private Pay Direct Drug Plan Database; National Prescription Drug Utilization Information System Database, Canadian Institute for Health Information.
Private and public plans in Saskatchewan, as well as the public plans in Manitoba, reimbursed some of the highest dispensing costs for 1 million tablets of generic atorvastatin 20 mg.
Total dispensing costs are a function of the number of dispensing fees reimbursed (as reported in Figure 6.2) and the average dispensing fee per prescription. The latter, reported in Figure 5.5 for all generic drugs in oral solid form, is very much in line with the average fees for generic atorvastatin 20 mg. The public plan in Manitoba is an exception to this, with an average fee per prescription of $11.01 in 2013.
Figure 6.4 separates the prescription drug expenditure for 1 million tablets of generic atorvastatin 20 mg into its two main components: retail drug cost and dispensing cost.
Figure 6.4 Total prescription cost for 1 million tablets of generic atorvastatin 20 mg, private versus public plans, by province, 2013
Click on image for larger view
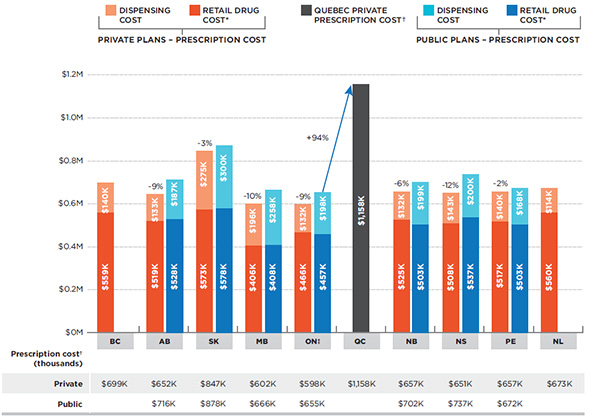
Figure description
This is a stacked bar graph depicting the total prescription cost for 1 million tablets of generic atorvastatin 20 mg in Canadian private and public plans by province in 2013. The prescription cost reported includes the drug cost, markup and the dispensing cost. The retail drug cost reported includes the drug cost and markup but excludes the dispensing cost. Note that the Public plan Ontario data on Long Term Care, Home Care and Homes for Special Care was excluded from this analysis due to the potential for an increased frequency of dispensing specific to beneficiaries in these plans.
Private Plans
Under private plans in British Columbia, the total prescription cost for 1 million tablets of generic atorvastatin 20 mg in private plans was $699,000; $559,000 of which represents the dispensing cost, and $140,000 of which represents the retail drug cost.
The values for the other provinces are as follows (all values are given in dollars):
Alberta – total prescription cost: 652,000; dispensing cost: 519,000; retail drug cost: 133,000. This represents 9% less than the prescription costs in the corresponding public plans.
Saskatchewan – total prescription cost: 847,000; dispensing cost: 573,000; retail drug cost: 275,000. This represents 3% less than the prescription costs in the corresponding public plans.
Manitoba – total prescription cost: 602,000; dispensing cost: 406,000; retail drug cost: 196,000. This represents 10% less than the prescription costs in the corresponding public plans.
Ontario – total prescription cost: 598,000; dispensing cost: 466,000; retail drug cost: 132,000. This represents 9% less than the prescription costs in the corresponding public plans.
New Brunswick – total prescription cost: 657,000; dispensing cost: 525,000; retail drug cost: 132,000. This represents 6% less than the prescription costs in the corresponding public plans.
Nova Scotia – total prescription cost: 651,000; dispensing cost: 508,000; retail drug cost: 143,000. This represents 12% less than the prescription costs in the corresponding public plans.
Prince Edward Island – total prescription cost 657,000; dispensing cost: 517,000, retail drug cost: 140,000. This represents 2% less than the prescription costs in the corresponding public plans.
Newfoundland and Labrador – total prescription cost 673; dispensing cost: 560,000, retail drug cost: 114,000. Note that there was no public plan data available for this province.
Public Plans
Under public plans in British Columbia, the total prescription cost for 1 million tablets of generic atorvastatin 20 mg in public plans was not available in 2013.
The values for the other provinces are as follows (all values are given in dollars):
Alberta – total prescription cost: 716,000; dispensing cost: 528,000; retail drug cost: 187,000.
Saskatchewan – total prescription cost: 878,000; dispensing cost: 578,000; retail drug cost: 300,000.
Manitoba – total prescription cost: 666,000; dispensing cost: 408,000; retail drug cost: 258,000.
Ontario – total prescription cost: 655,000; dispensing cost: 457,000; retail drug cost: 198,000.
New Brunswick – total prescription cost: 702,000; dispensing cost: 503,000; retail drug cost: 199,000.
Nova Scotia – total prescription cost: 737,000; dispensing cost: 537,000; retail drug cost: 200,000.
Prince Edward Island – total prescription cost: 672,000; dispensing cost: 503,000; retail drug cost: 168,000.
Newfoundland and Labrador – there was no public plan data available for this province.
Quebec
Data for the public plans in Quebec was not available. Quebec’s total private prescription cost was $1,158,000. This was 94% higher than the total prescription cost for Ontario public plans.
* Includes drug cost and markup; excludes dispensing cost.
† Includes drug cost, markup and dispensing cost.
‡ Public plan Ontario data on Long Term Care, Home Care and Homes for Special Care was excluded from this analysis due to the potential for an increased frequency of dispensing specific to beneficiaries in these plans.
Data source: IMS Brogan Private Pay Direct Drug Plan Database; National Prescription Drug Utilization Information System Database, Canadian Institute for Health Information.
In the private drug plan data reported for Quebec, the retail drug cost and the dispensing cost components could not be separated; however, their combined costs greatly exceeded the prescription cost for the dispensing of 1 million generic atorvastatin 20 mg tablets in the other private and public plans in 2013. Private plans in Quebec spent almost double the levels in private plans in Ontario (94% more), translating into over $0.5 million in higher prescription costs.
Appendix E provides additional analyses of the other top generic drugs reported in Table 2.1, which further substantiates these findings, namely that less frequent dispensing of generic drugs has resulted in lower prescription drug expenditures in private plans in 2013.
References
CIHI. 2014. Prescribed Drug Spending in Canada, 2013: A Focus on Public Drug Programs. Ottawa: Canadian Institute for Health Information, page vii. Available at: https://secure.cihi.ca/free_products/Prescribed%20Drug%20Spending%20in%20Canada_2014_EN.pdf (Accessed November 2015)
Competition Bureau, Canada. 2008. Benefiting from Generic Drug Competition in Canada: The Way Forward. Ottawa: Competition Bureau. Available at http://www.competitionbureau.gc.ca/eic/site/cb-bc.nsf/425f69a205e4a9f48525742e00703d75/cbed785bfb12c7f985257e430060fb44/$FILE/GenDrugStudy-Report-081125-fin-e.pdf (Accessed November 2015).
Council of the Federation. 2014. Fact Sheet on pan-Canadian Pharmaceutical Initiatives. Available from: http://canadaspremiers.ca/en/initiatives/358-pan-canadian-pharmaceutical-alliance (Accessed November 2015).
Lynas, K. 2012. Private Insurers Implementing Policies Making Generic Substitution Mandatory. Can Pharm J (Ott). Nov; 145(6): 245. http://www.ncbi.nlm.nih.gov/pmc/articles/PMC3567597/ (Accessed November 2015). doi: 10.3821/145.6.cpj245
PMPRB. 2010. Generic Drugs in Canada: Market Structure — Trends and Impacts. Ottawa: Patented Medicine Prices Review Board. Available at http://www.pmprb-cepmb.gc.ca/CMFiles/Publications/Analytical%20Studies/NPDUIS-GenDrugs-MarketStructure-e.pdf (Accessed November 2015).
PMPRB. 2011. Generic Drugs in Canada: International Price Comparisons and Potential Cost Savings. Ottawa: Patented Medicine Prices Review Board. Available at http://www.pmprb-cepmb.gc.ca/CMFiles/Publications/Analytical%20Studies/NPDUIS-GenericDrugs-IPCs-e-sept30.pdf (Accessed November 2015).
PMPRB. 2014. Generic Drugs in Canada, 2013. Ottawa: Patented Medicine Prices Review Board. Available at: http://www.pmprb-cepmb.gc.ca/CMFiles/NPDUIS/2013-GenReport/PMPRB_NPDUIS_GenericDrugs2013_2014-12_EN.pdf (Accessed November 2015).
PMPRB. 2015. NPDUIS CompassRx: Annual Public Drug Plan Expenditure Report, 1st Edition. Ottawa: Patented Medicine Prices Review Board. Available at: http://www.pmprb-cepmb.gc.ca/CMFiles/NPDUIS/PMPRBCompassRx-31-03-2015-Eng.pdf (Accessed November 2015)
Appendices
Appendix A: Glossary
Active beneficiary: An individual with at least one claim accepted by a private or a public drug plan.
Anatomical Therapeutic Chemical (ATC): A classification system that divides drugs into different groups according to the organ or system on which they act and/or their therapeutic and chemical characteristics. It is maintained by the World Health Organization Collaborating Centre for Drug Statistics Methodology. The ATC system is divided into five different levels. This analysis was conducted at the second level, which relates to the therapeutic main group.
Acquisition cost: This cost is determined based on the average unit cost accepted for reimbursement by public plans, excluding markups and dispensing costs. This is an assumed cost; it reflects what was accepted for reimbursement and may differ from the actual amount claimed by a pharmacy. The acquisition cost was used in the analysis to provide estimates for assumed private drug plan markups. The actual acquisition cost in private plans may be different, as pharmacies with varying customary markup levels may be servicing public and private drug plan beneficiaries to a different extent.
Dispensing cost: A component of the prescription cost that represents the amount accepted for reimbursement by a private or public drug plan for the dispensing of medication to an active beneficiary.
Dispensing fee: A professional fee charged by a pharmacist for dispensing a prescription and accepted for reimbursement by a private or public drug plan.
Drug: A unique combination of active ingredient, strength and form.
Drug cost: An amount accepted for reimbursement by a private or public drug plan that reflects the acquisition cost to the pharmacy for a drug. This may include wholesale markups, but excludes pharmacy markups and dispensing fees.
Markup: An amount accepted for reimbursement by a private or public drug plan that reflects the difference between the pharmacy retail price and the drug cost. It may also include a wholesale upcharge component, as per the specific markup policies in public plans.
Prescription: A claim for which the drug program accepts at least a portion of the cost, either toward a deductible or for reimbursement. Claims reimbursed by a private or public drug plan and that relate to pharmacy professional services other than the dispensing of medications (such as the review of medications or the administration of vaccines) are not included in the analysis.
Prescription drug expenditure: The sum of the three components of a prescription: drug costs, pharmacy markups (if applicable) and dispensing fees. These are amounts accepted by a public drug plan toward the deductible or for reimbursement of active beneficiaries. Submitted amounts that were not accepted for reimbursement (drug not reimbursed, unit cost above the accepted price, etc.) are not captured in these amounts. The prescription drug expenditures include both the plan-paid and beneficiary-paid amounts, such as co-payments and deductibles.
Prescription size: The physical quantity of drugs or the number of day supply for which the prescribed drug was dispensed to an active beneficiary. The day supply can be used to measure the prescription length.
Private drug plan: This is a general term used to describe private insurance coverage for prescription drugs provided through employer-sponsored plans or individual insurance. Private drug plans establish eligibility requirements and cost sharing structures, as well as drugs accepted for reimbursement.
Product: Refers to a version of a drug sold by a particular manufacturer.
Public drug plan: This is a general term used to describe drug plans that are administered by provincial, territorial or federal governments. Examples include the public drug plans analyzed in this report. Public drug plans establish eligibility requirements and cost sharing structures, as well as drugs and prices accepted for reimbursement.
Retail drug cost: An amount accepted for reimbursement by a private or public drug plan that reflects the drug cost and markups, but excludes dispensing costs.
Appendix B: Pricing Policies for Generic Drugs in Provincial Drug Plans
Table B1 provides a summary, as of December 31, 2014, of the generic price reduction policies across provinces along with their effective dates.
Table B1. Provincial generic pricing policies, generic price as a percentage of the brand price
| Province |
2010 |
2011 |
2012 |
2013*
April 1, 2013, 18% for six of the most common generic drugs (The Council of the Federation)† |
2014*
April 1, 2014, 18% for ten of the most common generic drugs (The Council of the Federation)† |
| British Columbia |
October 15:
50% existing generics
42% new generics |
July 4: 40% all generics |
April 2: 35% all generics |
April 1: 25% most generics |
April 1: 20% most generics |
| Alberta |
April 1: 56% existing generics
45% new generics |
blank |
July 1: 35% all generics |
May 1: 18% |
April 1:
Lowest available price for existing generics;
tiered pricing for new generics:
70% one generic
50% two generics
25% three generics
18% four or more generics |
| Saskatchewan |
blank |
April 1: 40% new generics
May 1 and June 1:
45% existing generics
April 1 and October 1:
35% generics in former Standing Offer Contract categories |
April 1: 35% |
blank |
blank |
| Manitoba |
Generic drug pricing is subject to utilization management agreements with the manufacturers, which declare that the price of a generic is equal to that of other select provinces. |
| Ontario |
July 20:
25%* public;
50% private & out-of-pocket |
April 1:
25%* public
35% private & out-of-pocket |
April 1:
25%* public, private & out-of-pocket |
blank |
blank |
| Quebec |
Quebec requires that generic manufacturers provide the province the lowest price available in other provinces. |
| New Brunswick |
blank |
blank |
June 1: 40%
December 1: 35% |
June 1: 25% |
blank |
| Nova Scotia |
blank |
July 1: 45% |
January 1: 40%
July 1: 35% |
blank |
November 12: 25%
|
| Prince Edward Island |
blank |
blank |
July 1: 35% |
December 1: 25% |
blank |
| Newfoundland & Labrador |
blank |
blank |
April 1: 45%
October 1: 40% |
April 1: 35%
July 1: 25% |
blank |
Note: Information is up to date as of December 31, 2014. Generic pricing exceptions may exist.
* Generic pricing policies apply to oral solid forms; all others are 35%.
† After April 1, 2013, the general provincial generic pricing policies no longer apply to the drugs subject to the 18% pricing policy as per the Council of the Federation.
Quebec did not participate in the pan-Canadian Generic Value Price Initiative for Generic Drugs, but benefited from it because of the lowest price policy.
Appendix C: Markup Policies in Public Drug Plans, 2013/14
Table C1 provides a summary of markup policies in 2013/14 for the public drug plans participating in the NPDUIS initiative.
Table C1: Public drug plan markup policies, 2013/14
British Columbia
- Most drugs maximum 8%.
- High-cost drugs* maximum 5%.
- Products subject to Actual Acquisition Cost (AAC) pricing maximum 7%.
* High-cost drugs are defined as those for which the expected daily cost of the typical dose is equal to or greater than $40 ($14,600 annual cost).
Alberta
Prices listed in the Alberta Drug Benefit List include a wholesaler markup, but only if the drug manufacturer distributes through a wholesaler. In such cases, the drug manufacturer is asked to include a distribution allowance of up to 7.5%. This applied only to single-source products in 2013/2014.
Saskatchewan
With a few exceptions, the maximum allowable pharmacy markup calculated on the prescription drug cost was:
blank
| Drug cost |
Markup |
| $0.01–$6.30 |
30% |
| $6.31–$15.80 |
15% |
| $15.81–$200 |
10% |
| >$200.01 |
$20 max |
Saskatchewan also allowed a wholesale markup on specific products: insulin: 5%; standing offer contract (SOC) products: 6%; generic drugs: 6.5%; and most other drugs: 8.5%. Wholesale markup is capped at $50 per package size and is subject to the AAC.
Manitoba
No markup policy.
Ontario
Maximum 8% where permitted.
New Brunswick
Effective June 1, 2013, a markup on interchangeable drugs was increased to up to 8%.
Nova Scotia
Manufacturer list price plus 10.5% (maximum $250) including methadone, or the maximum reimbursable price (MRP) or the Pharmacare reimbursement price (PRP) plus 6.0% (maximum $250) plus a $1.05 transition fee. Exceptions include: ostomy supplies—AAC plus 10.0% (maximum $50) plus a $1.05 transition fee; and compounded extemporaneous products (except methadone and injectables)—AAC plus 2.0% (maximum $50) plus a $1.05 transition fee.
Prince Edward Island
A maximum 6% markup was allowed for drugs on a Maximum Reimbursable Price (MRP) list; and 10% on the ingredient cost for brand-name drugs for which the prescription cost was $2,702 or less, to a maximum of $250 per prescription, and 9.25% on the ingredient cost for brand-name drugs for which the prescription cost was $2,703 or more.
Newfoundland and Labrador
A markup of 8.5%, which was included in the list price on the benefit list.
NIHB
Pharmacy reimbursement, which may or may not include markup, was determined by the NIHB or negotiated between the NIHB and pharmacists’ associations, and differed by province.
Appendix D: Dispensing Fee Policies in Public Drug Plans, 2013/14
Table D1 provides a summary of dispensing fee reimbursement in 2013/14 for the public drug plans participating in the NPDUIS initiative, as detailed in a Plan Information Document produced by CIHI.
Table D1: Public drug plan dispensing fee reimbursement, 2013/14
British Columbia
In 2013/14, the maximum allowable dispensing fee was $10.00. No dispensing fee was reimbursed for insulins, or needles and syringes for insulin therapy. Other reimbursements included pharmacies providing services to long-term care facilities, which received $43.75 per bed serviced. A rural incentive program provided a per claim subsidy ($3.00 to $10.50) to rural pharmacies with monthly claims volumes of less than 1,700. A vaccination administration program reimbursed pharmacies $10 for each publicly funded vaccination administered by an authorized pharmacist.
Alberta
Alberta reimbursed a dispensing fee to pharmacies and an additional inventory allowance. Fees charged varied based on the acquisition cost of the drug. From April 15, 2013, to March 31, 2014, the fees were as follows:
blank
| Actual acquisition cost |
Additional inventory
allowance |
Dispensing fee
excluding the inventory
allowance |
| $0.00–$74.99 |
$1.71 |
$10.22 |
| $75.00–$149.99 |
$2.00 |
$15.53 |
| $150.00 or greater |
$5.03 |
$20.94 |
Alberta also reimbursed an additional charge of up to 75 cents per minute in excess of seven minutes for compounded prescriptions. For some categories of drugs, such as insulin and oral contraceptives, the pharmacy reimbursement could not exceed the acquisition cost of the drug product multiplied by 5/3.
Saskatchewan
The maximum dispensing fee was set at $10.25 for April 1, 2013, to April 30, 2013, and $10.75 for May 1, 2013, to March 31, 2014. Saskatchewan provided an additional reimbursement for trial prescriptions, methadone, compliance packaging and compounding drugs.
Manitoba
In Manitoba, pharmacy service providers were compensated by a market-based professional fee. The dispensing fee or professional fee is an all-inclusive fee that reimburses for the direct and indirect costs associated with dispensing, distribution, and cognitive service functions including patient counseling, and profit. Dispensing fees are regulated under the Prescription Drugs Payment of Benefits Regulation, which defines the professional fee as “the amount regularly charged by a pharmacist to persons who are responsible for paying the fee without reimbursement”. The regulation ensures that pharmacy service providers establish a consistent market-based fee for which cash paying customers are provided equivalent services to that of Pharmacare beneficiaries. Other reimbursements included a maximum dispensing fee of $6.95 for the Employment and Income Assistance Program. For personal care homes, pharmacists were reimbursed $37.50 per bed per month in Winnipeg and $38.20 per bed per month for rural areas.
Ontario
Dispensing fees for non-rural pharmacies were $8.62; for rural pharmacies, the fees ranged from $9.69 to $12.92 for 2013/2014. Dispensing fees were set at a maximum of two fees per medication per patient per month; exceptions included patients in long-term care homes, homes for special care and/or drugs on the exemption medication list.
New Brunswick
The amounts paid for dispensing fees changed on June 1, 2013, as follows: $10.50 for each prescription for both interchangeable and non-interchangeable products; $9.50 for prescriptions for Methadone for Opioid Dependence; and $15.75 for extemporaneous
preparations (compounds).
A rural pharmacy incentive paid an additional $2 for the first 10,000 prescriptions filled in a fiscal year. This incentive applied to pharmacies that were 25 km or more apart.
Nova Scotia
Dispensing fees for drugs or supplies including methadone were reimbursed at $11.05. The exception was compounded extemporaneous products (except methadone and injectables), which were reimbursed at $16.58.
Prince Edward Island
Effective April 1, 2013, the maximum allowable dispensing fee increased from $11.65 to $12.00. The maximum allowable extemporaneous (compounding) fee was 1.5 times the maximum allowable dispensing fee to a maximum of $18. The private nursing home capitation fee is $73.55.
Newfoundland and Labrador
The dispensing fee schedule for the Foundation Plan, Access Plan, and Assurance Plan from April 1, 2013, to March 31, 2014, was:
blank
| Drug cost |
Dispensing fee |
| $0–$49.99 |
$11.05 |
| $50.00–$249.99 |
$22.55 |
| $250.00 + |
$49.55 |
An extemporaneous preparations fee 1.5 times the dispensing fee was reimbursed for compound products. This applied to compounds that contain three or more ingredients.
The dispensing fee schedule for the 65Plus Plan from April 1, 2013, to March 31, 2014, was:
blank
| Drug cost |
Dispensing fee |
| $0.00–$249.99 |
$11.05 |
| $250.00 + |
$39.53 |
NIHB
Pharmacy reimbursement, which included dispensing fees, was determined by the NIHB or negotiated between the NIHB and pharmacists’ associations, and differed by province.
Appendix E: Prescription Cost for the Top 10 Generic Drugs
This appendix supplements the case study presented in Section 6 on generic atorvastatin, by reporting on the cost differentials across private plans and as compared to the Ontario public plan for the other top generic drugs reported in Table 2.1. As in the case of atorvastatin, less frequent dispensing resulted in lower prescription drug expenditures in private plans in 2013. Quebec private plans often spent double the amount reimbursed by the Ontario public plan.
Figure E.1 Ratio of private-to-Ontario public total retail drug cost* for 1 million tablets/capsules of top generic drugs, private plans, by province, 2013
Click on image for larger view
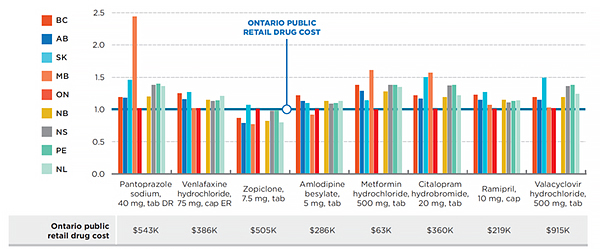
Figure description
This appendix supplements the case study presented in Section 6 on generic atorvastatin, by reporting on the cost differentials across private plans and as compared to the Ontario public plan for the other top generic drugs reported in Table 2.1
This bar graph illustrates the ratio of private-to-Ontario public total retail drug cost for 1 million tablets/capsules of top generic drugs in private plans by province, in 2013. The Ontario public retail drug cost is given as 1.0. Please note that the total retail drug cost includes the drug cost and markup, but excludes the dispensing cost.
| Top generic drugs |
British Columbia |
Alberta |
Saskatchewan |
Manitoba |
Ontario |
New Brunswick |
Nova Scotia |
Prince Edward Island |
Newfoundland |
| Pantoprazole sodium, 40 mg, tab DR |
1.19 |
1.18 |
1.46 |
2.44 |
1.02 |
1.20 |
1.38 |
1.40 |
1.36 |
| Venlafaxine hydrochloride, 75 mg, cap ER |
1.25 |
1.16 |
1.27 |
1.02 |
1.02 |
1.15 |
1.13 |
1.14 |
1.21 |
| Zopiclone, 7.5 mg, tab |
0.87 |
0.79 |
1.07 |
0.77 |
1.01 |
0.82 |
0.98 |
0.99 |
0.80 |
| Amlodipine besylate, 5 mg, tab |
1.22 |
1.13 |
1.10 |
0.92 |
1.01 |
1.13 |
1.09 |
1.10 |
1.13 |
| Metformin hydrochloride, 500 mg, tab |
1.38 |
1.29 |
1.14 |
1.61 |
1.00 |
1.28 |
1.38 |
1.38 |
1.35 |
| Citalopram hydrobromide, 20 mg, tab |
1.22 |
1.17 |
1.50 |
1.57 |
1.01 |
1.19 |
1.37 |
1.38 |
1.22 |
| Ramipril, 10 mg, cap |
1.23 |
1.15 |
1.27 |
1.07 |
1.01 |
1.15 |
1.11 |
1.13 |
1.14 |
| Valacyclovir hydrochloride, 500 mg, tab |
1.19 |
1.15 |
1.49 |
1.03 |
1.02 |
1.19 |
1.36 |
1.38 |
1.24 |
* Includes the drug cost and markup; excludes the dispensing cost.
Data source: IMS Brogan Private Pay Direct Drug Plan Database; National Prescription Drug Utilization Information System Database, Canadian Institute for Health Information.
Figure E.2 Ratio of private-to-Ontario public prescription* cost for 1 million tablets/capsules of top generic drugs, private plans, by province, 2013
Click on image for larger view
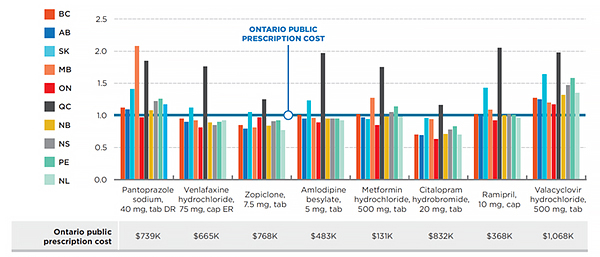
Figure description
This bar graph illustrates the ratio of private-to-Ontario public total retail drug cost for 1 million tablets/capsules of top generic drugs in private plans by province, in 2013. The Ontario public retail drug cost is given as 1.0. Please note that the total retail drug cost includes the drug cost, markup and dispensing cost.
| Top generic drugs |
British Columbia |
Alberta |
Saskatchewan |
Manitoba |
Ontario |
Quebec |
New Brunswick |
Nova Scotia |
Prince Edward Island |
Newfoundland |
| Pantoprazole sodium, 40 mg, tab DR |
1.12 |
1.09 |
1.41 |
2.08 |
0.97 |
1.85 |
1.08 |
1.22 |
1.26 |
1.17 |
| Venlafaxine hydrochloride, 75 mg, cap ER |
0.95 |
0.90 |
1.12 |
0.92 |
0.81 |
1.76 |
0.89 |
0.85 |
0.90 |
0.92 |
| Zopiclone, 7.5 mg, tab |
0.85 |
0.79 |
1.05 |
0.81 |
0.97 |
1.25 |
0.84 |
0.91 |
0.92 |
0.77 |
| Amlodipine besylate, 5 mg, tab |
1.01 |
0.95 |
1.23 |
0.96 |
0.89 |
1.97 |
0.95 |
0.95 |
0.95 |
0.92 |
| Metformin hydrochloride, 500 mg, tab |
1.02 |
0.97 |
0.94 |
1.27 |
0.85 |
1.75 |
0.98 |
1.05 |
1.14 |
0.98 |
| Citalopram hydrobromide, 20 mg, tab |
0.70 |
0.69 |
0.96 |
0.94 |
0.63 |
1.16 |
0.71 |
0.78 |
0.83 |
0.70 |
| Ramipril, 10 mg, cap |
1.02 |
1.00 |
1.43 |
1.09 |
0.92 |
2.05 |
1.00 |
1.02 |
1.01 |
0.96 |
| Valacyclovir hydrochloride, 500 mg, tab |
1.27 |
1.25 |
1.64 |
1.20 |
1.17 |
1.98 |
1.32 |
1.47 |
1.58 |
1.35 |
* Composed of the drug cost, markup and dispensing cost.
Data source: IMS Brogan Private Pay Direct Drug Plan Database; National Prescription Drug Utilization Information System Database, Canadian Institute for Health Information.