Generic Drugs in Canadian Private Plans, 2005–2013
The drug expenditure landscape in Canada has been shaped in recent years by significant developments in the generic market, as many blockbuster drugs lost patent protection and several provinces implemented more targeted drug pricing policies.
This upcoming NPDUIS report assesses the changing landscape from the perspective of private drug plans by providing insight into the generic rates of use and price levels. A comparative analysis with Canadian public drug plans, as well as international markets, is also included in the report.
This analysis provides comparative pricing and utilization information that may highlight possible future cost savings and efficiency opportunities in the private market.
Key Findings
1. While the market share for generics has increased in private plans in recent years, in 2013 it was lower in private (55%) than in public markets (68%). Private plans in Quebec had the lowest market share (50%) for generic drugs amongst all the private and public plans analyzed.
, 2013.jpg)
Generics market share in Canadian private and public plans (prescriptions), 2013
This pie chart gives the market share for generic drugs in Canadian private and public drug plans: national private plans: 55%; select public drug plans reporting data to NPDUIS: 68%.
2. Canada had the third highest generic market share (68%) when compared to seven foreign markets in the first quarter of 2013. Only Germany (72%) and the US (70%) had higher rates of generic penetration.
, q1-2013.jpg)
International generics market share ‡ (physical units), Q1-2013
This bar graph gives the Canadian and international generic market share in physical units for Q1-2013. Canada: 68%; France: 51%; Germany: 72%; Italy: 51%; Sweden: 54%; Switzerland: 43%; UK: 65%; US: 70%.
3. The example of atorvastatin highlights that some of the differences in generic capture rates between private and public markets are explained by the lower rate of use of multi-source drugs in private plans.
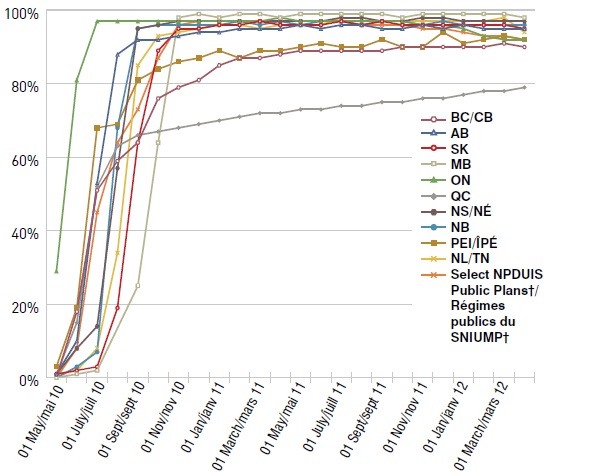
Market uptake for generic atorvastatin
This line graph gives the market uptake for generic atorvastatin over a two-year period in select public drug plans in Canada. The generic first became available in May 2010.
Market uptake for generic atorvastatin
|
01-May-10 |
01-Jul-10 |
01-Sep-10 |
01-Nov-10 |
01-Jan-11 |
01-Mar-11 |
01-May-11 |
01-Jul-11 |
01-Sep-11 |
01-Nov-11 |
01-Jan-12 |
01-Feb-12 |
01-Mar-12 |
| BC |
0% |
51% |
64% |
79% |
85% |
87% |
89% |
89% |
89% |
90% |
90% |
90% |
91% |
| AB |
1% |
53% |
92% |
93% |
94% |
95% |
96% |
96% |
95% |
96% |
96% |
95% |
95% |
| SK |
1% |
3% |
64% |
95% |
96% |
97% |
96% |
97% |
97% |
96% |
96% |
96% |
96% |
| MB |
0% |
2% |
25% |
98% |
98% |
99% |
99% |
99% |
99% |
99% |
99% |
99% |
99% |
| ON |
29% |
97% |
97% |
97% |
97% |
97% |
97% |
97% |
97% |
96% |
95% |
93% |
92% |
| QC |
1% |
52% |
66% |
68% |
70% |
72% |
73% |
74% |
75% |
76% |
77% |
78% |
78% |
| NS |
1% |
14% |
95% |
97% |
97% |
97% |
97% |
98% |
97% |
98% |
97% |
97% |
97% |
| NB |
0% |
7% |
95% |
96% |
96% |
96% |
96% |
97% |
97% |
96% |
96% |
96% |
96% |
| PEI |
3% |
68% |
81% |
86% |
89% |
89% |
90% |
90% |
92% |
90% |
91% |
92% |
93% |
| NL |
0% |
8% |
85% |
94% |
96% |
95% |
96% |
98% |
97% |
97% |
97% |
97% |
98% |
| All plans |
0% |
45% |
73% |
96% |
97% |
97% |
97% |
97% |
96% |
95% |
94% |
93% |
93% |
4. Generic unit costs reimbursed by private plans have decreased in recent years following the provincial generic pricing policies. Nonetheless, the average retail drug costs (including pharmacy markups) were markedly higher in 2013 in private markets compared to several public plans (AB,NB, NS, PEI).
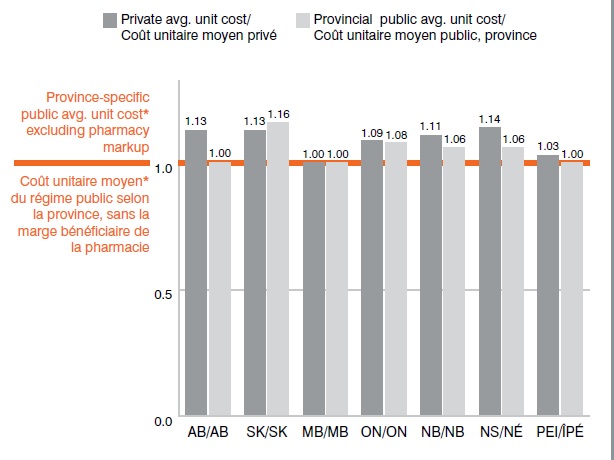
Ratio of private*-to-public† average retail unit cost, 2013
This bar graph provides the ratios of the average retail unit drug costs (including pharmacy markup) reimbursed by private and public plans in Canada compared to the province-specific public average unit cost (excluding pharmacy markup), which is set to 1. AB – private: 1.13, public: 1.00; SK - private: 1.13, public 1.16; MB - private: 1.00, public: 1.00; ON - private: 1.09, public: 1.08; NB – private: 1.11, public: 1.06; NS – private: 1.14, public: 1.06; PEI – private: 1.03, public: 1.00.
5. The privately reimbursed prescription cost including the dispensing fee was lower in private than in public plans for the dispensing of any given quantity of drugs. More units of a drug were generally dispensed per prescription in private markets, resulting in a diluted fee per unit of drug dispensed and consequently a lower average prescription cost.
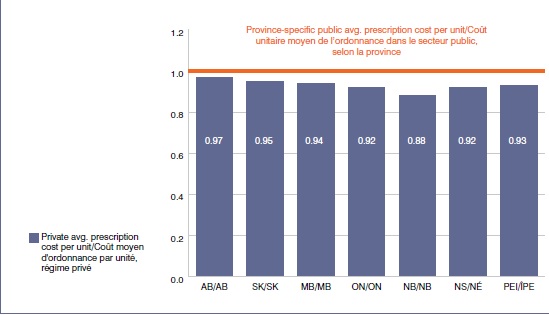
Ratio of private*-to-public† average prescription cost per unit (including dispensing fee), 2013
This bar graph gives the ratio of private-to-public average prescription costs per unit (including the pharmacy markup and dispensing fee) in 2013. The province-specific public average prescription cost per unit is set to 1. The private relative average prescription cost per unit is as follows: AB: 0.97; SK: 0.95; MB: 0.94; ON: 0.92; NB: 0.88; NS: 0.92; PEI: 0.93.
6. Private plans in Quebec reimburse the highest average prescription cost per unit for generic drugs, with levels, on average, 51% higher than in the Ontario public plan.
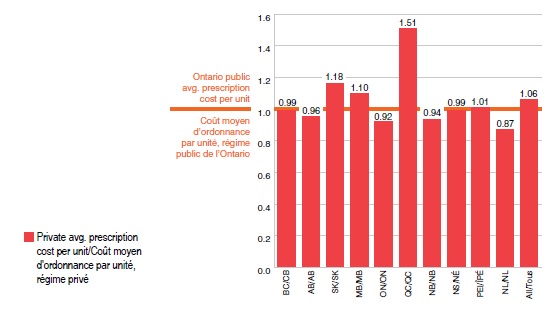
Ratio of private*-to-Ontario† average prescription cost per unit, 2013
This bar graph gives the ratio of private-to-Ontario public average prescription costs per unit in 2013.The Ontario public average prescription cost per unit is set to 1. The private relative average prescription cost per unit is as follows: BC: 0.99; AB: 0.96; SK: 1.18; MB: 1.10; ON: 0.92; QC: 1.51; NB: 0.94; NS: 0.99; PEI: 1.01; NL: 0.87; All: 1.06
Notes: Cost refers to drug cost and includes pharmacy markups but excludes dispensing fees. Prescription cost includes the drug cost and dispensing fee.
Data Sources:
- * Canadian Private Drug Plans Database
- † NPDUIS Database, Canadian Institute for Health Information
- ‡ IMS AG MIDAS™ Database
NPDUIS is a research initiative that operates independently of the regulatory activities of the PMPRB.