Médicaments génériques au Canada, 2013
Le prix des médicaments génériques au Canada constitue un enjeu important pour les gestionnaires de régimes d’assurance-médicaments, les stratèges et les consommateurs. Pour informer les intervenants et contribuer à l’élaboration de politiques qui ont une incidence sur l’établissement des prix des médicaments génériques, le Conseil d’examen du prix des médicaments brevetés (CEPMB) analyse périodiquement les prix et les marchés des médicaments génériques au Canada, en fait rapport et les compare à ceux qui sont pratiqués dans d’autres pays industrialisés. Médicaments génériques au Canada, 2013 constitue le plus récent rapport du CEPMB sur les médicaments génériques.
Depuis 2010, les gouvernements provinciaux appliquent des politiques de réduction des prix des médicaments génériques. Les gouvernements provinciaux et territoriaux collaborent actuellement à une Alliance pancanadienne pharmaceutique (antérieurement connue sous le nom de Processus compétitif d’appel d’offres provincial et territorial visant les médicaments Génériques) qui préparera le terrain pour d’autres réductions de prix. Médicaments génériques au Canada, 2013 présente les premières retombées des politiques d’établissement des prix des médicaments génériques et établit le point de repère pour les niveaux des prix des médicaments génériques au Canada avant que le Processus compétitif d’appel d’offres provincial et territorial visant les médicaments génériques entre complètement en vigueur, d’ici à avril 2016.
Résultats clés
Les prix des médicaments génériques ont diminué comparativement à ceux des médicaments de marque
Au Canada, la moyenne des prix canadiens des médicaments génériques est tombée de 56 % de celle des produits de marque en 2011 à 39 % en 2013 à la suite de modifications des politiques provinciales sur le remboursement.
Les prix pratiqués en Ontario au deuxième trimestre de 2013 reflètent plus fidèlement l’évolution des politiques canadiennes sur les médicaments génériques, dont les prix atteignent 31 % de ceux des médicaments de marque. Ce résultat reflète les baisses de prix découlant de la première phase du Processus compétitif d’appel d’offres provincial et territorial visant les médicaments génériques.
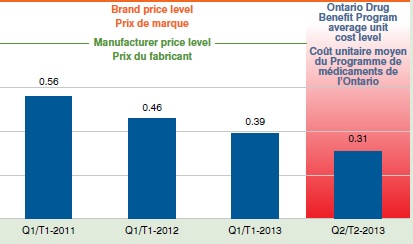
Prix moyen des médicaments génériques par rapport aux médicaments de marque, Canada
Le diagramme à bandes met en comparaison les prix moyens des médicaments génériques au Canada et en Ontario par rapport aux prix des médicaments de marque. Au Canada : les prix des médicaments génériques au T1-2011 représentaient 0,56 des prix de marque; au T1-2012 0,46; au T1-2013 0,39. En Ontario : T2-2013 0,31.
Comparativement aux prix étrangers, les médicaments génériques coûtaient encore plus cher au Canada au T1-2013
Même si les prix canadiens des médicaments génériques ont diminué considérablement au cours des dernières années, ils demeurent beaucoup plus élevés que les prix étrangers.
En 2011, les médicaments génériques coûtaient en moyenne 35 % moins cher à l’étranger qu’au Canada. En 2013, ils coûtaient toujours 32 % moins cher.
Les changements des prix étrangers, ainsi que les fluctuations des taux de change, peuvent expliquer ces constatations.
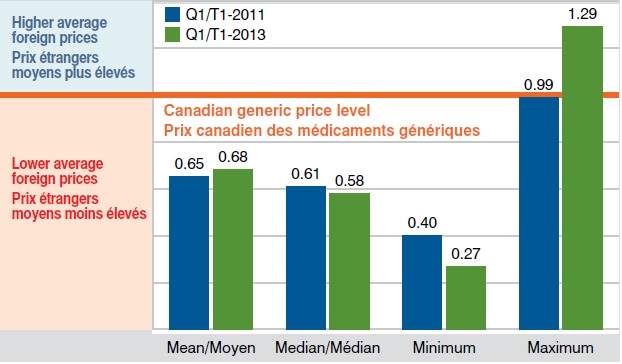
Prix étranger moyen des médicaments génériques par rapport au prix canadien, T1-2011 et T1-2013
Le diagramme à bandes met en comparaison les prix moyens internationaux des médicaments génériques par rapport aux prix canadiens au T1-2011 et au T1-2013. Prix internationaux au T1-2011 : moyenne – 0,65; médiane – 0,61; minimum – 0,40; maximum 0,99. Prix internationaux au T1-2013: moyenne – 0,68; médiane – 0,58; minimum – 0.27; maximum – 1,29.
L’écart entre les prix étrangers et canadiens était plus important dans le cas des molécules dont les fournisseurs sont plus nombreux
Les écarts entre les prix sont particulièrement marqués sur les marchés qui comptent six fournisseurs ou plus, les prix moyens pratiqués à l’étranger étant inférieurs de 38 % à ceux qui ont cours au Canada. On observe un rapprochement des prix étrangers et des prix canadiens sur les marchés qui comptent moins de fournisseurs, les prix étrangers moyens dépassant de 3% ceux du Canada pour les médicaments comptant trois à cinq fournisseurs et présentant un écart favorable de 39 % au Canada pour les médicaments comptant un à deux fournisseurs.
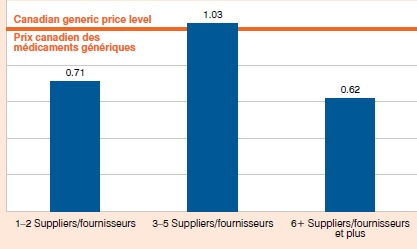
Ratios moyens des prix étrangers par rapport aux prix canadiens des médicaments génériques, selon le nombre de fournisseurs,�T1-2013
Le diagramme à bandes met en comparaison les ratios moyens des prix étrangers par rapport aux prix canadiens des médicaments génériques selon le nombre de fournisseurs. 1 à 2 fournisseurs : 0,71; 3 à 5 fournisseurs : 1,03; 6 fournisseurs et plus : 0,62.
Les prix en Ontario referment l'écart par rapport aux prix étrangers, T2-2013
Comparativement à ce qui se passe à l’étranger, l’écart des prix était moins marqué, les prix étrangers moyens s’établissant à 25 % de moins qu’en Ontario.
Ces résultats ne saisissent pas l’effet complet du Processus compétitif d’appel d’offres provincial et territorial visant les médicaments génériques.
L’analyse reflète toutefois les politiques qui ont réduit à un maximum de 25 % et 18 % pour six des médicaments génériques les plus courants les prix des médicaments génériques par rapport à ceux des médicaments de marque de référence dans le cas de la plupart des médicaments.
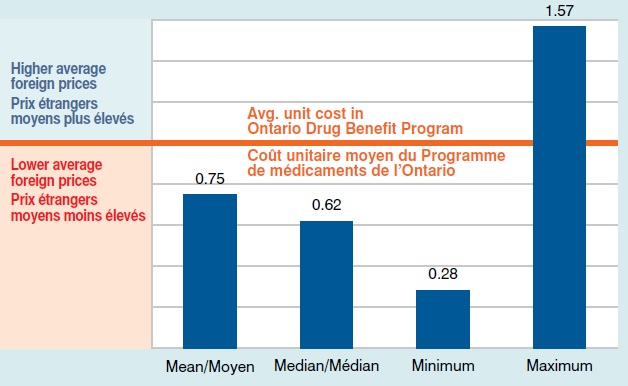
Prix étranger moyen des médicaments génériques par rapport à ceux de l’Ontario, T2-2013
Le diagramme à bandes met en comparaison les prix internationaux moyens des médicaments génériques par rapport aux prix en Ontario au T2-2013. Prix internationaux : moyenne – 0,75; médiane – 0,62; minimum – 0,28; maximum – 1,57.
Méthodes : L’analyse compare les prix départ-usine de 2013 de 487 médicaments génériques de premier plan au Canada aux prix étrangers des mêmes médicaments. Les principaux marchés étrangers étudiés étaient les suivants : France, Allemagne, Italie, Suède, Suisse, Royaume-Uni et États-Unis.
Sources de données : Les données proviennent de la base de données MIDASMC, d’IMS AG (tous droits réservés) dans le cas des prix canadiens et étrangers des médicaments génériques et des médicaments de marque. Les données sur le Programme de médicaments de l’Ontario proviennent de la base de données du SNIUMP de l’ICIS.
Limites : Il importe de tenir compte des différences aux niveaux de la réglementation, des méthodes de mise en marché et des politiques de remboursement lorsqu’il s’agit d’interpréter des comparaisons de prix étrangers.
Le SNIUMP est une initiative de recherche qui fonctionne indépendamment des activités de réglementation du CEPMB.