December 2014
PDF Version
ISBN: 978-1-100-25453-1
Cat No.: H82-18/2014E-PDF
Executive Summary
This analytical report compares the 2013 generic drug prices and markets in Canada with those of other industrialized countries. It updates previous NPDUIS research (PMPRB 2013), highlighting the changes in Canadian generic pricing that have taken place since 2011.
The analysis covers a set of 487 leading generic drugs – accounting for 79.1% of all Canadian generic manufacturer-level sales ($902.8 million) in the first quarter of 2013 – broken down by market segment and at molecule level. Price comparisons were conducted using generic prices from IMS AG’s MIDAS™ database and the average unit cost reimbursed by the Ontario Drug Benefit Program, as reported in the National Prescription Drug Utilization Information System, Canadian Institute for Health Information database.
International multilateral price comparisons encompass the seven countries the PMPRB considers in reviewing and reporting on the prices of patented drug products: France, Germany, Italy, Sweden, Switzerland, the United Kingdom and the United States. Four other countries are also included in the bilateral price comparisons: the Netherlands, Spain, Australia and New Zealand.
Since 2010, most provincial governments have implemented generic pricing policies which have reduced the price of generic drugs in Canada and have resulted in important cost savings. Provincial and territorial governments are collaborating on a pan-Canadian Generic Value Price Initiative, which sets the stage for further price decreases, including reducing 18 generic drugs to 18% of the brand reference price by April 1, 2016. The creation of a new pricing framework for new generic drugs entering the market is expected to result in lower prices over time for the entire suite of generic drugs.
The full impact of these price changes is not reflected in this analysis due to the timeframe examined; however, important trends do emerge. In particular, the results of the reimbursed average cost in Ontario in the second quarter of 2013 reflect the policies that reduced the generic price relative to the reference brand price for most drugs to a maximum of 25% and 18% for six of the most common generic drugs (The Council of the Federation). The Ontario findings are reflective of the early impacts of the Value Price Initiative.
Key findings
- Canadian manufacturer prices for generic drugs have fallen markedly relative to their branded counterparts in recent years, with reductions in the relative price levels ranging from 56% of the brand price in the first quarter of 2011 to 39% in the first quarter of 2013. The more recent Ontario data, based on the second quarter of 2013, reveals an even larger difference, with generic prices at 31% of the branded drug price level.
- The domestic price reductions that took effect prior to the second quarter of 2013 resulted in modest improvements in the Canadian generic prices relative to international levels. While in 2011 the mean international prices were 35% lower than in Canada, by 2013 they were 32% lower. Changes in international generic price levels as well as exchange rate variations may explain these findings.
- To more accurately reflect the evolving domestic generic policies, the Ontario prices in the second quarter of 2013, were also compared to international levels. The price differential was less pronounced in this case, with mean international prices 25% lower than in Ontario.
- The results based on Ontario prices in the second quarter of 2013 do not capture the full impact of the Value Price Initiative. The analysis does, however, reflect the policies that reduced the generic prices relative to the reference brand price for most drugs to a maximum of 25% and 18% for six of the most common generic drugs. The Ontario results suggest that the pan-Canadian Generic Value Price Initiative has the potential to reduce the gap between Canadian and international prices in the future.
- The gap between foreign and Canadian prices was wider for molecules with higher sales. The price differences were especially pronounced for drugs with estimated annual sales in Canada of $10 million or more, with the mean international prices 39% lower than in Canada. These markets account for more than two-thirds (68.5%) of generic sales.
- Surprisingly, the gap between foreign and Canadian prices was the widest for drugs with substantial number of suppliers competing in the Canadian marketplace. The price differences are particularly pronounced in markets with six or more suppliers, with mean international prices 38% lower than in Canada. A closer alignment of foreign-to-Canadian prices is observed in markets with fewer suppliers, with mean international prices 3% higher than in Canada for drugs with three to five suppliers and 39% lower than in Canada for drugs with one to two suppliers.
It is important to note that differences in regulations, marketing practices and reimbursement policies pose challenges when interpreting international price comparisons.
PMPRB. 2013. Analytical Snapshot: International Generic Price Comparison, Early 2011. Available at: http://www.pmprb-cepmb.gc.ca/view.asp?ccid=487 (Accessed December 1, 2014).
About the PMPRB
The Patented Medicine Prices Review Board (PMPRB) is an independent quasi-judicial body established by Parliament in 1987.
The PMPRB has a dual role: to ensure that prices at which patentees sell their patented medicines in Canada are not excessive; and to report on pharmaceutical trends of all medicines and on research and development (R&D) spending by patentees.
The PMPRB reports annually to Parliament, through the Minister of Health, on its activities, on pharmaceutical trends relating to all medicines, and on R&D spending by patentees.
The NPDUIS Initiative
The National Prescription Drug Utilization Information System (NPDUIS) provides critical analyses of drug price, utilization, and cost trends in Canada to support drug plan policy decision-making for participating federal, provincial, and territorial governments.
The NPDUIS initiative is a partnership between the PMPRB and the Canadian Institute for Health Information (CIHI). It was established in 2001 by the federal, provincial and territorial Ministers of Health.
Acknowledgements
This report was prepared by the Patented Medicine Prices Review Board (PMPRB) as part of the National Prescription Drug Utilization Information System (NPDUIS).
The PMPRB would like to acknowledge the contributions of:
- The members of the NPDUIS Advisory Committee, for their expert oversight and guidance in the preparation of this report.
- The PMPRB NPDUIS staff and for their contribution to the analytical content of the report:
- Orlando Manti – Senior Economist
- Tanya Potashnik – Director Policy and Economic Analysis
- Elena Lungu – Manager NPDUIS
- Gary Warwick – Senior Economic Analyst
- The PMPRB scientific and editing groups
- Council of the Federation’s Health Care Innovation Working Group (HCIWG)
Disclaimer
NPDUIS is a research initiative that operates independently of the regulatory activities of the Board of the PMPRB. The statements and opinions expressed in this NPDUIS report do not represent the official position of the PMPRB.
Parts of this material are based on data and information provided by the Canadian Institute for Health Information (CIHI). However, the analyses, conclusions and/or statements expressed herein are not necessarily those of CIHI.
Although based in part on data obtained under license from the MIDAS™ database, the statements, findings, conclusions, views and opinions expressed in this report are exclusively those of the PMPRB and are not attributable to IMS AG.
Introduction
The National Prescription Drug Utilization Information System (NPDUIS) is a research initiative created by the provincial and federal Ministers of Health and is a partnership between the Patented Medicine Prices Review Board (PMPRB) and the Canadian Institute for Health Information (CIHI). Through the NPDUIS initiative, the PMPRB provides critical analyses of price, utilization and cost trends in support of policy decisions and to inform stakeholders on pharmaceutical trends.
In previous NPDUIS reports, trends in generic prices in Canada were monitored with an emphasis on international generic price comparisons (PMPRB 2010a, 2010b, 2011, 2013). This research area continues to be of interest in the context of recent Canadian generic pricing policy decisions.
Since 2010, many provincial governments have implemented, and continue to implement, generic pricing policies resulting in significant price reductions and cost savings. As a result, prices of generic drugs have been reduced to levels ranging between 25% and 35% of brand name prices. Furthermore, through the Council of the FederationFootnote 1, the prices of 10 commonly used generic drugs have been reduced in recent years to 18% of brand prices. Appendix C provides a summary of the recent provincial pricing policies for generic drugs.
International generic price comparisons allow for a relative assessment of domestic price levels and inform policy discussions. This analytical report provides an update to previous NPDUIS research that compared the generic drug prices and markets in Canada with those of other industrialized countries. It also highlights the changes in Canadian generic pricing that occurred between 2011 (the last period reported in a previous NPDUIS publication (PMPRB 2013)) and the first and second quarters of 2013.
A brief overview is given of the generic market structure in Canada and in comparator countries with a focus on market concentration (Section 1). The report includes a trend analysis explaining how generic prices have evolved in Canada in recent years relative to the branded product levels (Section 2). Most importantly, highlights of foreign-to-Canadian price differentials for a variety of bilateral and multilateral measures of foreign price are provided for the first quarter of 2013 (Section 3). Further insight into these differentials is provided through a market segmentation and molecule level analysis (Section 4). Finally, the report compares foreign generic prices with those available in Ontario in the second quarter of 2013, which were some of the lowest in Canada and more fully capture the recent generic pricing policies (Section 5).
What follows is a description of the methods used to calculate the statistics available in this report, the drugs covered in the results, and the limitations of the analysis.
Methods
The data source for the Canadian and international generic and brand prices was the MIDAS™, IMS AG All Rights Reserved, for the first quarter of 2013 (Q1-2013). The data source for the Ontario Drug Benefit Program was the National Prescription Drug Utilization Information System, Canadian Institute for Health Information database (NPDUIS, CIHI) for the second quarter of 2013 (Q2-2013).
The Canadian and international prices reported in IMS AG’s MIDAS™ database are manufacturer prices and reflect all sales to the pharmacy sector. These are average prices for all generic versions of a drug, encompassing all generic trade names available in a particular country. Market spot exchange rates were used to convert foreign currency prices into their Canadian dollar equivalents. Note that all Canadian and foreign prices considered are ex-factory prices.
The average unit costs reimbursed by the Ontario Drug Benefit Program reflect the Drug Benefit Price (DBP). The DBP is published on the Ontario Ministry of Health and Long-Term Care website and excludes the markup, the dispensing fee, and any applicable compounding fees. The average unit costs do not contain any pharmacy distribution and inventory carrying costs. These are paid by the ministry under the 8% markup on the DBP, in accordance with the Regulation under the Ontario Drug Benefit Act, 1990.
The international price comparisons reported encompass 11 foreign reference countries. These include the seven countries – France, Germany, Italy, Sweden, Switzerland, the United Kingdom and the United States – the PMPRB considers in reviewing and reporting on the prices of patented drug products (“PMPRB-7”). This base group has been extended to include four other countries – the Netherlands, Spain, Australia and New Zealand – whose pharmaceutical markets are comparable in scale to Canada’s. These countries were included in previous PMPRB studies (PMPRB 2010a, 2010b, 2013). Appendix E provides results using all countries in the Organisation for Economic Co-operation and Development (OECD).
Key results reported in this study take the form of average foreign-to-Canadian and foreign-to-Ontario price ratios. They are calculated for a variety of bilateral and multilateral measures of foreign price. The bilateral price ratio provides a head-to-head comparison of prices in a particular country to prices available in Canada and in the Ontario Drug Benefit Program. The multilateral price ratios report the minimum, mean, median and maximum prices available in the foreign markets analyzed. These are Canadian sales-weighted arithmetic averages of the corresponding foreign-to-Canadian price ratios for individual drugs. Appendix G provides a mathematical description of how average foreign-to-Canadian price ratios are calculated.
Additional methodological notes are provided in Appendix A.
Generic Drugs Covered
The results are based on retail sales only and exclude hospital salesFootnote 2.
The analysis covers oral solid prescription drugs with estimated annual Canadian generic sales of at least $1 million in 2013.
The analysis is restricted to “mature markets”, which refer to generic drugs that have been on the market for at least one year. This restriction was imposed to exclude newly genericized drugs where market structure and the extent of market competition are still in flux, and generic prices may not yet have reached their long-run levels. Appendix F provides a sensitivity analysis by removing the “mature market” restriction.
The main analysis covers a set of 487 leading generic drugs in Canada with available prices in foreign markets. These drugs accounted for Canadian generic ex-factory sales of $902.8 million in Q1-2013, representing about 79.1% of all generic ex-factory sales.
Summary Table: All generic drugs in Canada versus generic drugs covered, Q1-2013
|
Number of drugs |
Ex-factory sales ($millions) |
Retail sales ($millions) |
| All generic drugs |
1,064 |
$1,141.6 |
$1,543.9 |
| Generic drugs covered |
487 |
$902.8 |
$1,221.1 |
| Share of generic drugs covered |
45.8% |
79.1% |
79.1% |
Definitions
In this report the term “drug” refers to any unique combination of active ingredient, strength and form. Except where manufacturer detail is required for the analysis, all calculations were first performed at the level of individual drugs. Calculations were then aggregated to produce the statistics reported.
The term “product” refers to a version of a drug sold by a particular manufacturer.
The term “molecule” refers to the active ingredient a drug contains, and encompasses all related strengths and formulations.
A “generic” product is sold under the name of its active ingredient and is classified according to the IMS definition of a generic/non-generic product. A “branded” product is one sold under a particular trade name.
Results are sometimes reported by “major therapeutic class”. This analysis uses the IMS AG’s own Anatomical Therapeutic Classification (ATC)Footnote 3 at level 1, which relates to the anatomical system on which the drugs act. This classification has been developed jointly by the Pharmaceutical Business Intelligence and Research Group (PBIRG) and European Pharmaceutical Market Research Association (EphMRA).
Limitations
The data reported in this study represents a snapshot in time. Prices are reported for the first quarter of 2013 for the foreign-to-Canadian price comparisons and for the second quarter of 2013 for the foreign-to-Ontario price comparisons. Since then, additional generic pricing policies have been implemented which are not fully reflected in the results (Appendix C). Although the full impact of the recent provincial pricing policies is not captured, significant trends do emerge.
The international prices available in IMS AG’s MIDAS™ database are estimated factory-gate prices. They do not capture off-invoice price rebates and allowances, which manufacturers may provide to retailers to stock their interchangeable products (Competition Bureau 2008). Consequently, the prices reported do not necessarily reflect the net revenue to manufacturers.
The analysis reports the estimated manufacturer prices. These prices may be different from other price points in the distribution chain, such as wholesaler or pharmacy retail prices. Therefore, the reported prices may not reflect the prices the consumer paid or what public and private plans reimbursed.
The methodology that MIDAS™ uses for estimating drug prices varies by country. It depends on the distribution system and the availability of public data at various points in the distribution chain. This data includes the manufacturer´s price, the wholesale price, and the pharmacy price in specific markets. Depending on the country, manufacturer, wholesale or retail prices may represent estimates based on assumed regulated margins and/or markups.
Generic prices reported for the Canadian marketplace reflect a mixture of varying provincial generic pricing policies and the timing of implementation of these policies. They also reflect the generic prices paid by private insurers and persons paying out-of-pocket. Variations in distribution, reimbursement and marketing practices may be relevant to consider in inter-jurisdictional price comparisons.
The foreign-to-Ontario price comparisons compare the average unit cost in the Ontario Drug Benefit Program. At the time of the analysis, the Ontario Drug Benefit Program reimbursed some of the lowest generic prices in Canada. Lower prices may be available domestically and internationally for certain market segments (e.g., public or private purchasers).
The reporting focuses on “mature markets” with established generic competition. The analysis is limited to drugs that have been on the market for at least one year. Therefore, the results do not reflect newly launched generic drugs. Appendix F analyzes the effect of removing the “mature market” restriction.
Some observers of Canadian pharmaceutical markets have suggested that Canada’s relatively high prices encourage earlier introduction of new generic drugs. Further, cost savings generated by earlier introduction may be sufficient to offset the effects of higher Canadian prices. These matters are beyond the scope of the present analysis. In addition, this analysis does not attempt to capture the impact and/or savings that may be associated with specific policies aimed at encouraging early generic drug launches in Canada or internationally.
1 Generic Market Structure: Canada and Comparator Countries
Previous PMPRB studies concluded that markets for generic drugs tend to be highly concentrated with regard to sales both in Canada and other major markets (PMPRB 2010a, 2010b). This remained the case in 2013. Table 1.1 provides various measures of sales concentration, calculated as averages across generic markets. The left-most column of the table shows the average number of suppliers in a typical generic market of the indicated country. The remaining columns give the average share of sales accounted for by the largest (CR-1), the two largest (CR-4) and the four largest (CR-4) suppliers.
The results suggest that sales in generic markets are highly concentrated among a small number of suppliers in all countries. In 2013 in Canada, the CR-2 values state that the two leading suppliers in a typical generic market accounted for 81.4% of sales, while CR-4 values show the four leading firms accounted for 93.8% of sales, on average. Overall market concentration in Canada was in line with other countries. These results are consistent with those reported in earlier PMPRB studies.
Table 1.1. Market concentration statistics, Canada and PMPRB-7* comparator countries, Q1-2013
*France, Germany, Italy, Sweden, Switzerland, the United Kingdom and the United States.
Note: Results are based on 487 generic drugs, identified at ingredient, strength and form levels.
Source: MIDAS™, January–March 2013, IMS AG All Rights Reserved. |
|
Average number of suppliers |
Average one-firm concentration ratio CR-1 (%) |
Average two-firm concentration ratio CR-2 (%) |
Average four-firm concentration ratio CR-4 (%) |
| Canada |
5.3 |
64.2 |
81.4 |
93.8 |
| Switzerland |
3.7 |
72.9 |
89.9 |
98.1 |
| Germany |
9.3 |
58.5 |
78.9 |
93.0 |
| France |
7.5 |
52.1 |
72.5 |
89.4 |
| United Kingdom |
1.7 |
96.3 |
99.0 |
99.9 |
| Italy |
9.2 |
57.3 |
73.7 |
87.3 |
| Sweden |
4.5 |
66.5 |
87.5 |
98.4 |
| United States |
7.8 |
58.1 |
80.4 |
96.2 |
2 Generic-to-Brand Price Comparisons
This section compares the prices of generic and branded drug products in Canada and comparator markets.
Figure 2.1 shows the evolution of Canadian generic-to-brand price ratios from 2011 to 2013. The “unweighted average ratios” shown here are simple averages of product-level ratios taken across all drugs in the sample. The “weighted average ratios” are sales-weighted averages of product-level ratios, with weights based on the Canadian generic sales in the indicated year. The figure also includes results based on the average unit cost reimbursed by Ontario in Q2-2013.
The results suggest that Canadian generic prices have fallen markedly in recent years relative to their branded counterparts. The price of a typical Canadian generic was 64% (unweighted ratio) of the corresponding price of the branded product in Q1-2011. This fell to 49% by Q1-2013. The decline is even more pronounced when sales-weighting is applied, from 56% to 39% in Q1-2011 and Q1-2013, respectively. This suggests that the reduction was more pronounced in drugs with higher sales.
In Ontario, the gap between brand and generic prices was even wider in Q2-2013, with generic prices at 31% of the branded drug price level.
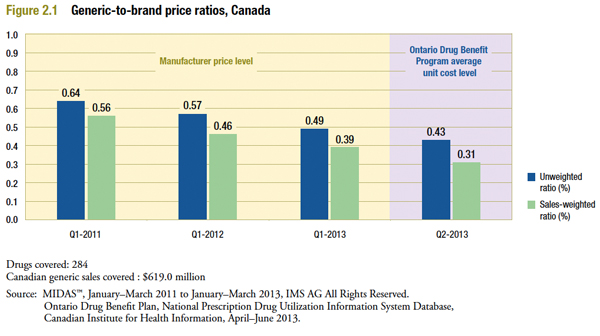
Figure 2.2 provides more detail on the Canadian generic-to-brand price ratios for 2013, in the form of a range distribution. This divides the 284 drugs for which generic-to-brand price ratios could be calculated into classes based on the size of the ratio. For example, it indicates that in 184 instances, the generic price was between 25% and 50% of the corresponding brand price, with these 184 drugs accounting for 64.8% of all drugs and 79.9% of all sales.
The results confirm that the decline in generic-to-brand price ratios reported above is broadly based. Ratios for almost two-thirds of drugs fall into the 25% to 50% range, with these drugs accounting for nearly 80% of Canadian generic sales in the sample. There remain many instances where generic price is at least 75% of branded price. However, these are typically small-market drugs that collectively accounted for 7.9% of Canadian generic sales in Q1-2013.
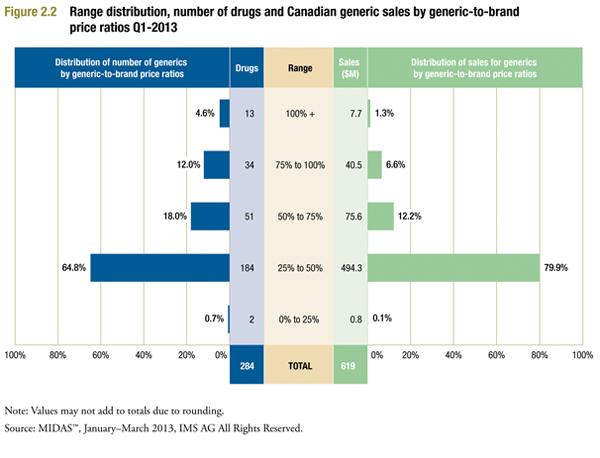
Table 2.1 compares Q1-2013 Canadian generic-to-brand ratios to those in other major markets. The table also reports the number of drugs covered and the Canadian generic sales covered ($million). Drug coverage here refers to the number of leading generic drugs, at ingredient strength and form level, with available prices for the corresponding branded products in the same market.
Canadian ratios appear broadly in line with those observed in Germany, Sweden and the United Kingdom, but appreciably less than those in France, Italy and Switzerland. Generic-to-brand ratios for the United States are in a class by themselves, and largely reflect the high prices of branded products in that market.
Table 2.1. Weighted and unweighted generic-to-brand price ratios, Canada and PMPRB-7* comparator countries, Q1-2013
*France, Germany, Italy, Sweden, Switzerland, the United Kingdom and the United States.
Source: MIDAS™, January–March 2011 and January–March 2013, IMS AG All Rights Reserved. |
| |
Canada |
France |
Germany |
Italy |
Sweden |
Switzerland |
United Kingdom |
United States |
| Unweighted ratio (%) |
0.49 |
0.71 |
0.57 |
0.67 |
0.52 |
0.77 |
0.58 |
0.15 |
| Sales-weighted ratio (%) |
0.39 |
0.66 |
0.35 |
0.64 |
0.34 |
0.73 |
0.33 |
0.09 |
| Drugs covered |
284 |
129 |
167 |
133 |
106 |
100 |
194 |
218 |
| Canadian generic sales covered ($million) |
619.0 |
227.4 |
347.2 |
366.2 |
281.5 |
217.3 |
445.5 |
422.9 |
3 Foreign-to-Canadian Generic Price Comparison
This section reports on the average foreign-to-Canadian price differentials calculated for a variety of bilateral and multilateral measures of foreign price. Appendix G describes how average foreign-to-Canadian price ratios are calculated.
Key results reported in this study take the form of average ratios. These are Canadian sales-weighted arithmetic averages of the corresponding foreign-to-Canadian price ratios for individual drugs, with sales weights based on patterns of Canadian generic sales.
The foreign-to-Canadian price differentials calculated in this way provide exact answers to questions such as:
“How much more or less would Canadians have paid for the generic drugs they purchased in 2013 had they paid prevailing international prices (multilateral measures) or prices in comparator country X (bilateral measures)?”
The Canadian generic price level is set to a value of 1. An average foreign-to-Canadian price ratio below or above 1 indicates a lower or higher average foreign price, respectively. Appendix B provides a definition of the measures reported.
More precisely, a foreign-to-Canadian ratio reported for comparator country X that is less (greater) than a value of 1 indicates Canadians would have paid less (more) for the “basket” of generic drugs they purchased in 2013 had they paid comparator country X prices. For example, a foreign-to-Canadian ratio of 0.75 indicates that spending on generics at comparator country X prices would have been 75% of what was actually spent at Canadian prices. In this respect, the average price ratios reported below provide a meaningful answer to the broader question:
“Are generic drugs more or less costly in Canada than in comparator country X?”
The next two figures provide multilateral foreign-to-Canadian ratios. They compare multi-comparator measures of foreign prices to corresponding Canadian prices. It is important to note that the multilateral price measures used here encompass only prices observed among the PMPRB-7 countries.
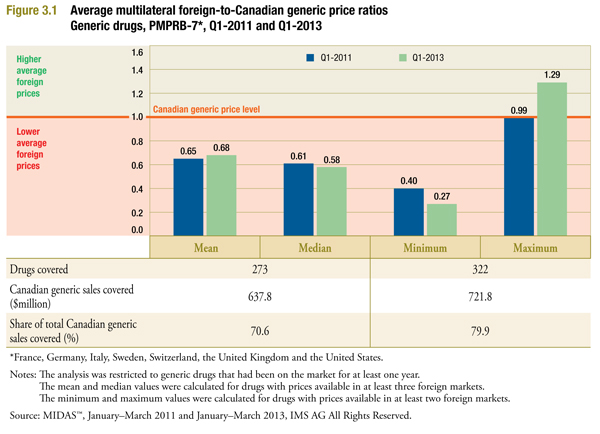
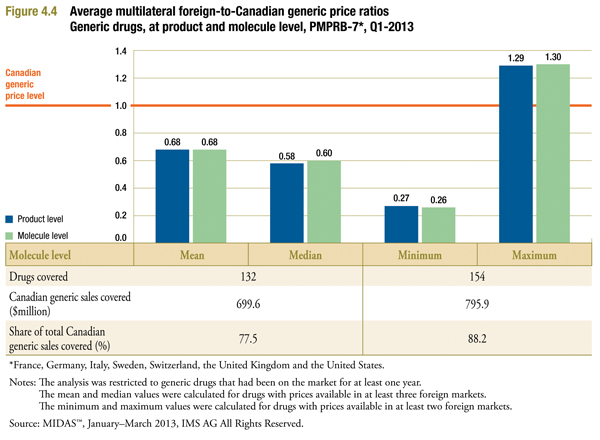
Figure 3.1 provides results for two multilateral measures of central tendency among foreign prices: the mean and the medianFootnote 4. Appendix B describes these measures and compares their properties. The figure also provides foreign-to-Canadian ratios where the minimum and the maximum foreign price are used as the comparator price.
The table accompanying the figure reports the number of drugs covered, the Canadian generic sales covered ($million), and the share of total Canadian generic sales covered (%). Drug coverage here refers to the number of leading generic drugs in Canada, at ingredient, strength and form level, with available prices in two or moreFootnote 5 foreign markets.
The results suggest that the domestic price reductions that took effect prior to the second quarter of 2013 resulted in modest improvements in the Canadian generic prices relative to international levels. In Q1-2013, the mean and median foreign prices were 0.68 and 0.58 of the generic price levels in Canada, respectively, suggesting that foreign prices were 32% to 42% less than corresponding Canadian prices. Changes in international generic price levels, as well as exchange rate variations, may explain these findings.
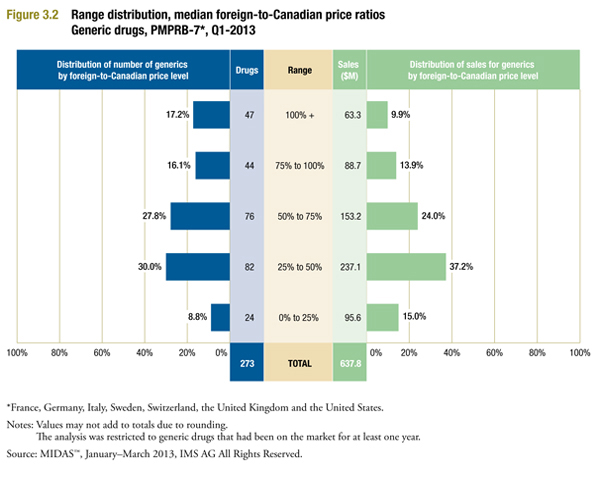
Figure 3.2 provides more detail on the individual price ratios underlying the average median foreign-to-Canadian prices reported in Figure 3.1. It divides the 273 drugs used to calculate this ratio by the extent to which the median foreign price differs from the corresponding Canadian price. For example, the first bar of Figure 3.2 indicates that in 47 cases (17.2%) the median foreign price exceeded the corresponding Canadian price, with these drugs accounting for $63.3 million in sales (9.9%).
The results of Figure 3.2 confirm that median foreign prices are typically less than corresponding Canadian prices. In 182 cases (66.6%) the median foreign price was less than three-quarters of the Canadian price, with these drugs accounting for $485.9 million (76.2%) of sales. In contrast, there were only 91 instances where the median foreign price was at least three-quarters or more of the Canadian price.
Appendix D provides the top-selling “high-priced” and “low-priced” generics in Canada, listing individual drugs whose Canadian prices appear to be either much greater than or much less than corresponding median foreign prices.
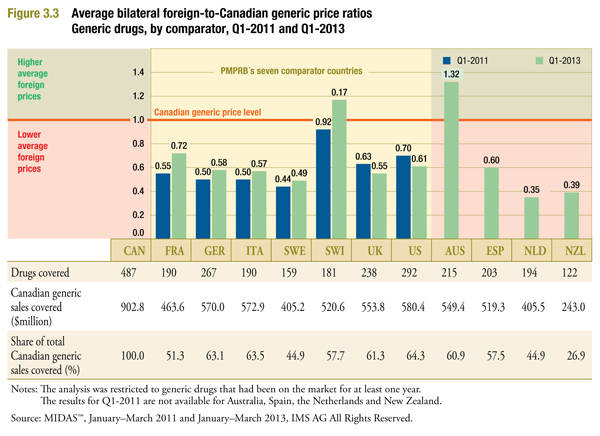
Figure 3.3 reports the average bilateral foreign-to-Canadian generic price ratios by multilateral comparator for Q1-2011 and Q1-2013. The figure also reports the number or drugs covered, the Canadian generic sales covered ($million), and the share of total Canadian generic sales covered (%). Drug coverage refers to the number of leading generic drugs in Canada, at ingredient, strength and form level, with available prices in the respective foreign market.
For example, the “drugs covered” value of “190” given for France indicates that it was possible to match French generic prices for 190 of the drugs in the overall set of 487. The corresponding “sales covered” value of “463.6” indicates that the 190 drugs matched for France accounted for $463.6 million in Q1-2013 Canadian generic sales. Note that there is substantial variation in coverage among comparator countries. This reflects difficulties in matching foreign and Canadian drugs that appear more pronounced for the smaller foreign markets.Footnote 6
Average price ratios range from 1.32 for Australia to 0.35 for the Netherlands. In cases where coverage is greatest (Germany, Italy, the United Kingdom and the United States), foreign prices appear on average to be 39% to 45% less than corresponding Canadian prices in 2013. Coverage is greatest for the US, where the average US-to-Canadian price ratio is 0.61.
Section 5 reports the foreign-to-Ontario price ratios, which provide similar statistics as reported in this section, but relative to the average unit costs reimbursed in by the Ontario Drug Benefit Program.
4 Analysis by Market Segment and at Molecule Level
This section provides further insight into the foreign-to-Canadian price comparisons presented in the previous section. It disaggregates the results by therapeutic class, size of the Canadian market, and number of Canadian suppliers. It also provides results for prices at the molecule level, which allows for a greater degree of generic sales coverage than reported in the previous section.
Therapeutic Class Analysis
Results are reported by “major therapeutic class”. This analysis uses the IMS AG’s own Anatomical Therapeutic Classification (ATC) at level 1, which relates to the anatomical system on which the drugs act.
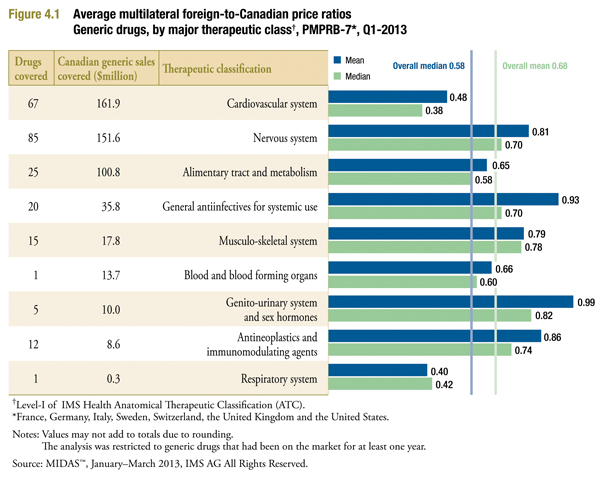
Figure 4.1 provides average foreign-to-Canadian price ratios by therapeutic class for measures of central tendency. It also includes the number of drugs and the Canadian generics sales covered. The therapeutic classes are ranked based on the Canadian generic sales covered.
The average price ratios reported below were calculated similarly to those reported in Figure 3.1, except that each calculation has been restricted to drugs in the indicated therapeutic class.
The results confirm that the tendency of Canadian prices to exceed foreign prices is broadly based.
Only two therapeutic classes yield results suggesting that foreign prices are on average just below Canadian prices: general antiinfectives for systemic use; and genito-urinary system and sex hormones. These classes are relatively smaller in relation to total generic sales.
Results for all other therapeutic classes indicate that foreign prices are typically lower than Canadian prices. The leading therapeutic class by sales – cardiovascular system – is especially noteworthy, with foreign prices appearing to be less than half of corresponding Canadian prices.
Market Size Analysis
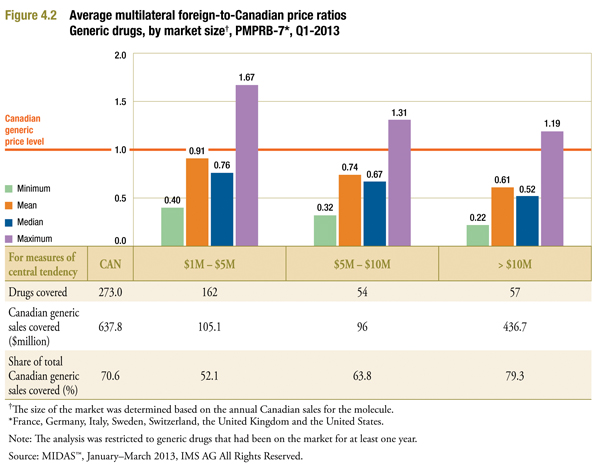
Figure 4.2 reports the foreign-to-Canadian ratios by size of the Canadian market. These were calculated similarly to those reported in Figure 3.1, except that in each instance, calculations were restricted to drugs whose estimated 2013 Canadian generic sales fell into the indicated range.
The results reveal a clear pattern: the larger the market, the wider the gap between foreign and Canadian generic prices. The price differences are especially pronounced for drugs with estimated annual sales in Canada of $10 million or more, with a foreign-to-Canadian ratio of 0.61. These markets account for more than two-thirds (68.5%) of generic sales. Moderate differences are observed in smaller markets, with a ratio of 0.74 for drugs with $5 to $10 million in sales, and a ratio of 0.91 for drugs with $1 to $5 million in sales.
It is worth noting in this context that medium- and large-sized markets accounted for more than 80% of Canadian generic sales in 2013. These markets dominate the overall results reported in Figure 3.1.
Analysis by Number of Canadian Suppliers
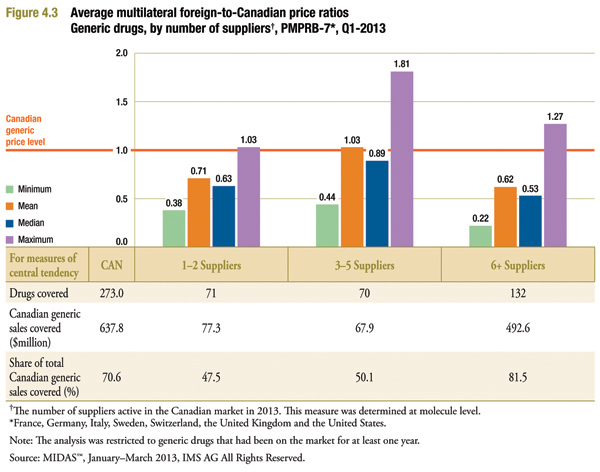
Figure 4.3 provides average foreign-to-Canadian price ratios by the number of suppliers active in the Canadian market in 2013. These average price ratios were calculated similarly to those reported in Figure 3.1 except that in each instance, calculations were restricted to drugs where the numbers of suppliers were in the indicated range.
As might be expected, in Canadian markets with only one or two active generic suppliers, foreign prices are typically much less than corresponding Canadian prices. Here, the mean and median foreign-to-Canadian price ratio is 0.71 and 0.63, respectively.
Foreign prices are the lowest relative to Canadian prices for drugs with six or more suppliers. Here, the mean and median foreign-to-Canadian price ratio is 0.62 and 0.53, respectively. This suggests that Canadian generic prices are much higher than foreign levels even for drugs where there are a large number of suppliers competing in the marketplace.
It is worth noting in this context that markets with “six or more” suppliers accounted for the majority of Canadian generic sales in 2013. These markets dominate the overall results reported in Table 3.1.
Further analysis would be required to understand the results for the three to five suppliers, relative to the other two supplier groupings reported.
Molecule Level Comparisons
Figure 4.4 provides results similar to those reported in Figure 3.1. In this case, comparisons are based on per-milligram prices (as described in Appendix A).
The results in Figure 4.4 closely match those in Figure 3.1. Similar to the foreign-to-Canadian ratios calculated at drug level, calculations at molecule level strongly suggest that foreign generic prices are on average much lower than corresponding Canadian prices.
Note that sales coverage is considerably greater here than in Figure 3.1. This is because more foreign price matches are possible when the requirement to match on form and strength (as well as active ingredient) is removed.
5 Foreign-to-Ontario Generic Price Comparison
The international generic price comparison reported in the previous sections depicts the state of the Canadian generic pharmaceutical sector in Q1-2013. Since then, additional generic pricing policies have been implemented which are not fully captured in the results (Appendix C). Provincial and territorial governments are collaborating on a pan-Canadian Generic Value Price Initiative, which sets the stage for further price decreases, including reducing 18 generic drugs to 18% of the brand reference price by April 1, 2016. The creation of a new pricing framework for new generic drugs entering the market is expected to result in lower prices over time for the entire suite of generic drugs.
To gauge the possible impact of these changes, the results from Section 3 were regenerated using the average unit costs accepted for reimbursement by the Ontario Drug Benefit Program in the second quarter of 2013. These reflect the policies that reduced the generic price relative to the reference brand price for most drugs to a maximum of 25% and 18% for six of the most common generic drugs (The Council of the Federation). The Ontario findings are reflective of the early impacts of the Value Price Initiative.
The Ontario average unit cost was derived from the NPDUIS CIHI database by dividing the drug cost accepted for reimbursement by the number of physical units dispensed. It is important to note that these are average unit costs for Q2-2013 instead of Q1-2013, which is based on the data available for foreign prices through the IMS AG’s MIDAS™.
The average unit costs that the Ontario Drug Benefit Program reimburses reflect the Drug Benefit Price (DBP), which is published on the Ontario Ministry of Health and Long-Term Care website and excludes the markup, the dispensing fee and any applicable compounding fees. The average unit costs do not contain any pharmacy distribution and inventory carrying costs, as these are paid by the Ministry under the 8% markup, in accordance with the Regulation under the Ontario Drug Benefit Act, 1990.
For practical reasons, foreign-to-Ontario price comparisons were limited to a subset of the drugs considered in previous sections. Specifically, these are the 113 top-selling generics (based on Q1-2013 Canadian sales). Although the sample of drugs considered here is much smaller than the set of 487 generic drugs covered in the previous sections, it still accounts for Q1-2013 ex-factory generic sales of $556.3 million. This is about 62% of the sales covered by the larger set considered in previous sections. Relative to the larger set of drugs, the Ontario sample is somewhat skewed in favour of large-market drugs. In Q1-2013, drugs in this sample generated $4.9 million in Canadian generic sales, compared to $1.9 million for the larger set considered in previous sections.Footnote 7
Figure 5.1 is identical to Figure 3.1 in form. It provides multilateral comparisons of foreign generic prices (MIDAS Q1-2013) to Ontario generic prices (ODB CIHI Q2-2013). As expected, the foreign-to-Ontario ratios reported in Figure 5.1 are higher than corresponding values reported in Figure 3.1. This suggests that the prices available in Ontario in Q2-2013 were less than the Q1-2013 manufacture prices available in Canada. Based on measures of central tendency, the mean and median foreign generic prices were 0.75 and 0.62 of their Canadian counterparts even when the Q2-2013 Ontario average reimbursed generic costs are considered.
The results based on Ontario prices in the second quarter of 2013 do not capture the full impact of the Value Price Initiative. The analysis does, however, reflect the policies that reduced the generic prices relative to the reference brand price for most drugs to a maximum of 25% and 18% for six of the most common generic drugs. The Ontario results suggest that the pan-Canadian Generic Value Price Initiative has the potential to reduce the gap between Canadian and international prices in the future.
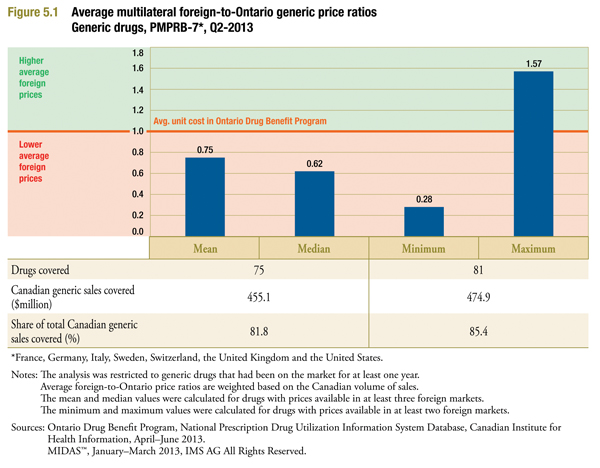
Figure 5.2 is identical to Figure 3.2 in form, providing a range distribution of median foreign generic prices (MIDAS™ Q1-2013) to corresponding Ontario average generic unit cost (Ontario Q2-2013).
The results are similar to those reported in the earlier table. The majority of ratios fall into the 25% to 75% range. But there are also many cases where the foreign median price is at least 75% of the corresponding Canadian price. Once again, high ratios tend to occur in relatively small markets: ratios of 75% or more account for 42.7% of all drugs, but only 29.6% of Canadian generic sales.
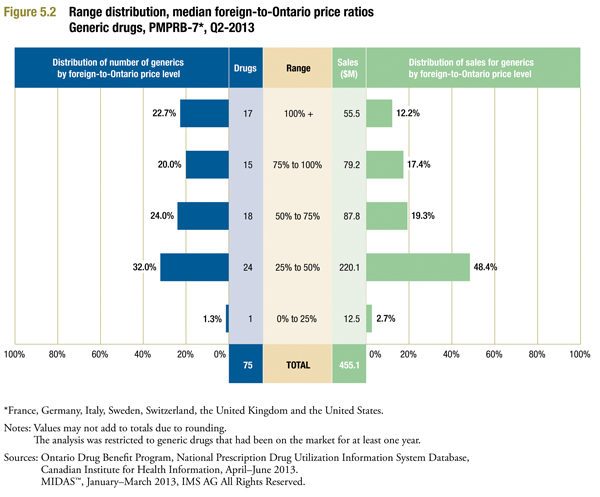
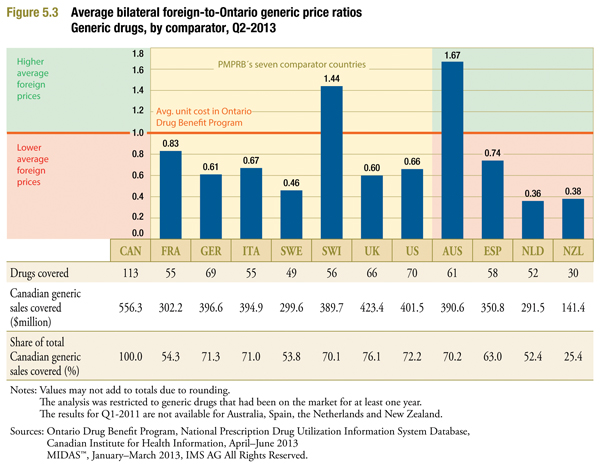
Figure 5.3 is identical to Figure 3.3 in form, providing multilateral comparisons of foreign generic prices (MIDAS Q1-2013) to Ontario average generic unit cost (Ontario Q2-2013). Here again, the foreign-to-Ontario ratios are consistently higher than those obtained using Q1-2013 Canadian prices, although the differences are less pronounced. However, it is important to note that the foreign generic prices remain well below the corresponding Canadian prices (with the exceptions of Australia and Switzerland), despite changes in generic pricing policies.
6 Conclusion
The analysis suggests that generic drugs were typically less expensive in foreign markets than in Canada, regardless of whether Q1-2013 Canadian prices or the Q2-2013 Ontario reimbursed average unit costs were used for analysis. These results are in line with the previous NPDUIS reporting (PMPRB 2013).
In particular:
- Canadian prices for many generic drugs were markedly reduced by Q1-2013, but the mean international prices were still 32% lower on average.
- Overall differences are broadly based: as of Q1-2013, more than two-thirds of Canadian generic sales occurred in markets where the foreign median price was at least 25% lower than the corresponding Canadian price.
- Foreign-to-Canadian price differences are especially pronounced in larger markets or in markets with a substantial number of suppliers.
- While the Ontario generic price levels were some of the lowest in the country, top-selling generic drugs were priced 25% lower on average in foreign markets.
The data reported in this study represents a snapshot in time, capturing some of the changes since the last NPDUIS publication on generic price comparisons. Given the dynamic nature of this market, generic prices have evolved, and further reporting would be required to assess current generic prices in Canada relative to international levels.
References
Competition Bureau Canada. 2008. Benefiting from Generic Drug Competition in Canada: The Way Forward. Available from: http://www.competitionbureau.gc.ca/eic/site/cb-bc.nsf/vwapj/GenDrugStudy-Report-081125-fin-e.pdf/$FILE/GenDrugStudy-Report-081125-fin-e.pdf (Accessed December 1, 2014).
Council of the Federation. 2014. Fact Sheet on Pan-Canadian Pharmaceutical Initiatives. Available from: http://www.councilofthefederation.ca/en/latest-news/74-2014/370-fact-sheet-on-pan-canadian-pharmaceutical-initiatives (Accessed December 1, 2014).
PMPRB. 2010 a. Generic Drugs in Canada: Market Structure – Trends and Impacts. Available from: http://www.pmprb-cepmb.gc.ca/view.asp?ccid=949 (Accessed December 1, 2014).
PMPRB. 2010 b. Generic Drugs in Canada: Price Trends and International Price Comparisons, 2007. Available from: http://www.pmprb-cepmb.gc.ca/view.asp?ccid=868 (Accessed December 1, 2014).
PMPRB. 2011. Generic Drugs in Canada: International Price Comparisons and Potential Cost Savings. Available from: http://www.pmprb-cepmb.gc.ca/view.asp?ccid=870 (Accessed December 1, 2014).
PMPRB. 2013. Analytical Snapshot: International Generic Price Comparison, Early 2011. Available from: http://www.pmprb-cepmb.gc.ca/view.asp?ccid=487 (Accessed December 1, 2014).
Appendix A: Methodology
The statistical results reported below were derived from a large body of international data on pharmaceutical sales. This section describes key elements of these calculations.
The MIDAS™ Dataset. IMS AG’s MIDAS™ database is the source of most sales data used in this analysis. MIDAS™ summarizes data obtained from IMS AG’s detailed audits of pharmaceutical purchases made by retailers (in 70 countries) and hospitals (in 45 countries). MIDAS™ contains information on sales of individual products, measured in both currency and physical units. It also includes information on product manufacturer, active ingredient, brand, form, strength, pack-size, patent status and therapeutic class.
Identification of generics. MIDAS™ includes a field (GENPRD) that identifies generic and branded products. This was used to distinguish entries representing generic products from those representing branded versions of a drug. In a small number of cases, GENPRD gives no information on a drug’s status. In these cases, the drug’s product name was compared to that of its active ingredient to determine if it was a generic.
Identification of supplier. MIDAS™ includes a field (CORPORATION) that associates each drug product with the ownership entity that controls its source of supply. The company identified in the CORPORATION field is considered to be the supplier in this analysis.
Sales. IMS AG’s estimates are based directly on the purchase information obtained in its pharmacy and hospital audits. To obtain the value of a company’s ex-factory sales of a particular product, IMS AG removes an estimate of wholesalers’ mark-ups from the acquisition costs reported by pharmacies and hospitals.
It is important to understand that the acquisition costs that IMS AG uses are based on invoiced prices. Off-invoice discounts, free goods and other forms of price reduction such as rebates are therefore not represented in the MIDAS™ data. To the extent such off-invoice reductions exist, prices derived from these data do not represent “money in the manufacturer’s pocket”. Unpublished research that PMPRB staff conducted using price data obtained from independent sources – most notably, provincial formularies – indicates MIDAS™’s Canadian ex-factory prices do reliably measure drug costs passed on to consumers and reimbursement programs by retailers.
Quantities. MIDAS™ provides a measure of physical quantity it calls “standardized units” (SU). This measure is used throughout the analysis. In general, SUs represent IMS AG’s estimate of the number of normal doses a given volume of physical units entails. This becomes the “number of pills” – that is, the number of tablets or capsules – in the case of oral solids.
Prices. To calculate a drug’s generic unit price, the monetary value of sales and units sold are first summed across all generic suppliers. Price is then obtained by dividing the resulting sum of sales by the sum of SUs for that drug. Branded prices are calculated in a similar fashion.
Where results are provided at molecule level, SUs for the molecule’s various formats (that is, strength and form combination) are first translated into equivalent volumes of active ingredient using MIDAS’ STRENGTH field. The volumes of active ingredient are summed across suppliers and formats. The resulting total volume of active ingredient is then used to produce a price per milligram.
Currency conversion. As noted above, the MIDAS™ sales data used in this report are expressed in local currencies. Naturally, sales were restated in Canadian dollars to allow for meaningful international price comparisons. Currency conversions were undertaken using quarterly average spot-market exchange rates (as reported by the Bank of Canada).
Appendix B: Measures of Central Tendency
Mean. The simple-mean foreign price is an unweighted average of the foreign prices observed for a particular drug. As an example, suppose prices for a certain drug in France, Germany, Sweden, the US and Switzerland are, respectively, $0.25, $0.50, $0.50, $0.50 and $1.75. In this case, the simple mean is ($0.25 + $0.50 + $0.50 + $0.50 + $1.75)/5 = $0.70. Note that each of the five foreign prices receives an equal weight of one-fifth in calculating the simple mean.
Median. The median foreign price is the price that divides the foreign prices observed for a particular drug evenly into two sets of equal size, with half of foreign prices below the median and half above. More precisely, where the number of foreign prices is odd, the median is simply the middle price. Where the number of foreign prices is even, the median is the average of the two middle prices.
As an example, assume once again observed foreign prices for a certain drug are $0.25, $0.50, $0.50, $0.50, 1.75. Since there are five prices in this case, the median is the middle price: $0.50. Note the “skating competition” property of the median: foreign prices at either end of the observed range tend to be “thrown out” in the calculation; that is, to have no influence on the median.
The mean and the median measures will return approximately the same value when foreign prices all lie within a narrow range, but can diverge dramatically when this is not the case. Unusually high or low prices will typically have more influence on the simple mean than the median, because extreme values seldom figure in the calculation of the latter.
Appendix C: Pricing Policies for Generic Drugs in Provincial Drug Plans
Table C1 provides a summary, as of December 1, 2014, of the generic price reduction policies across provinces along with their effective dates.
Table C1. Provincial generic pricing policies, generic price as a percentage of the brand price
|
Note: Information is up to date as of July 1, 2014. Generic pricing exceptions may exist.
*Generic pricing policies apply to oral solid forms; all others are 35%.
† After April 1, 2013, the general provincial generic pricing policies no longer apply to the drugs subject to the 18% pricing policy as per the Council of the Federation.
Quebec did not participate in the pan-Canadian Generic Competitive Value Price Initiative for Generic Drugs, but benefited from it because of the lowest price policy.
|
| Province |
2010 |
2011 |
2012 |
2013* |
2014* |
|
|
|
|
April 1, 18% for six of the most common generic drugs. (The Council of the Federation) |
April 1, 18% for ten of the most common generic drugs. (The Council of the Federation) |
| British Columbia |
October 15: 50% existing generics
42% new generics |
July 4: 40% all generics |
April 2: 35% all generics |
April 1: 25% most generics |
April 1: 20% most generics |
| Alberta |
April 1: 56% existing generics
45% new generics |
|
July 1: 35% all generics |
May 1: 18% |
April 1: Lowest available price for existing generics; tiered pricing for new generics:
70% one generic
50% two generics
25% three generics
18% four or more generics
|
| Saskatchewan |
|
April 1: 40% new generics
May 1 and June 1: 45% existing generics
April 1 and October 1: 35% generics in former Standing Offer Contract categories |
April 1: 35% |
|
|
| Manitoba |
Generic drug pricing is subject to utilization management agreements with the manufacturers, which declare that the price of a generic is equal to that of other select provinces. |
| Ontario |
July 20: 25% public
50% private & out-of-pocket |
April 1: 25%* public
35% private & out-of-pocket |
April 1: 25%* public, private & out-of-pocket |
|
|
| Quebec |
Quebec requires that generic manufacturers provide the province the lowest price available in other provinces.
|
| New Brunswick |
|
|
June 1: 40%
December 1: 35% |
June 1: 25% |
|
| Nova Scotia |
|
July 1: 45%
|
January 1: 40%
July 1: 35% |
|
November 12: 25% |
| Prince Edward Island |
|
|
July 1: 35% |
December 1: 25% |
|
| Newfoundland & Labrador |
|
|
April 1: 45%
October 1: 40% |
April 1: 35%
July 1: 25% |
|
Appendix D: Top-Selling “High-Priced” and “Low-Priced” Generics in Canada
The first of the following two tables lists all drugs whose Q1-2013 median foreign-to-Canadian generic price ratio was less than 0.50. The second lists all cases where the median foreign generic price exceeded the corresponding Canadian price.
Table D1. "High-priced" Canadian generic drugs, PMPRB-7*, Q1-2013
Note: The analysis was restricted to generic drugs that had been on the market for at least one year.
*The median foreign price was calculated based on the following countries: France, Germany, Italy, Sweden, Switzerland, the United Kingdom and the United States.
Source: MIDAS™, January–March 2013, IMS AG All Rights Reserved. |
| Ingredient |
Form |
Strength |
Sales ($M) |
Median*-to-Canadian price ratio |
Median* foreign price |
Number of Canadian suppliers |
| Pantoprazole |
Enteric-Ct Tab |
40 mg |
34 |
0.43 |
0.24 |
13 |
| Atorvastatin |
Film-Ctd Tabs |
20 mg |
25.3 |
0.24 |
0.14 |
12 |
| Atorvastatin |
Film-Ctd Tabs |
10 mg |
20.1 |
0.32 |
0.15 |
12 |
| Atorvastatin |
Film-Ctd Tabs |
40 mg |
17.9 |
0.31 |
0.19 |
12 |
| Amlodipine |
Tablets |
5 mg |
17.9 |
0.19 |
0.07 |
20 |
| Zopiclone |
Film-Ctd Tabs |
7.5 mg |
16.2 |
0.48 |
0.22 |
13 |
| Omeprazole |
Other Capsules |
20 mg |
15.2 |
0.5 |
0.32 |
9 |
| Progesterone |
Capsules |
100 mg |
12.5 |
0.21 |
0.25 |
1 |
| Ramipril |
Capsules |
10 mg |
12.3 |
0.24 |
0.07 |
13 |
| Metformin |
Film-Ctd Tabs |
500 mg |
8.8 |
0.48 |
0.03 |
8 |
| Citalopram |
Film-Ctd Tabs |
20 mg |
8.6 |
0.46 |
0.17 |
19 |
| Amoxicillin |
Capsules |
500 mg |
8 |
0.36 |
0.12 |
8 |
| Fluoxetine |
Capsules |
20 mg |
7.2 |
0.29 |
0.16 |
15 |
| Paroxetine |
Film-Ctd Tabs |
20 mg |
6.8 |
0.44 |
0.23 |
12 |
| Simvastatin |
Film-Ctd Tabs |
20 mg |
6.6 |
0.33 |
0.24 |
15 |
| Clarithromycin |
Film-Ctd Tabs |
500 mg |
6.4 |
0.43 |
0.75 |
9 |
| Atorvastatin |
Film-Ctd Tabs |
80 mg |
6.3 |
0.48 |
0.3 |
11 |
| Ramipril |
Capsules |
5 mg |
6.2 |
0.24 |
0.06 |
13 |
| Simvastatin |
Film-Ctd Tabs |
40 mg |
5.8 |
0.31 |
0.22 |
15 |
| Clozapine |
Tablets |
100 mg |
4.1 |
0.26 |
0.67 |
2 |
| Methotrexate |
Tablets |
2.5 mg |
3.7 |
0.39 |
0.24 |
3 |
| Ramipril |
Capsules |
2.5 mg |
3.5 |
0.21 |
0.05 |
13 |
| Lamotrigine |
Tablets |
100 mg |
3.1 |
0.47 |
0.21 |
7 |
| Pravastatin |
Tablets |
40 mg |
2.7 |
0.27 |
0.17 |
15 |
| Terbinafine |
Tablets |
250 mg |
2.6 |
0.45 |
0.91 |
14 |
| Simvastatin |
Film-Ctd Tabs |
10 mg |
2.5 |
0.2 |
0.11 |
15 |
| Pravastatin |
Tablets |
20 mg |
2.3 |
0.21 |
0.11 |
15 |
| Baclofen |
Tablets |
10 mg |
2.2 |
0.37 |
0.07 |
8 |
| Amiodarone |
Tablets |
200 mg |
1.9 |
0.38 |
0.22 |
10 |
| Paroxetine |
Film-Ctd Tabs |
30 mg |
1.8 |
0.22 |
0.12 |
13 |
| Olanzapine |
Film-Ctd Tabs |
15 mg |
1.8 |
0.29 |
0.86 |
9 |
| Metformin |
Film-Ctd Tabs |
850 mg |
1.7 |
0.24 |
0.04 |
7 |
| Risperidone |
Film-Ctd Tabs |
2 mg |
1.7 |
0.41 |
0.28 |
13 |
| Risperidone |
Film-Ctd Tabs |
1 mg |
1.7 |
0.38 |
0.13 |
13 |
| Atenolol |
Film-Ctd Tabs |
50 mg |
1.6 |
0.48 |
0.07 |
6 |
| Sotalol |
Tablets |
80 mg |
1.5 |
0.17 |
0.08 |
11 |
| Verapamil |
Film-C Tab Ret |
240 mg |
1.5 |
0.36 |
0.21 |
7 |
| Morphine |
Film-C Tab Ret |
100 mg |
1.5 |
0.49 |
0.94 |
4 |
| Lisinopril |
Tablets |
20 mg |
1.5 |
0.27 |
0.07 |
11 |
| Zolmitriptan |
Film-Ctd Tabs |
2.5 mg |
1.4 |
0.34 |
1.88 |
6 |
| Cefuroxime Axetil |
Tablets |
500 mg |
1.4 |
0.45 |
0.63 |
2 |
| Allopurinol |
Tablets |
300 mg |
1.4 |
0.27 |
0.05 |
3 |
| Risperidone |
Film-Ctd Tabs |
0.5 mg |
1.3 |
0.39 |
0.1 |
13 |
| Ramipril |
Tablets |
10 mg |
1.3 |
0.44 |
0.12 |
1 |
| Meloxicam |
Tablets |
7.5 mg |
1.2 |
0.45 |
0.09 |
7 |
| Doxycycline |
Capsules |
100 mg |
1.2 |
0.27 |
0.16 |
6 |
| Aciclovir |
Tablets |
400 mg |
1.1 |
0.17 |
0.25 |
4 |
| Levetiracetam |
Film-Ctd Tabs |
250 mg |
1.1 |
0.32 |
0.29 |
5 |
| Risperidone |
Film-Ctd Tabs |
3 mg |
1.1 |
0.41 |
0.4 |
13 |
| Minocycline |
Capsules |
50 mg |
1 |
0.48 |
0.18 |
7 |
| Levothyroxine Sodium |
Tablets |
25 Y |
1 |
0.38 |
0.03 |
1 |
| Zolmitriptan |
Or Disintg Tab |
2.5 mg |
1 mg |
0.32 |
1.82 |
4 |
| Pentoxifylline |
Film-C Tab Ret |
400 mg |
1 |
0.26 |
0.16 |
2 |
| Lisinopril |
Tablets |
10 mg |
1 |
0.21 |
0.04 |
11 |
| Carvedilol |
Film-Ctd Tabs |
25 mg |
0.9 |
0.35 |
0.14 |
8 |
| Naratriptan |
Film-Ctd Tabs |
2.5 mg |
0.9 |
0.28 |
1.97 |
2 |
| Metoprolol |
Tablets |
50 mg |
0.9 |
0.42 |
0.03 |
4 |
| Indometacin |
Capsules |
50 mg |
0.9 |
0.31 |
0.08 |
3 |
| Levetiracetam |
Film-Ctd Tabs |
750 mg |
0.8 |
0.42 |
0.63 |
6 |
| Diclofenac |
Enteric-Ct Tab |
50 mg |
0.8 |
0.37 |
0.09 |
7 |
| Carvedilol |
Film-Ctd Tabs |
6.25 mg |
0.8 |
0.23 |
0.09 |
8 |
| Atenolol |
Film-Ctd Tabs |
100 mg |
0.7 |
0.38 |
0.1 |
6 |
| Lamotrigine |
Tablets |
25 mg |
0.7 |
0.49 |
0.05 |
7 |
| Ramipril |
Tablets |
5 mg |
0.7 |
0.45 |
0.1 |
1 |
| Simvastatin |
Film-Ctd Tabs |
80 mg |
0.7 |
0.12 |
0.09 |
13 |
| Naproxen |
Film-Ctd Tabs |
550 mg |
0.6 |
0.28 |
0.18 |
3 |
| Isosorbide Mononitrate |
Ret.Tablets |
60 mg |
0.6 |
0.49 |
0.17 |
1 |
| Granisetron |
Film-Ctd Tabs |
1 mg |
0.6 |
0.44 |
6.05 |
1 |
| Pravastatin |
Tablets |
10 mg |
0.6 |
0.15 |
0.07 |
15 |
| Sumatriptan |
Tablets |
50 mg |
0.6 |
0.23 |
1.68 |
6 |
| Citalopram |
Film-Ctd Tabs |
10 mg |
0.6 |
0.15 |
0.04 |
9 |
| Atenolol |
Film-Ctd Tabs |
25 mg |
0.6 |
0.5 |
0.06 |
5 |
| Losartan |
Film-Ctd Tabs |
25 mg |
0.6 |
0.45 |
0.16 |
9 |
| Bromocriptine |
Tablets |
2.5 mg |
0.6 |
0.39 |
0.39 |
3 |
| Estradiol |
Tablets |
2 mg |
0.6 |
0.31 |
0.13 |
1 |
| Propafenone |
Film-Ctd Tabs |
150 mg |
0.6 |
0.24 |
0.08 |
4 |
| Lovastatin |
Tablets |
20 mg |
0.6 |
0.16 |
0.09 |
10 |
| Metoprolol |
Tablets |
100 mg |
0.6 |
0.39 |
0.06 |
5 |
| Ciprofloxacin |
Film-Ctd Tabs |
250 mg |
0.6 |
0.31 |
0.21 |
13 |
| Doxycycline |
Film-Ctd Tabs |
100 mg |
0.6 |
0.49 |
0.28 |
3 |
| Allopurinol |
Tablets |
100 mg |
0.5 |
0.44 |
0.03 |
3 |
| Olanzapine |
Or Disintg Tab |
20 mg |
0.5 |
0.4 |
2.9 |
6 |
| Prednisone |
Tablets |
1 mg |
0.5 |
0.4 |
0.04 |
2 |
| Digoxin |
Tablets |
0.25 mg |
0.5 |
0.27 |
0.06 |
1 |
| Methotrexate |
Tablets |
10 mg |
0.5 |
0.39 |
0.89 |
1 |
| Clomifene |
Tablets |
50 mg |
0.5 |
0.16 |
0.79 |
1 |
| Valsartan |
Film-Ctd Tabs |
50 mg |
0.5 |
0.4 |
0.18 |
9 |
| Pantoprazole |
Enteric-Ct Tab |
20 mg |
0.5 |
0.21 |
0.26 |
5 |
| Aciclovir |
Tablets |
200 mg |
0.5 |
0.33 |
0.23 |
5 |
| Verapamil |
Film-C Tab Ret |
120 mg |
0.5 |
0.43 |
0.24 |
3 |
| Methadone |
Tablets |
5 mg |
0.4 |
0.23 |
0.14 |
1 |
| Clozapine |
Tablets |
25 mg |
0.4 |
0.28 |
0.19 |
2 |
| Oxcarbazepine |
Film-Ctd Tabs |
300 mg |
0.4 |
0.45 |
0.4 |
1 |
| Isosorbide Mononitrate |
Film-C Tab Ret |
60 mg |
0.4 |
0.4 |
0.19 |
2 |
| Flecainide |
Tablets |
100 mg |
0.4 |
0.31 |
0.24 |
1 |
| Tizanidine |
Tablets |
4 mg |
0.4 |
0.36 |
0.15 |
2 |
| Flecainide |
Tablets |
50 mg |
0.4 |
0.31 |
0.13 |
2 |
| Lansoprazole |
Other Capsules |
15 mg |
0.4 |
0.38 |
0.21 |
6 |
| Valsartan |
Abc Film-Ctd Tabs |
320 mg |
0.4 |
0.5 |
0.37 |
9 |
| Hydroxycarbamide |
Capsules |
500 mg |
0.4 |
0.29 |
0.29 |
3 |
| Aciclovir |
Tablets |
800 mg |
0.3 |
0.32 |
0.43 |
4 |
| Theophylline |
Ret.Tablets |
400 mg |
0.3 |
0.43 |
0.22 |
2 |
| Clozapine |
Tablets |
200 mg |
0.3 |
0.38 |
1.96 |
1 |
| Sumatriptan |
Film-Ctd Tabs |
50 mg |
0.3 |
0.24 |
1.99 |
3 |
| Diazepam |
Tablets |
10 mg |
0.3 |
0.43 |
0.04 |
3 |
| Diazepam |
Tablets |
5 mg |
0.3 |
0.46 |
0.03 |
3 |
Table D2. "Low-Priced" Canadian Generic Drugs, PMPRB-7*, Q1-2013
Note: The analysis was restricted to generic drugs that had been on the market for at least one year.
*The median foreign price was calculated based on the following countries: France, Germany, Italy, Sweden, Switzerland, the United Kingdom and the United States.
Source: MIDAS™, January-March 2013, IMS AG All Rights Reserved. |
| Ingredient |
Form |
Strength |
Sales ($M) |
Median*-to-Canadian price ratio |
Median* foreign price |
Number of Canadian suppliers |
| Valaciclovir |
Film-Ctd Tabs |
500 mg |
6.7 |
1.19 |
1.03 |
4 |
| Risedronic Acid |
Film-Ctd Tabs |
35 mg |
5.2 |
1.27 |
2.73 |
8 |
| Alendronic Acid |
Tablets |
70 mg |
5.1 |
1.04 |
2.87 |
13 |
| Quetiapine |
Film-Ctd Tabs |
25 mg |
4.8 |
1.5 |
0.15 |
12 |
| Tamsulosin |
Retard Caps |
0.4 mg |
4.2 |
1.1 |
0.19 |
5 |
| Quetiapine |
Film-Ctd Tabs |
100 mg |
2.7 |
1.18 |
0.4 |
12 |
| Hydroxychloroquine |
Film-Ctd Tabs |
200 mg |
2.3 |
1.29 |
0.26 |
2 |
| Domperidone |
Film-Ctd Tabs |
10 mg |
2.2 |
1.27 |
0.07 |
8 |
| Glibenclamide |
Tablets |
5 mg |
2 |
1.4 |
0.06 |
10 |
| Galantamine |
Retard Caps |
16 mg |
1.8 |
2.24 |
1.35 |
3 |
| Mesalazine |
Enteric-Ct Tab |
400 mg |
1.5 |
1.01 |
0.38 |
2 |
| Fenofibrate |
Film-Ctd Tabs |
160 mg |
1.4 |
1.04 |
0.35 |
5 |
| Levofloxacin |
Film-Ctd Tabs |
500 mg |
1.3 |
1.26 |
1.68 |
6 |
| Alendronic Acid |
Film-Ctd Tabs |
70 mg |
1.2 |
1.11 |
2.72 |
2 |
| Lorazepam |
Tablets |
1 mg |
1.2 |
2.52 |
0.04 |
5 |
| Methylphenidate |
Retard Caps |
30 mg |
1.2 |
1.08 |
1.76 |
1 |
| Methylphenidate |
Retard Caps |
40 mg |
1.2 |
1.17 |
2.26 |
1 |
| Hydrochlorothiazide |
Tablets |
25 mg |
1.1 |
2.91 |
0.02 |
6 |
| Famciclovir |
Film-Ctd Tabs |
500 mg |
1.1 |
1.57 |
2.01 |
5 |
| Finasteride |
Film-Ctd Tabs |
1 mg |
1.1 |
1.18 |
1.1 |
2 |
| Galantamine |
Retard Caps |
24 mg |
1 |
2.6 |
1.36 |
3 |
| Letrozole |
Film-Ctd Tabs |
2.5 mg |
1 |
1.01 |
1.55 |
7 |
| Galantamine |
Retard Caps |
8 mg |
0.9 |
1.74 |
1.36 |
3 |
| Methylphenidate |
Retard Caps |
20 mg |
0.8 |
1.06 |
1.28 |
1 |
| Carbamazepine |
Ret. Tablets |
200 mg |
0.8 |
1.04 |
0.11 |
3 |
| Prednisone |
Tablets |
5 mg |
0.7 |
2.19 |
0.03 |
3 |
| Morphine |
Retard Caps |
100 mg |
0.6 |
1.36 |
1.33 |
1 |
| Carbamazepine |
Tablets |
200 mg |
0.5 |
1.09 |
0.08 |
3 |
| Codeine |
Tablets |
30 mg |
0.5 |
1.81 |
0.1 |
4 |
| Methylphenidate |
Tablets |
10 mg |
0.5 |
3.07 |
0.1 |
3 |
| Dexamethasone |
Tablets |
4 mg |
0.5 |
1.91 |
0.36 |
5 |
| Morphine |
Retard Caps |
60 mg |
0.5 |
1.41 |
0.71 |
1 |
| Clindamycin |
Capsules |
150 mg |
0.5 |
1.39 |
0.26 |
5 |
| Topiramate |
Film-Ctd Tabs |
200 mg |
0.5 |
1.08 |
1.03 |
9 |
| Spironolactone |
Tablets |
100 mg |
0.5 |
1.09 |
0.24 |
1 |
| Morphine |
Retard Caps |
30 mg |
0.5 |
1.47 |
0.41 |
1 |
| Rivastigmine |
Capsules |
3 mg |
0.4 |
1.23 |
0.7 |
4 |
| Famotidine |
Film-Ctd Tabs |
40 mg |
0.3 |
1.04 |
0.54 |
5 |
| Methylphenidate |
Tablets |
20 mg |
0.3 |
1.92 |
0.26 |
3 |
| Rivastigmine |
Capsules |
1.5 mg |
0.3 |
1.71 |
0.71 |
4 |
| Desmopressin |
Tablets |
0.2 mg |
0.3 |
1.76 |
0.98 |
3 |
| Metoprolol |
Film-C Tab Ret |
100 mg |
0.3 |
1.64 |
0.13 |
2 |
| Methylphenidate |
Retard Capst |
10 mg |
0.3 |
1.24 |
0.7 |
1 |
| Mycophenolate Mofetil |
Capsules |
250 mg |
0.3 |
1.08 |
0.62 |
5 |
| Hydrocortisone |
Tablets |
10 mg |
0.3 |
1.7 |
0.15 |
1 |
| Morphine |
Retard Caps |
200 mg |
0.3 |
1.18 |
3.01 |
1 |
| Sucralfate |
Tablets |
11 g |
0.3 |
1.15 |
0.15 |
5 |
Appendix E: "All OECD" Results
The MIDAS™ database includes data for many countries beyond the set of 11 listed in Section 1. The following table provides results similar to those reported in Figure 3.1. The multilateral price comparisons were generated using the data on the 25 countries in the Organisation for Economic Co-operation and Development (OECD) with available data in MIDAS™.Footnote 8 Note that the inclusion of the 14 additional countries substantially increases the coverage of the multilateral foreign-to-Canadian ratios compared to those reported in Figure 3.1. Despite this, the foreign-to-Canadian ratios themselves are remarkably similar.
Table E1. Average multilateral foreign-to-Canadian price ratio for generic drugs, all OECD, Q1-2013
Note: The analysis was restricted to generic drugs that had been on the market for at least one year.
Source: MIDAS™, January–March 2013, IMS AG All Rights Reserved. |
| |
Minimum foreign price |
Maximum foreign price |
Mean foreign price |
Median foreign price |
| Average price ratio |
0.22 |
2.01 |
0.71 |
0.56 |
| Products covered |
402 |
402 |
372 |
372 |
| Products covered (%) |
82.5 |
82.5 |
76.4 |
76.4 |
| Sales covered ($million) |
830.1 |
830.1 |
801.6 |
801.6 |
| Sales covered (%) |
91.9 |
91.9 |
88.8 |
88.8 |
Appendix F: Effect of Removing “Mature Market” Restriction
As noted in the introductory section, the results presented encompass drugs that have been available as generics in both Canada and relevant foreign comparator countries for at least one year. This restriction excludes very recently genericized markets where market structure, the state of competition and, hence, prices have not yet reached their long-run position.
The following tables provide bilateral and multilateral price comparison results obtained without the “mature market” market restriction. They are identical in form to Figures 3.1 and 3.3. Note that, with the possible exception of the bilateral foreign-to-Canadian ratio for the United States, the removal of the “mature market” restriction has little impact on the results. The foreign-to-Canadian ratio for the United States changes from 0.61 to 0.66.
Table F1. Average bilateral foreign-to-Canadian price ratio for generic drugs, all drugs, Q1-2013
|
Canada |
France |
Germany |
Italy |
Sweden |
Switzerland |
United Kingdom |
United States |
| Average price ratio |
1.00 |
0.73 |
0.61 |
0.58 |
0.47 |
1.18 |
0.57 |
0.67 |
| Products covered |
512 |
217 |
293 |
209 |
183 |
204 |
256 |
319 |
| Products covered (%) |
100.0 |
42.4 |
57.2 |
40.8 |
35.7 |
39.8 |
50.0 |
62.3 |
| Sales covered ($M) |
976.1 |
582.0 |
618.2 |
612.7 |
465.5 |
591.8 |
580.8 |
629.9 |
| Sales covered (%) |
100.0 |
59.6 |
63.3 |
62.8 |
47.7 |
60.6 |
59.5 |
64.5 |
Note: This analysis was not restricted to generic drugs that had been on the market for at least one year.
Source: MIDAS™, January–March 2013, IMS AG All Rights Reserved. |
| |
Canada |
Australia |
Spain |
Netherlands |
New Zealand |
| Average price ratio |
1.00 |
1.33 |
0.66 |
0.39 |
0.39 |
| Products covered |
512 |
231 |
225 |
219 |
136 |
| Products covered (%) |
100.0 |
45.1 |
43.9 |
42.8 |
26.6 |
| Sales covered ($M) |
976.1 |
591.7 |
563.6 |
457.8 |
265.0 |
| Sales covered (%) |
100.0 |
60.6 |
57.7 |
46.9 |
27.2 |
Table F2: Average multilateral foreign-to-Canadian price ratio for generic drugs, all drugs, PMPRB-7*, Q1-2013
*France, Germany, Italy, Sweden, Switzerland, the United Kingdom and the United States.
Note: This analysis was not restricted to generic drugs that had been on the market for at least one year.
Source: MIDAS™, January–March 2013, IMS AG All Rights Reserved. |
| |
Minimum foreign price |
Maximum foreign price |
Mean foreign price |
Median foreign price |
| Average price ratio |
0.25 |
1.36 |
0.66 |
0.56 |
| Products covered |
350 |
350 |
311 |
311 |
| Products covered (%) |
68.4 |
68.4 |
60.7 |
60.7 |
| Sales covered ($M) |
772.6 |
772.6 |
732.4 |
732.4 |
| Sales covered (%) |
79.2 |
79.2 |
75.0 |
75.0 |
Appendix G: Algebra of Average Foreign-to-Canadian Price Ratios
This report presents a variety of average foreign-to-Canadian (FTC) price ratios, similar to those published in PMPRB’s annual report. These average ratios are constructed as sales-weighted arithmetic averages of foreign-to-Canadian price ratios at the level of individual drugs. Algebraically, let
i = 1 … N, each number identifying a drug included in the calculation
p(i) = the Canadian price of drug i
pf(i) = the foreign price of drug i (converted to Canadian dollars)
w(i) = the proportion of Canadians’ expenditure on the drugs 1 to N accounted for by
drug i
The sales-weighted arithmetic average of foreign-to-Canadian price ratios is given by:
(G1) FTC = ∑ w(i)[pf(i)/p(i)]
where ∑ signifies summation over drugs 1 to N.
With currency conversion at market exchange rates, average ratios constructed this way indicate how much more or less Canadians would have paid for the drugs they purchased had they paid foreign prices. This becomes evident when one observes that equation (G1) can also be written:
(G2) FTC = ∑ [p(i)q(i)/X(i)][pf(i)/p(i)]
where q(i) represents the quantities purchased by Canadians, while X(i) = ∑ [p(i)q(i)] and represents total spending by Canadians (at Canadian prices). The last equation simplifies to:
(G3) FTC = [1/X(i)] ∑ [pf(i)q(i)]
The expression ∑ [pf(i)q(i)] represents the dollar amount obtained by pricing out quantities at foreign prices; that is, what Canadians would have spent if they had paid foreign prices. The right-hand side of equation (G3) is the ratio of this hypothetical amount to the amount Canadians actually spent. Let D represent the difference between actual and hypothetical spending expressed as a percentage of the former. Then D can be written:
(G4) D = (1 - FTC) X 100
Note that D > = < 0 as FTC < = > 1. Thus, a value of FTC < 1 (implying D > 0) indicates that Canadians would have spent less in total for the drugs they purchased had they been able to pay foreign prices, while an FTC > 1 indicates they would have spent more.