Public Drug Plan Dispensing Fees: A Cost-Driver Analysis
ISBN: 978-1-100-19412-7
Cat. No.: H82-11/2011E-PDF
September 2011
Executive Summary
In recent years, public drug plan expenditure on dispensing fees has increased rapidly in several Canadian public drug plans, with several experiencing double-digit annual growth rates.
Data was collected for nine public drug plans participating in the NPDUIS initiative for 2001/02 to 2007/08, including eight provincial jurisdictions (BC, AB, SK, MB, ON, NB, NS and PEI) and one national program (Health Canada's Non-Insured Health Benefits (NIHB) Program). Together these nine public drug plans reimbursed over a billion dollars ($1.27 billion) for dispensing fees in 2007/08, with an average annual growth rate of 9.1% from 2001/02 to 2007/08. Adding markup to this total, the amount public drug plans reimbursed pharmacies in 2007/08 was $1.54 billion or 19.3% of the total prescription cost.
This report identifies and then quantifies the factors driving dispensing fee expenditure from 2001/02 to 2007/08. One of the main findings is that growth in the number of prescriptions is a major cost driver. Although the number of prescriptions increases primarily because of rising demand for drugs, the study identified changes in prescription length as an important driver in three jurisdictions: British Columbia, Manitoba and Ontario.
Along with the number of prescriptions, the average fee reimbursed per prescription was a significant driver in Western provinces, but not so in the rest of Canada. Ontario and New Brunswick, for example, had stable average dispensing fees over the study period.
Another important public drug plan reimbursement to pharmacies is the markup on drug cost. The study found that markup results in significantly higher pharmacy reimbursement as a share of prescription cost in two jurisdictions: Saskatchewan and Ontario.
Table Of Contents
- Introduction
- Data Source
- Overview of Trends in Dispensing Fee Expenditure
- Factors Driving Growth of Dispensing Fee Expenditure
- Cost Driver Models
- Markup and Pharmacy Reimbursement
- Conclusion
- Bibliography
- Appendix 1: Methodology and Formulas
- Appendix 2: Glossary of Terms
- Appendix 3: List of Ingredients for Prescription Length Case Studies
- Appendix 4. Dispensing Fee Expenditures, Markup Expenditures and Prescription Numbers by Drug Plan, 2001/02 to 2007/08
- Appendix 5: Overview of Public Drug Plan Dispensing Fee Reimbursement Regimes
1 Introduction
In recent years, several Canadian public drug plans experienced a rapid increase in dispensing fees expenditures (some with double-digit annual growth rates), while expenditures have remained relatively stable for other public drug plans.
Data was collected for nine public drug plans participating in the NPDUIS initiative for 2001/02 to 2007/08, including eight provincial jurisdictions (BC, AB, SK, MB, ON, NB, NS and PEI) and one national program (Health Canada's Non-Insured Health Benefits (NIHB) Program). Together these nine public drug plans reimbursed over a billion dollars ($1.27 billion) for dispensing fees in 2007/08, with an average annual growth rate of 9.1% from 2001/02 to 2007/08. Adding markup to this total, the amount public drug plans reimbursed pharmacies in 2007/08 was $1.54 billion or 19.3% of the total prescription cost.
The purpose of this study is to investigate, quantify and explain the factors driving these cost increases from 2001/02 to 2007/08. That is, this study disentangles the reasons why dispensing fee reimbursements have risen so rapidly in some public drug plans while remaining relatively stable in others.
2 Data Source
The main source of data for this study was the Canadian Institute for Health Information (CIHI) NPDUIS public drug plan database. Data was collected at the DIN (Drug Identification Number) level, which uniquely identifies the brand name, active ingredient, dosage form and strength.
DIN-level time-series data for six public drug plans (AB, SK, MB, NB, NS and PEI) was extracted for the fiscal years 2001/02 to 2007/08 from the NPDUIS database. DIN-level data for the same years was obtained for three other public drug plans (ON, BC and NIHB) from the Public Drug Plan Aggregate Database (PDAD) housed at the PMPRB. The key variables extracted include dispensing fee and markup expenditure, prescription numbers and day supply.
As the study focus is on public drug plan expenditure, paid data was used when available.1 Paid data includes dollars reimbursed by public drug plans, without a beneficiary share such as a co-pay or deductible. For the analysis, non-drugs such as medical supplies and injectables were screened out, as they produce inconsistent results due to data quality issues.2
Day supply data provided a unique challenge for quality assurance. Although most pharmacies enter the actual day supply for a prescription, drug plan managers3 suggest some pharmacies periodically enter data according to ‘administrative rules' for a particular medication. Therefore, it was necessary to validate this data and assess its quality. Several procedures were used, including: (i) quality checks for missing or irregular data; (ii) checks to assess whether data was entered according to administrative rules and (iii) validation to ensure data behaves or trends as expected. Based on these checks, it was determined that day supply data was of sufficient quality to be used for trend analysis for seven public drug plans (BC, AB,4 MB, ON, NB, PEI and NS).
For the cost driver models, data for drug quantity was used as a proxy for day supply, in order to report on all public drug plans. Drug quantity at the ingredient, form and dose level was used for reasons of consistency. For computation purposes, the dataset was limited to a subset that includes oral solids and drugs that existed in both the first and last period of analysis. These drugs accounted for an average of 80% of drug expenditure across Canada. For the markup analysis, an additional step was taken to validate the data by comparing reimbursements to annual markup policy (2001–2008) in each public drug plan obtained from Provincial Drug Benefit Programs (Canadian Pharmacists Association 2001–2008).
1 Paid variables were available for public drug plans in the PMPRB database; however, the CIHI NPDUIS database is not populated with paid claims. As a result, the accepted variable was used as a replacement with a filter that excluded prescriptions without a public drug plan reimbursement share.
2 Because different data screens or filters were used throughout this report, there may be small discrepancies in the reported results from one section to another.
3 Based on discussions with drug plan managers during NPDUIS Steering Committee meetings.
4 A partial dataset was used for Alberta due to data quality issues.
3 Overview of Trends in Dispensing Fee Expenditure
From 2001/02 to 2007/08, there was a relatively rapid growth in dispensing fee expenditure in several public drug plans, with double-digit rates in Saskatchewan, Ontario, Manitoba, British Columbia and the NIHB (12.8%, 12.0%, 11.3%, 10.4% and 10.0%, respectively) and a growth rate of 8.1% in Alberta. By comparison, growth rates were lower in the Maritime provinces: Prince Edward Island (7.0%), New Brunswick (5.3%) and Nova Scotia (5.3%). See Appendix 4, Table A4.1, for more detail.
Table 1. Dispensing fee expenditure by Canadian public drug plans, 2001/02 to 2007/08
| Public drug plan |
Average annual growth rate, 2001/02 to 2007/08 |
Dispensing fee expenditure, 2007/08 ($ millions) |
Share of total prescription expenditure, 2007/08 |
| British Columbia |
10.4% |
$174.3 |
18.6% |
| Alberta |
8.1% |
$131.6 |
17.2% |
| Saskatchewan |
12.8% |
$52.7 |
16.9% |
| Manitoba |
11.3% |
$49.8 |
17.4% |
| Ontario |
12.0% |
$696.5 |
17.1% |
| New Brunswick |
5.3% |
$29.4 |
15.8% |
| Nova Scotia |
5.3% |
$33.1 |
19.1% |
| Prince Edward Island |
7.0% |
$3.4 |
12.3% |
| NIHB |
10.0% |
$97.1 |
26.9% |
| Total/Average |
9.13% |
$1,267.8 |
17.9% |
These nine public drug plans across Canada reimbursed a total of $1.27 billion for dispensing fees in 2007/08. Most public drug plans reimbursed a comparable portion of total prescription expenditure for fees: between 15% and 20% (2007/08). The two exceptions were NIHB, which spent over a quarter of their prescription share on dispensing fees, while PEI spent 12.3%.
Trends in the dispensing fee share of total prescription expenditure (Figure 1) varied across Canada from 2001/02 to 2007/08. For example, the share in Ontario increased from 14.8% in 2001/02 to 16.8% in 2007/08, while New Brunswick's share declined from 19.0% to 16.6%.
Figure 1. Dispensing fee expenditure as a percent share of total prescription expenditure, 2001/02 to 2007/08

| |
2001/02 |
2002/03 |
2003/04 |
2004/05 |
2005/06 |
2006/07 |
2007/08 |
| BC |
13.1% |
13.3% |
16.1% |
16.7% |
17.2% |
17.8% |
18.7% |
| AB |
18.6% |
17.9% |
17.6% |
17.5% |
17.5% |
17.3% |
17.4% |
| SK |
17.1% |
16.3% |
16.6% |
16.2% |
16.2% |
16.5% |
16.7% |
| MB |
15.0% |
15.1% |
15.5% |
16.2% |
16.5% |
16.8% |
17.2% |
| ON |
14.8% |
14.7% |
14.8% |
14.8% |
14.6% |
15.3% |
16.8% |
| NB |
19.0% |
18.0% |
17.2% |
16.6% |
16.2% |
16.0% |
16.6% |
| PEI |
— |
13.5% |
13.0% |
12.6% |
12.5% |
12.0% |
12.3% |
| NS |
21.4% |
20.8% |
20.0% |
19.4% |
19.1% |
19.2% |
18.9% |
| NIHB |
25.3% |
24.4% |
24.1% |
24.2% |
24.6% |
25.0% |
26.9% |
4 Factors Driving Growth of Dispensing Fee Expenditure
This section identifies and quantifies the factors that drive public drug plan spending on dispensing fees. It presents examples, statistical trends, relevant regulations and case studies to illustrate the contribution of each factor. Two cost-driver models in the next section (Section 5 Cost Driver Models) will provide estimates of the relative contribution of each factor to expenditure growth.
Mathematically, the total dispensing fee expenditure is the product of the total number of prescriptions and the average dispensing fee reimbursed per prescription (see Appendix 1: Methodology and Formulas).
Public drug plans set dispensing fee reimbursements either through regulation or agreements with pharmacy associations. Reimbursements vary considerably by plan, as discussed in the next subsection, with some public drug plans putting restrictions on fee reimbursement.Prescription numbers can change for two reasons: (i) shifts in utilization or demand for drugs; and (ii) changes in prescription length that can affect claim frequencys.5 The following two hypothetical scenarios illustrate the potential difference in cost based on a change in prescription length as measured by day supply.
Scenario 1: 1,000 prescriptions at 60 day supply = $9,000 total dispensing fee expenditure
In the first scenario, 1,000 prescriptions are reimbursed with an average dispensing fee of $9.00, and an average prescription length of 60 day supply. This results in a total expenditure of $9,000 and a dispensing fee per day supply of $0.15. In other words, a public drug plan reimburses an average of 15 cents in dispensing fees for every day a patient is on medication.
Scenario 2: 1,500 prescriptions at 40 day supply = $13,500 total dispensing fee expenditure
In the second scenario, the prescription length decreases from an average 60 to 40 day supply. Because the same 60,000 day supply of medication is required for treatment (1,000 prescriptions x 60 day supply per prescription), a greater number of prescriptions need to be filled: 60,000/40 = 1,500 prescriptions. Thus although the dispensing fee set by the public drug plan does not change ($9.00), the fee per day supply increases from $0.15 to $0.225. That is, the public drug plan reimburses an average 50% more a day in dispensing fees as a result of a 20 day supply decline in prescription length. As a result, the total cost to dispense medication in scenario 2 increases from $9,000 to $13,500. Overall, these scenarios illustrate the substantial effect prescription length can have on dispensing fee expenditure.
4.1 Dispensing Fee per Prescription
As discussed, the growth of dispensing fee expenditure is driven, in part, by the fees reimbursed to pharmacies each time a prescription is dispensed to a beneficiary. Dispensing fees are reimbursed by public drug plans, and the fee structure may be simple or complex, varying for subprograms, drug groups or drug cost ranges. A detailed description of these reimbursement regimes is given in Appendix 5, Table A5.1. To simplify the analysis, three general types of regimes were identified:
1) Dispensing Fee Cap—This is the maximum amount that a public drug plan will reimburse a pharmacist to dispense a prescription. Several public drug plans use this tool, although the specific policy varies from province to province. Ontario and Saskatchewan use a single flat rate, while in British Columbia fees are not to exceed the ‘usual and customary' fee charged for any prescription sold in the province (BC PharmaCare Newsletter 2010). Prince Edward Island uses fee caps for some programs such as Children in Care, Financial Assistance and Quit Smoking, while there are no restrictions on their senior and other programs.
2) Variable Rates—Two public drug plans, Alberta and New Brunswick, use a variable-rate schedule of reimbursement based on the actual acquisition cost of the drug or medication per claim. In both public drug plans, the schedule is a maximum dispensing fee provided for various ranges of acquisition costs: the higher the range, the higher the rate. Nova Scotia's fees are a hybrid of capped and variable rates: they have two caps based on whether the drug is categorized as high cost or not.
3) Market Rates—Manitoba has no restrictions on dispensing fees. Dispensing fees are based on the market, and the province reimburses the full amount submitted. Prince Edward Island's Senior, Family Health and High-Cost Drug programs also have no restrictions.
Table 2 reports on average dispensing fees from 2001/02 to 2007/08. The figures are a global average across all prescriptions and encompass all the subprograms, prescription cost levels and classifications of drugs in each public drug plan. In general, average fees are slightly lower than the rates set in each public drug plan, as the dispensing fee reimbursed may be lower but cannot exceed a fee cap or maximum allowed. For example, in 2007/08, the cap in Saskatchewan ranged from $8.46 to $8.63, while the average amount reimbursed was $7.96.
Table 2. Average dispensing fee per prescription by public drug plan, 2001/02 to 2007/08
| Public drug plan |
2001/02 |
2002/03 |
2003/04 |
2004/05 |
2005/06 |
2006/07 |
2007/08 |
Average annual compound rate of growth (%) |
| British Columbia |
$6.25 |
$6.75 |
$7.24 |
$7.38 |
$7.42 |
$7.43 |
$7.32 |
2.7% |
| Alberta |
$10.53 |
$10.91 |
$11.34 |
$11.95 |
$12.55 |
$12.72 |
$12.72 |
3.2% |
| Saskatchewan |
$6.55 |
$6.71 |
$7.19 |
$7.19 |
$7.36 |
$7.73 |
$7.96 |
3.3% |
| Manitoba |
$6.74 |
$7.30 |
$7.98 |
$8.34 |
$8.33 |
$8.42 |
$8.07 |
3.0% |
| Ontario |
$6.38 |
$6.43 |
$6.47 |
$6.50 |
$6.50 |
$6.75 |
$6.99 |
1.6% |
| New Brunswick |
$8.67 |
$8.82 |
$8.90 |
$8.97 |
$9.02 |
$9.05 |
$9.03 |
0.7% |
| Nova Scotia |
$8.79 |
$8.96 |
$8.98 |
$9.30 |
$9.73 |
$10.04 |
$9.95 |
2.1% |
| Prince Edward Island* |
— |
— |
— |
$6.25 |
$6.51 |
$6.41 |
$6.57 |
1.7% |
| NIHB |
$6.97 |
$7.11 |
$7.29 |
$7.44 |
$7.62 |
$7.73 |
$8.20 |
2.8% |
| Average |
$7.61 |
$7.87 |
$8.18 |
$8.38 |
$8.57 |
$8.73 |
$8.53 |
2.2% |
For most public drug plans, the average dispensing fee increased gradually at close to the average annual growth rate of 2.2%. In New Brunswick (0.7%) fees grew at a slower rate than average, while in some western provinces, such as Alberta (3.2%), Saskatchewan (3.3%) and Manitoba (3.0%), fees grew about a percent higher than average. Thus the fee per prescription was a cost driver in some western provinces, but not in the rest of Canada.6
* Prescription number data for Prince Edward Island is limited to four years: 2004/05 to 2007/08.
4.2 Prescription Numbers
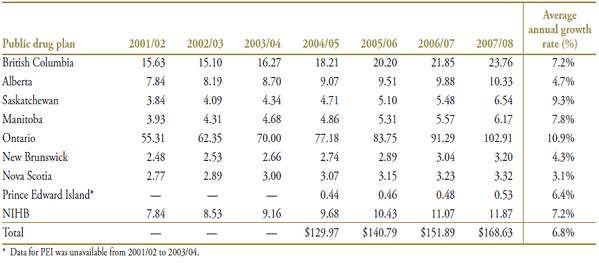
While the growth in average dispensing fees had a moderate impact on expenditure, from 2001/02 to 2007/08, the number of prescriptions grew rapidly in some public drug plans and less so in others (Table 3). Ontario had the fastest rate of growth, averaging in the double digits (10.9%), and Saskatchewan had a comparable growth (9.3%). Prescription numbers grew less rapidly in British Columbia (7.2%), Manitoba (7.8%), NIHB (7.2%) and Prince Edward Island (6.4%). In other provinces, prescription numbers grew at a moderate pace (Nova Scotia 3.1%, New Brunswick 4.3% and Alberta 4.7%), contributing less to dispensing fee expenditure growth than other public drug plans.
As shown in Table 3, a total of 168.6 million prescriptions were reimbursed by these nine public drug plans in 2007/08.
Table 3. Growth of prescription numbers
| Public drug plans |
Average annual rate of compound growth, 2001/02 to 2007/08 |
Total number of prescriptions, 2007/08 (millions) |
| British Columbia |
7.2% |
23.8 |
| Alberta |
4.7% |
10.3 |
| Saskatchewan |
9.3% |
6.5 |
| Manitoba |
7.8% |
6.2 |
| Ontario |
10.9% |
102.9 |
| New Brunswick |
4.3% |
3.2 |
| Nova Scotia |
3.1% |
3.3 |
| Prince Edward Island* |
6.4% |
0.5 |
| NIHB |
7.2% |
11.9 |
| Average/Total |
6.8% |
168.6 |
* Prescription number data for Prince Edward Island was limited to four years: 2004/05 to 2007/08.
An index was constructed to show trends and the cumulative effect of prescription growth from 2001/02 to 2007/08 (Figure 2). It shows a wide variation in growth rates across Canada, with prescription numbers increasing rapidly in several public drug plans and slower in others. In Ontario, for example, total prescriptions increased by 86% over the seven-year study period, while claims grew by 70% in Saskatchewan, by 57% in Manitoba and by 52% in British Columbia. By comparison, total prescriptions grew by a third in Alberta (32%); 29% in New Brunswick and 20% in Nova Scotia. Most had an even pattern of growth except for British Columbia, where growth declined for one year (2001/02) as a result of the introduction of the Fair PharmaCare program, and Saskatchewan, which had a sharp upward trend in 2006/07.
Figure 2. Indexed growth of prescription numbers by public drug plans, 2001/02 to 2007/08*

* Prescription number data for Prince Edward Island was limited to four years: 2004/05 to 2007/08.
Growth in the number of prescriptions may be a function of several factors, including increases in utilization or demand for drugs, and decreases in the prescription length. The next section will analyse the latter factor further.
4.3 Prescription Length
As previously discussed, changes in prescription length can have a substantial effect on dispensing fee expenditure. This section will present statistics on both day supply per prescription and dispensing fee per day supply in order to identify trends.
Like dispensing fees, day supply is regulated by public drug plans. The main focus is on restrictions for the maximum number of day supply per prescription, such as 14, 30, 60 or 90–100 days. While there are differences between drug plans, most set day supply limits according to the needs of specific patient groups or medication types. For example, day supply limits are placed on groups that require monitoring such as long-term care residents, those in short-term care or first-time recipients and on some medications, such as narcotics and trial prescriptions that are dispensed for a limited number of days (14–35 days). Maintenance drugs such as those prescribed for cardiovascular conditions are dispensed for longer periods, usually to a maximum of 100 days.
Until recently, day supply policies did not change substantively from year to year. In 2008, both Ontario and British Columbia introduced new regulations. British Columbia introduced a new frequency of dispensing policy under which it expects long-term maintenance drugs to be dispensed in 100-day supply and short-term drugs to be dispensed up to 30 days, except in cases of medical necessity. For shorter prescriptions, a physician or pharmacist must document the reason. Ontario's changes are similar with lengthier prescriptions (100 day supply) required for all medications unless the prescriber directs a shorter length or unless the prescription is being filled for the first time. (Appendix 5, Table A5.2 provides a detailed summary of day supply policies by public drug plan from 2001 to 2008).7
Figure 3 reports on prescription length trends for the study period (2001/02 to 2007/08). The results show that trends varied widely across Canada: Ontario, British Columbia, Manitoba and PEI trended towards shorter prescription lengths, while public drug plans in New Brunswick and Nova Scotia had small increases in prescription length. British Columbia had the steepest declines, falling from an average 43 day supply per prescription in 2001/02 to 28 days in 2007/08. Ontario had the next steepest decline from 38 to 29 day supply; while Manitoba's fell the least, from 33 to 27 day supply. On the other hand, New Brunswick's prescription length increased by 3 days from 38 to 41, while Nova Scotia rose from 40 to 45 days. Day supply data was limited to three years for Alberta, but it shows a constant trend at just over 50 day supply per claim.
Figure 3. Average day supply per prescription by public drug plan, 2001/02 to 2007/08

Figure 4 reports on a second prescription length statistic, dispensing fee per day supply. Unlike the regulated dispensing fee per prescription, this statistic varies as prescription length changes (see Dispensing fee and day supply calculations in Appendix 1: Methodology and Formulas). As expected, the amount reimbursed per day increased in provinces that trended towards shorter prescription lengths. In British Columbia, for example, the daily dispensing fee increased from $0.15 in 2001/02 to $0.28 in 2007/08, while Ontario's fee per day increased from $0.17 to $0.24. However, in public drug plans that trended towards longer prescription lengths, the daily dispensing fee trend was constant. In Nova Scotia and New Brunswick, a small increase in prescription length (which acted to lower the fee per day) was offset by a small increase in the dispensing fee per prescription (see Table 2). The net result was that the dispensing fee per day supply trend was constant in those provinces from 2001/02 to 2007/08.
Figure 4. Average dispensing fee per day supply by public drug plan, 2001/02 to 2007/08

4.3.1 Prescription Length Case Studies
Using a case study approach, the purpose of this section is to investigate the wide variations in prescription length trends across Canada. The first case study examines trends for a large number of ingredients for the three public drug plans with the steepest declines in prescription length: British Columbia, Ontario and Manitoba. The second case study compares prescription length across four public drug plans (MB, AB, NB and NS) for two therapeutic classes of drugs that treat chronic conditions: high cholesterol and hypertension.
Case Study 1: Changes in Prescription Length for Leading Ingredients (2001/02 to 2007/08)
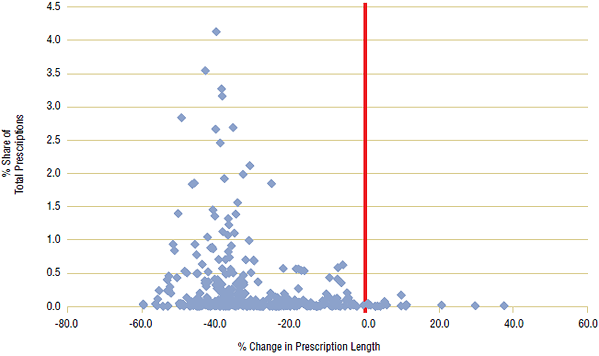
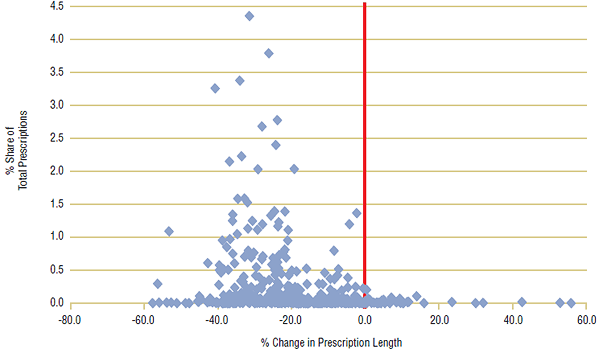
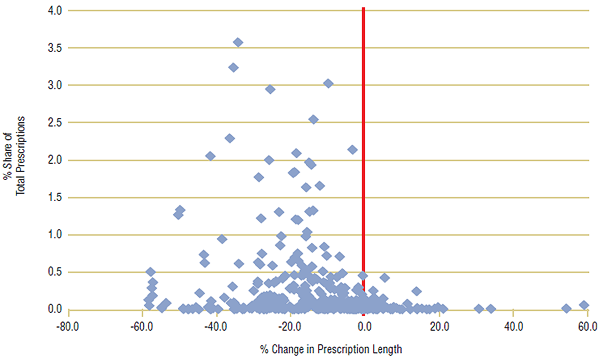
For this case study, a large number of ingredients (~350) were chosen from each of the three public drug plans with the steepest declines in prescription length (BC, ON, MB). Ingredients with the highest percent share of prescriptions were selected, and data was limited to oral solid forms (pills and tablets) to ensure consistency of measurement. For the analysis, the average day supply of each ingredient for the first period (2001/02) was compared with the second period (2007/08), and the percent change was calculated. A scatter plot for each public drug plan is shown in Figures 5a–5c, with percent share of total prescriptions plotted against percent change in prescription length. A centered red line is displayed as a visual aide to help identify ingredients with declining prescription length, left of the line.
The analysis showed that the average prescription length declined for a large percentage of ingredients in all three provinces. In British Columbia, day supply per claim declined in 94% of ingredients, while in Ontario, 92% of ingredients had shorter prescription lengths in 2007/08 than in 2001/02. There were similar findings for Manitoba, where 82% of ingredients declined in prescription length.
In all three public drug plans, ingredients with the greatest market shares had substantial declines in prescription length. In British Columbia, the three leading ingredients by prescription share—Ramipril (4.1%), Levothyroxine (3.5%) and Atorvastatin (3.3%)—declined by an average 40.4% from 2001/02 to 2007/08. There were similar results for the other two public drug plans, with the top three ingredients declining by 30.5% in Ontario and 27.1% in Manitoba.
Thus, changes in prescription length occurred across the majority of the ingredients, including those with the largest share of claims.
Figure 5a. Percent change in prescription length by ingredient, British Columbia, 2001/02 to 2007/08
| Ingredient |
Therapeutic class/ main indication |
% Share of total prescriptions, 2001/02 |
% Share of total prescriptions, 2007/08 |
Average day supply per prescriptions, 2001/02 |
Average day supply per prescriptions, 2007/08 |
% Change in prescription length, 2001/02 to 2007/08 |
| Ramipril |
Hypertension |
2.3% |
4.1% |
63 |
38 |
-39.8% |
| Levothryroxine |
Thyroid therapy |
2.4% |
3.5% |
68 |
39 |
-42.8% |
| Atorvastatin |
Cholesterol |
1.8% |
3.3% |
73 |
45 |
-38.5% |
| Quetiapine |
Antipsychotic |
0.4% |
3.2% |
20 |
12 |
-38.3% |
| Furosemide |
Hypertension |
1.6% |
2.8% |
47 |
24 |
-49.2% |
| Hydrochlorothiazide |
Hypertension |
2.2% |
2.7% |
74 |
48 |
-35.4% |
| Metformin |
Diabetes |
1.4% |
2.7% |
64 |
39 |
-40.0% |
| Citalopram |
Antidepressant |
0.8% |
2.5% |
35 |
22 |
-38.8% |
| Venlafaxine |
Antidepressant |
1.0% |
2.1% |
35 |
24 |
-30.8% |
| Clonazepam |
Epilepsy and anxiety |
1.4% |
2.0% |
23 |
15 |
-32.6% |
Figure 5b. Percent change in prescription length by ingredient, Ontario, 2001/02 to 2007/08
| Ingredient |
Therapeutic class/ main indication |
% Share of total prescriptions, 2001/02 |
% Share of total prescriptions, 2007/08 |
Average day supply per prescriptions, 2001/02 |
Average day supply per prescriptions, 2007/08 |
% Change in prescription length, 2001/02 to 2007/08 |
| Atorvastatin |
Cholesterol |
1.8% |
4.3% |
61 |
42 |
-31.4% |
| Ramipril |
Hypertension |
2.0% |
3.8% |
50 |
37 |
-26.2% |
| Levothyroxine |
Thyroid therapy |
2.5% |
3.4% |
53 |
35 |
-34.0% |
| Furosemide |
Hypertension |
2.4% |
3.3% |
35 |
21 |
-40.7% |
| Metformin |
Diabetes |
1.5% |
2.8% |
46 |
35 |
-23.8% |
| Amlodipine |
Hypertension |
1.5% |
2.7% |
53 |
38 |
-28.0% |
| Hydrochlorothiazide |
Hypertension |
2.2% |
2.4% |
61 |
46 |
-24.2% |
| Metoprolol |
Hypertension |
1.3% |
2.2% |
48 |
32 |
-33.5% |
| Citalopram |
Antidepressant |
0.5% |
2.1% |
28 |
18 |
-36.8% |
| Lorazepam |
Anxiety |
2.2% |
2.0% |
30 |
24 |
-19.3% |
Figure 5c. Percent change in prescription length by ingredient, Manitoba, 2001/02 to 2007/08
| Ingredient |
Therapeutic class/ main indication |
% Share of total prescriptions, 2001/02 |
% Share of total prescriptions, 2007/08 |
Average day supply per prescriptions, 2001/02 |
Average day supply per prescriptions, 2007/08 |
% Change in prescription length, 2001/02 to 2007/08 |
| Furosemide |
Hypertension |
2.7% |
3.6% |
37 |
24 |
-34.8% |
| Levothyroxine |
Thyroid therapy |
1.9% |
3.2% |
48 |
31 |
-36.0% |
| Atorvastatin |
Cholesterol |
1.5% |
3.0% |
43 |
38 |
-10.4% |
| Metoprolol |
Hypertension |
1.5% |
2.9% |
42 |
31 |
-26.1% |
| Metformin |
Diabetes |
1.5% |
2.5% |
40 |
34 |
-14.4% |
| Risperidone |
Antipsychotic |
1.2% |
2.3% |
26 |
16 |
-37.0% |
| Omeprazole |
Antacid |
2.2% |
2.1% |
34 |
32 |
-3.8% |
| Lorazepam |
Anxiety |
2.0% |
2.1% |
31 |
25 |
-19.0% |
| Acetaminophen |
Pain treatment |
1.8% |
2.1% |
22 |
13 |
-42.3% |
| Citalopram |
Antidepressant |
0.7% |
2.0% |
31 |
23 |
-26.4% |
Case Study 2: Comparison of Prescription Length for Alberta, Manitoba, New Brunswick and Nova Scotia, 2007/08
This case study compares prescription length across four public drug plans: Alberta, Manitoba, New Brunswick and Nova Scotia. These public drug plans were selected for two reasons: (i) they have day supply data of sufficient quality; and (ii) data for prescription numbers of the required granularity is available from CIHI's database.
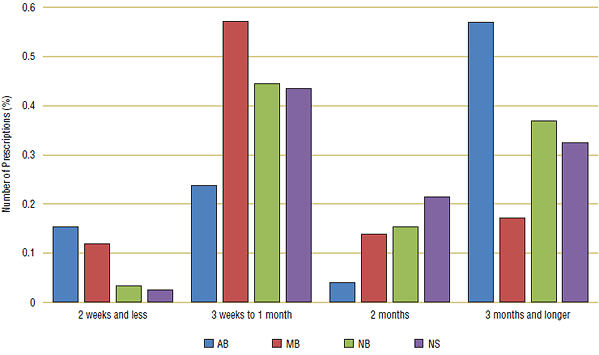
Two leading WHO ATC therapeutic drug classes were examined: drugs that treat high cholesterol (C10) and drugs that treat hypertension (C09). (See Appendix 3 for a complete list of ingredients used for analysis). These medications treat chronic conditions, and so a substantial proportion of these prescriptions should have a longer day supply of around three months. In Figure 6a, distributions for 2007/08 are grouped by prescription length: three months or longer, two months, three weeks to one month and two weeks or less.
In 2007/08, only one public drug plan—Alberta (blue)—had a substantial proportion of prescription lengths of three months or longer for both cholesterol and hypertension drugs. In Manitoba (red) the majority of prescriptions were dispensed as a one month supply, while in New Brunswick (green) and Nova Scotia (purple) prescription lengths were more evenly distributed between one and three months.
Figure 6a. Comparison of prescription length for cholesterol drugs (C10), 2007/08
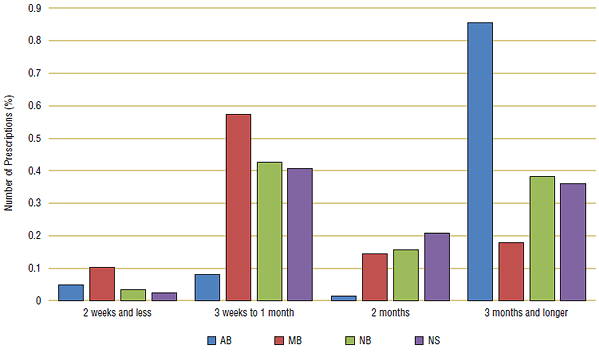
Figure 6b. Comparison of prescription length for hypertension drugs (C09), 2007/08
5 Cost Driver Models
This section presents two cost-driver models that decompose the growth of dispensing fee expenditure. The first is a two-factor model that decomposes average annual growth from 2001/02 to 2007/08 into a dispensing fee effect and a prescription number effect.8 The second three-factor model includes a prescription length effect along with the two original factors. See Appendix 1B and 1C for general formulas used to calculate the two- and three- factor models.
5.1 Two-Factor Model: Dispensing Fee and Prescription Number Effects
The two-factor model decomposes average annual growth in dispensing fee expenditure for 2001/02 to 2007/08 into a dispensing fee effect and a prescription number effect.9 These effects are defined as follows:
Dispensing fee effect (blue bar)—measures the change in growth in annual expenditure attributed to changes in the average dispensing fee
Prescription number effect (red bar)—measures the change in growth in annual expenditure attributed to changes in the number of prescriptions
The results in Figure 7 show that nationally the prescription number effect (8.2%) contributed over three times as much to expenditure growth as the dispensing fee effect (2.4%). However, there was considerable variation across Canada. In Ontario, for example, most of the annual growth was attributed to the prescription number effect: 12.0% of a total 13.7%.
Figure 7. Dispensing fee cost drivers: dispensing fee and prescription number effects, average annual compound growth, 2001/02 to 2007/08

This is also the case for New Brunswick and the NIHB, where 5.6% and 9.7% of a total 6.2% and 12.4%, respectively, of the annual growth in expenditure was the result of the prescription number effect. In four other public drug plans (BC, SK, MB and PEI), prescription growth was over triple the dispensing fee effect. While in Alberta and Nova Scotia, the fee effects are relatively more significant than in the other plans. These results are consistent with statistical analysis in Tables 2 and 3.
5.2 Three-Factor Model: Dispensing Fee, Prescription Number and Prescription Length Effects
Figure 8 reports on a second cost-driver model that includes a prescription length effect along with the two original factors. The three-factor model decomposes average annual growth in dispensing fee expenditure for 2001/02 to 2007/08 into a dispensing fee effect, a prescription number effect and a prescription length effect.10 These effects are defined as follows:
Dispensing Fee Effect (blue bar)—measures the change in growth in annual expenditure attributed to changes in the average dispensing fee
Prescription Number Effect (red bar)—measures the change in growth in annual expenditure attributed to changes in the number of prescriptions
Prescription Length Effect (green bar) — measures the change in growth in annual expenditure attributed to changes in the prescription length, as measured by drug quantity per prescription11
Figure 8. Dispensing fee cost drivers: dispensing fee, prescription number and prescription length effects, average annual compound growth, 2001/02 to 2007/08

The results are consistent with the analysis in Section 4: public drug plans with the sharpest declines in prescription length (BC, ON and MB) also had the largest prescription length effects. In British Columbia, 6.2% of an average 12.3% annual growth in fee expenditure can be attributed to declines in prescription length, while in Ontario 4.5% of their 13.6% annual growth are the result of shorter prescriptions. Manitoba (3.6%), Prince Edward Island (1.8%) and NIHB (1.5%) also had positive prescription length effects.
In three public drug plans—Alberta, Nova Scotia and New Brunswick—prescription length increased from 2001/02 to 2007/08 (see Section 4), therefore, the expectation is that the effect would dampen growth in dispensing fee expenditures. This was the case with the prescription length effect acting to lower growth by an average 1.2% per year in Alberta, 1.3% Nova Scotia and 0.6% in New Brunswick. In Saskatchewan, prescription length also had a slight dampening effect.
8 This study focuses on dispensing fees and markup: any possible impact on the total cost from reduced waste due to shorter prescription lengths is not considered in the cost-driver model.
9 The cross effect is an interaction term that was redistributed to the other two effects for simplicity.
10 This three-factor model has four cross effects, which were redistributed to the other three factors for simplicity.
11 Drug quantity was used as a proxy for day supply due to data quality issues (see Section 2).
6 Markup and Pharmacy Reimbursement
Although the focus of this study is on dispensing fees, when calculating the total amount reimbursed to pharmacies, markup on drug cost must also be considered. A markup, or up-charge, is usually a pre-set percent of the acquisition or wholesale cost of the drug. A general definition of markup is the difference between the wholesale cost of a good and its selling price: a markup is added to the wholesale (or acquisition) cost incurred by the producer to create a profit (Pradhan 2007).
This section first examines the policies in each public drug plan for markup and then considers markup in the context of the total amount reimbursed by public drug plans to pharmacies: the markup plus dispensing fee. For background, see Appendix 5, Table A5.3 for a detailed description of public drug plan markup policies from 2001–2008. Section 2 gives a description of markup data sources and validation.
6.1 Markup Policy
Markup policies vary widely across public drug plans. Several public drug plans allowed a markup during the study period (2001 to 2008), while others did not. For those public drug plans allowing a markup, some reimbursed it for the entire period, while others allowed the charge for a few years and then discontinued it. Ontario, for example, had a markup for the entire period, from 2001 to 2008, as did NIHB,12 Saskatchewan and Prince Edward Island. By comparison, British Columbia had a markup in 2003, while Manitoba discontinued their markup in 2006. Nova Scotia and Alberta had a markup for a limited number of products or supplies: in Nova Scotia a markup was allowed for injectable products and ostomy supplies, while in Alberta there was a markup for out-of-province direct bill claims.
The type of markup also varied across Canada. Ontario, for example, allowed a set percentage across all drugs: 10% from 2001 to 2006, which was then lowered to 8% in 2007. By comparison, Saskatchewan varied the markup with the drug cost per prescription, while Prince Edward Island had a 7.5% markup for most programs when the drug cost was over $45. This increased to 8.5% in 2007 for prescriptions with an ingredient cost over $53.
6.2 Pharmacy Reimbursement Analysis
This section provides an analysis of markup in the context of the total amount reimbursed to pharmacies, that is, the pharmacy reimbursement defined as the dispensing fee plus markup. Dollar amounts reimbursed are examined first, followed by percent share of prescription cost.
When actual dollar amounts per prescription are considered (see Figure 9), adding markup to the dispensing fee tended to equalize pharmacy reimbursement across jurisdictions. With a few exceptions, the average dispensing fee across Canada ranged from $8 to $10. The addition of the markup brought Prince Edward Island and Ontario within this range. British Columbia ($7.32) and Alberta ($12.73) had the lowest and the highest pharmacy reimbursement per prescription, respectively.
Figure 9. Average dispensing fee and markup, 2007/08

Including markup as a share of the total prescription cost resulted in higher than average pharmacy reimbursements in Saskatchewan and Ontario (see Figure 10). For example, Saskatchewan's markup of 6.9% of prescription cost increased its total pharmacy reimbursement to 23.8%, while Ontario's markup of 6.1% of prescription cost increased their pharmacy reimbursement share to 23.2%. Because the percent share factors in prescription length, this brings pharmacy reimbursement in British Columbia and Alberta more in-line with other public drug plans: between 15% and 20%.
Figure 10. Percent share of dispensing fee and markup, 2007/08

12 NIHB is a Canada-wide federal public drug plan, and its markup varies from province to province as per the provincial plans.
7 Conclusion
One of the main findings of this study is that growth in prescription numbers is a major driver of expenditure growth for dispensing fees. Although prescription numbers increased primarily because of rising demand for drugs, the study identified changes in prescription length as an important consideration in British Columbia, Manitoba and Ontario. Along with prescription numbers, the average dispensing fee reimbursed per prescription was a driver in some Western provinces, but less so in other jurisdictions. Ontario and New Brunswick, for example, had stable average dispensing fees over the study period. The study found that including markup results in a significantly higher pharmacy reimbursement as a share of prescription cost in two public drug plans: Saskatchewan and Ontario.
8 Bibliography
Alberta Blue Cross. 2006. Alberta Blue Cross Pharmacy Agreement: Schedule of Prices—Historical Document. Edmonton, Alberta: Alberta Blue Cross.
BC PharmaCare. 2008. BC PharmaCare Newsletter. December 22, Edition 08-012. Available from: http://www.health.gov.bc.ca/pharme/newsletter-08-012news.pdf
BC PharmaCare. 2010. BC PharmaCare Newsletter. July 22, Edition 10-008. Available from: http://www.health.gov.bc.ca/pharmacare/newsletter/10-008news.pdf
Canadian Pharmacists Association. 2001–2008. Provincial Drug Benefit Programs. Ottawa, Ont.: Canadian Pharmacists Association.
Carroll NV. 2006. Financial Management for Pharmacists. Philadelphia: Lippincott, Williams and Wilkins.
Non-Insured Health Benefits Program. 2007. Annual Report 2006/2007. Ottawa, Ont.: Health Canada.
Pradhan S. 2007. Retailing Management. Noida, India: Tata McGraw-Hill.
Appendix 1: Methodology and Formulas
A. Dispensing Fee and Day Supply Calculations
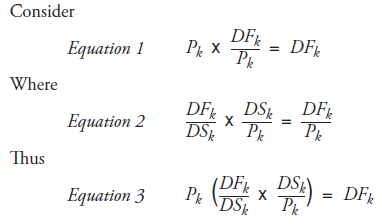
DFk : Total dispensing fee expenditure in period k
Pk : Total number of prescriptions in period k
DSkk : Total number of day supply in period k
DFk /Pk : Average dispensing fee per prescription in period k
DFk /DSk : Average dispensing fee per day supply in period k
DSk /Pk : Average day supply per prescription in period k
B. General Formula for Two-Factor Cost-Driver Model
The following general formula for a two-factor model decomposes average annual growth in dispensing fee expenditure (2001/02 to 2007/08) into a dispensing fee effect and a prescription number effect.13
Total change in dispensing fee expenditure =
Total dispensing fee expenditure in last period DFl – Total dispensing fee expenditure in first period DFf =

where
DFk : Total dispensing fee expenditure in period k
Pk : Total number of prescriptions in period k
ADFk: Average dispensing fee per prescription in period k
Subscript l : Last period
Subscript f : First period
 Summation for all drugs,14 form and dose level
A final step was to calculate the average annual growth rate for each factor using the formula in Appendix 1D.
C. Three-Factor Cost-Driver Model
Total change in dispensing fee expenditure =
Total dispensing fee expenditure in last period DFl – Total dispensing fee expenditure in first period DFf =
A final step was to calculate the average annual growth rate for each factor using the formula in Appendix 1D.
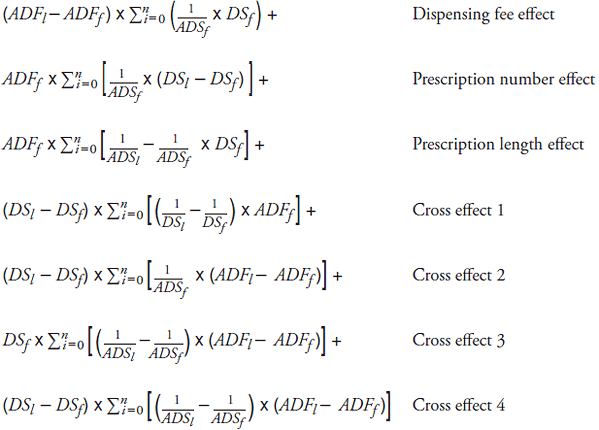
where
DFk : Total dispensing fee expenditure in period k
DSk : Total number of day supply in period k
ADFk : Average dispensing fee per prescription in period k
ADSk : Average day supply per prescription in period k
Subscript l : Last period
Subscript f : First period
 : Summation for all existing drugs, form and dose level
D. General Analysis: Average Annual Growth Rate

where
AAGR : Average Annual Growth Rate
DFl : Dispensing fee expenditure in the last year of period
DFf : Dispensing fee expenditure in the first year of period
t : Length of time in years between the initial year and the final year
Appendix 2: Glossary of Terms
Day Supply: Day supply is the number of days a medication is supplied to a patient for a prescription. Pharmacists use day supply to measure prescription length.
Dispensing Fee: Dispensing fees are fees for services a pharmacist provides in filling a prescription. This includes dispensing drug products, patient counselling, providing drug or other information to physicians, and related administrative costs.
Beneficiary: A beneficiary is an eligible person who had at least one claim during a fiscal year. Public drug plans establish eligibility requirements for each program: the most common relate to age (such as 65 years or older for seniors programs), residency and income.
Drug Identification Number (DIN): The Drug Identification Number (DIN) is a unique number assigned by Health Canada when it approves a drug for sale in Canada. A drug is identified uniquely by its brand name, active ingredient dosage, form and strength.
Markup: A markup is the difference between the cost a pharmacy pays for a drug product—usually a wholesale price—and its actual selling or retail price.
Public Drug Plan/Program: This is a general term used to describe drug plans or programs that are administered by provincial, territorial or federal governments. Examples include the Ontario Drug Benefit Program and the New Brunswick Prescription Drug Program.
Total Prescription Expenditure: The total prescription expenditure is the sum of the total dollar amount reimbursed for claims accepted by a plan/program as eligible for payment to beneficiaries. Generally, prescriptions itemize reimbursements for the drug, dispensing fee and markup.
Appendix 3: List of Ingredients for Prescription Length Case Studies
Table A3.1. List of cholesterol and hypertension ingredients
| Cholesterol ingredients (C10) |
Hypertension ingredients (C09) |
| Ingredient |
ATC number |
Ingredient |
ATC number |
| Atorvastatin |
C10AA05 |
Benazepril hydrochloride |
C09AA07 |
| Bezafibrate |
C10AB02 |
Candesartan cilexetil |
C09CA06 |
| Cholestyramine resin |
C10AC01 |
Captopril |
C09AA01 |
| Colestipol hydrochloride |
C10AC02 |
Cilazapril |
C09AA08 |
| Ezetimibe |
C10AX09 |
Enalapril |
C09AA02 |
| Fenofibrate |
C10AB05 |
Eprosartan |
C09AA02 |
| Fluevastatin |
C10AA04 |
Fosinopril |
C09AA09 |
| Gemfibrozil |
C10AB04 |
lrbesartan |
C09AA04 |
| Lovastatin |
C10AA02 |
Lisinopril |
C09AA03 |
| Nicotinic acid |
C10AD02 |
Losartan |
C09CA01 |
| Pravastatin sodium |
C10AA03 |
Perindopril |
C09AA04 |
| Rosuvastatin |
C10AA07 |
Quinapril |
C09AA06 |
| Simvastatin |
C10AA01 |
Ramipril |
C09AA05 |
| — |
— |
Telmisartan |
C09CA07 |
| — |
— |
Trandolapril |
C09AA10 |
| — |
— |
Valsartan |
C09CA03 |
Appendix 4. Dispensing Fee Expenditures, Markup Expenditures and Prescription Numbers by Drug Plan, 2001/02 to 2007/08
Table A4.1. Total dispensing fee expenditure ($ millions) by public drug plan, 2001/02 to 2007/08
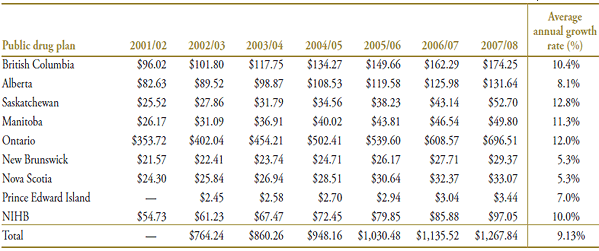
Table A4.2. Markup expenditure ($ millions) by public drug plan, 2001/02 to 2007/08
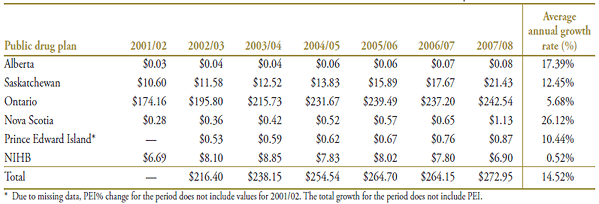
Table A4.3. Prescription numbers (millions) by public drug plan, 2001/02 to 2007/08
Appendix 5: Overview of Public Drug Plan Dispensing Fee Reimbursement Regimes
Table A5.1. Dispensing fee reimbursement regimes by public drug plan, 2001–2008
| Public drug plan |
Dispensing fee reimbursement regime |
| British Columbia |
In British Columbia, dispensing fees were not to exceed the usual and customary fee charged for any prescription sold in the province. With special approval, BC PharmaCare would accept reimbursement fees that did not exceed the provincial average by more than 15%. A pharmacist charging a dispensing fee in excess of the provincial average plus 15% could petition PharmaCare directly for payment. Between 2001 and 2007, the maximum allowable fee increased from $7.60 to $8.60. That fee remained unchanged to January 2009. |
| Alberta |
Alberta used a variable-rate schedule of reimbursement based on the actual acquisition cost of the medication. Alberta also had an additional allowance to cover inventory costs. The top row of the table shows the range of acquisition costs, while the rows below are the corresponding amounts that were reimbursed from 2001 to 2007. Alberta reimbursed both a dispensing fee and inventory allowance, so the values shown are the sum of both. Fee reimbursements until March 31, 2010, remained unchanged from 2007 levels.
Reimbursed prices from 2001 to 2006 are from the Alberta Blue Cross Pharmacy Agreement: Schedule of Prices— Historical Document (Alberta Blue Cross 2006). 2007 data is from the Provincial Drug Benefit Programs (Canadian Pharmacists Association 2001–2008).
|
| |
| Actual acquisition cost |
| |
$0 – $74.99 |
$75 – $149.99 |
$150 and over |
| |
Reimbursed dispensing fee + additional inventory allowance |
| Jan. 1, 2001 – Dec. 31, 2001 |
$10.10 |
$16.20 |
$24.00 |
| Jan. 1, 2002 – July 31, 2003 |
$10.10 |
$16.20 |
$24.00 |
| Aug. 1, 2003 – March 31, 2004 |
$10.40 |
$16.70 |
$24.70 |
| April 1, 2004 – March 31, 2005 |
$10.61 |
$17.02 |
$25.21 |
| April 1, 2005 – March 31, 2006 |
$10.93 |
$17.53 |
$25.97 |
| April 1, 2006 – Sept. 30, 2006 |
$10.93 |
$17.53 |
$25.97 |
| 2007 |
$10.93 |
$17.53 |
$25.97 |
Exceptions in Alberta for 2007 included fees for insulin and oral contraceptives—the prescription charge could not exceed the acquisition cost of the drug product times 5/3. For injectable drugs other than insulin, the same formula applied to a maximum of $100 more than the acquisition cost. For compounded prescriptions that required more than seven minutes of preparation, the additional charge could not exceed 75 cents per minute for each minute over seven. As current fees, they are unchanged.
|
| Saskatchewan |
Saskatchewan entered into an agreement with pharmacy proprietors regarding reimbursement for dispensing services. This included a maximum dispensing fee, which increased five times from 2001 to 2007: from $7.22 to $7.74 in March 2003, to $7.97 in September 2003, $8.21 in December 2005, $8.46 in October 2006, and $8.63 in October 2007. Fees did not change in 2008. |
| Manitoba |
Manitoba's Pharmacare Program's dispensing fees were unregulated: the fee reimbursed was equal to the amount charged by a pharmacist to a patient. This policy was in place from 2001 to 2008. |
| Ontario |
The Ontario Drug Benefit (ODB) Program reimbursed pharmacists at a dispensing fee that was capped at a maximum amount for each prescription filled. The cap increased twice between 2001 and 2007: from $6.47 in 2001 to $6.54 in 2003 and to $7.00 in 2006. The fee cap did not change between 2006 and 2009. ODB recipients were required to make a co-payment of up to a maximum of $2.00 or $6.11 per prescription depending on their program of eligibility. Ontario also reimbursed pharmacies for compounding drug ingredients. As of August 2008, the ODS reimbursed a maximum of two dispensing fees per medication per recipient per calendar month. Dispensers had to supply at one time the lesser of (i) the entire quantity of the listed drug product that was specified on the prescription to be dispensed at one time; or (ii) the maximum quantity permitted by ODBA Regulation. There was a list of exempted medications and special populations that were exempt. |
| New Brunswick |
New Brunswick established a variable-rate schedule of reimbursement for dispensing fees based on an average acquisition cost of the drug ingredient per claim. The schedule remained unchanged throughout the period 2001–2007.
| Average acquisition cost of drug ingredient per claim |
Maximum fee |
| $0 – $99.99 |
$8.40 |
| $100 – $199.99 |
$10.90 |
| $200 – $499.99 |
$16.00 |
| $500 – $999.99 |
$21.00 |
| $1,000 – $1,999.99 |
$61.00 |
| $2,000 – $2,999.99 |
$81.00 |
| $3,000 – $6,000 or more |
$101.00 to $161.00 |
For medications that required compounding, the maximum fee increased to $12.60 when the average acquisition cost per claim was under $100; rose to $16.35 between $100 and $199.99, and $17.00 when the average acquisition cost per claim was between $200 and $499.99. Above $499.99, there were no additional fees for compounding.
Effective January 1, 2009, New Brunswick's dispensing fee for claims with a drug ingredient cost between $0 and $99.99 increased to $8.90. There were proportional increases for other ingredient costs in the schedule.
|
| Nova Scotia |
Between 2001 and 2007, Nova Scotia maintained two caps or reimbursement limits on dispensing fees based on whether the medication was categorized as high cost or not. A high-cost medication is defined as one with a value over $145 per prescription or as a medication that requires compounding. For medications not classified as high cost, the cap increased from $9.17 to $10.12 from 2001 to August 1, 2007. For high-cost medications, the cap increased from $13.75 to $15.64 during this period. Nova Scotia had a special reimbursement for medications that were billed to residents of nursing homes and homes for special care, but never provided to the patient. A restocking fee of 20% of the value of the medication was allowed. From August 2007 to March 2010, the fee cap was $10.42. |
| Prince Edward Island |
| |
Children in Care, Financial Assistance, Quit Smoking and STD's |
Diabetes Control |
Seniors, Family Health Benefit, high-cost drugs |
Nursing home (monthly per resident capitation fee) |
| Fiscal year(s) |
Prescription |
Over the counter |
Compound |
Oral med. |
Insulin |
Test strips |
All |
All |
| 2001/02 – 2004/05 |
$7.00 |
$7.00 |
$7.00 |
$7.00 |
33 1/3% |
$7.00 |
NR |
$44.50 |
| 2005/06 |
$7.25 |
$3.75 |
$10.88 |
$7.25 |
33 1/3% |
$3.75 |
NR |
$45.83 |
| 2006/07 |
$7.50 |
$5.00 |
$11.25 |
$7.50 |
33 1/3% |
$5.00 |
NR |
$47.20 |
| 2007/08 |
$7.73 |
$11.25 |
$11.60 |
$7.73 |
33 1/3% |
$7.73 |
NR |
$48.63 |
NR = not regulated.
|
| NIHB |
NIHB reimbursed dispensing fees from 2001 to 2008. The fee schedule was determined by NIHB guidelines defined by the region. |
Table A5.2. Day supply policies by public drug plan, 2001–200815
| Public drug plan |
Day supply policy |
| British Columbia |
For short-term and first-time prescriptions, the day supply was not to exceed 30 days. On repeat prescriptions of maintenance drugs only, the maximum was 100 day supply. The exception was Plan B, which covered permanent residents of licensed long-term care facilities. The maximum day supply for this group was a month, commonly 35 days. BC PharmaCare did not reimburse medications required for extended absences. There were no significant changes to the policies from 2001 to 2007.
In February 2009, a new Frequency of Dispensing Policy took effect for BC PharmaCare.16 Under the policy, PharmaCare expected most long-term maintenance medications to be dispensed in a 100-day supply and short-term medications to be dispensed in quantities of up to 30 days, except in cases of medical necessity. If a patient required more frequent dispensing of medication, a physician or pharmacist had to document the patient's need.
|
| Alberta |
For the Alberta Health and Wellness programs, there was no regulation pertaining to the minimum number of day supply. The maximum was no more than 100 day supply. The Alberta Seniors and Community Supports (ASCS) program had guidelines that listed medications with a maximum day supply of either 31 or 100 days. Antibiotics were restricted to 14 days. Other exceptions to the maximum 100 day supply included drugs for the treatment of multiple sclerosis and autoimmune disorders. There were no significant changes to the policies from 2001 to 2008. |
| Saskatchewan |
Medications were supplied for 34 days except for drugs listed in either the Maintenance Drug Schedule, which were supplied for 100 days, or those on a special list of drugs that were supplied for two months. A pharmacist could provide less than a 100 day supply if requested by a patient or ordered by a physician. When the day supply was less than 34 days, pharmacists were encouraged to document the reasons on the prescription record. There were no significant changes to the policies from 2001 to 2008. |
| Ontario |
The Ontario Drug Benefit program set a maximum day supply of 100 days. An additional 100 day supply could be obtained if the person left the province for an extended period. For the first filling of a prescription, there was a restriction of 30 day supply. Subsequent fills could be made for up to 100 days, subject to authorization. For Trillium recipients, Ontario reimbursed the lesser of a 100 day supply or a quantity that extended up to 30 days after the end of eligibility. There were no significant changes to the policies from 2001 to 2007.
In August 2008, new regulations were enacted that stipulated that a maximum 100 day supply must be dispensed, except in certain cases, for example, if the prescriber directed a smaller quantity or if the dispenser determined that a patient was incapable of managing medications. Exceptions were Ontario Works recipients, for whom pharmacies had to dispense at one time the maximum quantity of a 35-day supply, and for trial prescriptions, which were dispensed for 30-day supply.
|
| New Brunswick |
New Brunswick set a maximum 100 day supply, with exceptions of a 35 day supply for narcotics, controlled drugs and benzodiazepines. The 35-day limit was a Regulation to the Pharmacy Act and applied to all residents of New Brunswick, not just to New Brunswick Prescription Drug Program beneficiaries. The Prescription Drug Program set quantity limits for some drugs. There were no significant changes to the policies from 2001 to 2008. |
| Prince Edward Island |
Day supply was typically limited to a maximum of 30 days for most drugs. Exceptions included maintenance drugs: 60 days; smoking cessation drugs: 7 to 14 days; oral medication for diabetes patients: 90 days; and multiple sclerosis treatments: 32 days.17 There were no significant changes to the policies from 2001 to 2008. |
| Nova Scotia |
Except under certain circumstances, pharmacists filled prescriptions to a maximum of 100 days and a minimum of 28 days. Nova Scotia did not pay multiple dispensing fees when the quantity dispensed was less than the quantity prescribed.18 There were no significant changes to the policies from 2001 to 2008. |
| NIHB |
A Short-Term Dispensing Policy for chronic use drugs took effect in September 2008. Prior to that, NIHB had no restrictions on day supply per prescription. Under the policy, a pharmacist can either bill the NIHB once every 28 days for a dispensing fee, or the pharmacist can bill the NIHB every day if they choose, but only 1/28th of the dispensing fee will be paid. The policy is for medications used for chronic conditions published on a special list by the NIHB. |
Table A5.3. Public drug plan markup policies, 2001–200819
| Public drug plan |
Markup policy |
| British Columbia |
From 2004 to 2008, no markup was allowed on top of the actual acquisition cost of the drug ingredient. During these years, BC PharmaCare pricing reflected a maximum wholesale markup of 7% of the direct cost of the ingredient. In 2003, PharmaCare allowed a markup of 7% above the acquisition cost, while in 2001 and 2002 a markup was not allowed. |
| Alberta |
With one exception, Alberta did not have a markup on the cost of drug ingredients from 2001 to 2008. The exception was out-of-province direct bill claims, which were allowed an up-charge. |
| Saskatchewan |
From 2001 to 2008, Saskatchewan had a variable markup capped at $20 per prescription (under the agreement with pharmacy proprietors). The markup varied with the drug cost per prescription as follows:
| Drug cost per prescription |
Markup (% of drug cost) |
| $0–$6.30 |
30% |
| $6.31–$15.80 |
15% |
| $15.80–$200 |
10% |
| Over $200 |
$20 per prescription |
|
| Manitoba |
Manitoba had a markup on drug products from 2001 to 2006. From 2006 to 2008, the practice was discontinued, and a markup was no longer available above the actual acquisition cost from the manufacturer. |
| Ontario |
A 10% markup was allowed between 2001 and 2006, and then lowered to 8% in 2007. This remained unchanged in 2008. The markup was calculated by taking a percent of the Drug Benefit Price as set in the Ontario Drug Benefit Formulary.
As of 2006, cost-to-operator claims were no longer permitted.
|
| New Brunswick |
New Brunswick did not have a markup on the cost of drug ingredients from 2001 to 2008. |
| Nova Scotia |
With a few exceptions, Nova Scotia Pharmacare did not have a markup from 2001 to 2008. The exceptions were injectable products and ostomy supplies. |
| Prince Edward Island |
Prince Edward Island had a markup for its Seniors, Family Health Benefit and Multiple Sclerosis programs from 2003 to 2008. From 2003 to 2006, the markup was 7.5% of ingredient cost when the cost was $45 or more. In 2007, the markup increased to 8.5% of ingredient cost when the cost was $53 or more. This remained unchanged in 2008. |
| NIHB |
NIHB allowed markups from 2001 to 2008. The markup was determined by the NIHB Program Pharmacy Pricing Guidelines defined by the region. |
15 The main source for this table was the Provincial Drug Benefit Programs (Canadian Pharmacists Association 2001–2008). It was supplemented with information found on the websites of the individual public drug plans.
16 See the December 8, 2008, BC PharmaCare newsletter (BC Pharmacare 2008) for a summary of this policy.
17 PEl's current policy.
18 Nova Scotia's current policy.