NPDUIS CompassRx, 1st Edition
PMPRB Annual Public Drug Plan Expenditure Report 2012/13
The sustainability of prescription drug spending in Canada is an important issue for all Canadians. Although the annual rate of growth in expenditures has decreased over the last decade, reaching 1.2% in 2012 (CIHI 2014), this only represents part of the story. Behind the low net growth there are some underlying and competing drivers that influence overall expenditures. Identifying and measuring the impact of the individual factors that drive drug spending provides insight into the current trends and helps to anticipate future cost pressures and expenditure levels.
To inform the conversation and support evidence-based policy development, the PMPRB has released the first edition of the NPDUIS CompassRx report. This report provides a comprehensive analysis of the drivers of prescription drug expenditures in a number of select Canadian public drug plans. The analysis points towards the most important cost pressures, measures their impact on expenditure levels, and delves into the factors determining trends in costs, pricing and use of prescription drugs. The report also monitors major developments in drug approval, review, pricing and reimbursement in Canada. The first edition of the NPDUIS CompassRx analyzes the fiscal year 2012/13, which will provide a baseline for trends to be explored in future public drug plan expenditure reports.
The main data source for this report is the National Prescription Drug Utilization Information System Database, housed at the Canadian Institute for Health Information (CIHI). The results are presented for a select number of public drug plans with available data: Alberta, Saskatchewan, Manitoba, Ontario, New Brunswick, Nova Scotia, Prince Edward Island and Health Canada’s Non-Insured Health Benefits drug plan.
In 2012/13, prescription drug expenditures in the select public drug plans totaled $7.7 billion. This was composed of drug costs (74.4%), pharmacy dispensing costs (21.4%) and pharmacy markups (4.2%).
Prescription Drug Expenditure for select public drug plans (2012/13): $7.7 billion
This image breaks down the $7.7 billion in prescription drug expenditures for the select public drug plans in 2012/13 into its component parts. Drug costs represented 74.4% of the total expenditures, a decrease of 0.8% from the previous year. Dispensing costs represented 21.4% of the total expenditures, an increase of 5.8% from the previous year. Markups represented 4.2% of the total expenditures for 2012/13.
The select public drug plans paid 82.0% of the overall prescription drug expenditure level, with the remaining share being paid by the drug plan beneficiaries either out-of-pocket or through a third-party private insurer.
The analysis employs a cost-driver model to identify and measure the impact of each of the major drivers of change for the two main components of prescription drug expenditures: drug costs and dispensing fees. Four broad categories of effects are considered: demographic, volume, price and drug-mix effects.
Drug Cost Component
The rates of change in the drug cost component of prescription drug expenditures in public drug plans have been steadily declining in recent years, with overall cost levels decreasing in 2012/13 by 0.8% compared to 2011/12.
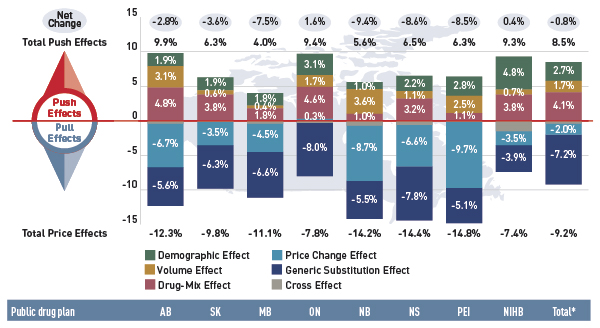
The low net rate of change was driven by opposing “push” (increasing) effects and “pull” (decreasing) effects which nearly off-set each other.
- The demographic, volume and drug-mix effects had an important “push” effect, and in the absence of generic savings, they would have increased drug cost levels by 8.5% in 2012/13.
- The generic price change and substitution effects had an important “pull” effect, and in the absence of other cost pressures, they would have decreased drug cost levels by 9.2% in 2012/13.
Figure 1 Drug cost drivers in 2012/13
This figure describes the factors that impacted the rates of change in drug cost in select public drug plans in Canada from 2011/12 to 2012/13.
Table
|
Alberta |
Saskatchewan |
Manitoba |
Ontario |
New Brunswick |
Nova Scotia |
Prince Edward Island |
Non-Insured Health Benefits |
Total select plans |
| Net change |
-2.8% |
-3.6% |
-7.5% |
1.6% |
-9.4% |
-8.6% |
-8.5% |
0.4% |
-0.8% |
| Total push effects |
9.9% |
6.3% |
4.0% |
9.4% |
5.6% |
6.5% |
6.3% |
9.3% |
8.5% |
| Demographic effect |
1.9% |
1.9% |
1.8% |
3.1% |
1.0% |
2.2% |
2.8% |
4.8% |
2.7% |
| Volume effect |
3.1% |
0.6% |
0.4% |
1.7% |
3.6% |
1.1% |
2.5% |
0.7% |
1.7% |
| Drug-mix effect |
4.8% |
3.8% |
1.8% |
4.6% |
1.0% |
3.2% |
1.1% |
3.8% |
4.1% |
| Price change effect |
-6.7% |
-3.5% |
-4.5% |
0.3% |
-8.7% |
-6.6% |
-9.7% |
-3.5% |
-2.0% |
| Generic substitution effect |
-5.6% |
-6.3% |
-6.6% |
-8.0% |
-5.5% |
-7.8% |
-5.1% |
-3.9% |
-7.2% |
| Total Price Effects |
-12.3% |
-9.8% |
-11.1% |
-7.8% |
-14.2% |
-14.4% |
-14.8% |
-7.4% |
-9.2% |
* Total across all plans analysed.
Data source: National Prescription Drug Utilization Information System Database, Canadian Institute for Health Information.
Push Effects
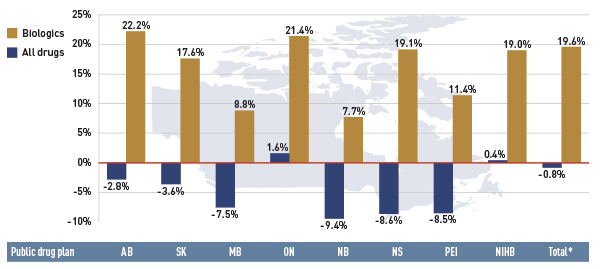
The drug-mix effect was the most important drug cost driver in the select public drug plans in 2012/13, pushing the expenditure upward by 4.1%. This was mainly the result of the increased use of high-cost drugs, including biologics. There was a tremendous growth in the cost of biologic drugs (19.6%) in 2012/13, contrasting with the low overall negative rate of change in drug cost (–0.8%) in the select public drug plans.
Figure 2 Rates of change in drug costs for biologic drugs compared with all drugs, all select public drug plans, 2011/12 to 2012/13
This bar graph describes the rates of change in biologic drug costs compared with all drugs for 2011/12 to 2012/13 in select public drug plans in Canada. There has been a large increase in the cost for biologics compared to the rate of change in overall drug cost (given in parenthesis). Alberta: 22.2% (-2.8%); Saskatchewan: 17.6% (-3.6%); Manitoba: 8.8% (-7.5%); Ontario: 21.4% (1.6%); New Brunswick: 7.7% (-9.4%); Nova Scotia: 19.1% (-8.6%); Prince Edward Island: 11.4% (-8.5%); Non-Insured Health Benefits: 19.0% (0.4%); Total select plans: 19.6% (-0.8%).
Data source: National Prescription Drug Utilization Information System Database, Canadian Institute for Health Information.
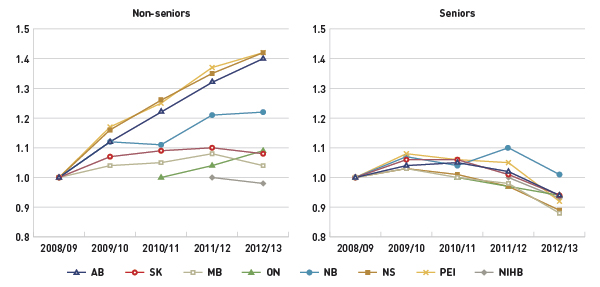
High-cost drugs are often used by a non-senior population. The increased use of these drugs in recent years has resulted in a marked growth in the average annual prescription cost for the non-senior beneficiary segment. At the same time, the average annual cost for seniors has dropped, as this population uses more drugs that have been impacted by generic competition and price reductions.
Figure 3 Index of the average annual prescription cost per beneficiary, non-seniors and seniors, select public drug plans, 2008/09 to 2012/13
This figure shows two complementary line graphs side-by-side. Using an index, the left graph describes the change over five years of the annual prescription cost per beneficiary for non-seniors, in select Canadian public drug plans:
Table
|
2008/09 |
2009/10 |
2010/11 |
2011/12 |
2012/13 |
| Alberta |
1.00 |
1.12 |
1.22 |
1.32 |
1.40 |
| Saskatchewan |
1.00 |
1.07 |
1.09 |
1.10 |
1.08 |
| Manitoba |
1.00 |
1.04 |
1.05 |
1.08 |
1.04 |
| Ontario |
– |
– |
1.00 |
1.04 |
1.09 |
| New Brunswick |
1.00 |
1.12 |
1.11 |
1.21 |
1.22 |
| Nova Scotia |
1.00 |
1.16 |
1.26 |
1.35 |
1.42 |
| Prince Edward Island |
1.00 |
1.17 |
1.25 |
1.37 |
1.42 |
| Non-Insured Health Benefits |
– |
– |
– |
1.00 |
0.98 |
The right graph shows the same index for seniors:
Table
|
2008/09 |
2009/10 |
2010/11 |
2011/12 |
2012/13 |
| Alberta |
1.00 |
1.04 |
1.05 |
1.02 |
0.94 |
| Saskatchewan |
1.00 |
1.06 |
1.06 |
1.01 |
0.94 |
| Manitoba |
1.00 |
1.03 |
1.00 |
0.98 |
0.88 |
| Ontario |
– |
– |
1.00 |
0.97 |
0.94 |
| New Brunswick |
1.00 |
1.07 |
1.04 |
1.10 |
1.01 |
| Nova Scotia |
1.00 |
1.03 |
1.01 |
0.97 |
0.89 |
| Prince Edward Island |
1.00 |
1.08 |
1.06 |
1.05 |
0.92 |
| Non-Insured Health Benefits |
– |
– |
– |
1.00 |
0.93 |
Data source: National Prescription Drug Utilization Information System Database, Canadian Institute for Health Information.
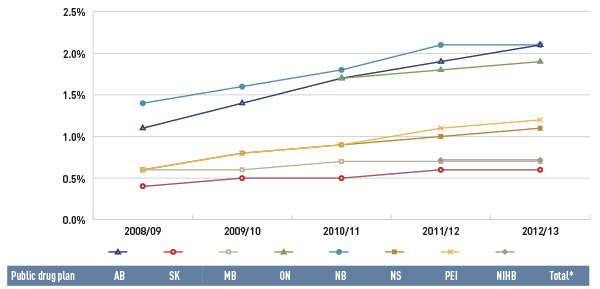
The share of active beneficiaries with over $10,000 in annual prescription costs has been increasing. These high-cost beneficiaries accounted for 1.3% of the drug plan population and 20.6% of the plan expenditures in 2012/13.
Figure 4 Share of patients with $10,000+ in annual prescription drug costs, select public drug plans, 2008/09 to 2012/13
This figure gives the share of patients with more than $10,000 in annual prescription drug costs in Canadian public drug plans from 2008/09 to 2012/13.
Table
|
Alberta |
Saskatchewan |
Manitoba |
Ontario |
New Brunswick |
Nova Scotia |
Prince Edward Island |
Non-Insured Health Benefits |
Total select plans |
| 2008/09 |
1.1% |
0.4% |
0.6% |
– |
1.4% |
0.6% |
0.6% |
– |
– |
| 2009/10 |
1.4% |
0.5% |
0.6% |
– |
1.6% |
0.8% |
0.8% |
– |
– |
| 2010/11 |
1.7% |
0.5% |
0.7% |
1.7% |
1.8% |
0.9% |
0.9% |
– |
– |
| 2011/12 |
1.9% |
0.6% |
0.7% |
1.8% |
2.1% |
1.0% |
1.1% |
0.7% |
1.5% |
| 2012/13 |
2.1% |
0.6% |
0.7% |
1.9% |
2.1% |
1.1% |
1.2% |
0.7% |
1.6% |
* Total results for the select public drug plans reported in this figure.
Data source: National Prescription Drug Utilization Information System Database, Canadian Institute for Health Information.
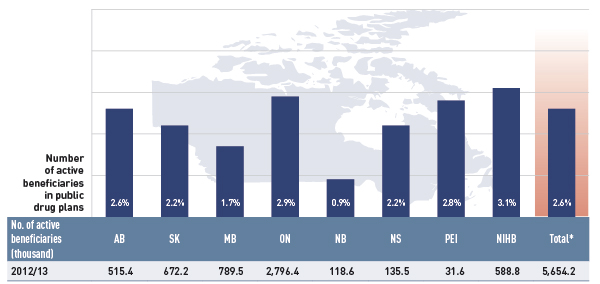
Demographic and volume effects are also important push effects. They reflect the aging of the population and expanded plan coverage, as well as the increased use of drugs. Figure 5 reports on the increase in the size of the beneficiary population from 2011/12 to 2012/13, which is the main contributor to the demographic driver in Figure 1.
Figure 5 Rate of change in beneficiary population, 2011/12 to 2012/13
This bar graph gives the rates of change in the beneficiary population for select public drug plans in Canada in 2012/13, along with the total number of active beneficiaries (thousands): Alberta: 2.6% (515.4); Saskatchewan: 2.2% (672.2); Manitoba: 1.7% (789.5); Ontario: 2.9% (2,796.4); New Brunswick: 0.9% (118.6); Nova Scotia: 2.2% (135.5); Prince Edward Island: 2.8% (31.6); Non-Insured Health Benefits: 3.1% (588.8); total for all plans: 2.6% (5,654.2).
Data source: National Prescription Drug Utilization Information System Database, Canadian Institute for Health Information.
Pull Effects
Generic substitution and generic price reductions resulted in important savings in the select public drug plans in 2012/13, pulling the drug costs downward by 7.2% and 2.0%, respectively. The generic substitution effect is the result of a trend commonly referred to as the ‘patent cliff’. Recently, a number of top-selling brand-name drugs reached the end of their patent life and were subject to generic competition for the first time. This has translated into an increase in the market share for generics, which accounted for 62.3% of all prescriptions in the public plans analyzed in 2012/13.
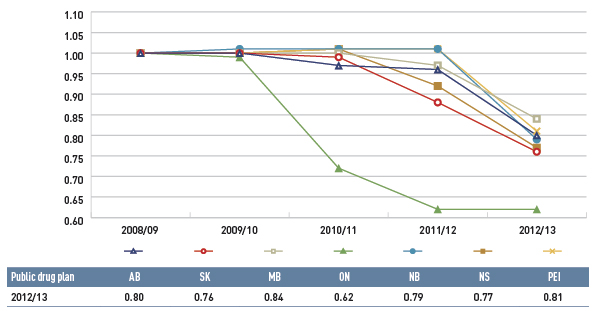
The price change effect is the result of the recent generic pricing policies that were implemented by a number of provinces. Figure 6 shows a trend of generic price reductions in recent years in public plans. There was a rapid decline in generic drug prices in Ontario starting in 2010/11, and a more gradual decline in 2012/13 for the other plans. These changes reflect the timing of the introduction of the generic price reforms. In 2012/13, the average generic price reductions ranged from 38% to 16%, depending on the province.
Figure 6 Average unit cost index for generic drugs, select public drug plans, 2008/09 to 2012/13
This line graph describes the change over five years (from 2008/09 to 2012/13) in the average unit cost for generic drugs in select Canadian public drug plans. The results are shown as an index. There was a rapid decline in drug prices for Ontario starting in 2010/11, and a more gradual decline starting in 2012/13 for other plans.
Table
|
2008/09 |
2009/10 |
2010/11 |
2011/12 |
2012/13 |
| Alberta |
1.00 |
1.00 |
0.97 |
0.96 |
0.80 |
| Saskatchewan |
1.00 |
1.00 |
0.99 |
0.88 |
0.76 |
| Manitoba |
1.00 |
1.00 |
1.00 |
0.97 |
0.84 |
| Ontario |
1.00 |
0.99 |
0.72 |
0.62 |
0.62 |
| New Brunswick |
1.00 |
1.01 |
1.01 |
1.01 |
0.79 |
| Nova Scotia |
1.00 |
1.00 |
1.01 |
0.92 |
0.77 |
| Prince Edward Island |
1.00 |
1.00 |
1.01 |
1.01 |
0.81 |
Data source: National Prescription Drug Utilization Information System Database, Canadian Institute for Health Information.
Dispensing Fee Component
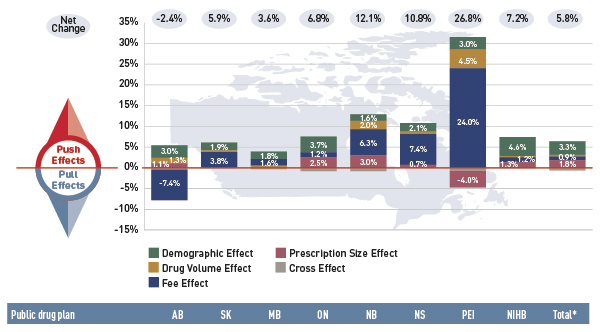
Dispensing fee expenditures have been increasing in recent years in most plans, with the overall fee levels growing in 2012/13 by 5.8% compared to 2011/12.
- As Figure 7 suggests, the rate of change in dispensing fees was generally driven by a growth in dispensing fee levels; an increase in the size and age of the active beneficiary population; a higher use of drugs; and a trend towards shorter prescription sizes in some provinces.
Figure 7 Dispensing fee drivers in 2012/13
This bar graph describes the factors that impacted the rates of change in dispensing fee expenditures in select public drug plans in Canada from 2011/12 to 2012/13. It shows the percent change for each public drug plan.
Push and pull effects
|
Alberta |
Saskatchewan |
Manitoba |
Ontario |
New Brunswick |
Nova Scotia |
Prince Edward Island |
Non-Insured Health Benefits |
Total select plans |
| Net change |
-2.4% |
5.9% |
3.6% |
6.8% |
12.1% |
10.8% |
26.8% |
7.2% |
5.8% |
| Demographic effect |
3.0% |
1.9% |
1.8% |
3.7% |
1.6% |
2.1% |
3.0% |
4.6% |
3.3% |
| Drug volume effect |
1.3% |
0.4% |
0.0% |
0.1% |
2.0% |
0.6% |
4.5% |
0.3% |
0.4% |
| Fee effect |
-7.4% |
3.8% |
1.6% |
1.2% |
6.3% |
7.4% |
24.0% |
1.2% |
0.9% |
| Prescription size effect |
1.1% |
-0.1% |
0.5% |
2.5% |
3.0% |
0.7% |
-4.0% |
1.3% |
1.8% |
A cross effect that results from the interaction between the individual effects is also shown, but no precise value is given.
* Total across all plans analyzed.
Data source: National Prescription Drug Utilization Information System Database, Canadian Institute for Health Information.
Canadian Institute for Health Information (CIHI). 2014.
National Health Expenditure Trends, 1975 to 2014. Ottawa, ON, page 137.
Available from: http://www.cihi.ca/web/resource/en/nhex_2014_report_en.pdf (Accessed March 2015)
The PMPRB protects and informs Canadians by ensuring that the prices of patented medicines sold in Canada are not excessive and by reporting on pharmaceutical trends.
The National Prescription Drug Utilization Information System (NPDUIS) is a partnership between the PMPRB and the Canadian Institute for Health Information (CIHI). NPDUIS provides policy makers and drug plan managers with information and insights on trends in prices, utilization and costs.