Cost Pressures in the Canadian Hospital Drug Market, 2006–2014
PDF - 373 kb
The sale of drugs dispensed in hospitals represents a relatively small component of the Canadian pharmaceutical market (13%), but is nonetheless an emerging market segment. The rates of growth in drug expenditures for in-patient and out-patient settings in Canada are analyzed in this study and compared to foreign markets, with a focus on the impact of high-cost drugs.
The analysis provides policy makers with insight into the cost pressures in the Canadian hospital market and illustrates how it compares internationally to the seven Patented Medicine Prices Review Board comparator countries (PMPRB7: France, Germany, Italy, Sweden, Switzerland, the United Kingdom and the United States).
Key Findings
1. Canada has a relatively small hospital sector compared to other foreign markets.
While the hospital market share in terms of drug use is fairly small in Canada (4.4%), it represents a much larger share in terms of sales (13%), indicative of the high cost of the drugs predominantly used in hospitals. The national sales for drugs dispensed in hospitals mounted to $2.6 billion in 2014.
Section 1
Click on image for larger view
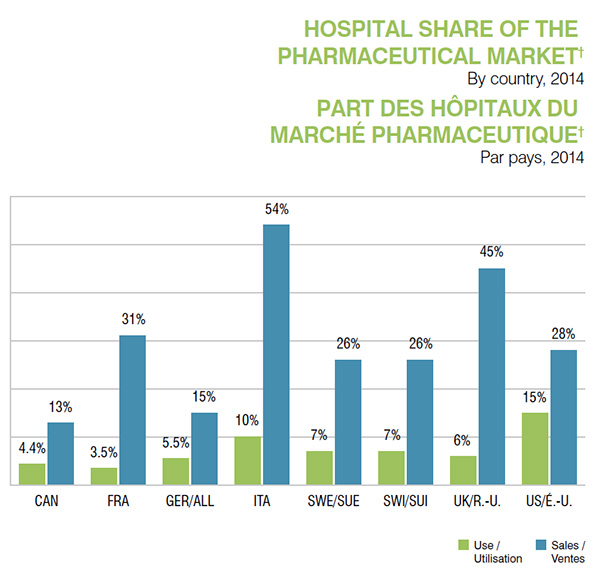
Figure description
This bar graph gives the share of use and sales for the hospital market in Canada and the PMPRB comparator countries in 2014.
Share of sales
Canada: 13%; France: 31%; Germany: 15%; Italy: 54%; Sweden: 26%; Switzerland: 26%; United Kingdom: 45%; United States: 28%.
Share of use
Canada: 4.4%; France: 3.5%; Germany: 5.5%; Italy: 10%; Sweden: 7%; Switzerland: 7%; United Kingdom: 6%; United States: 15%.
2. International variations reflect differences in approaches to drug delivery in out-patient and in-patient settings.
Particular drugs may be available in some countries primarily through the hospital sector, while in others through the retail sector. For instance, in Italy, antivirals that are used in hospitals account for 5% of the total pharmaceutical market; in Canada, these drugs are predominantly dispensed through the retail market.
Section 2
Click on image for larger view
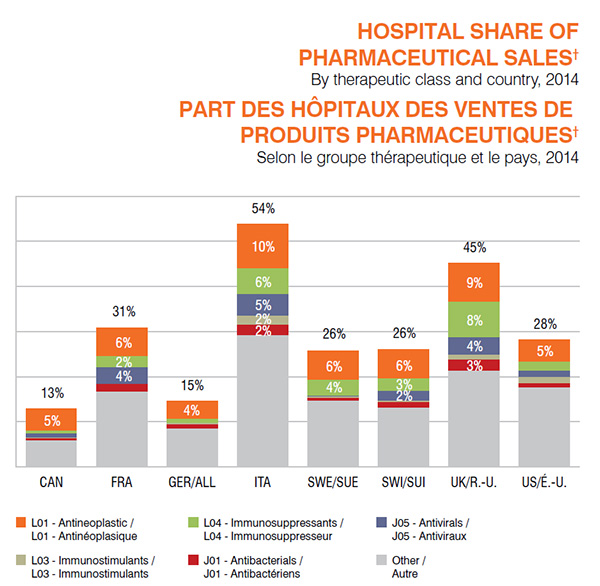
Figure description
This bar graph depicts the hospital share of pharmaceutical sales for Canada and the PMPRB comparator countries in 2014. Each bar represents the total share of sales for each country and is sub-divided into major therapeutic classes.
| |
Canada |
France |
Germany |
Italy |
Sweden |
Switzerland |
United Kingdom |
United States |
| Hospital market share of total sales |
13% |
31% |
15% |
54% |
26% |
26% |
45% |
28% |
| L01 - Antineoplastic |
5.0% |
6.4% |
4.0% |
9.9% |
6.5% |
6.5% |
8.7% |
4.9% |
| L04 - Immunosuppressants |
0.5% |
2.5% |
0.9% |
5.7% |
3.6% |
2.7% |
7.8% |
2.1% |
| J05 - Antivirals |
0.9% |
3.6% |
0.1% |
4.9% |
0.2% |
2.2% |
3.9% |
1.3% |
| L03 - Immunostimulants |
0.3% |
0.1% |
0.2% |
2.0% |
0.3% |
0.3% |
1.1% |
1.4% |
| J01 - Antibacterials |
0.4% |
1.7% |
1.0% |
2.3% |
0.6% |
1.3% |
2.5% |
1.0% |
| Other |
5.8% |
16.6% |
8.4% |
29.1% |
14.6% |
13.0% |
21.2% |
17.5% |
3. The rates of growth in hospital sales have been on the rise in recent years and exceed those in retail markets in Canada.
While the rate of growth in the retail sector temporarily stabilized, mainly due to the implementation of generic pricing policies and generic substitution, the rate in the hospital sector continued to rise, with a 43% rate of growth over a nine-year period and a record 7.8% growth in 2014.
Section 3
Click on image for larger view
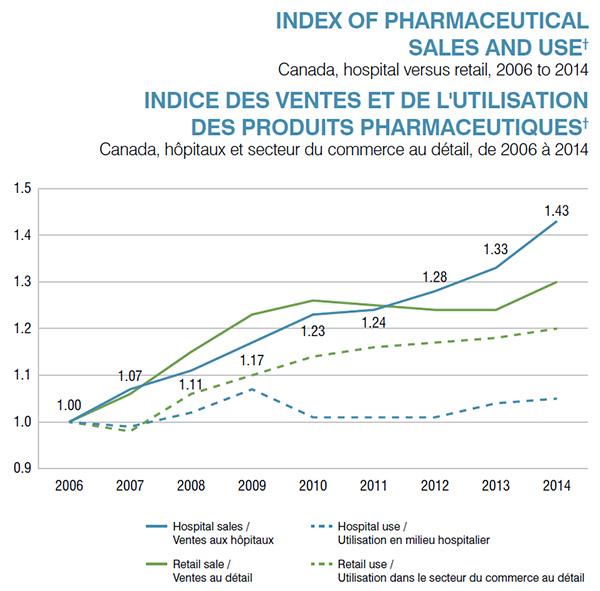
Figure description
This line graph depicts the growth in pharmaceutical sales and use in hospital and retail markets in Canada from 2006 to 2014.
|
Hospital sales |
Hospital use |
Retail sales |
Retail use |
| 2006 |
1.00 |
1.00 |
1.00 |
1.00 |
| 2007 |
1.07 |
0.99 |
1.06 |
0.98 |
| 2008 |
1.11 |
1.02 |
1.15 |
1.06 |
| 2009 |
1.17 |
1.07 |
1.23 |
1.10 |
| 2010 |
1.23 |
1.01 |
1.26 |
1.14 |
| 2011 |
1.24 |
1.01 |
1.25 |
1.16 |
| 2012 |
1.28 |
1.01 |
1.24 |
1.17 |
| 2013 |
1.33 |
1.04 |
1.24 |
1.18 |
| 2014 |
1.43 |
1.05 |
1.30 |
1.20 |
4. The growth in hospital sales has mainly been driven by oncology drugs, as well as vaccines and antivirals.
Over the last nine years, hospital drug sales increased by 43% (or $0.8 billion), from $1.8 billion in 2006 to $2.6 billion in 2014. Of this growth, 31% was directly attributable to the increased use of antineoplastic (oncology) drugs (18%), as well as the use of more expensive antineoplastic drugs (13%). The increased use of vaccines, as well as the use of more expensive antivirals, each contributed 5% to the growth in hospital drug sales.
Section 4
Click on image for larger view
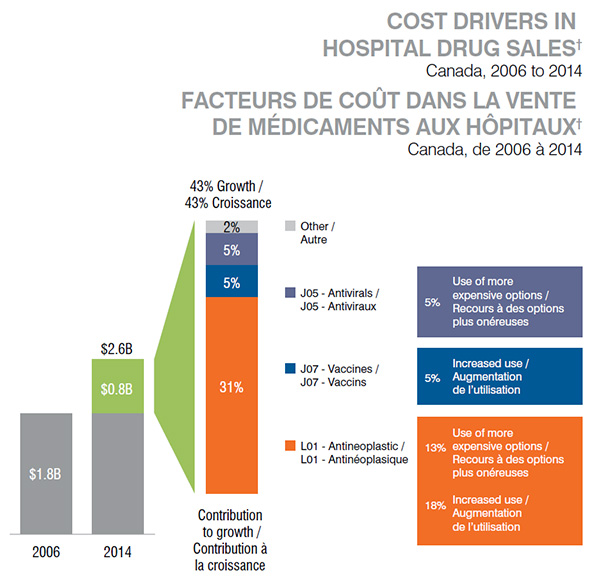
Figure description
These three bars depict the drivers of growth in hospital drug sales between 2006 and 2014. Hospital drug sales increased from 1.8 billion dollars in 2006 to 2.6 billion dollars in 2014. This represents a 43% growth in sales. The drivers of this growth mainly belonged to three therapeutic categories:
- Antineoplastics (L01) were responsible for 31% of the growth, representing an 18% increase in use and a 13% increase in the use of more expensive options.
- Vaccines (J07) were responsible for 5% of the growth due to increased use.
- Antivirals (J05) were responsible for 5% of the growth due to an increase in the use of more expensive options.
5. Oncology drugs comprise the largest share of hospital revenues, and this share has been increasing.
Due to their high growth in sales, antineoplastics accounted for an increased share of the hospital market: 40% in 2014, up from 26% in 2006.
Section 5
Click on image for larger view
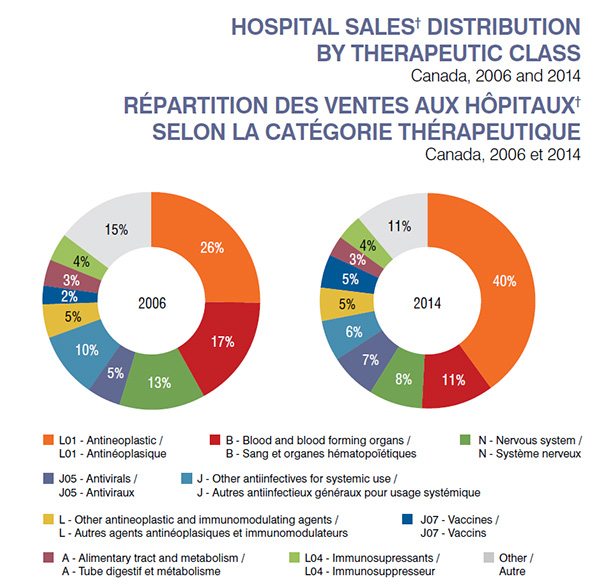
Figure description
These two pie charts depict the Canadian hospital sales distribution by therapeutic class for 2006 and 2014.
| Therapeutic Class |
2006 |
2014 |
| L01 - Antineoplastic |
26% |
40% |
| B- Blood and blood forming organs |
17% |
11% |
| N- Nervous system |
13% |
8% |
| J05 - Antivirals |
5% |
7% |
| J- Other antiinfectives for systemic use |
10% |
6% |
| L- Other antineoplastic and immunomodulating agents |
5% |
5% |
| J07 - Vaccines |
2% |
5% |
| A- Alimentary tract and metabolism |
3% |
3% |
| L04 - Immunosuppressants |
4% |
4% |
| All others |
15% |
11% |
6. The hospital prices for top-selling drugs tend to be lower in foreign markets than in Canada.
The table lists the 10 topselling drugs for the hospital market in Canada, which account for 36% of hospital sales. For many of these drugs, the median foreign price is below the Canadian level (a ratio lower than 1).
| Rank |
Trade name |
ATC*
description |
Share of Canadian hospital sales |
Canadian price** |
Foreign-to-Canadian price ratio*** |
| 1 |
Herceptin |
L01 - Antineoplastic |
7.9% |
$2,625 (Inj. powder, 440 mg) |
— |
| 2 |
Rituxan |
L01 - Antineoplastic |
7.2% |
$1,641 (Inj. soln., 10 mg/ml) |
0.79 |
| 3 |
Avastin |
L01 - Antineoplastic |
3.7% |
$1,450 (Inj. soln., 25 mg/ml) |
0.85 |
| 4 |
Eloxatin |
L01 - Antineoplastic |
3.6% |
$1,104 (Inj. soln., 5 mg/ml) |
0.33 |
| 5 |
Velcade |
L01 - Antineoplastic |
3.4% |
$1,824 (Inj. powder, 3.5 mg) |
0.84 |
| 6 |
Truvada |
J05 - Antivirals |
2.8% |
$25 (Tab / co., 200 mg + 245 mg) |
1.20 |
| 7 |
Eprex |
B03 - Antianemic Prep. |
2.2% |
$75 (Prefilled syr., 10,000 IU/ml) |
0.70 |
| 8 |
Alimta |
L01 - Antineoplastic |
2.0% |
$1,780 (Inj. powder, 500 mg) |
1.13 |
| 9 |
Aranesp |
B03 - Antianemic Prep. |
1.8% |
$202 (Prefilled syr., 200 mcg/ml) |
0.95 |
| 10 |
Lucentis |
S01 - Ophthalmologicals |
1.8% |
$1,523 (Inj. soln.,10 mg/ml) |
0.88 |
*World Health Organization Anatomical Therapeutic Classification.
**Form and strength specific. ***The foreign price is the median across the PMPRB7 countries.
Note: The PMPRB7 comparator countries are France, Germany, Italy, Sweden, Switzerland, the United Kingdom and the United States.
Data Source: MIDAS™ Database, Manufacturer Ex-factory Sales, IMS AG. All Rights Reserved.
†Data Source: MIDAS™ Database, Manufacturer Ex-factory Sales, IMS AG. All Rights Reserved.
Disclamer: Although based in part on data provided under license by the IMS AG’s MIDAS™ Database, the statements, findings, conclusions, views and opinions expressed in this report are exclusively those of the PMPRB and are not attributable to IMS AG.
NPDUIS is a research initiative that operates independently of the regulatory activities of the PMPRB.