The Use of Blood Glucose Test Strips in Select Public Drug Plans, 2008
ISBN: 978-1-100-22089-5
Cat. No.: H82-13/2013E-PDF
April 2013
Executive Summary
This study focuses on the use of blood glucose test strips in selected public drug plans in 2008 for the purpose of providing (i) an overview of their cost and utilization, (ii) an international price comparison, and (iii) a treatment group analysis that assesses the extent to which the actual utilization in 2008 compares with the recognized Canadian recommendations.
Data from 2008 is used as a benchmark for test strip utilization, and the results of this study may be used as a reference point for assessing potential shifts in utilization due to existing and future Canadian recommendations. The analysis uses data from public drug plans in Saskatchewan, Manitoba and Nova Scotia.
Overview of the Cost and Utilization
An overview of the cost and utilization in the three jurisdictions for 2008 gives the following results:
- Total prescription costs for blood glucose test strips and drugs (including both the plan-paid and patient-paid portions) were $29.4 million (6.4% of the total prescription cost) in Saskatchewan, $36.5 million (6.3%) in Manitoba and $16.0 million (8.3%) in Nova Scotia.
- Test strips alone accounted for between 38% and 45% of the total prescription costs for blood glucose test strips and drugs; the cost of test strips were $13.1 million in Saskatchewan, $13.7 million in Manitoba and $6.9 million in Nova Scotia.
- The amounts paid by the provincial drug programs for test strips (excluding the patient-paid portions) were $8.3 million in Saskatchewan, $7.6 million in Manitoba and $5.9 million in Nova Scotia.
- The quantities of test strips dispensed were 15.4 million in Saskatchewan, 16.3 million in Manitoba and 8.4 million in Nova Scotia.
- The weighted average cost per test strip in the three provinces was $0.78, including pharmacy markup, and $0.84 including dispensing fees.
International Price Comparison
The international price comparison for blood glucose test strips suggests that higher prices were reimbursed in Saskatchewan, Manitoba and Nova Scotia than in selected foreign markets. The lowest average cost per test strip, excluding pharmacy markup, among the three Canadian jurisdictions was $0.7273 in 2008. This was nearly twice as much as the average price of test strips in the 2010 United States Federal Supply Schedule price list ($0.3934 in Canadian dollars) and markedly higher than the average list price in the 2008 national formularies in the United Kingdom and France ($0.5611 and $0.4850, respectively, in Canadian dollars). The international price sources were selected based on data availability.
Treatment Group Analysis
For each of the three public drug plans, a cohort of patients that continuously used diabetes drugs and/or blood glucose test strips in 2008 was selected for analysis. The cohorts represented over two-thirds of the diabetes patients. Three treatment groups were identified in these cohorts based on their use of insulin, oral antihyperglycemic agents (OAA) and/or test strips: insulin-only users; both insulin and OAA users; and non-users of insulin (OAA and/or test strips).
The treatment group analysis of patients covered by the public drug plans in 2008 in Saskatchewan, Manitoba and Nova Scotia suggests the following:
- Non-users of insulin form the largest group, accounting for close to three quarters of the diabetes patients. The remaining patients are almost equally divided between the two groups of insulin users (with or without OAA).
- Although insulin users (with or without OAA) represent approximately one quarter of the cohort, they account for about one half of the test strip use and related prescription costs.
- While the vast majority of the users of insulin used blood glucose test strips, a noticeable portion did not (up to 14%). As would be expected, the non-users of insulin are less likely to use test strips.
- Depending on the jurisdiction, the weekly average number of test strips used was 16.1–19.9 for the insulin-only users, 11.9–13.5 for both insulin and OAA users, and approximately 7 for the non-users of insulin.
Utilization versus Recommendations
For each treatment group, the frequency of test strip use was analyzed using 2008 public drug plan data from Saskatchewan, Manitoba and Nova Scotia. The frequency of use was then compared to the Canadian Diabetes Association 2008 guidelines (CDA 2008)1, the Canadian Agency for Drugs and Technologies in Health 2009 recommendations (CADTH 2009)2, and the CDA 2011 comments in the briefing document for healthcare providers (CDA 2011)3. The results of this study may be used as a reference point for any existing and future recommendations, including the upcoming CDA 2013 guidelines4.
The CDA 2008 guidelines are based on clinical evidence and recommend a minimum use of test strips. The CADTH 2009 recommendations are based on both clinical evidence and cost effectiveness, focus on the optimal test strip usage and suggest a maximum use. The CDA 2011 comments address the issue of cost-effectiveness raised by CADTH and make suggestions of minimum government reimbursement. Both the CDA and CADTH discuss exceptions, acknowledge individual circumstances and stress that the frequency of test strip use should be individualized.
The recommendations or suggestions for use are made at the population level, are grouped according to the type of treatment undertaken, and differentiate between type 1, type 2 and gestational diabetes. While the treatment type can be determined in public drug plan data, diagnostic information is not available, and consequently, the analysis does not distinguish between the three types of diabetes.
In general, the results were consistent across the three jurisdictions. The variations that do exist may be explained by differences in the demographic profile of the beneficiary population, the drug plan design, physician prescribing practices and the prevalence of the types of diabetes in each province, among other things.
A summary of the findings for the cohort patients follows:
Group 1 – Insulin-only Users, assumed to be mostly type 1 diabetes patients:
- CDA 2008 recommends that “[SMBG] should be undertaken at least 3 times per day”.
- Up to 36% of insulin-only users in 2008 were in line with this recommendation.
- CADTH 2009 “recommends that the optimal daily frequency of SMBG be individualized” and states that “SMBG is an essential component of diabetes management”.
- Up to 91% of insulin-only users in 2008 were in line with this recommendation.
- CDA 2011 makes no further recommendation.
Group 2 – Insulin and OAA Users, assumed to be mostly adult type 2 diabetes patients:
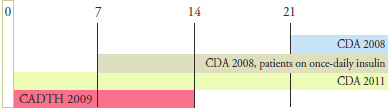
- CDA 2008 recommends that “[SMBG] should be undertaken at least 3 times per day. (…). In those with type 2 diabetes on once-daily insulin in addition to OAA, testing at least once a day at variable times is recommended”.
In 2008:
- Up to 19% of the insulin and OAA users used an average number of test strips in line with the minimum recommendation of 3 test strips per day.
- The majority (56%–71%) of the insulin and OAA users used an average of at least 1 test strip per day, although it is not known whether these patients were on once-daily insulin.
- For type 2 adult patients, CADTH 2009 “…recommends that the optimal daily frequency of SMBG be individualized” and “…suggests that the maximum weekly frequency of SMBG is 14 tests per week for most of these patients”.
- The majority of the insulin and OAA users in 2008 (56% to 61%) used test strips in line with this suggestion.
- In 2011, the CDA comments that it “is in general agreement [with CADTH (…)], however, we recommend that the amount of SMBG be individualized for all people …” and adds that “… we believe it is most practical and reasonable not to limit SMBG for adults with type 2 diabetes using insulin”.
Group 3 – Non-users of Insulin, assumed to be mostly adult type 2 diabetes patients:
- CDA 2008 recommends that “… the frequency of SMBG should be individualized …”
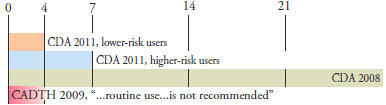
- For most type 2 adult patients in this treatment group, CADTH indicates that “…routine use … is not recommended”.
- Patients that did not use test strips accounted for 32%, 43% and 26% of the non-users of insulin in Saskatchewan, Manitoba and Nova Scotia, respectively, in 2008. Furthermore, lower-end users may not have used test strips routinely, although precise conclusions could not be drawn.
- For type 2 adult patients, CDA 2011 “…suggest[s] a minimum government reimbursement of SMBG test strips of 15 test strips per month [for those using no pharmacotherapy or pharmacotherapy with a lower risk of hypoglycemia], and 30 test strips per month [for those using any pharmacotherapy with a higher risk of hypoglycemia]”.
- The majority of the non-users of insulin in 2008 (59% to 81%) used test strips in line with this suggestion of minimum government reimbursement.
Limitations
This study has important limitations, which are discussed in detail in this report.
Most importantly, the analysis was conducted on a cohort of patients that continuously used diabetes drugs and/or test strips, and the results may differ in the overall beneficiary population.
Furthermore, the public drug plan data analyzed represents only one component of the pharmaceutical market. Therefore, these results should not be extrapolated to other population groups, as the findings may be different for test strip use reimbursed under other publicly or privately funded plans or paid for out-of-pocket by patients.
This analysis deals with broad recommendations and suggestions and does not capture individualized treatments. The results are based on administrative data and should not be interpreted as inappropriate use, underuse or overuse of blood glucose test strips for the patients that fall outside the recommended or suggested thresholds. This study does not attempt to estimate the expenditure associated with use outside the recommended or suggested use.
1 Canadian Diabetes Association (CDA). 2008 Clinical Practice Guidelines for the Prevention and Management of Diabetes in Canada, Monitoring Glycemic Control. Canadian Journal of Diabetes. 2008; 32(Supplement 1): S32. Available at: http://www.diabetes.ca/files/cpg2008/cpg-2008.pdf (Accessed April 2, 2013).
2 Canadian Agency for Drugs and Technologies in Health (CADTH). Optimal Therapy Recommendations for the Prescribing and Use of Blood Glucose Test Strips. COMPUS Optimal Therapy Report. 2009; 3(6): Table 1, p. 5. Available at: www.cadth.ca/media/pdf/compus_BGTS_OT_Rec_e.pdf (Accessed April 2, 2013).
3 Canadian Diabetes Association (CDA). Comments in Response to the COMPUS Recommendations Commentary: Self- Monitoring of Blood Glucose in People with Type 2 Diabetes: Canadian Diabetes Association Briefing Document for Healthcare Providers. Canadian Journal of Diabetes. 2011; 35(4): 317. Available at: http://www.diabetes.ca/documents/for-professionals/CJD--Sept_2011--SMBG.pdf (Accessed April 2, 2013).
4 Canadian Diabetes Association (CDA). The 2013 Canadian Diabetes Association Clinical Practice Guidelines are coming! CDA News. 2012. Available at: http://www.diabetes.ca/get-involved/news/the-2013-canadian-diabetes-associationclinical- practice-guidelines-are-com/ (Accessed April 2, 2013).
Table Of Contents
- Introduction
- Overview of Cost and Utilization
- International Price Comparison
- Treatment Group Analysis
- Treatment Groups: Utilization versus Recommendations
- Limitations
- Conclusions
- Appendix 1: Synopsis of the Key Available Research
Introduction
This study focuses on the use of blood glucose test strips in selected provincial public drug plans in 2008 for the purpose of providing (i) an overview of their cost and utilization; (ii) an international price comparison; and (iii) a treatment group analysis that assesses the extent to which actual utilization in 2008 compares to the recognized Canadian recommendations.
The data source for this report is the National Prescription Drug Utilization Information System (NPDUIS) Database, which was developed by the Canadian Institute for Health Information (CIHI) in consultation with the Patented Medicine Prices Review Board (PMPRB). This database contains de-identified prescription claims-level data collected from participating publicly financed drug benefit programs in Canada.
The study reports 2008 data for the drug programs in Saskatchewan, Manitoba and Nova Scotia, which were the only jurisdictions with claims-level data for blood glucose test strips available at the time of the study. The data was used to identify the type of diabetes drugs used by individual patients for the purpose of cohort selection in the treatment group analysis.
The frequency of test strip use in each treatment group was assessed and compared to the Canadian Diabetes Association 2008 guidelines (CDA 2008)1, the Canadian Agency for Drugs and Technologies in Health 2009 recommendations (CADTH 2009)2, and the CDA 20113 comments in the briefing document for healthcare providers.
The results of this study may be used as a baseline for assessing potential shifts in utilization due to existing and future Canadian recommendations, including the upcoming CDA 2013 guidelines4.
This study also provides an international price comparison, analyzing formulary prices in Saskatchewan, Manitoba and Nova Scotia, along with those in the United States, the United Kingdom and France.
Definitions
The following terms are defined for the purpose of this study:
Diabetes patients: drug plan beneficiaries that made claims accepted for reimbursement for insulin, oral anti-diabetes drugs and/or blood glucose test strips
Cost: the cost of the test strips themselves or the drug cost, including wholesale upcharges and excluding pharmacy markups
Prescription cost: the sum of the cost, pharmacy markup (if applicable) and dispensing fee
Plan-paid amount: the amounts reimbursed by the public plan; they reflect government−patient cost sharing structures
Blood glucose test strips: disposable single-use strips used in conjunction with a portable measuring device, called a glucose meter or glucometer, to test blood glucose levels
Diabetes drugs include two broad categories: insulins and oral antihyperglycemics. Oral antihyperglycemics include acarbose, chlorpropamide, gliclazide, glimepiride, glyburide, metformin, nateglinide, pioglitazone, repaglinide, rosiglitazone, sitagliptin and tolbutamide.
These drugs were used in this study, along with blood glucose test strips, to identify patients that were treated for diabetes. Note that the results do not exclude any off-label use of these drugs or use for a indication other than diabetes (e.g., metformin use in women with polycystic ovary disease, who may not be diabetic).
Background
Diabetes mellitus is a chronic disease that occurs when the body is either unable to sufficiently produce or properly use insulin. If left uncontrolled, diabetes results in consistently high blood sugar levels, a condition known as hyperglycemia. Over time, hyperglycemia can damage blood vessels, nerves, and organs such as the kidneys, eyes and heart, resulting in serious complications and, ultimately, death.5
Glycemic control is the cornerstone of diabetes management. It may be improved through lifestyle modifications (i.e., weight control, proper nutrition, and adequate exercise), the use of medications (e.g., insulin and oral antidiabetic drugs), and the self-monitoring of blood glucose (SMBG).6
SMBG is used to check the level of glucose in the blood at a given point in time. The process involves pricking a fingertip to collect a drop of blood, absorbing the blood with a test strip and inserting the test strip into an electronic glucose monitor, which then displays a number on its screen.7
There are three common forms of diabetes: type 1, type 2 and gestational diabetes. These forms may differ in their causes, treatments (including recommendations for blood glucose testing) and complications. The following description is provided by the Public Health Agency of Canada.5
- Type 1 diabetes, also referred to as “insulindependent diabetes”, is an autoimmune disease that leaves the individual dependent on an external source of insulin for life. Type 1 diabetes typically arises in children and youth. It is estimated that 5% to 10% of Canadians with diabetes have type 1 diabetes.
- Type 2 diabetes, also referred to as “noninsulin-dependent diabetes mellitus”, is a metabolic disorder that occurs when the pancreas does not produce enough insulin and when the body does not properly use the insulin it makes. The risk of type 2 diabetes is higher among people who are overweight or obese, physically inactive and in certain ethnic populations. While the onset of type 2 diabetes typically occurs in adults over the age of 40, it can occur at younger ages. It is estimated that 90% to 95% of Canadians with diabetes have type 2 diabetes.
- Gestational diabetes, which develops during pregnancy and typically disappears afterwards, has been detected in approximately 3% to 5% of all pregnancies that resulted in a live birth.
The Public Health Agency of Canada reports that in 2008/09, almost 2.4 million Canadians (6.8%) were living with diabetes. The age-standardized prevalence of diagnosed diabetes among Canadians aged one year and older increased by 70% from 1998/99 to 2008/09. Diabetes prevalence rises considerably with age, with rates exceeding 20% in the senior population.5 From the standpoint of public drug programs, whose coverage is heavily concentrated in the senior population, the growth in the prevalence of diabetes is expected to result in an increased use of blood glucose test strips and drugs.
1 Canadian Diabetes Association (CDA). 2008 Clinical Practice Guidelines for the Prevention and Management of Diabetes in Canada, Monitoring Glycemic Control. Canadian Journal of Diabetes. 2008; 32(Supplement 1): S32. Available at: http://www.diabetes.ca/files/cpg2008/cpg-2008.pdf (Accessed April 2, 2013).
2 Canadian Agency for Drugs and Technologies in Health (CADTH). Optimal Therapy Recommendations for the Prescribing and Use of Blood Glucose Test Strips. COMPUS Optimal Therapy Report. 2009; 3(6): Table 1, p. 5. Available at: www.cadth.ca/media/pdf/compus_BGTS_OT_Rec_e.pdf (Accessed April 2, 2013).
3 Canadian Diabetes Association (CDA). Comments in Response to the COMPUS Recommendations Commentary: Self- Monitoring of Blood Glucose in People with Type 2 Diabetes: Canadian Diabetes Association Briefing Document for Healthcare Providers. Canadian Journal of Diabetes. 2011; 35(4): 317. Available at: http://www.diabetes.ca/documents/for-professionals/CJD--Sept_2011--SMBG.pdf (Accessed April 2, 2013).
4 Canadian Diabetes Association (CDA). The 2013 Canadian Diabetes Association Clinical Practice Guidelines are coming! CDA News. 2012. Available at: http://www.diabetes.ca/get-involved/news/the-2013-canadian-diabetes-associationclinical- practice-guidelines-are-com/ (Accessed April 2, 2013).
5 Public Health Agency of Canada. Diabetes in Canada: Fact and figures from a public health perspective. 2011. Available at: http://www.phac-aspc.gc.ca/cd-mc/publications/diabetesdiabete/facts-figures-faits-chiffres-2011/pdf/facts-figures-faitschiffres-eng.pdf (Accessed April 2, 2013).
6 Canadian Agency for Drugs and Technologies in Health (CADTH). Current Utilization of Blood Glucose Test Strips in Canada, COMPUS Optimal Therapy Report. 2009; 3(4). Available at: http://www.cadth.ca/media/pdf/compus_CU_Report-BGTS.pdf (Accessed April 2, 2013).
7 Canadian Agency for Drugs and Technologies in Health (CADTH). Optimal Use Project - Self-Monitoring of Blood Glucose. Available at: http://www.cadth.ca/en/products/optimal-use/self-monitoring (Accessed April 2, 2013).
Overview of Cost and Utilization
Diabetes in Public Drug Plans
The cost of treating diabetes accounted for a sizable portion of the total public drug plan prescription costs in Saskatchewan, Manitoba and Nova Scotia in 2008. Nova Scotia spent the largest portion, but also had the highest prevalence rate for diabetes.
The prescription costs for blood glucose test strips and diabetes drugs in 2008 were $29.4 million (6.4% of all prescription costs) in Saskatchewan, $36.5 million (6.3%) in Manitoba and $16.0 million (8.3%) in Nova Scotia (Table 2.1). Test strips alone accounted for a significant portion of this cost, ranging between 38% and 45%. The prescription cost for test strips was $13.1 million in Saskatchewan, $13.7 million in Manitoba and $6.9 million in Nova Scotia.
The portions the plans paid were $18.1 million (6.9% of all plan-paid costs) in Saskatchewan, $18.5 million (6.4%) in Manitoba and $13.6 million (8.5%) in Nova Scotia. Test strips comprised roughly two-fifths of these totals.
Table 2.1 Prescription costs of blood glucose test strips and diabetes drugs, by jurisdiction, 2008
| |
Prescription costs |
Plan-paid amount |
| SK |
MB |
NS |
SK |
MB |
NS |
| Blood glucose test strips |
$ Million |
$13.1 |
$13.7 |
$6.9 |
$8.3 |
$7.6 |
$5.9 |
| Percentage of cost for test strips and diabetes drugs |
45% |
38% |
43% |
46% |
41% |
43% |
| Percentage of total prescription cost |
2.8% |
2.3% |
3.6% |
3.2% |
2.6% |
3.7% |
| Diabetes drugs |
$ Million |
$16.3 |
$22.8 |
$9.1 |
$9.8 |
$10.9 |
$7.6 |
| Percentage of cost of test strips and diabetes drugs |
55% |
62% |
57% |
54% |
59% |
56% |
| Percentage of total prescription cost |
3.5% |
3.9% |
4.7% |
3.7% |
3.7% |
4.8% |
| Total (test strips and diabetes drugs) |
$ Million |
$29.4 |
$36.5 |
$16.0 |
$18.1 |
$18.5 |
$13.6 |
| Percentage of total prescription cost |
6.4% |
6.3% |
8.3% |
6.9% |
6.4% |
8.5% |
Note: Values may not add to total due to rounding.
Data source: National Prescription Drug Utilization Information System Database, Canadian Institute for Health Information
As shown in Figure 2.1, at 6.1%, Nova Scotia had the highest age-standardized diabetes prevalence rate in 2008/09 among the three provinces. This was the second highest diabetes prevalence rate in Canada (after Newfoundland and Labrador's 6.5%). The Canada-wide age-standardized rate was 5.6 in 2008/09 (age-standardized to the 1991 Canadian population); the actual prevalence rate was 6.8.5
Figure 2.1. Diabetes prevalence rates and share of total prescription cost, by jurisdiction
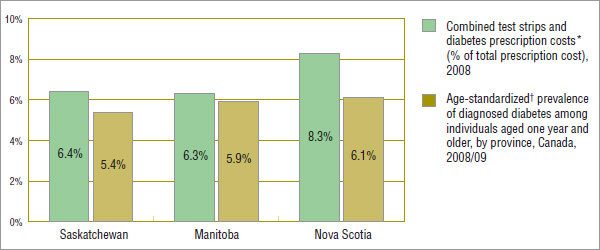
* Not age-standardized.
† Age-standardized to the 1991 Canadian population.
Data sources: National Prescription Drug Utilization Information System Database, Canadian Institute for Health Information, Public Health Agency of Canada (September 2011); using 2008/09 data from the Canadian Chronic Disease Surveillance System (Public Health Agency of Canada)
In 2008, the number of drug plan beneficiaries using blood glucose test strips and/or diabetes drugs was 52,134 in Saskatchewan, 60,252 in Manitoba and 25,700 in Nova Scotia, representing 5.1%, 5.0% and 2.7% of the all drug plan beneficiaries, respectively (Table 2.2). Nova Scotia, reimbursed the largest portion of the diabetes-related prescription costs, 85% compared to 62% in Saskatchewan and 51% in Manitoba.
Table 2.2 Diabetes in public drug plans, patients and cost, by jurisdiction, 2008
| |
Number of patients (000s)
(Share of all drug plan
beneficiaries) |
Prescription
cost
($ million) |
Plan
paid
($ million) |
Plan-paid
share of
prescription cost |
| Saskatchewan |
52.1 (5.1%) |
29.4 |
18.1 |
62% |
| Manitoba |
60.3 (5.0%) |
36.5 |
18.5 |
51% |
| Nova Scotia |
25.7 (2.7%) |
16.0 |
13.6 |
85% |
Data source: National Prescription Drug Utilization Information System Database, Canadian Institute for Health Information
These provincial variations reflect differences in public drug plan eligibility criteria and cost-sharing structures. Saskatchewan and Manitoba both have universal drug programs that provide broad-based coverage for all residents (excluding the Non-Insured Health Benefit recipients). Nova Scotia offers subscription-based programs with different fee structures for seniors, families, as well as income assistance recipients, persons with disabilities and children in the care of child welfare. The deductible-copayment structure in Nova Scotia results in a higher proportion of the prescription cost being reimbursed than in Saskatchewan and Manitoba.
Blood Glucose Test Strips in Public Drug Plans
In 2008, an average of 3.6 to 3.8 claims were dispensed per patient for blood glucose test strips, representing over 400 test strips per patient per year. The total quantities of test strips dispensed were 15.4 million in Saskatchewan, 16.3 million in Manitoba and 8.4 million in Nova Scotia (Table 2.3).
The average prescription cost per patient for test strips was approximately $350, including pharmacy markups and dispensing fees (Table 2.4).
Table 2.3 The use of blood glucose test strips, by jurisdiction, 2008
| |
Patients
(000s) |
Claims
(000s) |
No. of test
strips
(million) |
Avg.
test strips
per patient |
Avg.
test strips
per claim |
Avg.
claims
per patient |
| Saskatchewan |
37.8 |
144.3 |
15.4 |
407 |
107 |
3.8 |
| Manitoba |
38.3 |
137.9 |
16.3 |
426 |
118 |
3.6 |
| Nova Scotia |
19.7 |
74.4 |
8.4 |
426 |
113 |
3.8 |
Data source: National Prescription Drug Utilization Information System Database, Canadian Institute for Health Information
Table 2.4 The prescription cost of blood glucose test strips, by jurisdiction, 2008
| |
Test strip
cost*
($ million) |
Pharmacy
markups†
($ million) |
Dispensing
fees
($ million) |
Prescription cost |
Total
($ million) |
Per
patient |
| Saskatchewan |
$11.18 |
$0.99 |
$0.95 |
$13.12 |
$347 |
| Manitoba |
$12.92 |
— |
$0.74 |
$13.66 |
$356 |
| Nova Scotia |
$6.14 |
$0.05 |
$0.73 |
$6.91 |
$351 |
* The cost includes wholesale upcharges. In the case of Manitoba, this also includes pharmacy markups.
† Pharmacy markups are not reported separately for Manitoba.
Note: Values may not add to total due to rounding.
Data source: National Prescription Drug Utilization Information System Database, Canadian Institute for Health Information
The amounts paid by the provincial drug programs varied significantly across jurisdictions, with Nova Scotia picking up the largest share of the prescription cost for test strips at 85%. The plan-paid portions were 63% and 56% in Saskatchewan and Manitoba, respectively, which have universal programs in place (Table 2.5).
Table 2.5 The plan-paid amount and share of prescription cost of blood glucose test strips, by jurisdiction, 2008
| |
Plan-paid amount
($ million) |
Share of
prescription cost |
| Saskatchewan |
$8.3 |
63% |
| Manitoba |
$7.6 |
56% |
| Nova Scotia |
$5.9 |
85% |
Data source: National Prescription Drug Utilization Information System Database, Canadian Institute for Health Information
The lowest average cost per test strip among the three Canadian jurisdictions was $0.7273. The average reported is weighted based on the volume of use across the various brand names of blood glucose test strips. The weighted average cost per test strip in the three provinces was $0.7814 including pharmacy markup and $0.8417 including dispensing fees (Table 2.6).
The average costs of blood glucose test strips reported for Saskatchewan, Manitoba and Nova Scotia in 2008 are comparable to the results reported by CADTH for the publicly funded drug plans in Canada in 2006.6 This suggests that prices have remained virtually unchanged from 2006 to 2008. The CADTH study also reports that the average cost per blood glucose test strip in 2006 ranged from $0.72 in Ontario to $0.89 in Newfoundland and Labrador.
Table 2.6 Average* cost of blood glucose test strips, by jurisdiction, 2008
| |
Avg. cost
per test strip† |
Avg. cost and
pharmacy markup
per test strip |
Avg. prescription cost
per test strip
(including pharmacy markup
and dispensing fee) |
| Saskatchewan |
$0.7273 |
$0.7918 |
$0.8533 |
| Manitoba |
$0.7943 |
$0.7943 |
$0.8400 |
| Nova Scotia |
$0.7314 |
$0.7371 |
$0.8238 |
| Three-province weighted** average |
— |
$0.7814 |
$0.8417 |
* The average reported is weighted based on the volume of use across the various brand names of blood glucose test strips.
† The average cost per test strip (total cost/number of strips) includes wholesale upcharges. In the case of Manitoba, this also includes pharmacy markups.
** Weighted by the volume of use.
Data source: National Prescription Drug Utilization Information System Database, Canadian Institute for Health Information
5 Public Health Agency of Canada. Diabetes in Canada: Fact and figures from a public health perspective. 2011. Available at: http://www.phac-aspc.gc.ca/cd-mc/publications/diabetesdiabete/facts-figures-faits-chiffres-2011/pdf/facts-figures-faitschiffres-eng.pdf (Accessed April 2, 2013).
6 Canadian Agency for Drugs and Technologies in Health (CADTH). Current Utilization of Blood Glucose Test Strips in Canada, COMPUS Optimal Therapy Report. 2009; 3(4). Available at: http://www.cadth.ca/media/pdf/compus_CU_Report-BGTS.pdf (Accessed April 2, 2013).
International Price Comparison
The formulary prices of blood glucose test strips in Saskatchewan, Manitoba and Nova Scotia were compared with the prices paid by large international purchasers, namely government health and drug plans in the United States, United Kingdom and France. The results suggest that significantly lower prices were reimbursed internationally. The 2010 United States Federal Supply Schedule (US FSS) and the 2008 national formularies in the United Kingdom and France were used for the analysis.
These three countries are included in the list of seven PMPRB comparator countries8. The national formulary publications for the other four PMPRB comparator countries (Germany, Italy, Sweden and Switzerland) did not include prices for blood glucose test strips.
For the provinces analyzed, Table 3.1 reports the formulary price ranges and maximum allowable cost for test strips, along with the average reimbursed cost per test strip weighted by the volume of use. The table also reports the price ranges and a straight average of the test strip prices for the foreign markets.
Provincial formularies have varying rules governing the reimbursement of test strips. In 2008, Nova Scotia reimbursed the actual acquisition cost up to a maximum allowable cost of $0.74 per test strip. The Saskatchewan formulary list prices ranged from $0.4944 to $0.9579.
The prices of test strips may differ depending on the package size. Provinces generally list the higher price; therefore, the average costs reimbursed may be lower than the formulary price.
The average cost per test strip reimbursed in 2008 was $0.7273 for Saskatchewan and $0.7314 for Nova Scotia (both including wholesale upcharges) and $0.7943 for Manitoba (including wholesale upcharges and pharmacy markups). Even at the lower level of $0.7273 in Saskatchewan, the average cost was nearly twice as much as the average price of test strips in the 2010 US FSS price list ($0.3934 in Canadian dollars) and markedly higher than the average list price in the 2008 national formularies in the United Kingdom and France ($0.5611 and $0.4850, respectively, in Canadian dollars).
Note that the prices in these foreign formularies may not be reflective of prices available in the corresponding national markets. In addition, the average unit cost per test strip reimbursed by the three provinces is weighted based on the volume of use, whereas the prices of test strips in the foreign markets are straight averages of the individual prices of test strips, not weighted by the volume of use. Furthermore, the prices reported in this section do not capture off-invoice discounts, free goods and rebates, which manufacturers may provide to pharmacies.9 While this limitation may not allow for direct international price comparisons, the results suggest that the three provinces reimburse higher prices than those available in foreign markets.
The prices reported and compared in this section are as of 2008 (except for the US FSS price, which is as of 2010). Since then, the market landscape for blood glucose tests strips has evolved, with lower prices available in Canada and internationally. Notably, the prices in the Saskatchewan formulary have been reduced, ranging from $0.4180 to $0.8396 as of March 2013, including a recent test strip launch priced at the lower end of this range. Lower prices may also be available in Manitoba and Nova Scotia, which reimburse the actual acquisition cost. The maximum allowable cost for Nova Scotia has remained the same ($0.74). At the same time, in a press release issued on January 30, 2013,10 the US Centers for Medicare and Medicaid Services announced that effective July 1, 2013, lower prices will be available to the US Medicare beneficiaries, who will save an average of 72% on diabetic testing supplies.
This analysis flags past price differentials between Canada and other countries, and highlights the need for work in this area.
Table 3.1 Blood glucose test strip prices, selected provincial and international formularies (2008 figures unless otherwise indicated)
| |
Formulary prices
and ranges |
Weighted* avg. cost†
per test strip |
| Saskatchewan |
$0.4944 – $0.9579 |
$0.7273 |
| Manitoba |
NA |
$0.7943 |
| Nova Scotia |
Actual acquisition cost up to the maximum allowable cost: $0.74 |
$0.7314 |
| |
Price ranges |
Avg. price** |
| US FSS Price (2010) |
$0.2772 – $0.4912 |
$0.3934 |
| United Kingdom formulary price |
$0.4708 – $0.6395 |
$0.5611 |
| France formulary price |
$0.4038 – $0.5213 |
$0.4850 |
* Weighted by the volume of use.
† The average cost per test strip (total cost/number of strips) includes wholesale upcharges. In the case of Manitoba, this also includes pharmacy markups.
** The average prices are simple averages of formulary prices across various test strips.
Data sources: National Prescription Drug Utilization Information System Database, Canadian Institute for Health Information United States Federal Supply Schedule (US FSS) Price for 2010: FSS.exe price downloaded from US Department of Veteran Affairs website: www.pbm.va.gov/drugpharmaceuticalprices.aspx United Kingdom Formulary Price (2008): MIMS (December 2008), pages 139–140 France Formulary Price (2008): Pharm' Index (Août 2008), Section 2 Parapharmacie Average 2008 Exchange Rates: taken from PDF table on Bank of Canada website: www.bankofcanada.ca/en/rates/exchange_avg_pdf.html
8 Patented Medicine Prices Review Board. Patented Medicines Regulations, Subparagraph 4(1)(f )(iii) – SCHEDULE. Available at http://www.pmprb-cepmb.gc.ca.
9 Competition Bureau Canada. Benefiting from Generic Drug Competition in Canada: The Way Forward. November 2008. Available at: http://www.competitionbureau.gc.ca/eic/site/cb-bc.nsf/vwapj/GenDrugStudy-Report-081125-fin-e.pdf/$FILE/GenDrugStudy-Report-081125-fin-e.pdf (Accessed April 2, 2013).
10 Centers for Medicare and Medicaid Services. Medicare Announces Substantial Savings For Medical Equipment Included In The Next Round Of Competitive Bidding Program. January 30, 2013. Available at: www.cms.gov/apps/media/press_releases.asp (Accessed April 2, 2013).
Treatment Group Analysis
The purpose of this section is to identify the major groups of diabetes patients based on their treatment type, and to assess the extent and frequency of their test strip use, as well as the related costs.
This analysis is limited to a cohort of patients that continuously used test strips and/or diabetes drugs in 2008 and were reimbursed by the public drug plans in Saskatchewan, Manitoba and Nova Scotia. These patients are assumed to have been treated for diabetes or have tested their glucose levels throughout 2008, according to the cohort selection criteria described in this section.
Once the cohorts were selected, the average weekly frequency of test strip use per patient was determined. The frequency of use was then compared with the CDA and CADTH recommendations in Section 5 of this report.
This method did not ensure that all of the test strips reported for 2008 were used during the same year. Some patients may have used the strips claimed in 2008 in the following year or may have used in 2008 test strips dispensed in 2007. This approach simply reduced the possibility of including patients that only used test strips for part of 2008. This would have diluted the average weekly use per patient.
Cohort Selection
The cohorts were selected using the following criteria (Figure 4.1):
- Each patient had at least one claim for test strips and/or diabetes drugs during the four-month period prior to the analysis (September 2007 to December 2007). This ensured that each patient that was retained was a plan beneficiary treated for diabetes at the start of 2008. It excluded any patients that became active beneficiaries or commenced treatment or testing for diabetes partway through 2008.
- Each patient had at least one claim for test strips and/or diabetes drugs during both the first six months of the analysis period (i.e., January 2008 to June 2008) and the second six months of the analysis period (i.e., July 2008 to December 2008). This ensured that each patient that was retained had a degree of continuity in treating or testing for diabetes.
- Each patient had at least one claim for any drug (or any other health product) during the four-month post-analysis period (January 2009 to April 2009). This ensured that each patient that was retained was still a plan beneficiary at the end of 2008. It excluded any patients who were no longer active beneficiaries partway through 2008.
Figure 4.1 Cohort selection
The pre- and post-analysis periods were used to ensure that patients continuously used test strips and/or diabetes drugs during the analysis period. These periods acted to exclude patients that did not continuously use the strips and patients no longer making claims to the program.
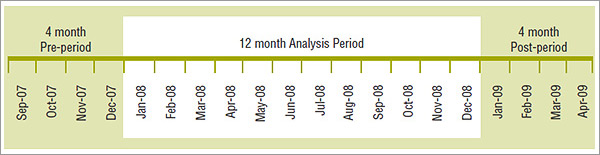
Table 4.1 reports the cohort size by jurisdiction. The cohorts represented just over two-thirds of the total number of drug plan beneficiaries that used test strips and/or diabetes drugs. However, they accounted for a much larger share (up to 85%) of the total number of test strips used and the total prescription cost for test strips in the public drug plans.
Table 4.1 Cohorts of diabetes patients*, by jurisdiction, 2008
| |
Saskatchewan |
Manitoba |
Nova Scotia |
| Cohort size (no. of patients) |
35,433 |
42,621 |
17,397 |
| Cohort representation in the claiming population |
68% |
71% |
68% |
| Cohort share of total number of test strips |
83% |
85% |
83% |
| Cohort share of total prescription cost of test strips |
83% |
85% |
83% |
*Cohort of patients with continuous use of diabetes drugs and/or blood glucose test strips.
Data source: National Prescription Drug Utilization Information System Database, Canadian Institute for Health Information
Treatment Groups
The diabetes cohorts were divided into three broad treatment groups based on their use of diabetes drugs. These groups correspond to the broad patient groups described in the CDA guidelines and CADTH recommendations.
- Group 1 – Insulin-only Users: includes patients who only used insulin.
- Group 2 – Both Insulin and OAA Users: includes patients who used both insulin and oral antihyperglycemic agents.
- Group 3 – Non-users of Insulin: includes patients who used only oral antihyperglycemic agents and patients who did not use any diabetes drugs (neither insulin nor orals). Note that patients in this group who did not use a diabetes drug would have used test strips.
Cohort Utilization and Cost of Blood Glucose Test Strips
In general, the results are consistent across the three jurisdictions. The variations that do exist may be explained by differences in the demographic profile of the beneficiary population, the drug plan design, physician prescribing practices and the prevalence of the types of diabetes in each province, among other things.
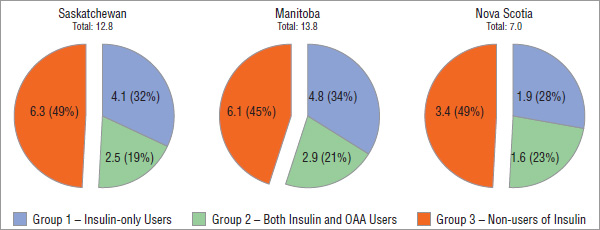
The majority of diabetes patients were in Group 3 – Non-users of Insulin. This group accounted for nearly three quarters of the diabetes cohort in 2008. The diabetes patients using insulin alone or insulin in combination with orals accounted for over a quarter of the diabetes cohort, with almost an equal split between the two groups (Figure 4.2).
Figure 4.2 Cohort of diabetes patients*, by treatment group, by jurisdiction, 2008
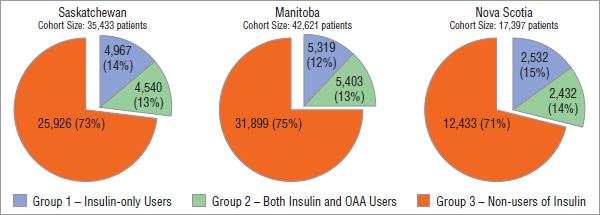
* Cohort of patients with continuous use of diabetes drugs and/or blood glucose test strips.
Data source: National Prescription Drug Utilization Information System Database, Canadian Institute for Health Information
These statistics correspond with the results reported for the Ontario Public Drug Program by CADTH for 20066 and by the Institute for Clinical Evaluative Sciences for 2008.11 These two studies suggest that insulin users accounted for 22.7% and 21.5%, respectively, of the total test strips users. The current analysis not only uses data from other jurisdictions, but also focuses on a cohort of patients that continuously used diabetes drugs and/or test strips. The cohort included diabetes patients that did not claim test strips.
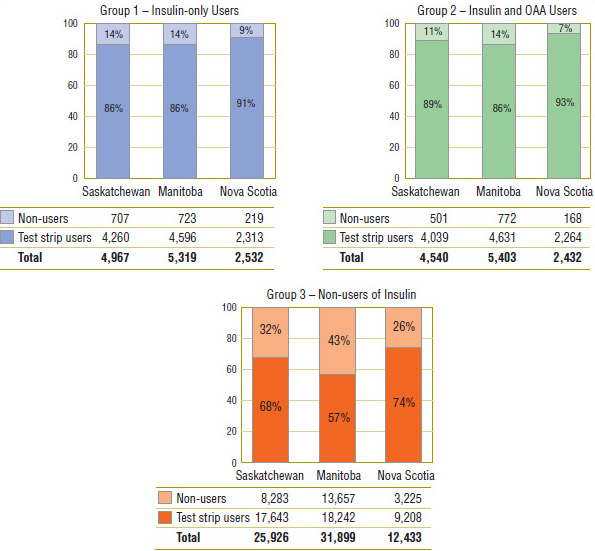
While the vast majority of the insulin users, Groups 1 and 2 (86% to 93%), used test strips, a noticeable portion (7% to 14%) did not (Figure 4.3). Similar findings are reported for the Ontario Public Drug Program in the report published by the Institute for Clinical Evaluative Sciences11. The report suggests that 86.3% of the patients that had at least one prescription for insulin in 2008 also used test strips. Implicitly, the rest of patients, 13.7%, did not.
The majority of Group 3 - Non-users of Insulin used test strips (57% to 74%), although the percentages were considerably lower than for the other two groups.
Figure 4.3 Blood glucose test strips users vs. non-users, by treatment group*, by jurisdiction, 2008
* Cohort of patients with continuous use of diabetes drugs and/or blood glucose test strips.
Data source: National Prescription Drug Utilization Information System Database, Canadian Institute for Health Information
Although the non-users of insulin represented nearly three quarters of the diabetes cohort population, they accounted for less than one half of the test strip use and related prescription costs. Conversely, the insulin users, who represented just over one quarter of the cohort population, generated over one half of the test strips use and related prescription costs (Figure 4.4 and Figure 4.5).
Figure 4.4 Number of blood glucose test strips, by treatment group*, by jurisdiction, 2008, million
* Cohort of patients with continuous use of diabetes drugs and/or blood glucose test strips.
Note: Values may not add to total due to rounding.
Data source: National Prescription Drug Utilization Information System Database, Canadian Institute for Health Information
Figure 4.5 Prescription cost of blood glucose test strips, by treatment group*, by jurisdiction, 2008, $ million
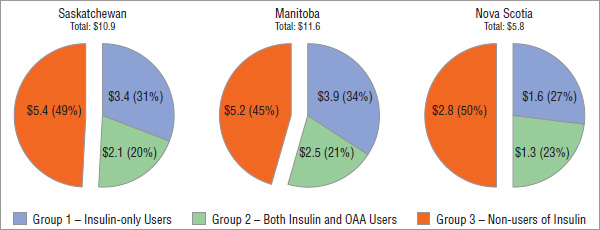
* Cohort of patients with continuous use of diabetes drugs and/or blood glucose test strips.
Data source: National Prescription Drug Utilization Information System Database, Canadian Institute for Health Information
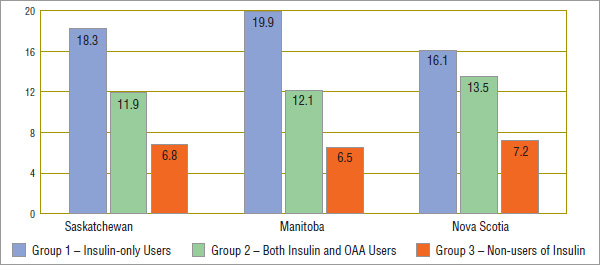
These results are explained by the fact that the patients using insulin are more intensive test strip users. Figure 4.6 reports that an average of approximately 16–20 strips per week or 2.5 strips per day were dispensed to Group 1 – Insulin-only Users. While Group 2 patients who used both insulin and OAA drugs used test strips at a lower rate than the insulin-only patients, they used significantly more than the non-insulin users. Non-users of insulin averaged approximately 7 strips per week or about one per day in all three jurisdictions.
The results on the frequency of testing reported in this study for Saskatchewan, Manitoba and Nova Scotia are more or less in line with the results reported for the Ontario Public Drug Program by CADTH for 20066, depending on the treatment group. In particular, the Ontario data suggests that the insulin-only users used an average of 2.76 blood glucose test strips per patient per day in 2006, which equates to an average weekly frequency of 19.3. This is in line with the average reported for Saskatchewan and Manitoba for 2008.
The results seem to align less for the users of insulin and OAA. For this group, the Ontario 2006 data suggests higher corresponding weekly averages (a calculated 16.2 test strips per week) than in Saskatchewan, Manitoba and Nova Scotia (11.9, 12.1 and 13.5 test strips per week, respectively).
The non-users of insulin are further broken out in the CADTH study into diabetes patients that use oral antihyperglycemic agents and those that do not use pharmacotherapy. The cumulated results for these two groups suggest a higher frequency of test strip use for these patients in Ontario when compared to corresponding patients in the three provinces analyzed in this study.
Note that this analysis was conducted on a subset of patients with a continuous use of diabetes drugs and/or test strips in selected public drug plans in 2008. Consequently, the results may differ in the overall beneficiary population, in the overall Canadian marketplace or in other subsets of it.
Figure 4.6 Weekly average number of blood glucose test strips used*, by treatment group†, by jurisdiction, 2008
* Non-users of test strips excluded from this average.
† Cohort of patients with continuous use of diabetes drugs and/or blood glucose test strips.
Data source: National Prescription Drug Utilization Information System Database, Canadian Institute for Health Information
6 Canadian Agency for Drugs and Technologies in Health (CADTH). Current Utilization of Blood Glucose Test Strips in Canada, COMPUS Optimal Therapy Report. 2009; 3(4). Available at: http://www.cadth.ca/media/pdf/compus_CU_Report-BGTS.pdf (Accessed April 2, 2013).
11 Institute for Clinical Evaluative Sciences (ICES). ICES Investigative Report: Blood Glucose Test Strip Use: Patterns, Costs and Potential Cost Reduction Associated with Reduced Testing. December 2009. Available at: http://www.ices.on.ca/file/Blood%20Glucose%20Test%20 Strip_Dec2009.pdf (Accessed April 2, 2013).
Treatment Groups: Utilization versus Recommendations
This section reviews the recognized guidelines and recommendations in Canada and compares them to the actual frequency of use of blood glucose test strips in 2008.
Note that this analysis focuses on the following three main sets of guidelines and recommendations. Other supporting documents that do not provide broad recommendations for the three treatment groups analyzed in this study are not considered.12 Nevertheless, the results reported in this study may be used as a reference for any existing and future recommendations, including the upcoming CDA 2013 guidelines4. Subsequent studies may assess more recent or future utilization and cross-reference it with the results of this study to estimate the potential impact of the recommendations on the utilization of test strips.
Recognized Guidelines and Recommendations in Canada
The following is a brief review of the Canadian guidelines and recommendations considered in this study. This analysis makes no judgment of these recommendations.
- 2008 Canadian Diabetes Association Guidelines (CDA 2008)1, as applied to test strips Canadian Journal of Diabetes (September 2008, Vol. 32, Supplement 1), Canadian Diabetes Association 2008 Clinical Practice Guidelines for the Prevention and Management of Diabetes in Canada, “Monitoring Glycemic Control”, p. S32.
- 2009CADTH Recommendations (CADTH 2009)2: CADTH, COMPUS Optimal Therapy Report (Vol. 3, Issue 6, July 2009) Optimal Therapy Recommendations for the Prescribing and Use of Blood Glucose Test Strips, Table 1, p. 5.
- 2011 CDA Briefing Document for Healthcare Providers (CDA 2011)3 Canadian Journal of Diabetes (September 2011, Vol. 35, Number 4), Commentary: Self-Monitoring of Blood Glucose in People with Type 2 Diabetes: Canadian Diabetes Association Briefing Document for Healthcare Providers, Canadian Diabetes Association Comments in Response to the CADTH Recommendations, p. 317.
The CDA 2008 guidelines are based on clinical evidence and focus on the minimum use of test strips. The CADTH 2009 recommendations are based on both clinical evidence and cost effectiveness, focus on the optimal test strip usage and suggest a maximum use. The CDA's briefing document for healthcare providers published in 2011 addresses the issue of cost-effectiveness raised by the CADTH and provides specific CDA comments in response to the CADTH 2009 recommendations. Without making a guidelines statement, the briefing document makes suggestions regarding the government reimbursement of test strips.
The Canadian Diabetes Association is a non-profit patient-based advocacy group, which “works to prevent diabetes and to improve the quality of life for those affected by diabetes … [It] represents the interests of those with diabetes to government, business, and the public.”13 The CDA's revenue sources include government health programs, services, support from other charities, government grants, administrative services, individual donations, and corporate donations, including sponsorship from pharmaceutical and medical device manufacturers.14
As part of its mandate, the CDA has published the Canadian Diabetes Association Clinical Practice Guidelines for the Prevention and Management of Diabetes in Canada since 1998. These guidelines include recommendations regarding the use of blood glucose test strips.
The Canadian Optimal Medication Prescribing and Utilization Service (COMPUS) is an initiative of the Canadian Agency for Drugs and Technologies in Health (CADTH) that identifies, analyzes and promotes optimal drug therapy. Test strips were analyzed under this initiative, and recommendations were made regarding their use. CADTH is “an independent, not-for-profit agency funded by the Canadian federal, provincial, and territorial governments to provide credible, impartial advice and evidence-based information about the effectiveness of drugs and other health technologies to Canadian health care decision makers.”(CADTH website).
Recommendations versus Utilization
For each treatment group identified in Section 4, this section provides (i) a summary of the recommendations as issued in the documents described earlier, (ii) an analysis of the patient distribution by average weekly test strip use, and (iii) an assessment of how this compares to the recommendations.
The results provided in this section should not be interpreted as inappropriate use, overuse or underuse of test strips for the patients that fall outside the recommended or suggested thresholds. Both CDA and CADTH discuss exceptions, acknowledge individual circumstances and stress that the frequency of test strip use should be individualized for most or all of the patients.
Note that the recommendations are sometimes specific to type 1, type 2 and gestational diabetes. As the administrative public drug plan data does not provide diagnostic information, the analysis does not distinguish between the three types of diabetes.
In general, the results are consistent across the three jurisdictions. The variations that do exist may be the result of differences in the demographic profile of the beneficiary population, the drug plan design, physician prescribing practices and the prevalence of the types of diabetes in each province, among other things.
Group 1: Insulin-only Users (Figure 5.1)
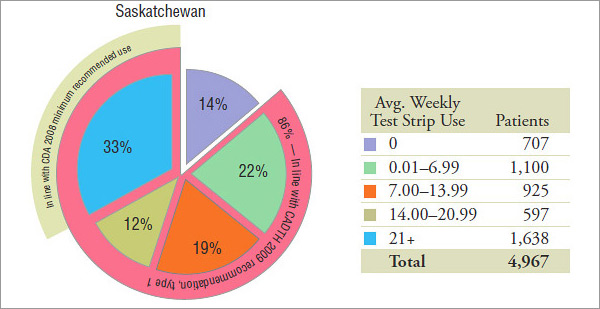
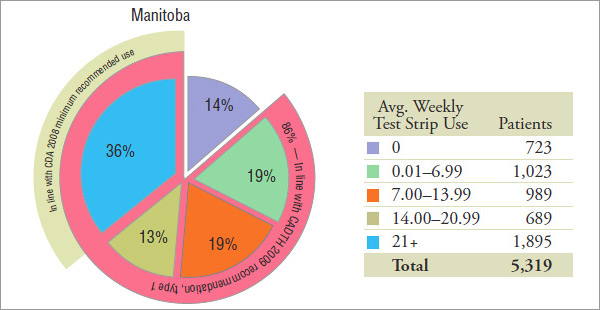
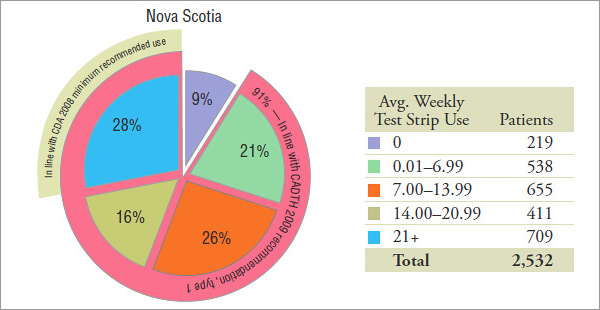
The results suggest that insulin-only users are the most frequent users of test strips (see Section 4), with close to one half of them using an average of 14 or more test strips per week in 2008 (Figure 5.1).
Group 1 is expected to be mainly composed of type 1 diabetes patients. Therefore, only the recommendations pertaining to type 1 patients were considered when analyzing the recommended or suggested average weekly use. Women with gestational diabetes and type 2 diabetes patients may also be present in this cohort.
The actual representation of type 1 diabetes patients in this group cannot be determined, as diagnostic information was not available in the data analyzed. It is estimated that 5% to 10% of Canadians with diabetes have type 1 diabetes5, and it is expected to be an insulin-only population. However, public drug plan data may not be representative of the general population, as it usually has a different demographic profile and disease representation.
CDA 2008
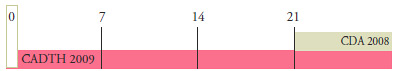
In 2008, the CDA recommended for patients in this treatment group that the “[SMBG] should be undertaken at least 3 times per day” (or 21 times per week).
The results suggest that 33%, 36% and 28% of the 2008 insulin-only users in Saskatchewan, Manitoba and Nova Scotia, respectively, used test strips in line with the minimum use recommended by CDA 2008.
CADTH 2009
For type 1 diabetes patients, CADTH “…recommends that the optimal daily frequency of SMBG be individualized”, making no suggestion for test strip use. Furthermore, it also states that “ SMBG is an essential component of diabetes management for adults and children with type 1 diabetes”, suggesting that the patients in this group that do not use test strips are considered to be non-compliant.
The results suggest that 86% of the insulin-only users in Saskatchewan and Manitoba and 91% of the insulin-only users in Nova Scotia used test strips in line with the CADTH 2009 recommendation.
CDA 2011
The CDA makes no further recommendation for the type 1 diabetes patients in this group.
Figure 5.1 Group 1 – Insulin-only users
| Agency association |
Recommendations |
| Group 1 is expected to be mainly composed of type 1 diabetes patients. Therefore, only the recommendations pertaining to type 1 patients are considered when analyzing the recommended or suggested average weekly use in Group 1. Nevertheless, women with gestational diabetes and type 2 diabetes patients may also be present in this cohort. |
| CDA 2008 |
“[SMBG] should be undertaken at least 3 times per day”. |
| CADTH 2009 |
…recommends that the optimal daily frequency of SMBG be individualized”. “SMBG is an essential component of diabetes management for adults and children with type 1 diabetes”. |
| CDA 2011 |
No further recommendation provided |
| Recommended or suggested average weekly use for type 1 diabetes patients: |
 |
Patient distribution* by average weekly blood glucose test strip use, by jurisdiction, 2008
Note: Values may not add to total or subtotal percentages due to rounding. SMBG, self-monitoring of blood glucose.
* Cohort of patients with continuous use of diabetes drugs and/or blood glucose test strips.
Data source: National Prescription Drug Utilization Information System Database, Canadian Institute for Health Information
Group 2: Both Insulin and OAA Users (Figure 5.2)
The results suggest that this group uses test strips less frequently than the insulin-only users (see Section 4), with over 27% to 37% of them using an average of 14 or more test strips per week in 2008 (Figure 5.2).
Group 2 is expected to be mainly composed of adult type 2 diabetes patients. Therefore, only the recommendations pertaining to the adult type 2 patients were considered when analyzing the recommended or suggested average weekly use. Nevertheless, women with gestational diabetes and children with type 2 diabetes may also be present in this cohort.
CDA 2008
For patients in this treatment group, the CDA recommended in 2008 that “[SMBG] should be undertaken at least 3 times per day” (or 21 times per week). “In those with type 2 diabetes on once-daily insulin in addition to OAA, testing at least once a day at variable times is recommended” (or 7 times per week).
Note that the patients on once-daily insulin have not been isolated from the rest of the insulin users in this group. The results suggest that 56%, 56% and 71% of the 2008 patients using both insulin and OAA in Saskatchewan, Manitoba and Nova Scotia, respectively, used test strips in line with the minimum use recommended by CDA 2008 of at least once a day. Only 15%, 14% and 19% of them, respectively, used test strips, on average, at least 3 times per day.
CADTH 2009
For type 2 adult patients in this treatment group, CADTH “…recommends that the optimal daily frequency of SMBG be individualized” and “…suggests that the maximum weekly frequency of SMBG is 14 tests per week for most of these patients”. SMBG plays an essential role in the daily management of patients with diabetes treated with insulin15. The users of insulin that do not use test strips are considered non-compliant.
The results suggest that 61%, 58% and 56% of the 2008 patients on both insulin and OAA in Saskatchewan, Manitoba and Nova Scotia, respectively, used test strips in line with the maximum suggested use by CADTH 2009 for most adults with type 2 diabetes.
CDA 2011
For type 2 patients, “The CDA is in general agreement [with CADTH 2009]; however, we recommend that the amount of SMBG be individualized for all people …” and “… we believe it is most practical and reasonable not to limit SMBG for adults …”
Figure 5.2 Group 2 – Both Insulin and OAA users
| Agency association |
Recommendations |
| Group 2 is expected to be mainly composed of adult type 2 diabetes patients. Therefore, only the recommendations pertaining to the adult type 2 patients are considered when analyzing the recommended or suggested average weekly use in Group 2. Nevertheless, women with gestational diabetes and children with type 2 diabetes may also be present in this cohort. |
| CDA 2008 |
“[SMBG] should be undertaken at least 3 times per day”.
“In those with type 2 diabetes on once-daily insulin in addition to OAA, testing at least once a day at variable times is recommended” |
| CADTH 2009 |
…recommends that the optimal daily frequency of SMBG be individualized” and “…suggests that the maximum weekly frequency of SMBG is 14 tests per week for most of these patients”.
SMBG plays an essential role in the daily management of patients with diabetes treated with insulin.15 |
| CDA 2011 |
“The CDA is in general agreement [with CADTH 2009]; however, we recommend that the amount of SMBG be individualized for all people …”
“… we believe it is most practical and reasonable not to limit SMBG for adults …” |
| Recommended or suggested average weekly use for type 2 diabetes patients: |
 |
Patient distribution* by average weekly blood glucose test strip use, by jurisdiction, 2008
Note: Values may not add to total or subtotal percentages due to rounding. SMBG, self-monitoring of blood glucose.
* Cohort of patients with continuous use of diabetes drugs and/or blood glucose test strips.
Data source: National Prescription Drug Utilization Information System Database, Canadian Institute for Health Information
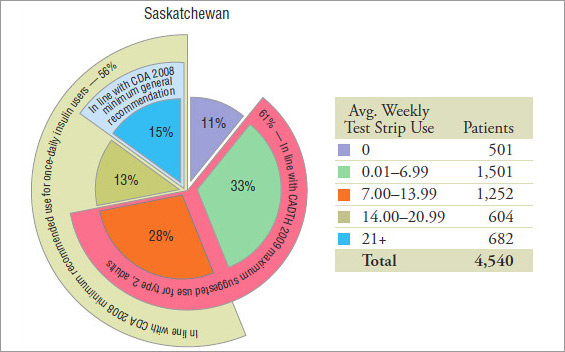
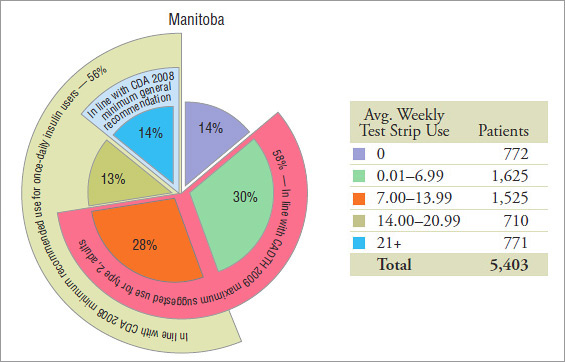
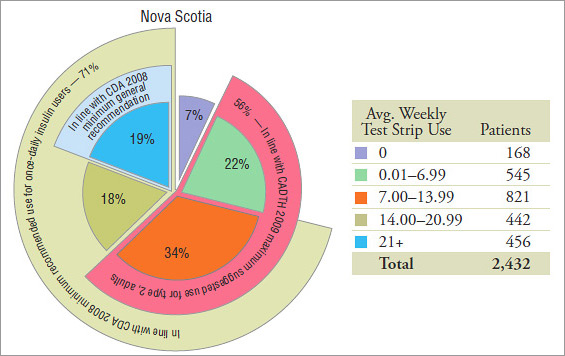
Group 3: Non-users of Insulin (Figure 5.3)
Non-users of insulin form the largest group of patients, accounting for nearly three quarters of the cohort. While these patients are the least frequent users of test strips, 19% to 30% of them still used an average of 14 or more test strips per week in 2008 (Figure 5.3).
Group 3 is expected to be mainly composed of adult type 2 diabetes patients. Therefore, only the recommendations pertaining to the adult type 2 patients were considered when analyzing the recommended or suggested average weekly use in Group 3. Nevertheless, women with gestational diabetes and children with type 2 diabetes may also be present in this cohort.
CDA 2008
In 2008, the CDA recommended that “… the frequency of SMBG should be individualized …”
CADTH 2009
For most type 2 adult patients, “…routine use … is not recommended” by CADTH 2009. The term “routine” has not been defined in this context. Although it does not equate with “daily use”, the routine use of SMBG has been referred to previously as  1 test strip per day16. Nevertheless, this does not imply that non-routine use is anything less than that.
In a study conducted at CADTH by Cameron et al.17, the authors found that “For most patients with type 2 diabetes not using insulin, the use of blood glucose test strips for frequent self-monitoring (>7 times per week) is unlikely to represent efficient use of finite health care resources, although periodic testing (e.g., 1 or 2 times per week) may be cost-effective.” Estimates were derived using the UK Prospective Diabetes Study (UKPDS) Outcome Model and test strip cost figures from Ontario Public Drug Programs.
CADTH16 suggests that lower testing frequencies (e.g., one or twoSMBG tests per week) are more likely to yield the most favourable cost-effectiveness estimates.
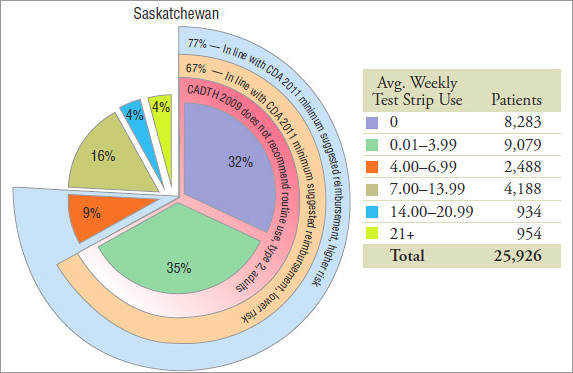
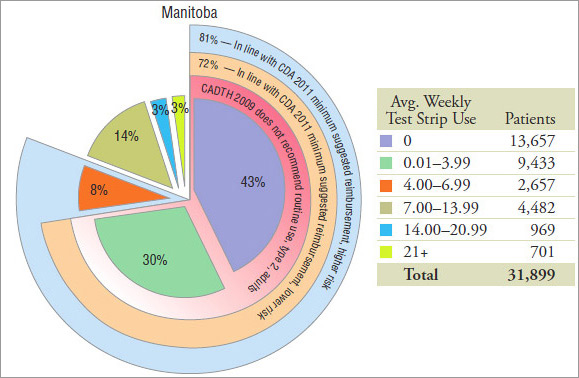
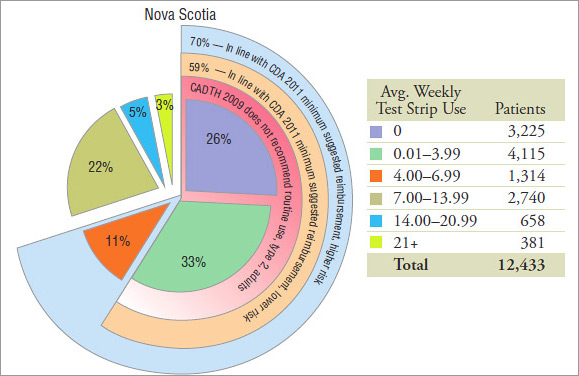
In the absence of a definition of routine use as it relates to the CADTH 2009 recommendation, an assessment of the utilization is limited. The non-users of test strips account for 32%, 43% and 26% of the non-users of insulin in Saskatchewan, Manitoba and Nova Scotia, respectively. Furthermore, lower-end users may not use them routinely, although precise conclusions could not be drawn. Figure 5.3 provides a breakdown of up to 4 test strip per week.
CDA 2011
For type 2 adult patients, the CDA 2011“…suggest[s] a minimum government reimbursement of SMBG test strips of 15 test strips per month [for those using no pharmacotherapy or pharmacotherapy with a lower risk of hypoglycemia], and 30 test strips per month [for those using any pharmacotherapy with a higher risk of hypoglycemia]”
This was interpreted as a minimum average weekly use of 4 and 7 test strips for lower and higher risk patients, respectively. A small overestimation in results may be present due to the approximation.
The administrative public drug plan data does not provide information on the risk of hypoglycemia, and consequently, the analysis could not distinguish between the lower- and the higher-risk patients.
The results suggest that 67%, 72% and 59% of the non-users of insulin in 2008 in Saskatchewan, Manitoba and Nova Scotia, respectively, were using test strips in accordance with the suggestion of minimum government reimbursement for type 2 adult diabetes patients with a lower risk of hypoglycemia.
Moreover, the results suggest that 77%, 81% and 70% of the non-users of insulin in 2008 in Saskatchewan, Manitoba and Nova Scotia, respectively, were using test strips in accordance with the suggestion of minimum government reimbursement for type 2 adult diabetes patients with a higher risk of hypoglycemia.
Figure 5.3 Group 3 – Non-users of insulin
| Agency association |
Recommendations |
| Group 3 is expected to be mainly composed of adult type 2 diabetes patients. Therefore, only the recommendations pertaining to the adult type 2 patients were considered when analyzing the recommended or suggested average weekly use in Group 3. Nevertheless, women with gestational diabetes and children with type 2 diabetes may also be present in this cohort. |
| CDA 2008 |
“……the frequency of SMBG should be individualized…” |
| CADTH 2009 |
For most type 2 adult patients: “…routine use … is not recommended”. |
| CDA 2011 |
For type 2 adult patients: “…suggest a minimum government reimbursement… - 15 test strips per month [for those with lower risk of hypoglycemia], and - 30 test strips per month [for those with higher risk of hypoglycemia].”
Interpreted to mean a minimum average weekly use of 4 and 7 test strips for lower and higher risk patients, respectively. |
| Recommended or suggested average weekly use for type 2 diabetes patients: |
 |
Patient distribution* by average weekly blood glucose test strip use, by jurisdiction, 2008
Note: Values may not add to total or subtotal percentages due to rounding. SMBG, self-monitoring of blood glucose.
* Cohort of patients with continuous use of diabetes drugs and/or blood glucose test strips.
Data source: National Prescription Drug Utilization Information System Database, Canadian Institute for Health Information
1 Canadian Diabetes Association (CDA). 2008 Clinical Practice Guidelines for the Prevention and Management of Diabetes in Canada, Monitoring Glycemic Control. Canadian Journal of Diabetes. 2008; 32(Supplement 1): S32. Available at: http://www.diabetes.ca/files/cpg2008/cpg-2008.pdf (Accessed April 2, 2013).
2 Canadian Agency for Drugs and Technologies in Health (CADTH). Optimal Therapy Recommendations for the Prescribing and Use of Blood Glucose Test Strips. COMPUS Optimal Therapy Report. 2009; 3(6): Table 1, p. 5. Available at: www.cadth.ca/media/pdf/compus_BGTS_OT_Rec_e.pdf (Accessed April 2, 2013).
3 Canadian Diabetes Association (CDA). Comments in Response to the COMPUS Recommendations Commentary: Self- Monitoring of Blood Glucose in People with Type 2 Diabetes: Canadian Diabetes Association Briefing Document for Healthcare Providers. Canadian Journal of Diabetes. 2011; 35(4): 317. Available at: http://www.diabetes.ca/documents/for-professionals/CJD--Sept_2011--SMBG.pdf (Accessed April 2, 2013).
4 Canadian Diabetes Association (CDA). The 2013 Canadian Diabetes Association Clinical Practice Guidelines are coming! CDA News. 2012. Available at: http://www.diabetes.ca/get-involved/news/the-2013-canadian-diabetes-associationclinical- practice-guidelines-are-com/ (Accessed April 2, 2013).
5 Public Health Agency of Canada. Diabetes in Canada: Fact and figures from a public health perspective. 2011. Available at: http://www.phac-aspc.gc.ca/cd-mc/publications/diabetesdiabete/facts-figures-faits-chiffres-2011/pdf/facts-figures-faitschiffres-eng.pdf (Accessed April 2, 2013).
12 Canadian Diabetes Association (CDA). CDA Self-Monitoring of Blood Glucose (SMBG) Recommendation Tool for Healthcare Providers. Available at: http://www.diabetes.ca/documents/for-professionals/SMBG_HCP_Tool_9.pdf (Accessed April 2, 2013).
13 Canadian Diabetes Association (CDA). Taking a Stand: Advocacy Position Statements on the issues facing people with diabetes in Canada. August 2011. Available at: http://www.diabetes.ca/documents/about-diabetes/Taking-AStand.pdf (Accessed April 2, 2013).
14 Canadian Diabetes Association (CDA). 2012 Annual Report. Available at: www.diabetes.ca/files/annual-report-12/CDA_AR12_Digital_Final_LR_SP.pdf (Accessed April 2, 2013).
15 Cameron et al. Utilization and Expenditure on Blood Glucose Test Strips in Canada. Canadian Journal of Diabetes. 2010; 34(1): 34–40. Available at: http://www.diabetes.ca/documents/for-professionals/CJD--March_2010--Cameron,C.pdf (Accessed April 2, 2013).
16 Canadian Agency for Drugs and Technologies in Health (CADTH). Cost-Effectiveness of Blood Glucose Test Strips in the Management of Adult Patients with Diabetes Mellitus. COMPUS Optimal Therapy Report. 2009; 3(3). Available at: http://www.cadth.ca/media/pdf/BGTS_Consolidated_Economic_Report.pdf (Accessed April 2, 2013).
17 Cameron et al. Cost-effectiveness of self-monitoring of blood glucose in patients with type 2 diabetes mellitus managed without insulin. Canadian Medical Association Journal. 2010; 182(1): 28–34. Available at: http://www.ncbi.nlm.nih.gov/pmc/articles/PMC2802601/ (Accessed April 2, 2013).
Limitations
The blood glucose test strip utilization patterns observed in 2008 are compared with the recommendations issued during the same year (CDA September 2008) and in subsequent years (CADTH July 2009 and CDA September 2011). Subsequent changes in utilization are not reflected in this analysis.
The analysis was performed using public drug plan data from Saskatchewan, Manitoba and Nova Scotia. These drug plans all have specific reimbursement policies, pricing, demographics, physician prescribing practices and prevalence of diabetes. Furthermore, public drug plan data represents only one component of the overall pharmaceutical market. Therefore, these results should not be extrapolated to the overall Canadian marketplace, as the findings may be different for test strip use reimbursed under other publicly or privately funded plans or paid for out-of-pocket by patients.
The treatment group analysis was conducted on a subset of patients who continuously used diabetes drugs and/or test strips in 2008 in public drug plans in Saskatchewan, Manitoba and Nova Scotia. The results may differ in the overall drug plan population.
The recommendations are sometimes specific to type 1, type 2 and gestational diabetes. Because the administrative public drug plan data does not provide diagnostic information, the analysis could not distinguish between the three types of diabetes.
Test strip use that falls outside the recommended or suggested thresholds should not be interpreted as inappropriate use, overuse or underuse of test strips. Both the CDA and CADTH discuss exceptions, acknowledge individual circumstances and stress that the frequency of test strip use should be individualized for most or all patients. This analysis deals with broad recommendations and does not capture individualized treatments.
The reporting focuses on the 2008 calendar year and captures only the prescriptions dispensed that year. Test strips dispensed prior to this period may have been used in part or in total in 2008. This is not captured in this analysis, and thus, the results may understate the use in 2008. Moreover, the test strips dispensed in 2008 may have been used in the following calendar year, and thus, the results may overstate the use in 2008. However, the cumulative impact on the results is expected to be minimal.
The administrative drug plan data only captures what was dispensed to a patient and what was reimbursed by the plan. It is not known whether the patient actually used the drugs or test strips as prescribed. Any test strip use not submitted to the drug plan for reimbursement or towards the deductible is not part of this study.
Furthermore, any use of OAA and insulin by the cohort patients outside the public drug plan is not captured. This includes drugs covered under prior approval processes, paid for out-of-pocket or reimbursed by a private plan without coordinating the benefits with the public plans analyzed. This may have an impact on cohort selection, as well as on the group under which the patients fall.
Note that the results do not exclude any off-label use of any OAA or use for an indication other than diabetes (e.g., metformin use in women with polycystic ovary disease, who may not be diabetic).
The prices reported in the international price comparison section do not capture off-invoice discounts, free goods, and rebates, which test strip manufacturers may provide to pharmacies.9
This study does not attempt to estimate the expenditure associated with use that falls outside the recommended or suggested use.
References
9 Competition Bureau Canada. Benefiting from Generic Drug Competition in Canada: The Way Forward. November 2008. Available at: http://www.competitionbureau.gc.ca/eic/site/cb-bc.nsf/vwapj/GenDrugStudy-Report-081125-fin-e.pdf/$FILE/GenDrugStudy-Report-081125-fin-e.pdf (Accessed April 2, 2013).
Conclusions
The cost and utilization of test strips in public drug plans in Saskatchewan, Manitoba and Nova Scotia was analyzed for the 2008 calendar year. The total prescription cost for these jurisdictions was $13.1 million, $13.7 million and $6.9 million, respectively. The quantities of test strips dispensed were 15.4 million, 16.3 million and 8.4 million, respectively. The cost of individual test strips averaged $0.7814 in the three provinces, including pharmacy markup, and $0.8417 adding in the dispensing fees.
An analysis of the average cost per strip in the US, UK and France, revealed that test strips were less expensive internationally. The lowest average cost per test strip, excluding pharmacy markup, among the three Canadian jurisdictions was $0.7273 in 2008. This cost was nearly twice as much as the average price on the 2010 United States Federal Supply Schedule price list ($0.3934 in Canadian dollars) and significantly higher than the average list price of the 2008 national formularies in the United Kingdom and France ($0.5611 and $0.4850, respectively, in Canadian dollars).
A treatment group analysis was conducted on a cohort of patients who continuously used insulin, oral antihyperglycemic agents (OAA) and/or test strips in 2008. The results suggest that the non-users of insulin are the largest group, accounting for close to three quarters of the diabetes cohort, but are less frequent users of test strips. Although insulin users (with or without OAA) represent approximately one quarter of the cohort, they account for about one half of the test strip use and related prescription costs.
For each treatment group, the frequency of test strip use was analyzed using 2008 public drug plan data from Saskatchewan, Manitoba and Nova Scotia. The utilization data was then compared with the CDA (2008 and 2011) and CADTH (2009) recommendations and suggestions for use.
Note that the CDA 2008 guidelines are based on clinical evidence and focus on the minimum use of test strips. The CADTH 2009 recommendations are based on both clinical evidence and cost effectiveness, focus on the optimal test strip usage, and suggest a maximum use. The CDA 2011 comments address the issue of cost-effectiveness raised by CADTH and make suggestions for minimum government reimbursement.
In general, the results are consistent across the three jurisdictions. The variations that do exist may be the result of differences in the demographic profile of the beneficiary population, the drug plan design, physician prescribing practices and the prevalence of the types of diabetes in each province, among other things.
A summary of the findings follows:
Group 1 – Insulin-only Users, assumed to be mostly type 1 diabetes patients:
- CDA 2008 recommends that “[SMBG] should be undertaken at least 3 times per day”.
- Up to 36% of insulin-only users in 2008 were in line with this recommendation.
- CADTH 2009 “recommends that the optimal daily frequency of SMBG be individualized” and states that “ SMBG is an essential component of diabetes management”.
- Up to 91% of insulin-only users in 2008 were in line with this recommendation.
- CDA 2011 makes no further recommendation.
Group 2 – Insulin and OAA Users, assumed to be mostly adult type 2 diabetes patients:
- CDA 2008 recommends that “[SMBG] should be undertaken at least 3 times per day. (…). In those with type 2 diabetes on once-daily insulin in addition to OAA, testing at least once a day at variable times is recommended”.
In 2008:
- Up to 19% of the insulin and OAA users used an average number of test strips in line with the minimum recommendation of 3 test strips per day.
- The majority (56%–71%) of the insulin and OAA users used an average of at least 1 test strip per day, although it is not known whether these patients were on once-daily insulin.
- For type 2 adult patients, CADTH 2009 “…recommends that the optimal daily frequency of SMBG be individualized” and “…suggests that the maximum weekly frequency of SMBG is 14 tests per week for most of these patients”.
- The majority of the insulin and OAA users in 2008 (56% to 61%) used test strips in line with this suggestion.
- In 2011, the CDA comments that it “is in general agreement [with CADTH (…)], however, we recommend that the amount of SMBG be individualized for all people …” and adds that “… we believe it is most practical and reasonable not to limit SMBG for adults with type 2 diabetes using insulin”.
Group 3 – Non-users of Insulin, assumed to be mostly adult type 2 diabetes patients:
- CDA 2008 recommends that “… the frequency of SMBG should be individualized …”
- For most type 2 adult patients in this treatment group, CADTH indicates that “…routine use … is not recommended”.
- Patients that did not use test strips accounted for 32%, 43% and 26% of the non-users of insulin in Saskatchewan, Manitoba and Nova Scotia, respectively, in 2008. Furthermore, lower-end users may not have used test strips routinely, although precise conclusions could not be drawn.
- For type 2 adult patients, the CDA 2011 “…suggest[s] a minimum government reimbursement of SMBG test strips of 15 test strips per month [for those using no pharmacotherapy or pharmacotherapy with a lower risk of hypoglycemia], and 30 test strips per month [for those using any pharmacotherapy with a higher risk of hypoglycemia]”.
- The majority of the non-users of insulin in 2008 (59% to 81%) used test strips in line with this suggestion of minimum government reimbursement.
Appendix 1: Synopsis of the Key Available Research
Cameron et al. Cost-effectiveness of self-monitoring of blood glucose in patients with type 2 diabetes mellitus managed without insulin. Canadian Medical Association Journal. 2010; 182(1): 28–34.17
- Synopsis: In this study (conducted at CADTH), the authors found that “For most patients with type 2 diabetes not using insulin, use of blood glucose test strips for frequent self-monitoring (>7 times per week) is unlikely to represent efficient use of finite health care resources, although periodic testing (e.g., 1 or 2 times per week) may be cost-effective.” Estimates were derived using the UK Prospective Diabetes Study (UKPDS) Outcome Model and test strip cost figures from the Ontario Public Drug Programs.
Cameron et al. Utilization and Expenditure on Blood Glucose Test Strips in Canada. Canadian Journal of Diabetes. 2010; 34(1): 34–40.15
- Synopsis: In another study conducted at CADTH, the authors noted considerable expenditures on test strips in both public and private plans in Canada ($248M and $82M, respectively in 2006). Based on a treatment-group analysis that used claims-level data from the Ontario Public Drug Programs, they concluded that “Given the size of the investment and lack of convincing evidence that routine self-monitoring of blood glucose is beneficial for patients not using insulin, there may be more cost-effective strategies for improving the health of this population.”
Gomes et al. Blood glucose test strips: options to reduce usage. Canadian Medical Association Journal. 2010; 182(1): 35–38.18
- Synopsis: In a study conducted at the Institute for Clinical Evaluative Sciences (ICES), the authors used Ontario Public Drug Program data on Ontario seniors for a 12 year period (January 1997 to December 2008) to explore the implications of 5 hypothetical policy scenarios designed to reduce test strip use. More selective testing (i.e., restricting use by patients who do not use insulin) could reduce 2008 test strip use by 9.5 million strips to 74.5 million strips. In the full report released by ICES, corresponding hypothetical cost reductions were estimated − $6.9M to $54.2M (8.0% to 63.4% of Ontario senior expenditures on test strips) for 2008, and $26M to about $300M for the 2009-13 period.
Malanda et al. Self-monitoring of blood glucose in patients with type 2 diabetes mellitus who are not using insulin (Review). The Cochrane Collaboration. JohnWiley & Sons, Ltd; 2012.19
- Synopsis: This study assessed the effects of SMBG in patients with type 2 diabetes mellitus who are not using insulin by conducting a systematic review of twelve randomized controlled trials, which evaluated outcomes in 3,259 randomized patients. The authors conclude that “when diabetes duration is over one year, the overall effect of self-monitoring of blood glucose on glycaemic control in patients with type 2 diabetes who are not using insulin is small up to six months after initiation and subsides after 12 months. Furthermore, based on a best-evidence synthesis, there is no evidence that SMBG affects patient satisfaction, general wellbeing or general health-related quality of life.”
McIntosh et al. Efficacy of self-monitoring of blood glucose in patients with type 2 diabetes mellitus managed without insulin: a systematic review and meta-analysis. Open Medicine. 2010; 4(2).20
- Synopsis: A systematic review and meta-analysis was conducted to determine the effect of selfmonitoring versus no self-monitoring, and the optimal frequency of self-monitoring, in patients with type 2 diabetes managed without insulin. The authors conclude that “On the basis of limited evidence, self-monitoring of blood glucose levels did not demonstrate consistent benefits in terms of quality of life, patient satisfaction, prevention of hypoglycemia or long-term complications of diabetes, or reduction of mortality. There was insufficient evidence pertaining to the optimal frequency of self-monitoring.”
Therapeutics Initiative. Self-Monitoring of Blood Glucose in Type 2 Diabetes. Therapeutics Letter. 2011; Issue 81(Apr–Jun)21
- Synopsis: This Letter presents data on the costs of SMBG and attempts to answer whether these costs are warranted in patients with type 2 diabetes not receiving insulin. The data on the costs of SMBG from British Columbia is reported for 1996 to 2009. Also, a discussion is provided on the systematic review conducted by CADTH in 2009 of the effect of using SMBG versus no SMBG in patients with non-insulin treated type 2 diabetes. The Letter concludes among other things that “most non-insulin treated patients with type 2 diabetes do not require routine SMBG” and that “type 2 diabetes management should focus on weight management, appropriate nutrition, regular physical activity and blood pressure control, rather than intensive glucose lowering treatment”.
Woo et al. Self-monitoring of Blood Glucose in Individuals with Type 2 Diabetes Not Using Insulin: Commentary. Canadian Journal of Diabetes. 2010; 34(1): 19–23.22
- Synopsis: The authors concluded that “there are two main considerations regarding the appropriateness of SMBG in individuals with type 2 diabetes. The first is patient safety, particularly with respect to hypoglycaemia. […] The second consideration is that SMBG can be used to motivate and enable individuals and their caregivers to receive instant feedback regarding the BG levels so that their diabetes management is optimized and diabetes complications are prevented.”
15 Cameron et al. Utilization and Expenditure on Blood Glucose Test Strips in Canada. Canadian Journal of Diabetes. 2010; 34(1): 34–40. Available at: http://www.diabetes.ca/documents/for-professionals/CJD--March_2010--Cameron,C.pdf (Accessed April 2, 2013).
17 Cameron et al. Cost-effectiveness of self-monitoring of blood glucose in patients with type 2 diabetes mellitus managed without insulin. Canadian Medical Association Journal. 2010; 182(1): 28–34. Available at: http://www.ncbi.nlm.nih.gov/pmc/articles/PMC2802601/ (Accessed April 2, 2013).
18 Gomes et al. Blood glucose test strips: options to reduce usage. Canadian Medical Association Journal. 2010; 182(1): 35–38. Available at: http://www.cmaj.ca/content/182/1/35.full.pdf+html (Accessed April 2, 2013).
19 Malanda et al. Self-monitoring of blood glucose in patients with type 2 diabetes mellitus who are not using insulin (Review). The Cochrane Collaboration. JohnWiley & Sons, Ltd; 2012. Available at: www.thecochranelibrary.com/details/file/1443367/CD005060.html (Accessed April 2, 2013).
19 McIntosh et al. Efficacy of self-monitoring of blood glucose in patients with type 2 diabetes mellitus managed without insulin: a systematic review and meta-analysis. Open Medicine. 2010; 4(2). Available at: http://www.openmedicine.ca/article/view/342/328 (Accessed April 2, 2013).
21 Therapeutics Initiative. Self-Monitoring of Blood Glucose in Type 2 Diabetes. Therapeutics Letter. 2011; Issue 81(Apr–Jun). Available at: http://www.ti.ubc.ca/sites/ti.ubc.ca/files/81.pdf (Accessed April 2, 2013).
22 Woo et al. Self-monitoring of Blood Glucose in Individuals with Type 2 Diabetes Not Using Insulin: Commentary. Canadian Journal of Diabetes. 2010; 34(1): 19–23. Available at: http://www.diabetes.ca/documents/for-professionals/CJD-Spring-2010.pdf (Accessed April 2, 2013)