Analytical Snapshot: International Generic Price Comparison, Early 2011
August 2013
ISBN: 978-1-100-22630-9
Cat. No.: H82-14/2013E-PDF
PDF (899 Kb)
Executive Summary
This analytical snapshot compares generic drug prices in Canada with those of other industrialized countries. The report highlights the changes in Canadian generic pricing that occurred between 2008 (the last period reported in previous NPDUIS publications: PMPRB 2010, 2011) and the first quarter of 2011. Generic prices from IMS Health's MIDAS™ database and the Ontario formulary were used to conduct price comparisons.
Since 2010, most provincial governments have implemented generic pricing policies that have had a significant impact on generic prices in Canada. Although the full impact of these changes is not reflected in the data reported in this analysis, some early trends do emerge.
This analysis suggests that:
- Between 2008 and early 2011 (first quarter 2011), Canadian prices for many generic drugs decreased by up to 30%, widening the gap between generic and brand name prices (as reported in IMS Health's MIDAS database).
- Over the same period, generic prices in many comparator countries decreased between 1.9% and 21.5%, on average, depending on the country.
- In early 2011, the mean foreign prices were 0.65 of corresponding Canadian prices. In other words, international generic price levels were 35% lower than in Canada. These levels are similar to those reported for 2007 and 2008.
- By 2010, the Ontario government reduced generic prices to a maximum of 25% of the reference brand price for most drugs. A supplementary assessment using Ontario formulary prices for 50 of the top-selling generic drugs in Canada is provided in this analysis. The mean foreign prices were 21% lower than Ontario formulary prices, which were some of the lowest in Canada.
It is important to note that differences in regulations, marketing practices and reimbursement policies create significant challenges for international price comparisons and should be considered in interpreting these results.
Future work planned for 2014/15 will provide a more comprehensive assessment of the current generic prices in Canada relative to international levels.
PMPRB. December 2010. Generic Drugs in Canada: Price Trends and International Price Comparisons, 2007. Ottawa: Patented Medicine Prices Review Board. Available from Generic Drugs in Canada: Price Trends and International Price Comparisons, 2007 (Accessed June 1, 2013).
PMPRB. September 2011. Generic Drugs in Canada: International Price Comparisons and Potential Cost Savings. Ottawa: Patented Medicine Prices Review Board. Available from: Generic Drugs in Canada: International Price Comparisons and Potential Cost Savings (Accessed June 1, 2013).
Acknowledgements
This report was prepared by the Patented Medicine Prices Review Board (PMPRB) as part of the National Prescription Drug Utilization Information System (NPDUIS).
The PMPRB would like to acknowledge the contributions of:
- The members of the NPDUIS Steering Committee, for their expert oversight and guidance in the preparation of this report.
- The PMPRB NPDUIS staff for their contribution to the analytical content of the report: Tanya Potashnik, A/Director Policy and Economic Analysis, Elena Lungu, A/Manager NPDUIS and the PMPRB scientific and editing groups.
- Orlando Manti, SAS Consultant, for generating the data tables used in the analysis.
Disclaimer
NPDUIS is a research initiative that operates independently of the regulatory activities and other reporting activities of the PMPRB. The statements and opinions expressed in this NPDUIS report do not represent the official position of the PMPRB.
Although based in part on data obtained under license from the MIDAS IMS database, the statements, findings, conclusions, views and opinions expressed in this report are not attributable to IMS Health Consulting Inc.
Table Of Contents
- Introduction
- Methods
- Limitations
- 1. Foreign-to-Canadian Price Trends
- 2. Foreign-to-Ontario Price Comparison for Top-Selling Drugs
- 3. Conclusion
- References
- Appendix A: Pricing Policies for Generic Drugs in Provincial Drug Plans
- Appendix B: Definitions
- Appendix C: Bilateral Price Comparison at Drug Level
- Appendix D: Multilateral Price Comparison at Drug Level
Introduction
International generic price comparisons allow for a relative assessment of domestic price levels and inform policy decisions. This report compares generic drug prices in Canada with those in other industrialized countries. The results establish national and international price trends by country. Furthermore, an analysis of the Ontario formulary prices provides more in-depth up-to-date results.
The report highlights the changes in generic pricing that occurred between 2008 (the last period reported in previous NPDUIS publications: PMPRB 2010, 2011) and the first quarter of 2011 (Q1-2011, January to March). While the report focuses on Q1-2011, previous time periods are also reported for trend analysis.
The data source for the Canadian and international generic prices was MIDAS™, IMS Health Consulting Inc. All Rights Reserved. The analysis also reports publicly available formulary prices for the Ontario Drug Benefit Program that reflect the drug system reforms implemented in Ontario which reduced generic prices to a maximum of 25% of the reference brand-name price for most drugs1.
The analysis of foreign-to-Canadian price trends was conducted for the seven PMPRB foreign comparator countries: France, Germany, Italy, Sweden, Switzerland, the UK and the US. The supplementary analysis of foreign-to-Ontario price comparisons for top-selling drugs considers four additional countries: the Netherlands, Spain, Australia and New Zealand, which were included in a previous PMPRB study (PMPRB 2010).
1 The November 2012 edition of the Ontario Drug Benefit formulary was considered in this analysis.
Methods
The average foreign-to-Canadian and foreign-to-Ontario price ratios are reported. These are calculated for bilateral and multilateral measures of foreign price. The bilateral price ratio provides a head-to-head comparison of prices in a particular country to prices available in Canada and in the Ontario formulary. The multilateral price ratios report the minimum, mean, median and maximum prices available in the foreign markets analyzed.
The foreign-to-Canadian price ratios reported are weighted averages based on Canadian sales.
The Canadian and international prices reported in IMS Health's MIDAS database are manufacturer prices reflective of all sales to the pharmacy sector. These are average prices for all generic versions of a drug, encompassing all generic trade names available in a particular country. Market spot exchange rates were used to convert foreign currency prices into their Canadian dollar equivalents.
The formulary prices for the Ontario Drug Benefit Program do not include wholesale upcharges or pharmacy markups.
The analysis is limited to oral solid prescription drugs with annual sales of over $1 million and includes generic drugs that have been on the market for at least one year.
Limitations
Since 2010, many provincial governments have implemented, and continue to implement, generic pricing policies that result in significant price reductions, including the Council of the Federation's2 initiative that reduced the prices for six of the most common generic drugs to 18% on April 1, 2013.
Appendix A provides a summary of the recent provincial pricing policies for generic drugs. The data reported in this study represents a snapshot in time, with prices reported as of the first quarter of 2011. Although the full impact of the recent provincial pricing policies is not captured in the data reported in this analysis, some early trends do emerge.
Future work planned for 2014/15 will provide a more comprehensive assessment of the current generic prices in Canada relative to international levels.
The international prices available in IMS Health's MIDAS database (IMS Health Consulting Inc. All Rights Reserved.) are estimated factory-gate prices and do not capture off-invoice price rebates and allowances, which manufacturers may provide to retailers to stock their interchangeable products (Competition Bureau 2008). Consequently, the prices reported do not necessarily reflect the net revenue to manufacturers.
The analysis reports the estimated manufacturer prices, which may be different from other price points in the distribution chain, such as wholesaler or pharmacy retail prices. Therefore, the reported prices may not reflect the prices paid by the consumer or reimbursed by the public and private plans.
The methodology used by MIDAS for estimating drug prices varies by country and depends on the distribution system, as well as the availability of data at various points in the distribution chain, including the manufacturer's price, the wholesale price and the pharmacy price in specific markets. Price points in the distribution channel for which there is no price data sourced by MIDAS are calculated based on assumed wholesaler and pharmacy mark-ups in each market.
Generic prices reported for the Canadian marketplace reflect a mixture of varying provincial generic pricing policies and the timing of implementation of these policies, as well as the generic prices paid by private insurers and persons paying out-of-pocket. Variations in distribution, reimbursement and marketing practices may pose important limitations on inter-jurisdictional price comparisons.
Note also that the foreign-to-Ontario price comparison compares the Ontario formulary prices, which are some of the lowest in Canada, with the average price in foreign markets. Lower prices than the average reported in this study may be available for certain market segments (e.g., public or private purchasers).
The analysis does not attempt to capture the impact and/or savings that may be associated with specific policies aimed at encouraging early generic drug launches in Canada or internationally.
2 Established in 2003, the Council of the Federation comprises Canada's 13 provincial and territorial Premiers and enables them to work collaboratively to strengthen the Canadian federation by fostering a constructive relationship among the provinces and territories, and with the federal government. For more information, see Council of the Federation.
1. Foreign-to-Canadian Price Trends
This section analyzes generic price trends in Canada and compares Canadian prices to those of the seven industrialized countries that the PMPRB considers in reviewing the prices of patented drug products. The periods reported are for the 2007 and 2008 calendar years as well as the first quarter (Q1 – January to March) of 2009, 2010 and 2011.
The results suggest that the Canadian prices for many generic drug products have dropped markedly between Q1-2009 and Q1-2011. Figure 1.1 reports the distribution of generic drugs and corresponding generic sales by the percent of price change between Q1-2009 and Q1-2011.
Highlighted in yellow, the figure reports the share of generics with a price increase of up to 10%: this represents 28.9% of the generic drugs and accounts for 15.7% of the generic sales in Q1-2011.
Highlighted in green, the figure reports the share of generics with a price reduction of up to 30%: this represents 56% of the drugs and accounts for 76% of the generic sales in Q1-2011.
Figure 1.1 – Distribution of generic drugs and sales by percent reduction in prices between Q1-2009 and Q1-2011, Canada
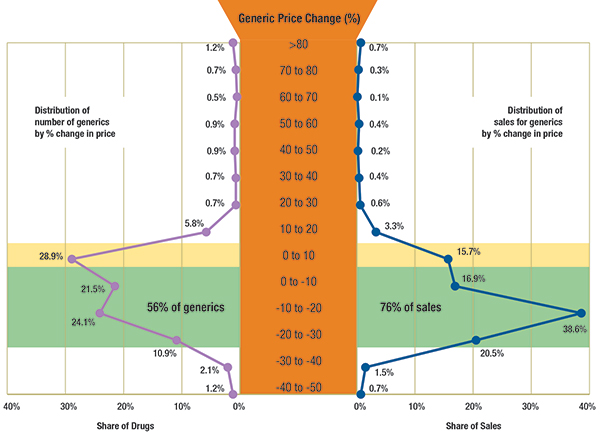
Results based on 432 generic drugs, identified at ingredient, strength and form levels.
Data Source: MIDAS™, January–March 2009 and January–March 2011
IMS Health Consulting Inc. All Rights Reserved.
The gap between brand-name and generic prices in Canada increased over the period of analysis (Figure 1.2). While in Q1-2009 and Q1-2010 generic drugs were priced on average at 68%–69% of the brand-name price, in Q1-2011, they were at 64%. When generic drugs were sales weighted, the average generic prices as a percentage of the brand-name prices in Q1-2011 were even lower at 56%.
Corresponding average price differentials for Q1-2011 for the comparator countries are also reported in Figure 1.2.
Figure 1.2 – Average generic prices as a percentage of brand-name prices*, Canada, Q1-2009, Q1-2010 and Q1-2011
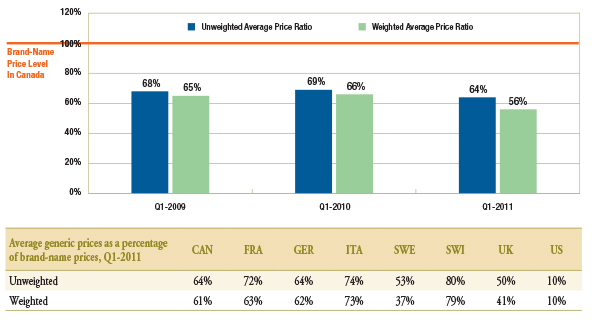
* Note that there are also differences in the brand-name prices among the countries. The brand prices used to generate these results correspond to the periods analyzed and could differ from the brand prices used to set the generic prices at entry. Thus, these results capture the brand price reductions post generic entry.
Data Source: MIDAS™, January–March 2009, January–March 2010 and January–March 2011
IMS Health Consulting Inc. All Rights Reserved.
The average foreign-to-Canadian price ratios reported in this section are sales-weighted arithmetic averages of the corresponding foreign-to-Canadian price ratios for individual drugs. These ratios provide exact answers to questions such as:
“How much more or less would Canadians have paid for the generic drugs they purchased in Q1-2011 had they paid prices prevailing in foreign markets?”
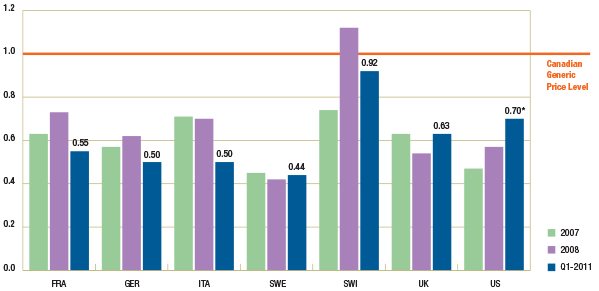
Figure 1.3 suggests that there has been no appreciable change in the average foreign-to-Canadian generic price ratios between 2007/2008 (see PMPRB 2010, 2011) and Q1-2011.
The Canadian generic price level is set to a value of 1. An average foreign-to-Canadian price ratio below or above 1 indicates a lower or higher average foreign price, respectively. (See Appendix B for a definition of the measures reported).
Figure 1.3 – Average foreign-to-Canadian generic price ratios by multilateral comparator, 2007, 2008 and Q1-2011
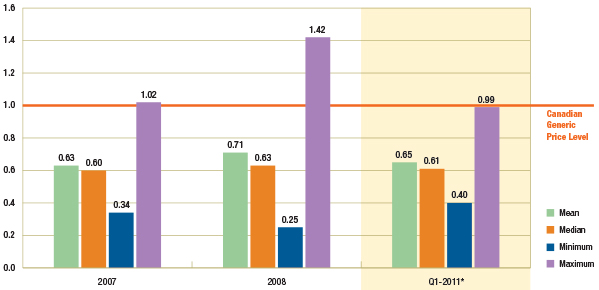
* Note that the analysis was restricted to generic drugs that had been on the market for at least one year. If the restriction was removed, the only notable change would be in the Q1-2011 results for the mean and maximum foreign-to-Canadian price ratio, which would be revised to 0.68 and 1.16, respectively. It is mainly the US price of one drug that would drive the difference in the results.
Data Source: MIDAS™, January–December 2007, January–December 2008 and January–March 2011
IMS Health Consulting Inc. All Rights Reserved.
In Q1-2011, the mean and median foreign prices were 0.65 and 0.61 of the generic price levels in Canada, respectively. Further provincial policies that reduced the prices of generic drugs have been implemented since then.
Figure 1.4 reports the trend in foreign-to-Canadian generic price ratios by country. The results suggest that in Q1-2011, generic prices continued to be lower in many foreign markets.
Figure 1.4 – Average foreign-to-Canadian generic price ratios by bilateral comparator, 2007, 2008 and Q1-2011
* Note that the analysis was restricted to generic drugs that had been on the market for at least one year. If the restriction was removed, the only notable change would be in the Q1-2011 results for the foreign-to-Canadian price ratio for the US, which would be revised to 0.91. It is mainly the US price of one drug that would drive the difference in the results.
Data Source: MIDAS™, January–December 2007, January–December 2008 and January–March 2011
IMS Health Consulting Inc. All Rights Reserved.
As Figure 1.5 suggests, these trends may in part be explained by the fact that in many of the countries analyzed, the prices of generic drugs have also declined between Q1-2009 and Q1-2011. The figure reports the average country specific price change along with the number of drugs with available prices in the foreign markets that are included in the average, and the corresponding Canadian sales.
As a result of international trends, Canadian generic prices are still on average higher than in other industrialized countries.
Figure 1.5 – Average generic price change by country, Q1-2009 versus Q1-2011
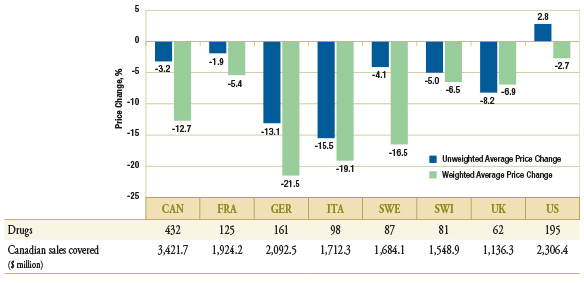
Data Source: MIDAS™, January–March 2009 and January–March 2011
IMS Health Consulting Inc. All Rights Reserved.
2. Foreign-to-Ontario Price Comparison for Top-Selling Drugs
This section compares the Ontario formulary prices with those of 11 industrialized countries in Q1-2011. The analysis focuses on 50 of the top-selling generic drugs (at ingredient, strength and form level) in Canada in Q1-2011 with prices available in both the Ontario Drug Benefit formulary and the comparator countries. In Q1-2011, the top 50 generic drugs accounted for nearly half (47.8%) of generic sales in Canada.
Ontario formulary prices were used for drug-to-drug price comparisons with foreign prices. However, the volume of sales in Canada for each drug was used to calculate the average price ratios. Therefore, the average ratios reported in this section are Canadian sales-weighted arithmetic averages of the corresponding foreign-to-Ontario price ratios for individual drugs. Consequently, the results provide answers to the following question:
“Assuming all Canadians were paying the Ontario formulary prices in Q1-2011, how much more or less would they have spent on the top 50 generic drugs if they had paid the prices prevailing in country X?”
The bilateral comparison suggests that in Q1-2011, foreign prices for the top 50 generic drugs were typically less than the corresponding Ontario prices.
Figure 2.1 reports the average foreign-to-Ontario price ratio for each country analyzed. The Ontario formulary price is set to the value of 1. An average foreign-to-Ontario price ratio below or above 1 indicates a lower or higher average foreign price, respectively. The table below indicates the number of drugs used to calculate the average ratio for each country, that is, the number of drugs with available price data. It also reports the corresponding Canadian sales and markets shares for the available drugs.
Figure 2.1 – Average foreign-to-Ontario price ratio, by bilateral comparators
Top 50 generic drugs, Q1-2011
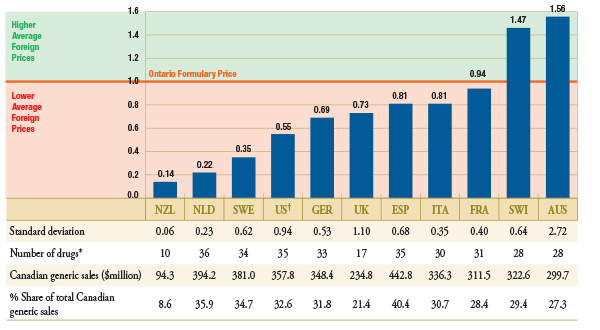
* Depending on the average price availability in the country.
† Note that the analysis was restricted to generic drugs that had been on the market for at least one year. If the restriction was removed, the only notable change in the results would be in the foreign-to-Ontario price ratio for the US, which would be revised to 1.34 (standard deviation of 2.71). It is the US price of one drug that would drive the difference in the results.
Average foreign-to-Ontario price ratios are weighted based on the Canadian volume of sales.
Data Sources: Ontario Drug Benefit Formulary, November 2012
MIDAS™, January–March 2011, IMS Health Consulting Inc. All Rights Reserved.
New Zealand, the Netherlands, Sweden and the United States had the lowest generic prices compared to Ontario. Germany, the United Kingdom, Spain, Italy and France also had lower generic prices than Ontario. Australia and Switzerland had, on average, higher generic prices than Ontario.
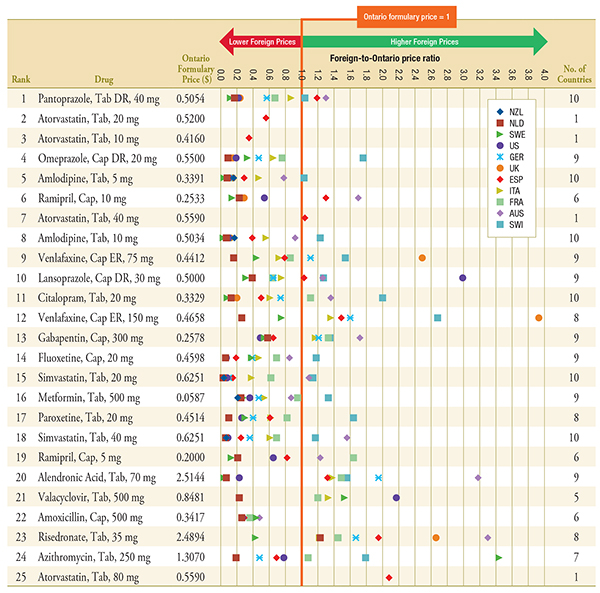
Figure 2.2 reports the average foreign-to-Ontario price ratios for all 11 countries represented in Figure 2.1. Only drugs with prices available in three or more foreign countries were included in these multilateral measures. The results are reported for 38 of the top 50 generic drugs. The other 12 drugs had foreign prices available only in one or two countries.
Figure 2.2 – Average foreign-to-Ontario price ratio*, by multilateral comparators
Top 50 generic drugs, Q1-2011
* Note that the analysis was restricted to generic drugs that had been on the market for at least one year. If the restriction was removed, the only notable change in the results would be in the mean and maximum foreign-to-Ontario price ratios, which would be revised to 0.87 and 2.51, respectively. It is the US price of one drug that would drive the differences in the results.
† Depending on the average price availability in the country.
Average foreign-to-Ontario price ratios are weighted based on the Canadian volume of sales.
Data Sources: Ontario Drug Benefit Formulary, November 2012
MIDAS™, January–March 2011, IMS Health Consulting Inc. All Rights Reserved.
The multilateral comparison suggests that in Q1-2011, the mean and median foreign prices were 0.79 and 0.64, respectively, of those listed in the Ontario formulary. The minimum foreign prices were as low as 0.16 of Ontario prices and the maximum foreign prices were as high as 1.97.
For each of the 50 top-selling generic drugs included in this analysis, Appendix C and Appendix D provide the drug-level foreign-to-Ontario price ratios by bilateral and multilateral comparator country, respectively.
3. Conclusion
The analysis suggests that in Q1-2011, generic drugs were typically less expensive in foreign markets than in Canada, whether Canadian national prices or Ontario formulary prices were used for analysis. In particular:
- although Canadian prices for many generic drugs were markedly reduced by Q1-2011, the mean international prices were still, on average, 35% lower; and
- while the Ontario generic price levels were some of the lowest in the country, top-selling generic drugs were priced, on average, 21% lower in foreign markets.
The data reported in this study represents a snapshot in time, capturing some of the changes since the last NPDUIS publication on generic price comparisons. Given the dynamic nature of this market, generic prices have evolved, and further reporting is required to assess current generic prices in Canada relative to international levels.
References
Competition Bureau Canada. 2008. Benefiting from Generic Drug Competition in Canada: The Way Forward. Available at: Competition Bureau Canada (Accessed June 1, 2013).
PMPRB. 2010. Generic Drugs in Canada: Price Trends and International Price Comparisons. Available at Generic Drugs in Canada: Price Trends and International Price Comparisons, 2007 (Accessed June 1, 2013).
PMPRB. 2011. Generic Drugs in Canada: International Price Comparisons and Potential Cost Savings. Patented Medicine Prices Review Board. Available at Generic Drugs in Canada: International Price Comparisons and Potential Cost Savings (Accessed June 1, 2013).
Appendix A: Pricing Policies for Generic Drugs in Provincial Drug Plans
Table A provides a summary as of July 1, 2013, of the generic price reduction policies across provinces along with their effective dates.
Table A. Provincial generic pricing policies, generic price as a percentage of the brand price
| Province |
2010 |
2011 |
2012 |
2013 |
2014 |
| |
April 1, 18% for 6 of the most common generic drugs† |
| British Columbia |
October 15: 50% existing generics 42% new generics |
July 4: 40% all generics |
April 2: 35% all generics |
April 1: 25%* most generics |
April 1: 20% most generics |
| Alberta |
April 1: 56%existing generics
45% new generics
|
|
July 1: 35% all generics |
May 1: 18% |
|
| Saskatchewan |
|
April 1: 40% new generics
May 1 and June 1: 45% existing generics
April 1 and October 1: 35% generics in former Standing Offer Contract categories
|
April 1: 35% |
|
|
| Manitoba |
Generic drug pricing is subject to Utilization Management Agreements with the manufacturers, which declare that the price of a generic is equal to that of other select provinces. |
| Ontario |
July 20: 25% public
50% private & out-of-pocket
|
April 1: 25% public
35% private & out-of-pocket
|
April 1: 25%* public, private & out-of-pocket |
|
|
| Quebec |
Quebec requires that generic manufacturers provide the province the lowest price available in other provinces. |
| New Brunswick |
|
|
June 1: 40%
December 1: 35%
|
June 1: 25%* |
|
| Nova Scotia |
|
July 1: 45% |
January 1: 40%
July 1: 35%
|
|
|
| Prince Edward Island |
|
|
July 1: 35% |
|
|
| Newfoundland & Labrador |
|
|
April 1: 45%
October 1: 40%
|
April 1: 40%
July 1: 25%
|
|
Note: Information is up to date as of July 1, 2013. Generic pricing exceptions may exist.
*In British Columbia, Ontario and New Brunswick the generic pricing policy is 25% for oral solid forms and 35% for all others.
†After April 1, 2013, the general provincial generic pricing policies no longer apply to the drugs subject to the 18% pricing policy as per the Council of the Federation. Quebec did not participate in the Pan-Canadian Competitive Value Price Initiative for Generic Drugs, but benefited from it because of the lowest price policy.
Appendix B: Definitions
The average ratios reported are sales-weighted arithmetic averages of the corresponding foreign-to- Canadian price ratios for individual drugs. These average price ratios provide exact answers to questions such as:
“How much more or less would Canadians have paid for the generic drugs they purchased in Q1-2011 had they paid prices prevailing in country X?”
The multilateral foreign-to-Canadian and foreign-to-Ontario price ratios involve price measures reflecting all foreign prices available for individual drugs.
The following multilateral measures are reported in this analysis based on the IMS Health's MIDAS™ database:
- Minimum international price – represents the lowest price available across the comparator countries
- Mean international price – represents a straight average of the prices available across the comparator countries
- Median International price – represents the price at the midpoint of the distribution of the foreign prices
- Maximum international price – represents the highest price available across the comparator countries
- Canadian price – represents the average national price based on all sales to the pharmacy sector in Canada (Appendix D).
The analysis also reports the Ontario Formulary Price, as available in the November 2012 edition of the Ontario Drug Benefit formulary.
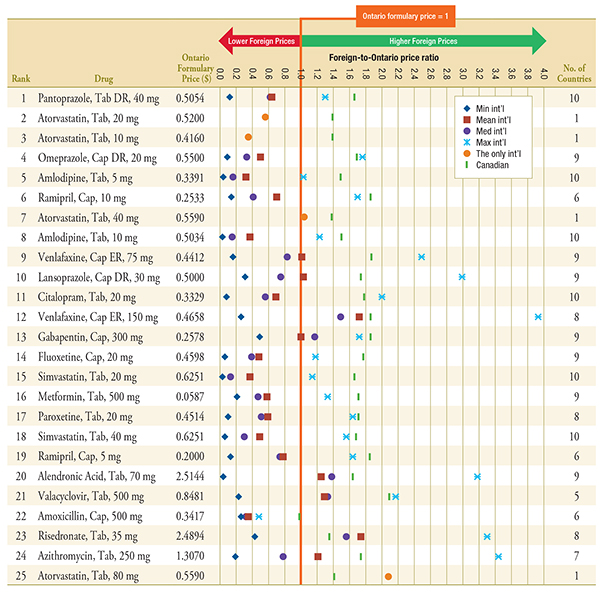
Appendix C: Bilateral Price Comparison at Drug Level
Figure C.1 – Foreign-to-Ontario price ratios, by bilateral comparator
Top 25 Generic Drugs, Q1-2011
Note: For presentation purposes, the scale reporting the foreign-to-Ontario price ratio was limited to 4.0 and the observations higher than this value are not depicted here.
DR, delayed release; ER, extended release.
Data Sources: Ontario Drug Benefit Formulary, November 2012
MIDAS™, January–March 2011, IMS Health Consulting Inc. All Rights Reserved.
Figure C.2 – Foreign-to-Ontario price ratios, by bilateral comparator
Top 26-50 Generic Drugs, Q1-2011
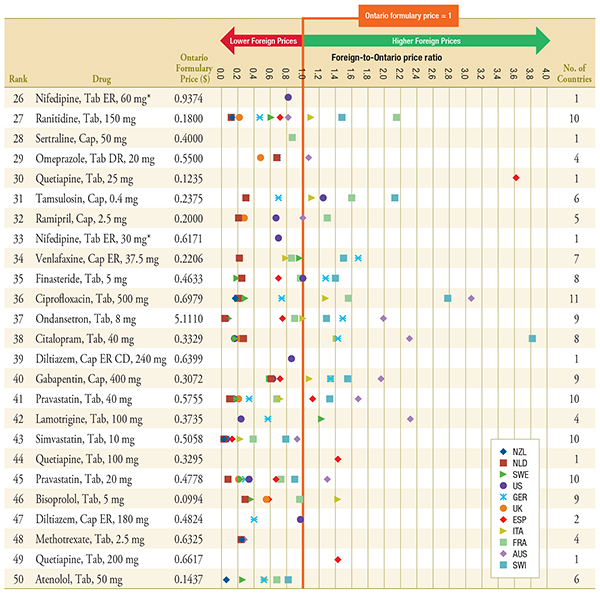
Note: For presentation purposes, the scale reporting the foreign-to-Ontario price ratio was limited to 4.0 and the observations higher than this value are not depicted here.
DR, delayed release; ER, extended release.
* Subject to generic pricing exception in Ontario.
Data Sources: Ontario Drug Benefit Formulary, November 2012
MIDAS™, January–March 2011, IMS Health Consulting Inc. All Rights Reserved.
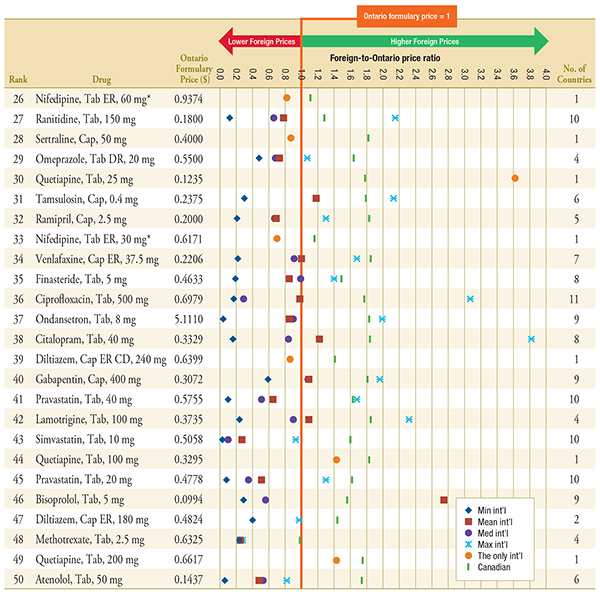
Appendix D: Multilateral Price Comparison at Drug Level
Figure D.1 – Foreign-to-Ontario price ratios, by multilateral comparator
Top 25 Generic Drugs, Q1-2011
Note: For presentation purposes, the scale reporting the foreign-to-Ontario price ratio was limited to 4.0 and the observations higher than this value are not depicted here.
Min and max price ratio measures are reported for drugs with prices available in 2 or more foreign countries. Mean and median price ratio measures are reported for drugs with prices available in 3 or more foreign countries. The only international price ratio is reported for drugs with only one price available in the 11 countries analyzed.
DR, delayed release; ER, extended release.
Data Sources: Ontario Drug Benefit Formulary, November 2012
MIDAS™, January–March 2011, IMS Health Consulting Inc. All Rights Reserved.
Figure D.2 – Foreign-to-Ontario price ratios, by multilateral comparator
Top 26-50 Generic Drugs, Q1-2011
Note: For presentation purposes, the scale reporting the foreign-to-Ontario price ratio was limited to 4.0 and the observations higher than this value are not depicted here.
Min and max price ratio measures are reported for drugs with prices available in 2 or more foreign countries. Mean, weighted mean and median price ratio measures are reported for drugs with prices available in 3 or more foreign countries. The only international price ratio is reported for drugs with only one price available in the 11 countries analyzed.
DR, delayed release; ER, extended release.
* The drug is subject to generic pricing exception in Ontario.
Data Sources: Ontario Drug Benefit Formulary, November 2012
MIDAS™, January–March 2011, IMS Health Consulting Inc. All Rights Reserved.