CompassRx, 5th Edition
Annual Public Drug Plan Expenditure Report, 2017/18
Acknowledgements
This report was prepared by the Patented Medicine Prices Review Board (PMPRB) as part of the National Prescription Drug Utilization Information System (NPDUIS) initiative.
The PMPRB wishes to acknowledge the members of the NPDUIS Advisory Committee for their expert oversight and guidance in the preparation of this report. Please note that the statements and findings for this report do not necessarily reflect those of the members or their organizations.
Appreciation goes to Yvonne Zhang for leading this project, and to Tanya Potashnik, Elena Lungu, Jeffrey Menzies, and Nevzeta Bosnic for their oversight in the development of the report. The PMPRB also wishes to acknowledge the contribution of the analytical staff Ai Chau; and editorial staff Carol McKinley, Sarah Parker, and Shirin Paynter.
Disclaimer
NPDUIS operates independently of the regulatory activities of the Board of the PMPRB. The research priorities, data, statements, and opinions expressed or reflected in NPDUIS reports do not represent the position of the PMPRB with respect to any regulatory matter. NPDUIS reports do not contain information that is confidential or privileged under sections 87 and 88 of the Patent Act, and the mention of a medicine in a NPDUIS report is not and should not be understood as an admission or denial that the medicine is subject to filings under sections 80, 81, or 82 of the Patent Act or that its price is or is not excessive under section 85 of the Patent Act.
Although based in part on data provided by the Canadian Institute for Health Information (CIHI), the statements, findings, conclusions, views, and opinions expressed in this report are exclusively those of the PMPRB and are not attributable to CIHI.
Contact Information
Executive Summary
Prescription drug expenditures for the NPDUIS public drug plans increased by a considerable 7.4% in 2017/18 to reach $11.4 billion, driven primarily by a marked increase in the use of higher-cost drugs.
The PMPRB CompassRx report monitors and analyzes the cost pressures driving changes in prescription drug expenditures in Canadian public drug plans. This fifth edition of CompassRx provides insight into the factors driving growth in drug and dispensing costs in 2017/18, as well as a retrospective review of recent trends in public drug plan costs and utilization.
The main data source for this report is the National Prescription Drug Utilization Information System (NPDUIS) Database at the Canadian Institute for Health Information (CIHI), which includes data for the following jurisdictions: British Columbia, Alberta, Saskatchewan, Manitoba, Ontario, New Brunswick, Nova Scotia, Prince Edward Island, Newfoundland and Labrador, Yukon, and the Non-Insured Health Benefits Program.
The findings from this report will inform policy discussions and aid decision makers in anticipating and responding to evolving cost pressures.
Key findings
Building on the modest 1.9% growth rate in 2016/17 and the substantial double-digit increase the year before, prescription drug expenditures for the NPDUIS public drug plans increased by 7.4% in 2017/18.
- Between 2014/15 and 2017/18, the total prescription drug expenditure for Canada’s public drug plans rose by $2 billion, for a compound annual growth rate of 6.6%.
- Drug costs, which represented 80% of prescription drug expenditures in 2017/18, grew at a rate of 8.3%, while dispensing costs, which accounted for the remaining 20% of expenditures, grew by 3.8%.
- The NPDUIS public drug plans paid an average of 87% of the total prescription costs for 277 million prescriptions dispensed to almost 7 million active beneficiaries in 2017/18.
- The introduction of the OHIP+ program in the last quarter of 2017/18 accounted for a 2.5% increase in total prescription drug expenditures for Ontario, representing an increase of 1.4% for all NPDUIS public drug plans for the entire fiscal year.
Drug cost increases in the NPDUIS public plans in 2017/18 were primarily driven by the increased use of higher-cost drugs, renewed pressure from direct-acting antiviral (DAA) drugs for hepatitis C, and the implementation of Ontario’s OHIP+ program, with limited savings from generic and biosimilar substitution.
- Increased use of higher-cost medicines, including renewed pressure from DAA drugs, accounted for a significant 7.1% upward push on drug costs in 2017/18.
- The patented market segment had a double-digit rate of growth, with a 19.3% rise in costs for medicines exceeding $10,000 in annual treatment costs. These high-cost drugs were used by less than 2% of public drug plan beneficiaries and accounted for more than 30% of the total drug costs in 2017/18.
- The overall increase in costs was also greatly influenced by the implementation of Ontario’s OHIP+ program in the last quarter of 2017/18. Without OHIP+, the 8.3% total drug cost growth in all NPDUIS public drug plans would have been 6.8%.
- Increases in the volume of drugs and the size of the beneficiary population pushed drug costs upward by 2.4% in 2017/18, following a stable five-year trend.
- Although savings from price reductions and generic and biosimilar substitution somewhat offset the growth in drug costs, their impact steadily declined from -9.2% in 2012/13 to -2.4% in 2017/18.
Overview of Drug Cost Drivers
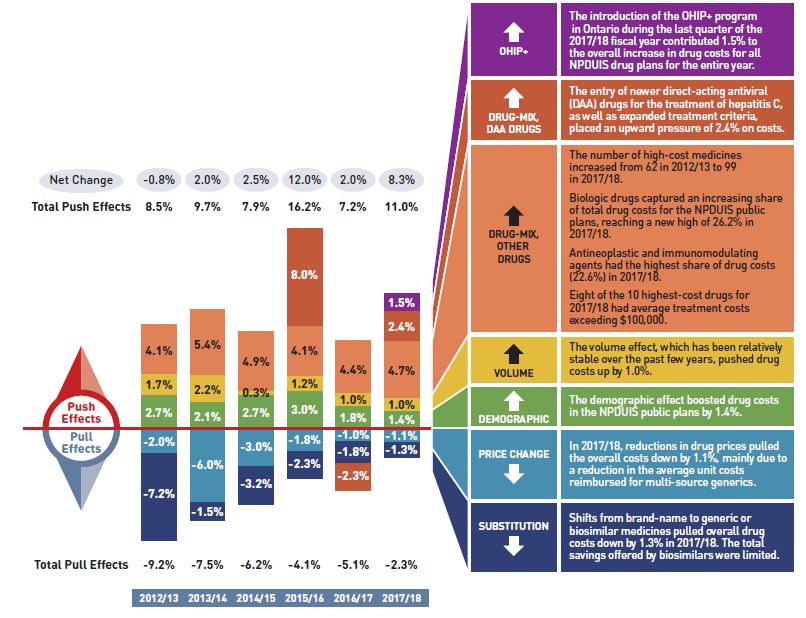
Figure description
This column graph describes the key factors or effects that impacted the rates of change in drug costs across all NPDUIS public drug plans for each year from 2012/13 to 2017/18. Each column is broken out to give the positive or negative contribution of each effect: drug-mix; volume; demographic; price change; and substitution. The drug-mix effect for direct-acting antiviral (DAA) drugs for the treatment of hepatitis C is shown separately, as is the effect of the Ontario Health Insurance Plan Plus (OHIP+) initiative. Separate rows above and below the bar graph show the total positive push effect, negative pull effect and net change for each year.
|
2012/13 |
2013/14 |
2014/15 |
2015/16 |
2016/17 |
2017/18 |
| OHIP+ |
- |
- |
- |
- |
- |
1.5% |
| Drug-mix, direct-acting antiviral (DAA) drugs |
- |
- |
- |
8.0% |
-2.3% |
2.4% |
| Drug mix, other drugs |
4.1% |
5.4% |
4.9% |
4.1% |
4.4% |
4.7% |
| Volume |
1.7% |
2.2% |
0.3% |
1.2% |
1.0% |
1.0% |
| Demographic |
2.7% |
2.1% |
2.7% |
3.0% |
1.8% |
1.4% |
| Price change |
-2.0% |
-6.0% |
-3.0% |
-1.8% |
-1.0% |
-1.1% |
| Substitution |
-7.2% |
-1.5% |
-3.2% |
-2.3% |
-1.8% |
-1.3% |
| Total push effect |
8.5% |
9.7% |
7.9% |
16.2% |
7.2% |
11.0% |
| Total pull effect |
-9.2% |
-7.5% |
-6.2% |
-4.1% |
-5.1% |
-2.3% |
| Net change |
-0.8% |
2.0% |
2.5% |
12.0% |
2.0% |
8.3% |
A table to the right of the graph provides an analysis for each effect in 2017/18.
|
OHIP+ |
- The introduction of the OHIP+ program in Ontario during the last quarter of the 2017/18 fiscal year contributed 1.5% to the overall increase in drug costs for all NPDUIS public drug plans for the entire year.
|
| Drug-mix, direct-acting antiviral (DAA) drugs |
- The entry of newer direct-acting antiviral (DAA) drugs for the treatment of hepatitis C, as well as expanded treatment criteria, placed an upward pressure of 2.4% on costs.
|
| Drug mix, other drugs |
- The number of high-cost medicines increased from 62 in 2012/13 to 99 in 2017/18.
- Biologic drugs captured an increasing share of total drug costs for the NPDUIS public plans, reaching a new high of 26.2% in 2017/18.
- Antineoplastic and immunomodulating agents had the highest share of drug costs (22.6%) in 2017/18.
- Eight of the 10 highest-cost drugs for 2017/18 had average treatment costs exceeding $100,000.
|
| Volume |
- The volume effect, which has been relatively stable over the past few years, pushed drug costs up by 1.0%.
|
| Demographic |
- The demographic effect boosted drug costs in the NPDUIS public plans by 1.4%.
|
| Price change |
- In 2017/18, reductions in drug prices pulled the overall costs down by 1.1%, mainly due to a reduction in the average unit costs reimbursed for multi-source generics.
|
| Substitution |
- Shifts from brand-name to generic or biosimilar medicines pulled overall drug costs down by 1.3% in 2017/18. The total savings offered by biosimilars were limited.
|
Note: This analysis is based on publicly available pricing information. It does not reflect the confidential drug price discounts negotiated by the pan-Canadian Pharmaceutical Alliance on behalf of the public plans.
Values for 2016/17 onward reflect a revised methodology; previous results have not been updated, as there would have been no notable change in the relative contribution of each effect. Results for 2012/13 do not capture the data for the British Columbia and Newfoundland and Labrador public drug plans. Data for Yukon is included beginning in 2016/17.
Values may not add to totals due to rounding and the cross effect.
Data source: National Prescription Drug Utilization Information System Database, Canadian Institute for Health Information.
The growth in dispensing costs in the NPDUIS public plans was moderate and aligned closely with the recent three-year trend, reaching $2.3 billion.
- The overall growth in dispensing costs was 3.8% (or $86.1 million) in 2017/18, paralleling the growth rate two years before, though results varied among individual plans.
- The implementation of Ontario’s OHIP+ program had a significant impact on the growth in dispensing costs, pushing costs upward by 1.3% ($28.8 million) overall and by 2.4% in Ontario.
- The demographic effect only made a modest contribution of 1.4% to the growth in dispensing costs in 2017/18.
- The prescription size effect had the greatest impact on dispensing costs in 2017/18, pushing overall costs up by 2.5%.
- Changes in the average dispensing fee per prescription pulled down dispensing costs by 0.5% in 2017/18, mainly due to the -6.9% change in Manitoba.
Introduction
Canadian public drug plan expenditures represent a significant portion of the overall healthcare budget. The Canadian Institute for Health Information (CIHI) estimated the total cost of prescription drugs in Canada to be $33.7 billion in 2018, with the largest component (42.7%) financed by the public drug plans and the remainder paid by private plans (36.6%) or out of pocket by households and individuals (20.7%).Footnote 1
CompassRx is an annual PMPRB publication that explores trends in prescription drug expenditures in Canadian public drug plans. It focuses on the shifting pressures that contribute to the annual change in drug and dispensing costs, including the switch in use between lower- and higher-priced drugs, and changes in the beneficiary population, drug prices, and the volume of drugs used, as well as other key factors.
This edition of the report centres on the 2017/18 fiscal year, with a retrospective look at recent trends. The results of this study aid stakeholders in anticipating and responding to the evolving cost pressures affecting Canada’s public drug plans.
The analysis focuses on the public drug plans participating in the National Prescription Drug Utilization Information System (NPDUIS) initiative, which includes all of the provincial public plans (with the exception of Quebec), Yukon, and the Non-Insured Health Benefits (NIHB) Program. These plans account for approximately one third of the total annual spending on prescription drugs in Canada.
Each of the public drug plans reimburses eligible beneficiaries according to its own specific plan design, and implements policies related to the reimbursement of drug prices and dispensing fees. Summaries of the plan designs and policies are available in the Reference Documents section of the NPDUIS Analytical Studies page on the PMPRB website.
Health Canada, the PMPRB, and the Canadian Agency for Drugs and Technologies in Health (CADTH) are responsible for drug approvals, price reviews, and health technology assessments, respectively. Details of the 2017/18 approvals and reviews are provided in Appendix A of this report.
Methods
The main data source for this report is the National Prescription Drug Utilization Information System (NPDUIS) Database, developed by the Canadian Institute for Health Information (CIHI). This database houses pan-Canadian information on public drug programs, including anonymous claims-level data collected from the plans participating in the NPDUIS initiative. Data is reported on a fiscal year basis.
Results are presented for the following public drug plans: British Columbia, Alberta, Saskatchewan, Manitoba, Ontario, New Brunswick, Nova Scotia, Prince Edward Island, Newfoundland and Labrador, Yukon, and the Non-Insured Health Benefits (NIHB) Program.
The analysis focuses exclusively on data for beneficiaries that met their deductible and received public reimbursement. Results reported for Saskatchewan and Manitoba include the accepted prescription drug expenditures for individuals who are eligible for coverage but have not submitted an application and, therefore, do not have a defined deductible. Results reported for New Brunswick include the number of active beneficiaries enrolled in the Medavie Blue Cross Seniors’ Prescription Drug Program and their related drug expenditures, which are offset by monthly premiums.
In Ontario, long-term care (LTC) prescriptions were separated out from the dispensing costs analysis, as their dispensing patterns may differ from those of the general beneficiary population.
The analysis of drug and dispensing cost drivers follows the methodological approach detailed in the PMPRB’s The Drivers of Prescription Drug Expenditures: A Methodological Report.Footnote 2 Drug costs include any associated markups. Analyses of the average prescription size, as well as pricing, are limited to oral solids to avoid data reporting inconsistencies that may exist in the days’ supply and unit reporting of other formulations. Anatomical Therapeutic Chemical (ATC) levels reported here are based on CIHI NPDUIS data and reflect the ATC classification system maintained by the World Health Organization Collaborating Centre for Drug Statistics Methodology. Vaccines and pharmacy services are not represented in this report.
The methodological approach used in CompassRx is reviewed on an annual basis and updated as required to respond to changes in the pharmaceutical landscape and data access. Thus, the scope of the report and the data analyzed may vary slightly from year to year. New changes to the methodology are detailed in Methods section of each edition.
For a Glossary of Terms, see the Reference Documents section of the NPDUIS Analytical Studies page on the PMPRB website.
Limitations
Expenditure and utilization levels vary widely among the jurisdictions and cross comparisons of the results are limited by the plan designs and policies of the individual public drug plans, as well as the demographic and disease profiles of the beneficiary populations.
For example, public drug plans in British Columbia, Saskatchewan, and Manitoba provide universal income-based coverage, while other provincial public drug plans offer specific programs for seniors, income assistance recipients, and other select patient groups, and the NIHB provides universal care to its entire population.
The NPDUIS Database includes sub-plan data specific to particular jurisdictions. This further limits the comparability of results across plans. For instance, Alberta, Nova Scotia, and Prince Edward Island submit the data for a select subset of their sub-plans to NPDUIS. A comprehensive summary of the sub-plans available in the database, along with the eligibility criteria, is available in the Reference Documents section of the NPDUIS Analytical Studies page on the PMPRB website.
This edition of the CompassRx reports on data up to and including the 2017/18 fiscal year. Any plan changes or other developments that have taken place since then are not captured in the analysis.
In British Columbia, the First Nations Health Authority (FNHA) has assumed the drug program formerly handled by Indigenous Services Canada’s First Nations Inuit Health Branch as part of the NIHB, and FNHA is now classified as a sub-program under the BC public drug plan. FNHA expenditures for the first two quarters of the 2017/18 fiscal year are reported as part of the NIHB total, but the data for Q4-2017 and Q1-2018 was not reported to NPDUIS. Thus the total costs may be underestimated.
Drug claims for beneficiaries in Ontario who also have coverage through NIHB are primarily reimbursed by the Ontario Drug Benefit program, with any remaining drug costs covered by NIHB. Therefore, claims reported for the NIHB include those coordinated with the Ontario Drug Benefit program.
The totals for the NPDUIS public drug plans are heavily skewed toward Ontario due to its size, and thus the introduction of OHIP+ for Ontario residents aged 24 years or younger had a notable impact on the trends for 2017/18. Note that the impact of OHIP+ is only partially reflected in this report, as it was implemented the last quarter of the fiscal year analyzed.
Drug costs reported are the amounts accepted toward reimbursement by the public plans, which may not reflect the amount paid by the plan/program and do not reflect off-invoice price rebates or price reductions resulting from confidential product listing agreements.
The prescription drug expenditure data for the public drug plans reported in this study represents only one segment of the Canadian pharmaceutical market, and hence, the findings should not be extrapolated to the overall marketplace.
1. Trends in Prescription Drug Expenditures, 2012/13 to 2017/18
Prescription drug expenditures for public plans increased by 7.4% in 2017/18, building on a modest growth rate in 2016/17 and a substantial double-digit increase the year before for an average annual growth of 6.6% over the last three years. The notable growth in 2017/18 was primarily driven by increases in the patented medicine market, especially among high-cost drugs. While direct-acting antiviral (DAA) drugs for hepatitis C once again contributed to the rise in expenditures, other high-cost drugs emerged as an important market force, posting a double-digit rate of growth over the previous fiscal year. The addition of Ontario’s OHIP+ program in the last quarter of 2017/18 also contributed to the overall annual increase in expenditures.
Brief Insights: Drug Plan Designs
The expenditure and utilization levels reported in this study depend on the specific plan design and policies of each jurisdiction, as well as the demographic and disease profiles of the beneficiary population. This affects the comparability of results across plans.
Changes in plan designs or policies—for example, the extent of coverage for DAA drugs for hepatitis C—can have a significant effect on trends in any given year. The introduction of OHIP+ for Ontario residents aged 24 years or younger had a notable impact on the trends for 2017/18. A brief summary of the program and its impact on the growth in provincial and overall prescription drug expenditures is given at the end of this section.
Supplementary reference documents providing information on individual public drug plan designs, policies governing markups and dispensing fees, and a glossary of terms are available on the NPDUIS Analytical Studies page of the PMPRB website.
Prescription Drug Expenditures = Drug Costs (80%) + Dispensing Costs (20%)
Between 2012/13 and 2017/18, annual prescription drug expenditures for the public drug plans rose by $2.6 billion, from $8.8 billion to $11.4 billion, with $2 billion of this growth seen over the last three years, and $0.7 billion in the last year alone (Figure 1.1).
Figure 1.1 Annual rate of change in prescription drug expenditures, NPDUIS public drug plans*, 2012/13 to 2017/18
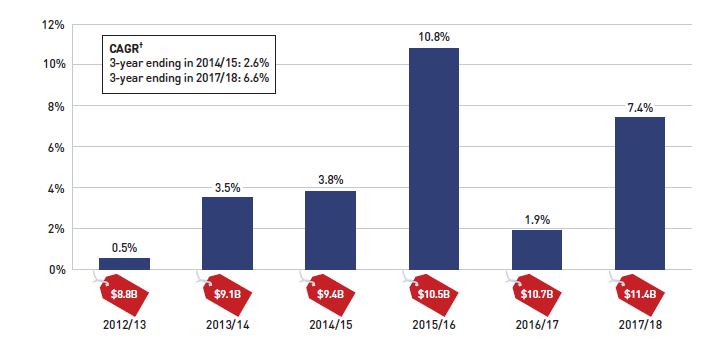
Figure description
This column graph shows the trend in the annual rates of change for prescription drug expenditures from 2012/13 to 2017/18. Price tags below each bar show the annual prescription drug cost in billions of dollars. The three-year compound annual growth rate ending in 2014/16 was 2.6% and ending in 2017/18 was 6.6%.
| Fiscal Year |
2012/13 |
2013/14 |
2014/15 |
2015/16 |
2016/17 |
2017/18 |
| Rate of change |
0.5% |
3.5% |
3.8% |
10.8% |
1.9% |
7.4% |
| Prescription drug expenditure ($ billion) |
$8.8 |
$9.1 |
$9.4 |
$10.5 |
$10.7 |
11.4 |
Note: This analysis only includes data for beneficiaries that met their deductible and received public reimbursement.
* British Columbia, Alberta, Saskatchewan, Manitoba, Ontario, New Brunswick, Nova Scotia, Prince Edward Island, Newfoundland and Labrador, Yukon, and the Non-Insured Health Benefits Program.
† Compound annual growth rate.
Data source: National Prescription Drug Utilization Information System Database, Canadian Institute for Health Information.
The overall growth in prescription drug expenditures represents a significant 8.3% growth in drug costs and a 3.8% increase in dispensing costs. Due to the disparity in their rates of growth, the drug cost component captured a greater share of the overall expenditures in 2017/18 (80%), while the dispensing costs share dropped to a five-year low (20%) (Figure 1.2).
The expenditures reported in this section represent the total amounts accepted for reimbursement by the NPDUIS public drug plans, including drug costs, with any associated markups, and dispensing costs. These amounts reflect both the plan-paid portions of the prescription costs as well as beneficiary-paid portions, such as co-payments and deductibles.
In 2017/18, public plans paid an average of 87% of the total prescription drug expenditures, while the remainder was paid by the beneficiaries either out of pocket or through a third-party private insurer. The beneficiary-paid share varied across jurisdictions, ranging from 64% to 91%.
Figure 1.2 Prescription drug expenditures in NPDUIS public drug plans, 2017/18 ($million)
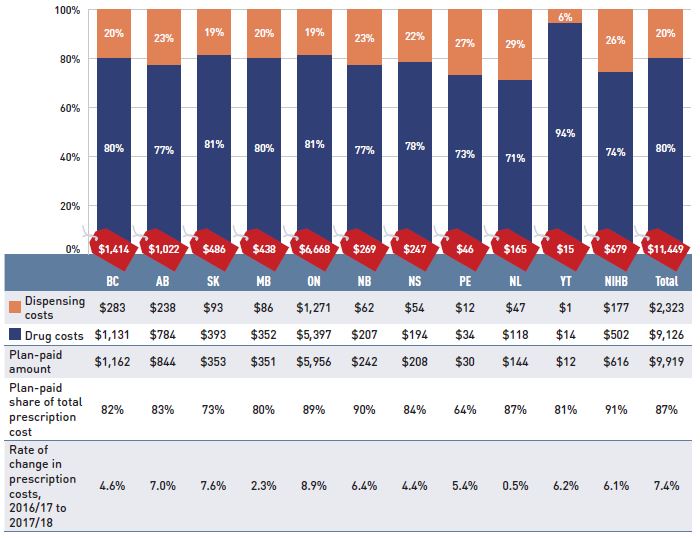
Figure description
This stacked column graph shows the total prescription drug expenditure in 2017/18 for each NPDUIS public drug plan broken out by percent shares of drug costs and dispensing costs, along with the total costs across all plans. A table below provides absolute values for the drug and dispensing costs in millions of dollars, as well as the plan-paid shares of the total prescription costs and the rate of change since 2016/17.
| |
British Columbia |
Alberta |
Saskatchewan |
Manitoba |
Ontario |
New Brunswick |
Nova Scotia |
Prince Edward Island |
Newfoundland and Labrador |
Yukon |
Non-Insured Health Benefits |
Total |
| Total prescription cost ($ million) |
$1,414 |
$1,022 |
$486 |
$438 |
$6,668 |
$269 |
$247 |
$46 |
$165 |
$15 |
$679 |
$11,449 |
| Share of dispensing costs |
20% |
23% |
19% |
20% |
19% |
23% |
22% |
27% |
29% |
6% |
26% |
20% |
| Share of drug costs |
80% |
77% |
81% |
80% |
81% |
77% |
78% |
73% |
71% |
94% |
74% |
80% |
| Dispensing costs ($ million) |
$283 |
$238 |
$93 |
$86 |
$1,271 |
$62 |
$54 |
$12 |
$47 |
$1 |
$177 |
$2,323 |
| Drug costs ($ million) |
$1,131 |
$784 |
$393 |
$352 |
$5,397 |
$207 |
$194 |
$34 |
$118 |
$14 |
$502 |
$9,126 |
| Plan-paid amount ($ million) |
$1,162 |
$844 |
$353 |
$351 |
$5,956 |
$242 |
$208 |
$30 |
$144 |
$12 |
$616 |
$9,919 |
| Plan-paid share of total prescription cost |
82% |
83% |
73% |
80% |
89% |
90% |
84% |
64% |
87% |
81% |
91% |
87% |
| Rate of change in prescription costs, 2016/17 to 2017/18 |
4.6% |
7.0% |
7.6% |
2.3% |
8.9% |
6.4% |
4.4% |
5.4% |
0.5% |
6.2% |
6.1% |
7.4% |
Note: This analysis only includes data for beneficiaries that met their deductible and received public reimbursement. Markup amounts are captured in the drug costs. Values may not add to totals due to rounding.
* Yukon allows for markups of up to 30%; as such, drug costs account for a larger share of their total expenditures.
Data source: National Prescription Drug Utilization Information System Database, Canadian Institute for Health Information.
The annual growth in prescription expenditures is a function of increases in the number of active beneficiaries and their treatment costs. While the size of the beneficiary population in most jurisdictions remained somewhat stable in 2017/18, the overall NPDUIS public plan beneficiary population grew by 18.4%, mainly due to the 35% increase in Ontario following the implementation of OHIP+ (for more details, see the program summary at the end of this section).
In 2017/18, almost 7 million active beneficiaries filled approximately 277 million prescriptions that were accepted towards a deductible or paid for (in full or in part) by the NPDUIS public drug plans. Overall, the active beneficiary population was almost evenly split between seniors and non-seniors, although there were considerable jurisdictional differences due to variations in plan design, eligibility, and the demographics of the beneficiary population (Figure 1.3).
Figure 1.3 Utilization in NPDUIS public drug plans, senior and non-senior active beneficiaries, 2017/18
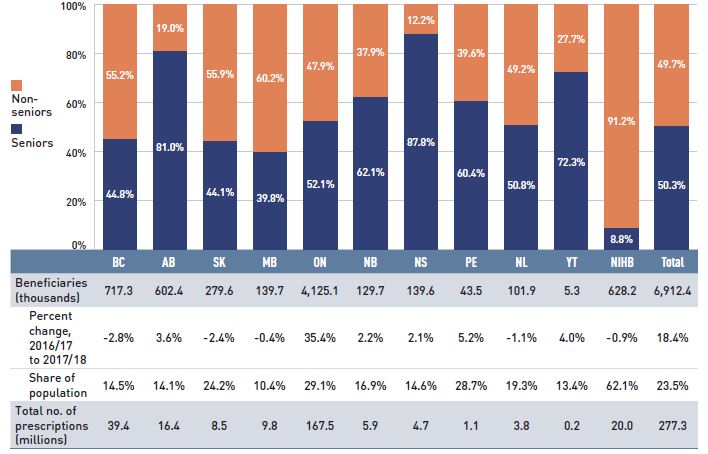
Figure description
This stacked column graph shows the percent share of utilization in senior and non-senior populations for each of the NPDUIS public drug plans in 2017/18, along with the totals across all plans. A table below gives the number of active beneficiaries in thousands, the change in beneficiary population from 2016/17 to 2017/18, the number of active beneficiaries as share of the population, and the total number of prescriptions, in millions.
| |
British Columbia |
Alberta |
Saskatchewan |
Manitoba |
Ontario |
New Brunswick |
Nova Scotia |
Prince Edward Island |
Newfoundland and Labrador |
Yukon |
Non-Insured Health Benefits |
Total |
| Seniors |
44.8% |
81.0% |
44.1% |
39.8% |
52.1% |
62.1% |
87.8% |
60.4% |
50.8% |
72.3% |
8.8% |
50.3% |
| Non-seniors |
55.2% |
19.0% |
55.9% |
60.2% |
47.9% |
37.9% |
12.2% |
39.6% |
49.2% |
27.7% |
91.2% |
49.7% |
| Beneficiaries (thousands) |
717.3 |
602.4 |
279.6 |
139.7 |
4,125.1 |
129.7 |
139.6 |
43.5 |
101.9 |
5.3 |
628.2 |
6,912.4 |
| Percent change in the beneficiary population from 2015/16 to 2016/17 |
-2.8% |
3.6% |
-2.4% |
-0.4% |
35.4% |
2.2% |
2.1% |
5.2% |
-1.1% |
4.0% |
-0.9% |
18.4% |
| Beneficiary share of population |
14.5% |
14.1% |
24.2% |
10.4% |
29.1% |
16.9% |
14.6% |
28.7% |
19.3% |
13.4% |
62.1% |
23.5% |
| Total number of prescriptions (millions) |
39.4 |
16.4 |
8.5 |
9.8 |
167.5 |
5.9 |
4.7 |
1.1 |
3.8 |
0.2 |
20.0 |
277.3 |
Note: This analysis only includes data for beneficiaries that met their deductible and received public reimbursement. Not all of the sub-plan data for the jurisdictions is reported to NPDUIS, which may impact the ratio of senior to non-senior shares.
* The share of the publicly covered population in NIHB is slightly underestimated, as data was unavailable for British Columbia’s First Nations Health Authority (FNHA) in the second half of 2017/18.
Data source: National Prescription Drug Utilization Information System Database, Canadian Institute for Health Information; Statistics Canada, CANSIM Table 051-0005; Non-Insured Health Benefits Program Annual Report, 2017/18.
Prescription Drug Expenditures = Drug Costs (80%) + Dispensing Costs (20%)
Drug costs, including markups, represent the largest component of prescription drug expenditures and have the greatest influence on overall trends. After a sharp 12.9% increase in 2015/16, and a modest 2.0% growth in 2016/17, drug costs rose by a notable 8.3% in 2017/18, for a compound annual growth rate (CAGR) of 7.7% over the last three years. This follows a much lower average annual rate of change of 1.5% over the previous three-year period.
Figure 1.4 reports the annual rate of change in drug costs for each NPDUIS drug plan from 2015/16 to 2017/18. The overall 8.3% increase in costs in 2017/18 reflects a narrow range of approximately 5% to 10% across most jurisdictions, with the exception of a 0.5% rate of change in Newfoundland and Labrador.
Figure 1.4 Annual rates of change in drug costs, NPDUIS public drug plans, 2015/16 to 2017/18
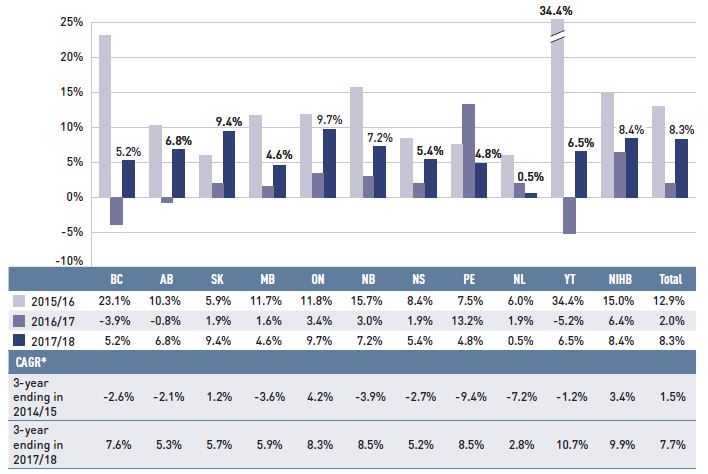
Figure description
This column graph illustrates the trend in annual rates of change in drug costs from 2015/16 to 2017/18 for each of the NPDUIS drug plans. Total annual results for all plans are included. Three-year compound annual growth rates ending in 2014/15 and 2017/18 are given in a table below.
| |
British Columbia |
Alberta |
Saskatchewan |
Manitoba |
Ontario |
New Brunswick |
Nova Scotia |
Prince Edward Island |
Newfoundland and Labrador |
Yukon |
Non-Insured Health Benefits |
Total |
| 2015/16 |
23.1% |
10.3% |
5.9% |
11.7% |
11.8% |
15.7% |
8.4% |
7.5% |
6.0% |
34.4% |
15.0% |
12.9% |
| 2016/17 |
-3.9% |
-0.8% |
1.9% |
1.6% |
3.4% |
3.0% |
1.9% |
13.2% |
1.9% |
-5.2% |
6.4% |
2.0% |
| 2017/18 |
5.2% |
6.8% |
9.4% |
4.6% |
9.7% |
7.2% |
5.4% |
4.8% |
0.5% |
6.5% |
8.4% |
8.3% |
| 3-year compound annual growth rate ending 2014/15 |
-2.6% |
-2.1% |
1.2% |
-3.6% |
4.2% |
-3.9% |
-2.7% |
-9.4% |
-7.2% |
-1.2% |
3.4% |
1.5% |
| 3-year compound annual growth rate ending 2017/18 |
7.6% |
5.3% |
5.7% |
5.9% |
8.3% |
8.5% |
5.2% |
8.5% |
2.8% |
10.7% |
9.9% |
7.7% |
Note: This analysis only includes data for beneficiaries that met their deductible and received public reimbursement.
* Compound annual growth rate.
Data source: National Prescription Drug Utilization Information System Database, Canadian Institute for Health Information.
Figure 1.5 breaks down the annual rate of change in drug costs from 2016/17 to 2017/18 by market segment (bar chart) and gives the corresponding market share in 2017/18 for each (pie chart).
Figure 1.5 Annual rates of change in drug costs by market segment, NPDUIS public drug plans*, 2016/17 to 2017/18
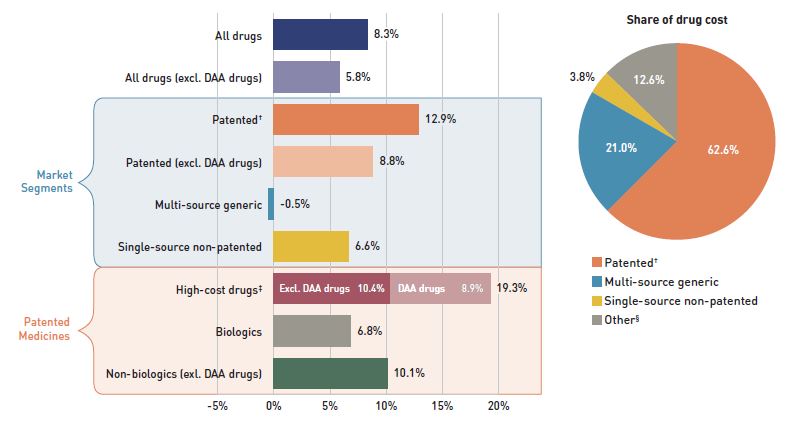
Figure description
This graph consists of two parts: a horizontal bar chart on the left breaks down the annual rate of change in drug costs between 2016/17 and 2017/18 by market segment and a pie chart on the right displays the market share of the total drug cost for each segment. Both represent the combined totals for NPDUIS public drug plans.
The bar chart is divided into three parts. The first gives the annual rate of change for all drugs; the second displays the growth rates for the three main market segments; and the third focuses on the patented medicine segment. Results indicate whether they include or exclude the direct-acting antiviral (DAA) drugs for the treatment of hepatitis C. High-cost drugs have an annual cost greater than $10,000.
Annual rates of change
All drugs: 8.3%
All drugs excluding DAA drugs: 5.8%
By market segment
- Patented: 12.9%
- Patented excluding DAA drugs: 8.8%
- Multi-source generic: -0.5%
- Single-source non-patented: 6.6%
Patented medicines:
- High-cost drugs: 19.3%
- High-cost drugs excluding DAA drugs: 10.4%
- Biologics: 6.8%
- Non-biologics excluding DAA drugs: 10.1%
Share of drug cost
| Market segment |
Share of drug cost |
| Patented |
62.6% |
| Multi-source generic |
21.0% |
| Single-source non-patented |
3.8% |
| Other† |
12.6% |
Note: This analysis only includes data for beneficiaries that met their deductible and received public reimbursement.
Direct-acting antiviral (DAA) drugs are used in the treatment of hepatitis C.
For a Glossary of Terms regarding each of the market segments, see the Reference Documents section of the NPDUIS Analytical Studies page on the PMPRB website.
* British Columbia, Alberta, Saskatchewan, Manitoba, Ontario, New Brunswick, Nova Scotia, Prince Edward Island, Newfoundland and Labrador, Yukon and the Non-Insured Health Benefits Program.
† The patented medicines market segment included all medicines that had patent protection at some time during the period of study, even if the patent expired during that period. As such, the 2017/18 growth does not reflect the loss of patent exclusivity for some top-selling medicines over the course of the fiscal year.
‡ High-cost drugs have an average annual treatment cost of greater than $10,000 and include both biologics and non-biologics.
§ This market segment includes devices, compounded drugs, and other products that are reimbursed by public drug plans but do not have a Health Canada assigned Drug Identification Number (DIN).
Data source: National Prescription Drug Utilization Information System Database, Canadian Institute for Health Information.
Patented medicines represent the largest market segment, capturing 62.6% of public plan drug costs in 2017/18. With a considerable growth of 12.9% over the previous year, they made the greatest contribution to the overall cost increase. High-cost patented medicines—those with an average annual cost per beneficiary greater than $10,000—were the fastest growing sub-segment at a rate of 19.3% in 2017/18. Nearly half of this growth (8.9%) was attributable to DAA drugs, while the costs for other high-cost drugs increased by a significant 10.4%.
Single-source non-patented medicines, which captured the smallest market share (3.8%), had a sizable 6.6% rate of growth in 2017/18. Note that over the course of the fiscal year, some top-selling medicines lost patent protection. As the results reported do not include these partial year costs, the growth of this market segment is expected to have been even greater. The impact will be reflected in the next edition of the report.
Multi-source generics, which accounted for 21.0% of drug costs, were the only market segment with a negative rate of growth in 2017/18, showing a slight decline of -0.5% over 2016/17.
Prescription Drug Expenditures = Drug Costs (80%) + Dispensing Costs (20%)
Dispensing costs make up an important part of prescription drug expenditures. Overall, the average annual rate of growth has been declining, from 6.7% between 2012/13 and 2014/15 to 3.0% over the last three years. Figure 1.6 reports the annual rate of change in dispensing costs for each NPDUIS drug plan from 2015/16 to 2017/18. Jurisdictional variations may be due to changes in the dispensing fee policies and plan designs, as well as changes in the number of prescriptions and their size, among other factors.
Brief Insights: Dispensing Fees
Manitoba was the only public plan to implement a notable change to dispensing fees in 2017/18: a new cap on dispensing fees allows pharmacies to charge provincial drug programs up to $30 per prescription, or up to $60 if the specified drug is a sterile compound, regardless of the base cost of a drug or how it is packaged.
For a summary of dispensing fee policies for each of the public drug plans, see the Reference Documents section of the NPDUIS Analytical Studies page on the PMPRB website.
Figure 1.6 Annual rates of change in dispensing costs, NPDUIS public drug plans, 2015/16 to 2017/18
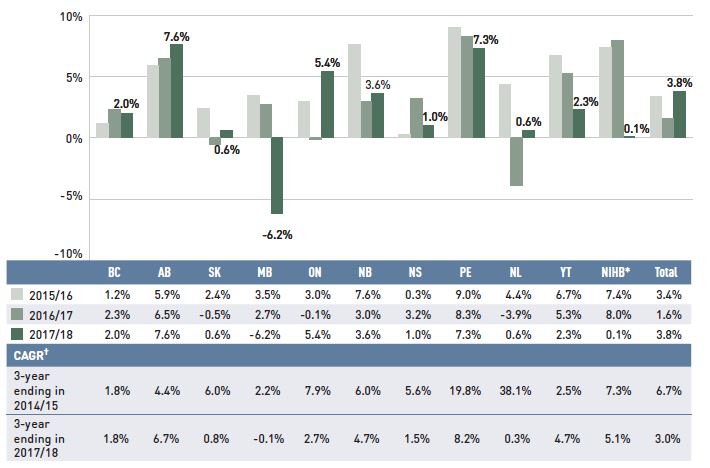
Figure description
This column graph illustrates the trend in annual rates of change for dispensing costs from 2015/16 to 2017/18 for each of the NPDUIS public drug plans. Total annual results for all plans are included. Three-year compound annual growth rates ending in 2014/15 and 2017/18 are given in a table below.
| |
British Columbia |
Alberta |
Saskatchewan |
Manitoba |
Ontario |
New Brunswick |
Nova Scotia |
Prince Edward Island |
Newfoundland and Labrador |
Yukon |
Non-Insured Health Benefits |
Total |
| 2015/16 |
1.2% |
5.9% |
2.4% |
3.5% |
3.0% |
7.6% |
0.3% |
9.0% |
4.4% |
6.7% |
7.4% |
3.4% |
| 2016/17 |
2.3% |
6.5% |
-0.5% |
2.7% |
-0.1% |
3.0% |
3.2% |
8.3% |
-3.9% |
5.3% |
8.0% |
1.6% |
| 2017/18 |
2.0% |
7.6% |
0.6% |
-6.2% |
5.4% |
3.6% |
1.0% |
7.3% |
0.6% |
2.3% |
0.1% |
3.8% |
| 3-year compound annual growth rate ending 2014/15 |
1.8% |
4.4% |
6.0% |
2.2% |
7.9% |
6.0% |
5.6% |
19.8% |
38.1% |
2.5% |
7.3% |
6.7% |
| 3-year compound annual growth rate ending 2017/18 |
1.8% |
6.7% |
0.8% |
-0.1% |
2.7% |
4.7% |
1.5% |
8.2% |
0.3% |
4.7% |
5.1% |
3.0% |
Note: This analysis only includes data for beneficiaries that met their deductible and received public reimbursement.
* The annual rate of change for the NIHB is slightly underestimated, as data was unavailable for British Columbia’s First Nations Health Authority (FNHA) in the second half of 2017/18.
† Compound annual growth rate.
Data source: National Prescription Drug Utilization Information System Database, Canadian Institute for Health Information.
As dispensing costs had a slower rate of growth than drug costs over the last three years, their share of overall prescription drug expenditures declined from 22.5% in 2014/15 to 20.3% in 2017/18.
Figure 1.7 depicts the trend in the dispensing cost share of total prescription expenditures for each NPDUIS drug plan from 2015/16 to 2017/18.
Figure 1.7 Annual dispensing costs as a share of total prescription drug expenditures, NPDUIS public drug plans, 2015/16 to 2017/18
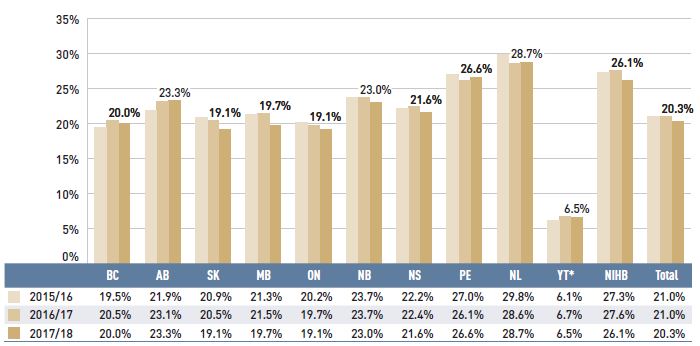
Figure description
This column graph shows the trend in annual dispensing costs as a share of the total prescription expenditures from 2015/16 to 2017/18 for each of the NPDUIS public drug plans. Total annual results for all plans are included.
| |
British Columbia |
Alberta |
Saskatchewan |
Manitoba |
Ontario |
New Brunswick |
Nova Scotia |
Prince Edward Island |
Newfoundland and Labrador |
Yukon |
Non-Insured Health Benefits |
Total |
| 2015/16 |
19.5% |
21.9% |
20.9% |
21.3% |
20.2% |
23.7% |
22.2% |
27.0% |
29.8% |
6.1% |
27.3% |
21.0% |
| 2016/17 |
20.5% |
23.1% |
20.5% |
21.5% |
19.7% |
23.7% |
22.4% |
26.1% |
28.6% |
6.7% |
27.6% |
21.0% |
| 2017/18 |
20.0% |
23.3% |
19.1% |
19.7% |
19.1% |
23.0% |
21.6% |
26.6% |
28.7% |
6.5% |
26.1% |
20.3% |
Note: This analysis only includes data for beneficiaries that met their deductible and received public reimbursement.
* Yukon allows for markups of up to 30%; as such, dispensing costs account for a smaller share of their total expenditures.
Data source: National Prescription Drug Utilization Information System Database, Canadian Institute for Health Information.
Brief Insights: OHIP+
On January 1, 2018, the Ontario government introduced the OHIP+ program, which provided prescription drug coverage to children and youth aged 24 and under, regardless of family income.
The expansion of the Ontario public drug plan to include OHIP+ is only partially reflected in the results of this edition of CompassRx, as it was implemented in the last quarter of the 2017/18 fiscal year (January 1, 2018, to March 31, 2018). Despite capturing only part of the full effect of this program, there is a notable impact on the 2017/18 results for Ontario, as well as on the total drug expenditures for all NPDUIS public drug plans, given Ontario’s relative size.
The impact of the OHIP+ program within the 2017/18 period included the following:
- The prescription drug expenditure of the OHIP+ program in the last quarter of 2017/18 totalled $151 million, accounting for 2.3% of the prescription drug expenditures for Ontario and 1.3% of the total expenditures for the NPDUIS public drug plans over the entire fiscal year.
- More than 1 million active beneficiaries filled approximately 3 million prescriptions accepted for reimbursement by the OHIP+ program in the last quarter of 2017/18. If OHIP+ was excluded from the analysis, the overall beneficiary population would have grown by only 1.5% in Ontario and 0.7% in all NPDUIS public plans, compared to the actual 35.4% and 18.4%, respectively.
- The implementation of the OHIP+ program resulted in an increase in the share of the non-senior beneficiary population in the Ontario public drug plan, from 30% to 48%.
- Without OHIP+, the total prescription drug expenditure would have risen by 6.4% in Ontario and 5.9% in all NPDUIS public drug plans, in contrast to the actual growth rates of 8.9% and 7.4%, respectively. Using the same scenario, drug costs in Ontario would have risen by 7.2%, compared to the actual rate of 9.7%, while the drug cost growth in all NPDUIS public drug plans would have been 6.8% instead of 8.3%.
This assessment of the initial impact of the OHIP+ program was limited by the fact that some OHIP+ beneficiaries were not new to the Ontario public drug plan, resulting in some overlap between existing programs and OHIP+.
The program was subsequently redesigned to focus exclusively on children and youth not covered by a private plan beginning on April 1, 2019.
2. The Drivers of Drug Costs, 2016/17 to 2017/18
Sustained growth in the use of higher-cost medicines and a renewed pressure from DAA drugs for hepatitis C together accounted for a significant 7.1% upward push on drug costs in 2017/18. The fluctuating rates of change in drug costs over the last few years have largely been shaped by the use of DAA drugs, which after a sudden uptake in 2015/16, sharply declined in 2016/17, and then increased once again the following year. Generic savings, which have been diminishing in recent years, had only a small pull-down effect in 2017/18.
Changes in drug costs are driven by a number of “push” and “pull” effects. The net effect of these opposing forces yields the overall rate of change.
Price change effect: Changes in the prices of both brand-name and generic drugs, determined at the molecule, strength, and form level.
Substitution effect: Shifts from brand-name to generic drugs, as well as shifts to biosimilar use.
Demographic effect: Changes in the number of active beneficiaries, as well as shifts in the distribution of age or gender.
Volume effect: Changes in the number of prescriptions dispensed to patients, the average number of units of a drug dispensed per prescription, and/or shifts in the use of various strengths or forms of a medicine.
Drug-mix effect: Shifts in use between lower- and higher-cost drugs, including those entering, exiting, or remaining in the market during the time period analyzed.
In this section, a comprehensive cost driver analysis is used to determine how much public plan drug costs would have changed between 2016/17 and 2017/18 if only one factor (e.g., the price of drugs) was considered while all the others remained the same.Footnote I
Figure 2.1 provides insight into the pressures driving the rates of change in drug costs from 2012/13 to 2017/18.
Annual changes in the patient population and the volume of drugs used generally exert a slight to moderate upward pressure on drug costs. Despite its introduction late in the year, Ontario’s OHIP+ program had a significant influence on the results for 2017/18, making a 1.5% contribution to the overall upward pressure on drug costs. Apart from OHIP+, the demographic effect, which pushed costs up by 2% to 3% prior to 2015/16, now contributes less than 2% per year, indicating a slower growth in the number of active beneficiaries. The volume effect has steadily contributed an increase of approximately 1% to drug costs over the last few years.
Apart from these pressures, the actual net rate of change in drug costs depends on two important but opposing forces: the push effect of an increase in the use of higher-cost drugs and the pull-down effect from generic and biosimilar substitution and price reductions. In recent years, cost savings from generic or biosimilar substitutions and price reductions have gradually declined, as the impact from the pull-down effect lessened from -9.2% in 2012/13 to -2.4% in 2017/18. During this same period, the increased use of higher-cost drugs had a relatively consistent upward push of 4% to 5% annually. DAA drugs for hepatitis C have pushed costs further upward by an average of nearly 3% over the last three years. In 2017/18 alone, the combined push effect of DAAs and other higher-cost drugs had a significant 7.1% impact on drug costs in NPDUIS public plans.
Figure 2.1 Drug cost drivers, NPDUIS public drug plans*, 2012/13 to 2017/18
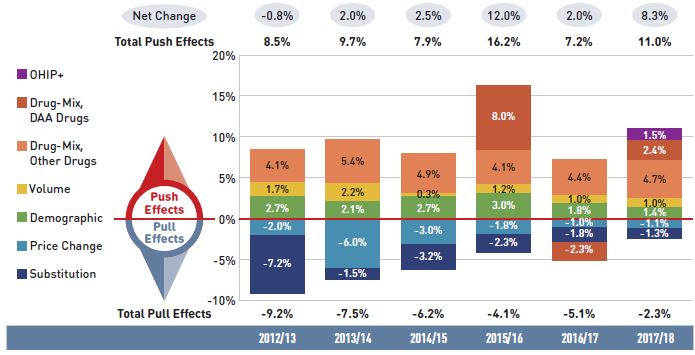
Figure description
This column graph describes the key factors or effects that impacted the rates of change in drug costs across all NPDUIS public drug plans for each year from 2012/13 to 2017/18. Each column is broken out to give the positive or negative contribution of each effect: drug-mix; volume; demographic; price change; and substitution. The drug-mix effect of direct-acting antiviral (DAA) drugs for hepatitis C is shown separately, as are the effects of the Ontario Health Insurance Plan Plus (OHIP+) initiative. The total positive push effect, negative pull effect, and net change are given for each year.
|
2012/13 |
2013/14 |
2014/15 |
2015/16 |
2016/17 |
2017/18 |
| OHIP+ |
– |
– |
– |
– |
– |
1.5% |
| Drug-mix, direct-acting antiviral (DAA) drugs |
– |
– |
– |
8.0% |
-2.3% |
2.4% |
| Drug mix, other drugs |
4.1% |
5.4% |
4.9% |
4.1% |
4.4% |
4.7% |
| Volume |
1.7% |
2.2% |
0.3% |
1.2% |
1.0% |
1.0% |
| Demographic |
2.7% |
2.1% |
2.7% |
3.0% |
1.8% |
1.4% |
| Price change |
-2.0% |
-6.0% |
-3.0% |
-1.8% |
-1.0% |
-1.1% |
| Substitution |
-7.2% |
-1.5% |
-3.2% |
-2.3% |
-1.8% |
-1.3% |
| Total push effect |
8.5% |
9.7% |
7.9% |
16.2% |
7.2% |
11.0% |
| Total pull effect |
-9.2% |
-7.5% |
-6.2% |
-4.1% |
-5.1% |
-2.3% |
| Net change |
-0.8% |
2.0% |
2.5% |
12.0% |
2.0% |
8.3% |
Note: Historical values are reported for 2012/13 to 2015/16.
This analysis is based on publicly available pricing information. It does not reflect the confidential price discounts negotiated by the pCPA on behalf of the public plans.
Values may not add to totals due to rounding and the cross effect. Results for 2012/13 do not capture the data for the British Columbia and Newfoundland and Labrador provincial public drug plans. Results for Yukon were included from 2016/17 onward.
* British Columbia, Alberta, Saskatchewan, Manitoba, Ontario, New Brunswick, Nova Scotia, Prince Edward Island, Newfoundland and Labrador, Yukon, and the Non-Insured Health Benefits Program.
Data source: National Prescription Drug Utilization Information System Database, Canadian Institute for Health Information.
The overall 8.3% increase in drug costs in 2017/18 represented an absolute growth of $699 million, with varying rates of growth among the public drug plans ranging from approximately 5% to 10% (Figure 2.2). Newfoundland and Labrador was the exception with a smaller 0.5% increase. These variations were mainly driven by differences in the impact of the drug-mix effect. Jurisdictions with higher overall growth rates included Ontario (9.7%), Saskatchewan (9.4%), the NIHB (8.4%), and New Brunswick (7.2%).
Figure 2.2 Rates of change in drug costs, NPDUIS public drug plans, 2016/17 to 2017/18
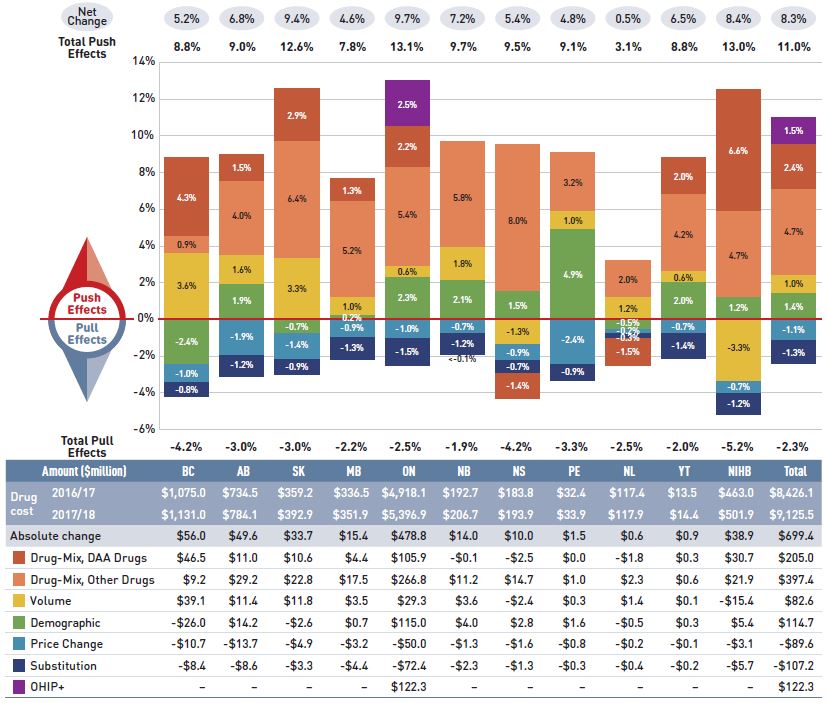
Figure description
This column graph and table describe the key factors or effects that impacted the rates of change in drug costs for each of the NPDUIS public drug plans from 2016/17 to 2017/18. Each column is broken out to give the positive or negative contribution of each effect: drug-mix; volume; demographic; price change; and substitution. The drug-mix effect of direct-acting antiviral (DAA) drugs for hepatitis C is shown separately, as are the effects of the Ontario Health Insurance Plan Plus (OHIP+) initiative. The total positive push effect, negative pull effect and net change are given for each year. Total results for all plans are also included.
|
British Columbia |
Alberta |
Saskatchewan |
Manitoba |
Ontario |
New Brunswick |
Nova Scotia |
Prince Edward Island |
Newfoundland and Labrador |
Yukon |
Non-Insured Health Benefits |
Total |
| OHIP+ |
– |
– |
– |
– |
2.5% |
– |
– |
– |
– |
– |
– |
1.5% |
| Drug-mix, direct-acting antiviral (DAA) drugs |
4.3% |
1.5% |
2.9% |
1.3% |
2.2% |
<-0.1% |
-1.4% |
0.0% |
-1.5% |
2.0% |
6.6% |
2.4% |
| Drug-mix, other drugs |
0.9% |
4.0% |
6.4% |
5.2% |
5.4% |
5.8% |
8.0% |
3.2% |
2.0% |
4.2% |
4.7% |
4.7% |
| Volume |
3.6% |
1.6% |
3.3% |
1.0% |
0.6% |
1.8% |
-1.3% |
1.0% |
1.2% |
0.6% |
-3.3% |
1.0% |
| Demographic |
-2.4% |
1.9% |
-0.7% |
0.2% |
2.3% |
2.1% |
1.5% |
4.9% |
-0.5% |
2.0% |
1.2% |
1.4% |
| Price change |
-1.0% |
-1.9% |
-1.4% |
-0.9% |
-1.0% |
-0.7% |
-0.9% |
-2.4% |
-0.2% |
-0.7% |
-0.7% |
-1.1% |
| Substitution |
-0.8% |
-1.2% |
-0.9% |
-1.3% |
-1.5% |
-1.2% |
-0.7% |
-0.9% |
-0.3% |
-1.4% |
-1.2% |
-1.3% |
| Total push effect |
8.8% |
9.0% |
12.6% |
7.8% |
13.1% |
9.7% |
9.5% |
9.1% |
3.1% |
8.8% |
13.0% |
11.0% |
| Total pull effect |
-4.2% |
-3.0% |
-3.0% |
-2.2% |
-2.5% |
-1.9% |
-4.2% |
-3.3% |
-2.5% |
-2.0% |
-5.2% |
-2.3% |
| Net change |
5.2% |
6.8% |
9.4% |
4.6% |
9.7% |
7.2% |
5.4% |
4.8% |
0.5% |
6.5% |
8.4% |
8.3% |
An accompanying table gives the corresponding changes in millions of dollars, as well as the total drugs costs in 2016/17 and 2017/18 and the absolute change for each plan.
|
British Columbia |
Alberta |
Saskatchewan |
Manitoba |
Ontario |
New Brunswick |
Nova Scotia |
Prince Edward Island |
Newfoundland and Labrador |
Yukon |
Non-Insured Health Benefits |
Total |
| Drug cost 2016/17 |
$1,075.0 |
$734.5 |
$359.2 |
$336.5 |
$4,918.1 |
$192.7 |
$183.8 |
$32.4 |
$117.4 |
$13.5 |
$463.0 |
$8,426.1 |
| Drug cost 2017/18 |
$1,131.0 |
$784.1 |
$392.9 |
$351.9 |
$5,396.9 |
$206.7 |
$193.9 |
$33.9 |
$117.9 |
$14.4 |
$501.9 |
$9,125.5 |
| Absolute change |
$56.0 |
$49.6 |
$33.7 |
$15.4 |
$478.8 |
$14.0 |
$10.0 |
$1.5 |
$0.6 |
$0.9 |
$38.9 |
$699.4 |
| Drug-mix, direct-acting antiviral (DAA) drugs |
$46.5 |
$11.0 |
$10.6 |
$4.4 |
$105.9 |
-$0.1 |
-$2.5 |
0.0% |
-$1.8 |
$0.3 |
$30.7 |
$205.0 |
| Drug-mix, other drugs |
$9.2 |
$29.2 |
$22.8 |
$17.5 |
$266.8 |
$11.2 |
$14.7 |
$1.0 |
$2.3 |
$0.6 |
$21.9 |
$397.4 |
| Volume |
$39.1 |
$11.4 |
$11.8 |
$3.5 |
$29.3 |
$3.6 |
-$2.4 |
$0.3 |
$1.4 |
$0.1 |
-$15.4 |
$82.6 |
| Demographic |
-$26.0 |
$14.2 |
-$2.6 |
$0.7 |
$115.0 |
$4.0 |
$2.8 |
$1.6 |
-$0.5 |
$0.3 |
$5.4 |
$114.7 |
| Price change |
-$10.7 |
-$13.7 |
-$4.9 |
-$3.2 |
-$50.0 |
-$1.3 |
-$1.6 |
-$0.8 |
-$0.2 |
-$0.1 |
-$3.1 |
-$89.6 |
| Substitution |
-$8.4 |
-$8.6 |
-$3.3 |
-$4.4 |
-$72.4 |
-$2.3 |
-$1.3 |
-$0.3 |
-$0.4 |
-$0.2 |
-$5.7 |
-$107.2 |
| OHIP+ |
– |
– |
– |
– |
$122.3 |
– |
– |
– |
– |
– |
– |
$122.3 |
Note: This analysis is based on publicly available pricing information. It does not reflect the confidential drug price discounts negotiated by the pCPA on behalf of the public plans. Values may not add to totals due to rounding and the cross effect.
* Data was unavailable for British Columbia’s First Nations Health Authority (FNHA) in the second half of 2017/18.
Data source: National Prescription Drug Utilization Information System Database, Canadian Institute for Health Information.
The increased use of higher-cost drugs other than DAAs had the greatest push effect, with an impact of 4.7% ($397 million) ranging from 0.9% to 8.0% across jurisdictions. The pressure from DAA drugs increased drug costs by an additional 2.4% ($205 million). Differences in the drug-mix effect across public drug plans may be related to plan designs, formulary listing decisions, or the disease profiles of the population, among other determinants. The impact of DAA drugs also varied, with the largest upward push in the NIHB (6.6%), followed by British Columbia (4.3%), Saskatchewan (2.9%), and Ontario (2.2%); while in Nova Scotia and Newfoundland and Labrador, DAA drug use declined, pulling costs downward by -1.5%.
The introduction of the OHIP+ program in Ontario during the last quarter of the 2017/18 fiscal year added $122 million in drug costs, pushing costs upward by 2.5% in Ontario and by 1.5% across all NPDUIS public drug plans for the entire year.
The demographic effect boosted drug costs in the NPDUIS public plans by 1.4% ($115 million) in 2017/18. An increase in the number of Canadians eligible for senior coverage (65+) and the launch of new sub-plans (e.g., increased eligibility in PEI) are among the factors that contributed to this growth.
The volume effect, which has been relatively stable over the past few years, pushed drug costs up by 1.0%, or $83 million in 2017/18. This effect was an important driver in British Columbia (3.6%) and Saskatchewan (3.3%).
The cost-saving effects of generic and biosimilar substitution (-1.3% or -$107 million) and price reductions (-1.1% or -$90 million) were relatively uniform across the jurisdictions. Together they represented a modest 2.4% savings for the NPDUIS public plans, or $197 million, markedly below the savings realized in previous years.
The price change, substitution, and drug-mix effects for 2017/18 are explored in more detail in this section.
Price Change Effect
This effect captures changes in the prices of both brand-name and generic medicines. In 2017/18, reductions in drug prices pulled the overall cost levels downward by 1.1% ($90 million). An analysis by market segment suggests that the downward pull was mainly due to the reduction in the average unit costs reimbursed in the multi-source generic category, as the average unit costs of patented medicines remained relatively stable while the costs of single-source non-patented medicines increased.
More than half of the total decrease in the price change effect was a direct result of the pan-Canadian Pharmaceutical Alliance’s (pCPA) one-year bridging arrangement, which began on April 1, 2017. Under the bridging arrangement, the prices of six commonly used generic medicines were reduced from 18% to 15% of the brand-reference price.Footnote II Subsequent to this, a new five-year agreement between the pCPA and the Canadian Generic Pharmaceutical Association (CGPA) was initiated on April 1, 2018. The agreement further reduced the prices of 67 of the most commonly prescribed generic medicines in Canada to approximately 10% to 18% of their equivalent brand name product. This change, as well as any other pricing policy implemented after 2017/18, will be reflected in future editions of this report.
Figure 2.3 reports trends in average unit costs from 2009/10 to 2017/18 by market segment for (a) patented medicines; (b) multi-source generic medicines; and (c) single-source non-patented medicines, along with their corresponding 2017/18 market shares. The results are presented as an index, with the base year (2009/10) set to one and subsequent years reported relative to this value. The findings were calculated using the cost-weighted average of the average reimbursed unit cost changes at the individual medicine level. The analysis was restricted to oral solid formulations to ensure unit consistency.
From 2009/10 to 2017/18, the prices of patented medicines, which represent the largest market segment (62.6% in 2017/18), were relatively stable, while the prices of single-source non-patented medicines, the smallest market segment (3.8%), increased by an average of 23%. Despite this significant rise, the impact of the single-source non-patented market segment was limited due to its small size.
The multi-source generic market segment shows a similar trend across all NPDUIS public drug plans: a rapid decline in the first few years after generic price reforms, followed by a more gradual decline from 2014/15 to 2016/17 as generic prices stabilized, then a further 3% average decline in 2017/18. The variation among the individual plans reflects the timing of generic reforms, the magnitude of generic price reductions, and the utilization rates of generic medicines.
Brief Insights: pCPA Initiatives
Through the pan-Canadian Pharmaceutical Alliance (pCPA), the provinces, territories, and federal government have been working collectively to achieve greater value for generic and brand-name medicines for Canada’s publicly funded drug programs.
Generic medicines:
Between April 1, 2015, and April 1, 2016, the prices of 18 commonly used generic medicines were reduced to 18% of their brand-name reference products. In addition, a one-year bridging period was put into effect on April 1, 2017, which further reduced the prices of six of the molecules to 15% of the brand reference price.
As of April 1, 2018, the prices of 67 of the most commonly prescribed medicines in Canada were reduced by 25% to 40%, resulting in overall discounts of up to 90% off the price of their brand-name equivalents.
Brand-name medicines:
As of June 30, 2019, 297 joint negotiations or product listing agreements (PLAs) for brand-name drugs had been completed by the pCPA, with another 49 negotiations underway.
For more details, see the overview of generic pricing policies and pCPA initiatives available in the Reference Documents section of the NPDUIS Analytical Studies page on the PMPRB website.
Figure 2.3 Average unit cost index by market segment, NPDUIS public drug plans, 2009/10 to 2017/18
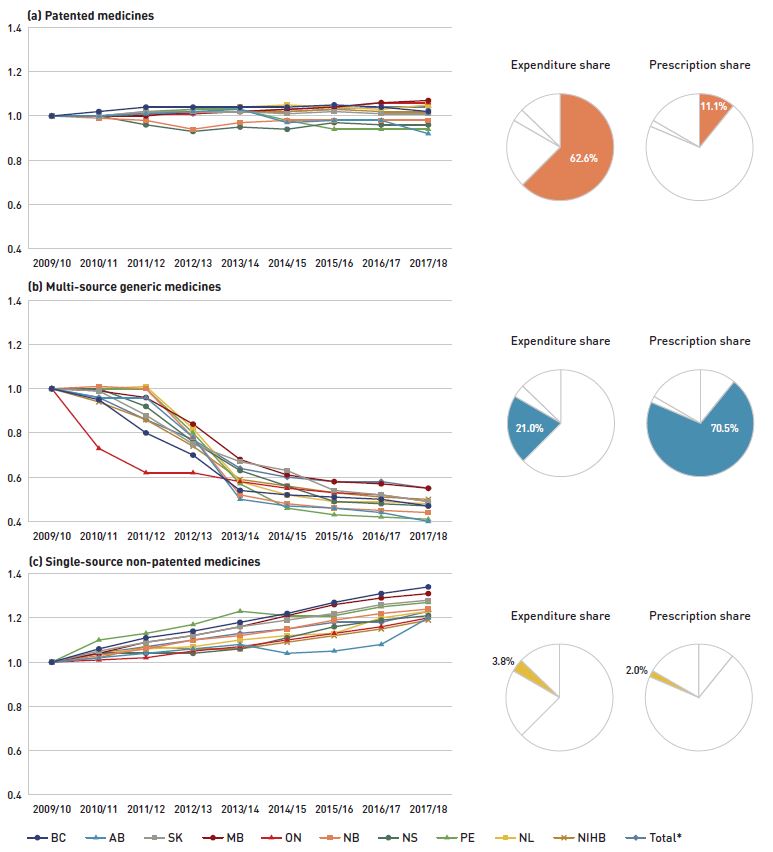
Figure description
This figure has three sections, each with a line graph depicting the average unit cost index from 2009/10 to 2017/18 for (a) patented medicines, (b) multi-source generic medicines, and (c) single-source non-patented medicines. Results are given for each NPDUIS drug plan, as well as the total for all plans. Expenditure and prescription shares for 2017/18 are shown in pie charts beside each graph.
(a) Patented medicines
Expenditure share: 62.6%
Prescription share: 11.1%
| |
2009/10 |
2010/11 |
2011/12 |
2012/13 |
2013/14 |
2014/15 |
2015/16 |
2016/17 |
2017/18 |
| British Columbia |
1.00 |
1.02 |
1.04 |
1.04 |
1.04 |
1.04 |
1.05 |
1.04 |
1.02 |
| Alberta |
1.00 |
1.00 |
1.01 |
1.02 |
1.03 |
0.97 |
0.98 |
0.98 |
0.92 |
| Saskatchewan |
1.00 |
1.00 |
1.02 |
1.02 |
1.02 |
1.01 |
1.02 |
1.01 |
1.01 |
| Manitoba |
1.00 |
1.00 |
1.00 |
1.02 |
1.02 |
1.03 |
1.04 |
1.06 |
1.07 |
| Ontario |
1.00 |
1.00 |
1.01 |
1.01 |
1.02 |
1.03 |
1.04 |
1.06 |
1.06 |
| New Brunswick |
1.00 |
0.99 |
0.98 |
0.94 |
0.97 |
0.98 |
0.98 |
0.98 |
0.98 |
| Nova Scotia |
1.00 |
1.00 |
0.96 |
0.93 |
0.95 |
0.94 |
0.97 |
0.96 |
0.96 |
| Prince Edward Island |
1.00 |
1.00 |
1.02 |
1.03 |
1.03 |
0.98 |
0.94 |
0.94 |
0.94 |
| Newfoundland and Labrador |
1.00 |
1.00 |
1.01 |
1.03 |
1.04 |
1.05 |
1.04 |
1.03 |
1.05 |
| Non-Insured Health Benefits |
1.00 |
1.00 |
1.01 |
1.02 |
1.02 |
1.02 |
1.03 |
1.02 |
1.02 |
| Total* |
1.00 |
1.00 |
1.01 |
1.01 |
1.02 |
1.02 |
1.03 |
1.04 |
1.04 |
(b) Multi-source generic medicines
Expenditure share: 21.0%
Prescription share: 70.5%
| |
2009/10 |
2010/11 |
2011/12 |
2012/13 |
2013/14 |
2014/15 |
2015/16 |
2016/17 |
2017/18 |
| British Columbia |
1.00 |
0.95 |
0.80 |
0.70 |
0.54 |
0.52 |
0.51 |
0.50 |
0.47 |
| Alberta |
1.00 |
0.96 |
0.96 |
0.78 |
0.50 |
0.47 |
0.46 |
0.44 |
0.40 |
| Saskatchewan |
1.00 |
0.99 |
0.88 |
0.75 |
0.67 |
0.63 |
0.54 |
0.52 |
0.49 |
| Manitoba |
1.00 |
0.99 |
0.96 |
0.84 |
0.68 |
0.61 |
0.58 |
0.57 |
0.55 |
| Ontario |
1.00 |
0.73 |
0.62 |
0.62 |
0.58 |
0.55 |
0.53 |
0.52 |
0.49 |
| New Brunswick |
1.00 |
1.01 |
1.00 |
0.78 |
0.52 |
0.48 |
0.46 |
0.45 |
0.44 |
| Nova Scotia |
1.00 |
1.00 |
0.92 |
0.76 |
0.63 |
0.56 |
0.49 |
0.48 |
0.47 |
| Prince Edward Island |
1.00 |
1.00 |
1.00 |
0.80 |
0.57 |
0.46 |
0.43 |
0.42 |
0.41 |
| Newfoundland and Labrador |
1.00 |
1.00 |
1.01 |
0.82 |
0.58 |
0.52 |
0.49 |
0.49 |
0.48 |
| Non-Insured Health Benefits |
1.00 |
0.94 |
0.86 |
0.74 |
0.59 |
0.56 |
0.53 |
0.51 |
0.50 |
| Total* |
1.00 |
0.96 |
0.86 |
0.77 |
0.64 |
0.60 |
0.58 |
0.58 |
0.55 |
(c) Single-source non-patented medicines
Expenditure share: 3.8%
Prescription share: 2.0%
| |
2009/10 |
2010/11 |
2011/12 |
2012/13 |
2013/14 |
2014/15 |
2015/16 |
2016/17 |
2017/18 |
| British Columbia |
1.00 |
1.06 |
1.11 |
1.14 |
1.18 |
1.22 |
1.27 |
1.31 |
1.34 |
| Alberta |
1.00 |
1.02 |
1.04 |
1.06 |
1.08 |
1.04 |
1.05 |
1.08 |
1.20 |
| Saskatchewan |
1.00 |
1.05 |
1.09 |
1.12 |
1.16 |
1.19 |
1.22 |
1.26 |
1.28 |
| Manitoba |
1.00 |
1.04 |
1.09 |
1.12 |
1.16 |
1.21 |
1.26 |
1.29 |
1.31 |
| Ontario |
1.00 |
1.01 |
1.02 |
1.05 |
1.07 |
1.10 |
1.13 |
1.16 |
1.20 |
| New Brunswick |
1.00 |
1.03 |
1.06 |
1.10 |
1.12 |
1.15 |
1.19 |
1.22 |
1.24 |
| Nova Scotia |
1.00 |
1.04 |
1.04 |
1.04 |
1.06 |
1.11 |
1.16 |
1.19 |
1.21 |
| Prince Edward Island |
1.00 |
1.10 |
1.13 |
1.17 |
1.23 |
1.21 |
1.21 |
1.25 |
1.27 |
| Newfoundland and Labrador |
1.00 |
1.04 |
1.06 |
1.07 |
1.10 |
1.12 |
1.13 |
1.20 |
1.23 |
| Non-Insured Health Benefits |
1.00 |
1.02 |
1.07 |
1.06 |
1.06 |
1.09 |
1.12 |
1.15 |
1.19 |
| Total* |
1.00 |
1.04 |
1.07 |
1.10 |
1.13 |
1.15 |
1.18 |
1.18 |
1.23 |
Note: This analysis only includes data for beneficiaries that met their deductible and received public reimbursement.
Yukon is not reported due to data limitations. The findings were calculated using the cost-weighted average of the average reimbursed unit cost changes at the individual drug level. The analysis was limited to data for oral solid formulations. The remaining share of prescriptions and expenditures includes devices, compounded drugs, and other products that are reimbursed by public drug plans but do not have a Health Canada assigned Drug Identification Number (DIN).
* Total results for the drugs plans captured in this figure.
Data source: National Prescription Drug Utilization Information System Database, Canadian Institute for Health Information.
Substitution Effect
Shifts from brand-name to generic or biosimilar medicines pulled overall drug costs down by 1.3% in 2017/18, translating into a savings of $107 million for the NPDUIS public plans. Three medicines, one antidepressant and two antivirals to treat HIV/AIDs, were responsible for the majority of the savings from generic substitution: duloxetine (-0.2%), tenofovir disoproxil (-0.2%), and tenofovir disoproxil / emtricitabine (-0.2%). The total savings offered by biosimilars, two immunosuppressants and one immunostimulant, were limited, with Inflectra (-0.1%), Grastofil (-0.08%), and Brenzys/Erelzi (0.02%) making a small but growing difference in overall drug costs.
Brief Insights: Biosimilars
In April 2016, the pCPA issued the First Principles for Subsequent Entry Biologics to guide negotiations and inform expectations for biologics and biosimilars. This was followed by the creation of the Biologics Policy Directions in September 2018 to further guide and define the process by which biologic and biosimilar products will be negotiated and considered for reimbursement by Canada’s public drug plans.
Additionally, the pCPA has recently partnered with Cancer Care Ontario on a joint oncology biosimilars initiative that recognizes the unique considerations in the implementation of oncology biosimilars.
The share of prescriptions for multi-source generic medicines in public plans exceeded 70% in 2017/18, a marked increase from 61.5% in 2012/13, while their corresponding share of total drug costs decreased significantly over the same time period, from 28.8% to 21.0%. This six-year trend reflects the implementation of generic pricing policies, as well as the end of the patent cliff period.
Patented medicines accounted for a decreasing share of prescriptions, dropping from 14.0% to 11.1% over the six-year period, while their share of costs increasingly dominated, rising from 52.2% to 62.6% of total public plan drug costs. This shift was primarily due to the increased use of high-cost drugs, such as biologics, oral oncology medicines, and the new DAA drugs for hepatitis C.
Figure 2.4 reports the 2012/13 to 2017/18 trends in market shares by market segment: patented, multi-source generic, and single-source non-patented medicines.
Figure 2.4 Shares of prescriptions and drug costs by market segment, NPDUIS public drug plans*, 2012/13 to 2017/18
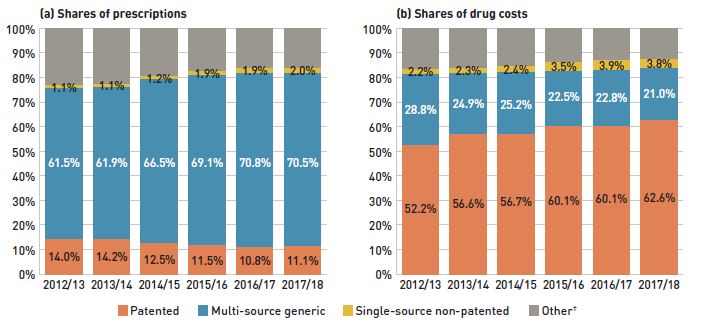
Figure description
This figure shows two complementary stacked column graphs. Graph (a) shows the share of prescriptions by market segment from 2012/13 to 2017/18 for all NPDUIS public drug plans. Graph (b) shows the share of drug costs by market segment for the same period.
(a) Share of prescriptions
| Market segment |
2012/13 |
2013/14 |
2014/15 |
2015/16 |
2016/17 |
2017/18 |
| Patented |
14.0% |
14.2% |
12.5% |
11.5% |
10.8% |
11.1% |
| Multi-source generic |
61.5% |
61.9% |
66.5% |
69.1% |
70.8% |
70.5% |
| Single-source non-patented |
1.1% |
1.1% |
1.2% |
1.9% |
1.9% |
2.0% |
| Other† |
23.3% |
22.7% |
19.8% |
17.5% |
16.5% |
16.4% |
(b) Share of drug costs
| Market segment |
2012/13 |
2013/14 |
2014/15 |
2015/16 |
2016/17 |
2017/18 |
| Patented |
52.2% |
56.6% |
56.7% |
60.1% |
60.1% |
62.6% |
| Multi-source generic |
28.8% |
24.9% |
25.2% |
22.5% |
22.8% |
21.0% |
| Single-source non-patented |
2.2% |
2.3% |
2.4% |
3.5% |
3.9% |
3.8% |
| Other† |
16.8% |
16.2% |
15.8% |
13.9% |
13.2% |
12.6% |
Note: This analysis only includes data for beneficiaries that met their deductible and received public reimbursement.
* British Columbia, Alberta, Saskatchewan, Manitoba, Ontario, New Brunswick, Nova Scotia, Prince Edward Island, Newfoundland and Labrador, Yukon, and the Non-Insured Health Benefits Program.
† This market segment includes devices, compounded drugs, and other products that are reimbursed by public drug plans but do not have a Health Canada assigned Drug Identification Number (DIN).
Data source: National Prescription Drug Utilization Information System Database, Canadian Institute for Health Information.
Compared to traditional generic drug markets, the savings from biosimilars are limited by a slower initial uptake and lower price reductions. The biosimilar market is a more complex space; unlike generics, biosimilars are not identical to their reference products, but are rather highly similar versions, making it more difficult to exchange one drug for another.Footnote III Table 2.1 provides an overview of the biosimilars recently approved in Canada.
Inflectra, which was approved in Canada in 2014 and became available in the public market in 2016, was one of the first biosimilars available in CanadaFootnote IV and has the highest list price discount. By 2017/18, it had been approved for most of the same autoimmune inflammatory disease indications as its reference product Remicade. But despite the fact that Inflectra’s list price was almost half the price of Remicade, its market uptake has been slow, acquiring only 5.4% of the infliximab market by 2017/18.
Grastofil, a biosimilar of the white blood cell stimulator Neupogen, has the highest uptake in the public plans, at 72.3% in 2017/18. However, its 25% discount from the reference product list price at entry places it at the bottom of the biosimilars in terms of price reductions. Brenzys and Erelzi, biosimilars of the anti-TNF drug Enbrel, were approved for market in Canada in 2016 and 2017, respectively. At approximately one third lower than the list price of their reference biologic, they had captured only 2.4% of the prescription share of the etanercept market by 2017/18.
Table 2.1 Biosimilars recently approved in Canada, NPDUIS public drug plans*, 2017/18
| Reference biologic |
Biosimilar |
| Trade name (medicinal ingredient) |
Drug cost, $ million (% share) |
Trade name |
Market approval |
First reimbursement |
Price discount† from reference biologic |
Share of prescriptions for medicinal ingredient |
| Remicade (infliximab) |
$391.0 (4.3%) |
Inflectra |
15-Jan-14 |
Q1-2016 |
46.8% |
5.4% |
| Renflexis |
01-Dec-17 |
Q3-2018 |
50.1% |
NA |
| Lantus (insulin glargine) |
$147.2 (1.6%) |
Basaglar |
01-Sep-15 |
Q3-2017 |
25.0% |
1.0% |
| Neupogen (filgrastim) |
$16.0 (0.2%) |
Grastofil |
07-Dec-15 |
Q4-2016 |
25.0% |
72.3% |
| Enbrel (etanercept) |
$157.6 (1.7%) |
Brenzys |
31-Aug-16 |
Q3-2017 |
33.7% |
2.4% |
| Erelzi |
06-Apr-17 |
Q4-2017 |
37.2% |
<0.1% |
* British Columbia, Alberta, Saskatchewan, Manitoba, Ontario, New Brunswick, Nova Scotia, Prince Edward Island, Newfoundland and Labrador, Yukon, and the Non-Insured Health Benefits Program.
† Based on Ontario Drug Benefit formulary listing price at the time of the biosimilar entry. This price may change over time; for example, the list price for Brenzys was recently lowered to match Erelzi.
Data source: National Prescription Drug Utilization Information System Database, Canadian Institute for Health Information.
To explore the impact of biosimilar entry in a key therapeutic market, Figure 2.5 assesses the distribution of patients initiated on biological or targeted synthetic disease-modifying antirheumatic drugs (DMARDs) in the public plans before and after the introduction of Inflectra. Although this market has grown considerably over the last several years, fewer new patients were initiated on infliximab after the introduction of Inflectra; instead, new patients were initiated on other originator products.
Until 2015/16, approximately 23% of new patients used infliximab, but after Inflectra was introduced, this dropped to 12%, with only half using the biosimilar. During this time, other medicines in this class, apart from etanercept, kept or slightly increased their market share of new patients. Xeljanz, a new targeted synthetic drug which was introduced in 2014, now has the fastest-growing market share in the class, accounting for 16% of new patients in 2017/18 and largely occupying the share held by infliximab in previous years. A breakdown of the distribution of new patients by jurisdiction is provided in Appendix B.
Figure 2.5 Distribution of new public drug plan patients on select disease-modifying antirheumatic drugs (DMARDs)* before and after Inflectra’s market entry in Canada
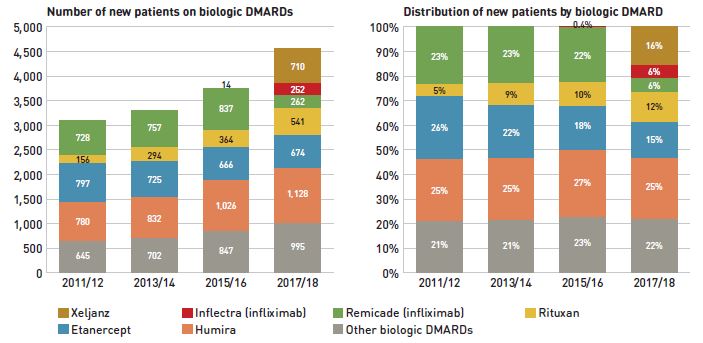
Figure description
Two stacked bar graphs break down the distribution of new patients started on a non-conventional disease-modifying antirheumatic by drug every second year from 2011/12 to 2017/18. The first graph gives the number of new patients started on each drug, while the second gives the distribution of new patients as a share of all non-conventional disease-modifying antirheumatics.
| |
2011/12 |
2013/14 |
2015/16 |
2017/18 |
| Xeljanz: number of new patients |
– |
– |
– |
710 |
| Xeljanz: distribution of new patients |
– |
– |
– |
16% |
| Inflectra (infliximab): number of new patients |
– |
– |
14 |
252 |
| Inflectra (infliximab): distribution of new patients |
– |
– |
0.4% |
6% |
| Remicade (infliximab): number of new patients |
728 |
757 |
837 |
262 |
| Remicade (infliximab): distribution of new patients |
23% |
23% |
22% |
6% |
| Rituxan: number of new patients |
156 |
294 |
364 |
541 |
| Rituxan: distribution of new patients |
5% |
9% |
10% |
12% |
| Etanercept: number of new patients |
797 |
725 |
666 |
674 |
| Etanercept: distribution of new patients |
26% |
22% |
18% |
15% |
| Humira: number of new patients |
780 |
832 |
1,026 |
1,128 |
| Humira: distribution of new patients |
25% |
25% |
27% |
25% |
| Other biologic DMARDs: number of new patients |
645 |
702 |
847 |
995 |
| Other biologic DMARDs: distribution of new patients |
21% |
21% |
23% |
22% |
Note: Other biologic DMARDs included Simponi, Orencia, Actemra, and Cimzia.
* Results do not distinguish between use for rheumatoid arthritis and for other indications.
Data source: National Prescription Drug Utilization Information System Database, Canadian Institute for Health Information.
Drug-Mix Effect
Shifts in use between lower- and higher-cost drugs pushed overall cost levels for the NPDUIS drug plans up by 4.7% or $397 million in 2017/18. Direct-acting antiviral (DAA) drugs for the treatment of hepatitis C, which are reported separately in this analysis, put an additional upward pressure of 2.4% on plans for a total push of $602 million due to the drug-mix effect.
Figure 2.6 reports the drugs that made the greatest contribution to the drug-mix effect; with the top 10 positive contributors accounting for an upward push of 3.1% on overall drug costs. Ophthalmological drugs contributed both positively (Eylea) and negatively (Lucentis) to the increase in drug costs, although the push effect from Eylea was more than double the pull-down effect from Lucentis. Half of the other major contributors were oral oncology products and immunosuppressants with average annual treatment costs exceeding $10,000, two of which exceeded $50,000. The remaining top contributors were used by larger beneficiary populations to treat more common conditions. The share of total drug costs for each of the top 10 contributors is reported in the accompanying table. Note that this value differs from the contribution to the drug-mix effect, which measures the growth (increase or decrease in costs over time) rather than the costs themselves.
Figure 2.6 Top contributors to the drug-mix effect, NPDUIS public drug plans*, 2017/18
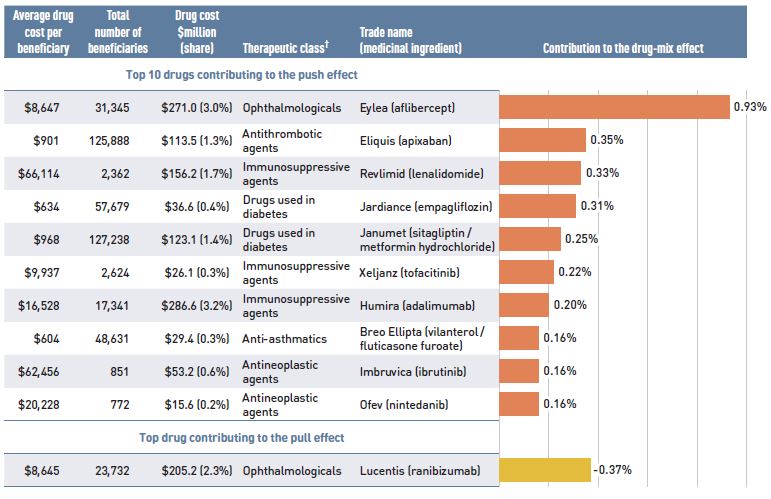
Figure description
A horizontal bar graph depicts the top 10 drugs contributing to the drug-mix push effect in the NPDUIS public drug plans in 2017/18 and the top drug contributing to the drug-mix pull effect. An accompanying table gives the average cost per beneficiary; total number of beneficiaries; drug cost in millions of dollars; share of the total drug cost; therapeutic class; and trade name and medicinal ingredient for each drug.
| Average cost per beneficiary* |
Total number of beneficiaries |
Drug cost, in millions of dollars (share) |
Therapeutic class† |
Trade name (medicinal ingredient) |
Contribution to the drug-mix effect |
| Top 10 drugs contributing to the push effect |
| $8,647 |
31,345 |
$271.0 (3.0%) |
Ophthalmologicals |
Eylea (aflibercept) |
0.93% |
| $901 |
125,888 |
$113.5 (1.3%) |
Antithrombotic agents |
Eliquis (apixaban) |
0.35% |
| $66,114 |
2,362 |
$156.2 (1.7%) |
Immunosuppressive agents |
Revlimid (lenalidomide) |
0.33% |
| $634 |
57,679 |
$36.6 (0.4%) |
Drugs used in diabetes |
Jardiance (empagliflozin) |
0.31% |
| $968 |
127,238 |
$123.1 (1.4%) |
Drugs used in diabetes |
Janumet (sitagliptin, metformin hydrochloride) |
0.25% |
| $9,937 |
2,624 |
$26.1 (0.3%) |
Immunosuppressive agents |
Xeljanz (tofacitinib) |
0.22% |
| $16,528 |
17,341 |
$286.6 (3.2%) |
Immunosuppressive agents |
Humira (adalimumab) |
0.20% |
| $604 |
48,631 |
$29.4 (0.3%) |
Anti-asthmatics |
Breo Ellipta (vilanterol, fluticasone furoate) |
0.16% |
| $62,456 |
851 |
$53.2 (0.6%) |
Antineoplastic agents |
Imbruvica (ibrutinib) |
0.16% |
| $20,228 |
772 |
$15.6 (0.2%) |
Antineoplastic agents |
Ofev (nintedanib) |
0.16% |
| Top drug contributing to the pull effect |
| $8,645 |
23,732 |
$205.2 (2.3%) |
Ophthalmologicals |
Lucentis (ranibizumab) |
-0.37% |
Note: This analysis only includes data for beneficiaries that met their deductible and received public reimbursement.
* British Columbia, Alberta, Saskatchewan, Manitoba, Ontario, New Brunswick, Nova Scotia, Prince Edward Island, Newfoundland and Labrador, Yukon, and the Non-Insured Health Benefits Program.
† The therapeutic class is based on ATC level 2. Jurisdictions which have special programs for ophthalmological drugs are not captured in the results.
‡ All of the top contributors to the push effect are associated with product listing agreements (PLAs) from pCPA negotiations for one or multiple indications; however, reported drug costs do not reflect price reductions resulting from confidential PLAs.
Data source: National Prescription Drug Utilization Information System Database, Canadian Institute for Health Information.
Spotlight on DAA drugs for hepatitis C
DAA drugs for hepatitis C have had a significant but variable impact on public plan drug costs over the last few years. With the entry of newer DAA drugs and expanded treatment criteria in 2017/18, the number of active beneficiaries increased from 7,563 in 2016/17 to 11,920, with a corresponding increase of $205 million in overall costs.
Through the pan-Canadian Pharmaceutical Alliance (pCPA), pricing agreements for most of these drugs were reached between 2014 and 2016, with the resulting public coverage being restricted to patients with a certain type or severity of illness. In 2017, a multi-stakeholder agreement was reached through the pCPA, which included several new drugs along with those that were already being reimbursed.
Since the implementation of the multi-stakeholder agreement in 2017, the criteria for listing DAA drugs in public drug plans has been expanded to include patients who were previously ineligible for coverage. This will likely have implications on the cost growth of DAAs in future years.
NPDUIS public plans have been reimbursing a growing number of high-cost drugs, which often target relatively small patient populations. The number of medicines with average annual costs per beneficiary exceeding $10,000 increased significantly from 62 in 2012/13 to 99 in 2017/18. These drugs, which accounted for 15.6% of the overall NPDUIS drug costs in 2012/13, accounted for 30.5% of the costs in 2017/18, representing only a very small percentage of active beneficiaries (1.68%).
Although there has been a sustained growth in the costs of all high-cost drugs in recent years, the steepest increase has been in the highest-cost band ($50,000+). Figure 2.7 reports on the trends in high-cost drug use from 2012/13 to 2017/18 by average annual drug cost per active beneficiary determined at the medicinal ingredient level: $10,000–$20,000; $20,000–$50,000; and $50,000+.
Figure 2.7 Trends in the number and cost of high-cost drugs* NPDUIS public drug plans†, 2012/13 to 2017/18
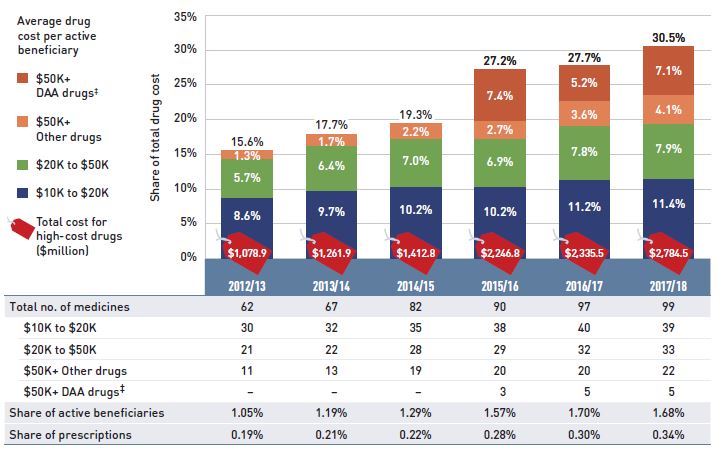
Figure description
This stacked column graph and accompanying table give the trends in high-cost drugs from 2012/13 to 2017/18. A graph reports the share of drug costs for high-cost drugs broken out by average cost per active beneficiary: $10,000‒20,000; $20,000–$50,000, and greater than $50,000. The share of new direct-acting antiviral drugs for hepatitis C is reported separately. The table gives the total number of high-cost medicines, the number of medicines in each cost band, the share of beneficiaries using these drugs, and the share of prescriptions that they represent.
| |
2012/13 |
2013/14 |
2014/15 |
2015/16 |
2016/17 |
2017/18 |
| Total number of medicines |
62 |
67 |
82 |
90 |
97 |
99 |
| Total drug cost for all high-cost drugs in millions of dollars |
$1,078.9 |
$1,261.9 |
$1,412.8 |
$2,246.8 |
$2,335.5 |
$2,784.5 |
| Average cost per active beneficiary of $10,000‒20,000: share of total drug cost |
8.6% |
9.7% |
10.2% |
10.2% |
11.2% |
11.4% |
| Average cost per active beneficiary of $10,000‒20,000: number of medicines |
30 |
32 |
35 |
38 |
40 |
39 |
| Average cost per active beneficiary of $20,000–$50,000: share of total drug cost |
5.7% |
6.4% |
7.0% |
6.9% |
7.8% |
7.9% |
| Average cost per active beneficiary of $20,000–$50,000: number of medicines |
21 |
22 |
28 |
29 |
32 |
33 |
| Average cost per active beneficiary of greater than $50,000: share of total drug cost for direct-acting antiviral drugs |
– |
– |
– |
7.4% |
5.2% |
7.1% |
| Average cost per active beneficiary of greater than $50,000: number of medicines for direct-acting antiviral drugs |
– |
– |
– |
3 |
5 |
5 |
| Average cost per active beneficiary of greater than $50,000: share of total drug cost for other drugs |
1.3% |
1.7% |
2.2% |
2.7% |
3.6% |
4.1% |
| Average cost per active beneficiary of greater than $50,000: number of medicines for other drugs |
11 |
13 |
19 |
20 |
20 |
22 |
| High-cost drugs – share of total drug cost |
15.6% |
17.7% |
19.3% |
27.2% |
27.7% |
30.5% |
| High-cost drugs - share of active beneficiaries |
1.05% |
1.19% |
1.29% |
1.57% |
1.70% |
1.68% |
| High-cost drugs - share of total prescriptions |
0.19% |
0.21% |
0.22% |
0.28% |
0.30% |
0.34% |
Note: This analysis only includes data for beneficiaries that met their deductible and received public reimbursement. These results may be underestimated, as some high-cost drugs are reimbursed through special public drug plan programs that are not captured in the NPDUIS data. The methodology for this analysis has been revised, and as such, historical results may not match those reported in previous editions.
* Average annual drug costs per active beneficiary exceeding $10,000.
† British Columbia, Alberta, Saskatchewan, Manitoba, Ontario, New Brunswick, Nova Scotia, Prince Edward Island, Newfoundland and Labrador, Yukon, and the Non-Insured Health Benefits Program.
‡ Direct-acting antiviral (DAA) drugs used in the treatment of hepatitis C.
Data source: National Prescription Drug Utilization Information System Database, Canadian Institute for Health Information.
Figure 2.8 provides a more detailed breakdown of the share of high-cost drugs by jurisdiction in 2017/18. High-cost drugs account for a greater share of costs in income- and premium-based programs; for example, they make up nearly half of the total drug costs for public plans in Manitoba (49.0%) and British Columbia (43.7%).
Figure 2.8 High-cost drug* share of total drug cost, NPDUIS public drug plans, 2017/18
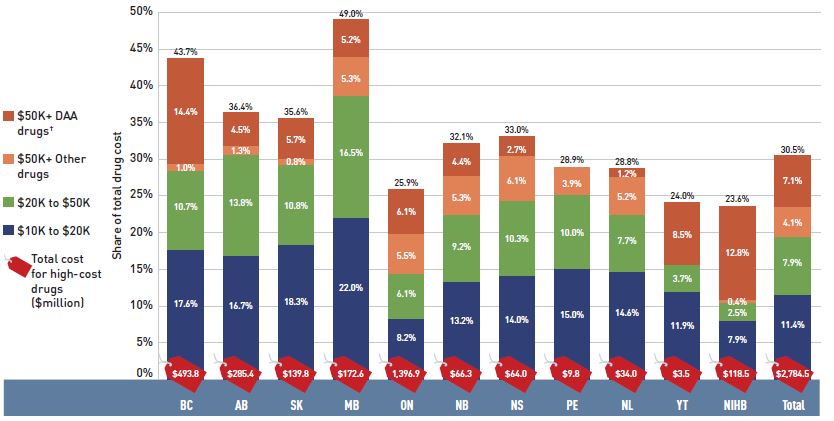
Figure description
This stacked column graph and accompanying table give the share of high-cost drugs for the total drug cost of each NPDUIS public drug plan in 2017/18. The share of high-cost drugs is broken out by average cost per active beneficiary: $10,000‒20,000; $20,000–$50,000, and greater than $50,000. The share of new direct-acting antiviral drugs for hepatitis C is reported separately. Price tags below the bars give the total costs for all high-cost drugs, and the table lists the total share for all high-costs drugs for each jurisdiction.
|
British Columbia |
Alberta |
Saskatchewan |
Manitoba |
Ontario |
New Brunswick |
Nova Scotia |
Prince Edward Island |
Newfoundland and Labrador |
Yukon |
Non-Insured Health Benefits |
Total |
| Total drug cost for all high-cost drugs in millions of dollars |
$493.8 |
$285.4 |
$139.8 |
$172.6 |
$1,396.9 |
$66.3 |
$64.0 |
$9.8 |
$34.0 |
$3.5 |
$118.5 |
$2,784.5 |
| Average cost per beneficiary of $10,000‒20,000: share of total drug cost |
17.6% |
16.7% |
18.3% |
22.0% |
8.2% |
13.2% |
14.0% |
15.0% |
14.6% |
11.9% |
7.9% |
11.4% |
| Average cost per beneficiary of $20,000–$50,000: share of total drug cost |
10.7% |
13.8% |
10.8% |
16.5% |
6.1% |
9.2% |
10.3% |
10.0% |
7.7% |
3.7% |
2.5% |
7.9% |
| Average cost per beneficiary of greater than $50,000: share of total drug cost for direct-acting antiviral drugs |
1.0% |
1.3% |
0.8% |
5.3% |
5.5% |
5.3% |
6.1% |
3.9% |
5.2% |
<0.1% |
0.4% |
4.1% |
| Average cost per beneficiary of greater than $50,000: share of total drug cost for other drugs |
14.4% |
4.5% |
5.7% |
5.2% |
6.1% |
4.4% |
2.7% |
<0.1% |
1.2% |
8.5% |
12.8% |
7.1% |
| High-cost drugs share of total drug cost |
43.7% |
36.4% |
35.6% |
49.0% |
25.9% |
32.1% |
33.0% |
28.9% |
28.8% |
24.0% |
23.6% |
30.5% |
Note: This analysis only includes data for beneficiaries that met their deductible and received public reimbursement. These results may be underestimated, as some high-cost drugs are reimbursed through special public drug plan programs that are not captured in the NPDUIS data.
* Average annual drug costs per active beneficiary exceeding $10,000.
† Direct-acting antiviral (DAA) drugs used in the treatment of hepatitis C.
Data source: National Prescription Drug Utilization Information System Database, Canadian Institute for Health Information.
Table 2.2 reports the 10 highest-cost drugs reimbursed by the NPDUIS public plans in 2017/18 ranked by their average annual drug cost per active beneficiary. Eight of the top 10 drugs had treatment costs exceeding $100,000. Note that although Table 2.2 presents the overall results for all NPDUIS public drug plans, there are significant variations at the individual plan level.
Table 2.2 Top 10 drugs with the highest average annual drug cost per active beneficiary, NPDUIS public drug plans, 2017/18
| Trade name (medicinal ingredient) |
Therapeutic class, ATC level 2 |
Average drug cost per beneficiary† |
| Elaprase (idursulfase) |
Other alimentary tract and metabolism products |
$602,589 |
| Myozyme (alglucosidase alfa) |
Other alimentary tract and metabolism products |
$546,834 |
| Soliris (eculizumab) |
Immunosuppressants |
$442,571 |
| Vpriv (velaglucerase alfa) |
Other alimentary tract and metabolism products |
$364,725 |
| Kalydeco (ivacaftor) |
Other respiratory system products |
$254,480 |
| Remodulin (treprostinil) |
Antithrombotic agents |
$120,271 |
| Prolastin C (alpha 1-proteinase inhibitor) |
Antihemorrhagics |
$101,775 |
| Zavesca (miglustat) |
Other alimentary tract and metabolism products |
$106,469 |
| Pheburane (sodium phenylbutyrate) |
Other alimentary tract and metabolism products |
$74,918 |
| Somavert (pegvisomant) |
Pituitary and hypothalamic hormones and analogues |
$74,854 |
Note: This analysis only includes data for beneficiaries that met their deductible and received public reimbursement. This list of drugs does not include high-cost drugs reimbursed through special programs.
* British Columbia, Alberta, Saskatchewan, Manitoba, Ontario, New Brunswick, Nova Scotia, Prince Edward Island, Newfoundland and Labrador, Yukon, and the Non-Insured Health Benefits Program.
† Represents the total drug cost divided by the total number of beneficiaries and, thus, may include beneficiaries with incomplete treatment costs.
Data source: National Prescription Drug Utilization Information System Database, Canadian Institute for Health Information.
Over the past five years, biologic medicines have captured an increasing share of the total drug costs for the NPDUIS public plans, reaching a new high of 26.2% in 2017/18. While growth has slowed over the past three years, total costs climbed to $2.4 billion in 2017/18, an increase of $0.7 billion since 2013/14. The top 10 biologics accounted for 18.3% of the total NPDUIS drug costs in 2017/18, with the top four drugs—Remicade, Humira, Elyea, and Lucentis—responsible for 12.8% of the total.
Figure 2.9 reports on trends in the biologic share of total drug costs for the NPDUIS public drug plans, along with the growth in drug costs for this market segment and the current list of top 10 biologic drugs.
Alberta and Manitoba had the highest levels of biologic-related costs relative to total drug costs in 2017/18 (35.1% and 34.5%, respectively); while Saskatchewan and Alberta had the highest rates of growth (13.8% and 10.3%, respectively). Variations among plans may be driven by differing plan designs, eligibility for reimbursement, and the disease profiles of the population, among other considerations.
Figure 2.9 Biologic share of total drug costs, NPDUIS public drug plans, 2013/14 to 2017/18
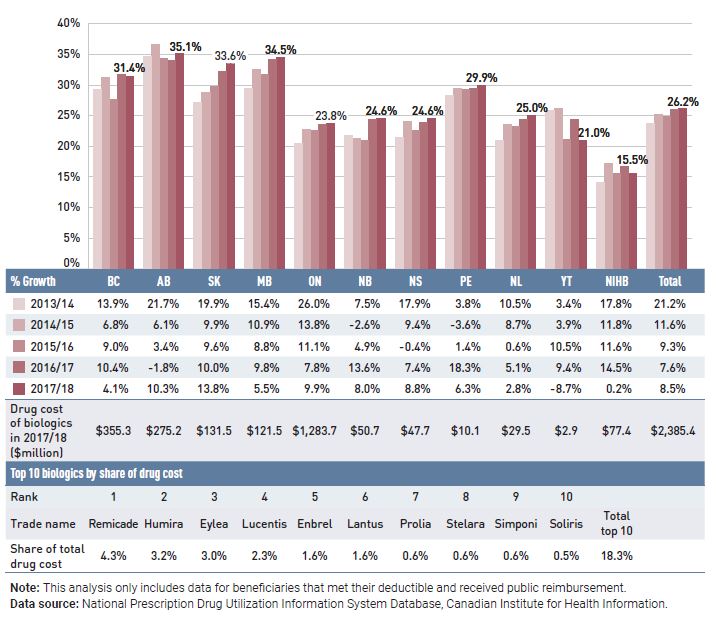
Figure description
This column graph gives the biologic drug share of the total drug costs for the NPDUIS public drug plans from 2013/14 to 2017/18. There are three tables below the bar graph: the first shows the percent year-over-year growth in biologic drug costs over five years for each NPDUIS plan; the second gives the total cost of biologics in millions of dollars for 2017/18 by plan; and the third lists the top ten biologics by share of drug cost for all plans in 2017/18.
| |
British Columbia |
Alberta |
Saskatchewan |
Manitoba |
Ontario |
New Brunswick |
Nova Scotia |
Prince Edward Island |
Newfoundland and Labrador |
Yukon |
Non-Insured Health Benefits |
Total |
|
| Biologic share of total drug cost by year |
| 2013/14 |
29.3% |
34.6% |
27.2% |
29.4% |
20.5% |
21.8% |
21.5% |
28.3% |
21.0% |
25.9% |
14.1% |
23.7% |
|
| 2014/15 |
31.2% |
36.6% |
28.8% |
32.5% |
22.8% |
21.2% |
24.0% |
29.4% |
23.5% |
26.1% |
17.2% |
25.2% |
|
| 2015/16 |
27.6% |
34.3% |
29.8% |
31.7% |
22.6% |
21.0% |
22.6% |
29.3% |
23.3% |
21.1% |
15.6% |
24.8% |
|
| 2016/17 |
31.8% |
34.0% |
32.2% |
34.2% |
23.6% |
24.4% |
23.9% |
29.5% |
24.4% |
24.4% |
16.7% |
26.0% |
|
| 2017/18 |
31.4% |
35.1% |
33.6% |
34.5% |
23.8% |
24.6% |
24.6% |
29.9% |
25.0% |
21.0% |
15.5% |
26.2% |
|
| Year-over-year growth |
| 2013/14 |
13.9% |
21.7% |
19.9% |
15.4% |
26.0% |
7.5% |
17.9% |
3.8% |
10.5% |
3.4% |
17.8% |
21.2% |
|
| 2014/15 |
6.8% |
6.1% |
9.9% |
10.9% |
13.8% |
-2.6% |
9.4% |
-3.6% |
8.7% |
3.9% |
11.8% |
11.6% |
|
| 2015/16 |
9.0% |
3.4% |
9.6% |
8.8% |
11.1% |
4.9% |
-0.4% |
1.4% |
0.6% |
10.5% |
11.6% |
9.3% |
|
| 2016/17 |
10.4% |
-1.8% |
10.0% |
9.8% |
7.8% |
13.6% |
7.4% |
18.3% |
5.1% |
9.4% |
14.5% |
7.6% |
|
| 2017/18 |
4.1% |
10.3% |
13.8% |
5.5% |
9.9% |
8.0% |
8.8% |
6.3% |
2.8% |
-8.7% |
0.2% |
8.5% |
|
| Drug cost of biologics in 2017/18 ($ million) |
$355.3 |
$275.2 |
$131.5 |
$121.5 |
$1,283.7 |
$50.7 |
$47.7 |
$10.1 |
$29.5 |
$2.9 |
$77.4 |
$2,385.4 |
|
Top 10 biologics by share of drug cost
Rank |
1 |
2 |
3 |
4 |
5 |
6 |
7 |
8 |
9 |
10 |
|
| Trade name |
Remicade |
Humira |
Eylea |
Lucentis |
Enbrel |
Lantus |
Prolia |
Stelara |
Simponi |
Soliris |
Total top 10 |
| Share of total drug cost |
4.3% |
3.2% |
3.0% |
2.3% |
1.6% |
1.6% |
0.6% |
0.6% |
0.6% |
0.5% |
18.3% |
Note: This analysis only includes data for beneficiaries that met their deductible and received public reimbursement.
Data source: National Prescription Drug Utilization Information System Database, Canadian Institute for Health Information.
An analysis by therapeutic class suggests that over two thirds of the total drug costs in 2017/18 were concentrated in a few classes. Antineoplastic and immunomodulating agents, which had the third highest total drug cost share (16.2%) in 2012/13, had the highest share (22.6%) in 2017/18. Nervous system drugs comprised the second highest share of costs, the same as in 2012/13, although they represented a lower share of the total cost (dropping from 17.8% in 2012/13 to 13.4% in 2017/18). Cardiovascular system drugs, which, like drugs for the nervous system, include relatively low-cost drugs used by a large number of active beneficiaries, also represented a lower share of costs in 2017/18; while antineoplastic and immunomodulating agents, which are high-cost drugs generally used by a small number of beneficiaries, had a notably increased drug cost share.
Figure 2.10 Top 10 ATC* level 1 therapeutic classes by share of total drug costs, NPDUIS public drug plans†, 2012/13 and 2017/18
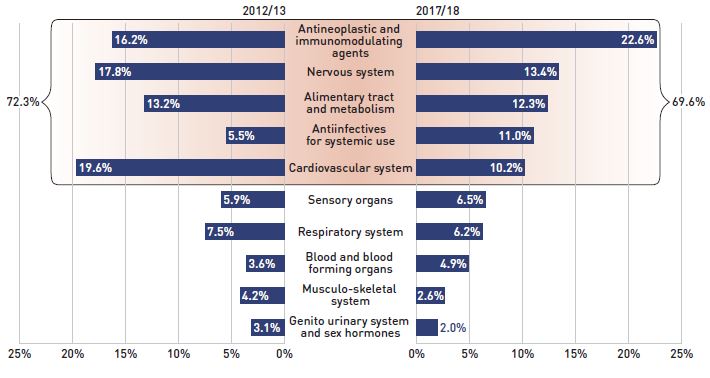
Figure description
This butterfly-shaped figure is composed of two bar graphs depicting the share of total drug costs in the NPDUIS public drug plans for each of the top 10 therapeutic classes in level 1 of the Anatomical Therapeutic Chemical Classification System. The shares for 2012/13 are shown on the left and shares for 2017/18 on the right. The top five classes are highlighted, illustrating that 72.3% of costs in 2012/13 and 69.6% of costs in 2017/18 were concentrated in these classes.
| Top 10 therapeutic classes |
2012/13 |
2017/18 |
| Antineoplastic and immunomodulating agents |
16.2% |
22.6% |
| Nervous system |
17.8% |
13.4% |
| Alimentary tract and metabolism |
13.2% |
12.3% |
| Antiinfectives for systemic use |
5.5% |
11.0% |
| Cardiovascular system |
19.6% |
10.2% |
| Sensory organs |
5.9% |
6.5% |
| Respiratory system |
7.5% |
6.2% |
| Blood and blood forming organs |
3.6% |
4.9% |
| Musculo-skeletal system |
4.2% |
2.6% |
| Genito urinary system and sex hormones |
3.1% |
2.0% |
Note: This analysis only includes data for beneficiaries that met their deductible and received public reimbursement.
Results for Yukon were only included for 2017/18.
* Anatomical Therapeutic Chemical (ATC) classification system maintained by the World Health Organization.
† British Columbia, Alberta, Saskatchewan, Manitoba, Ontario, New Brunswick, Nova Scotia, Prince Edward Island, Newfoundland and Labrador, Yukon, and the Non-Insured Health Benefits Program.
Data source: National Prescription Drug Utilization Information System Database, Canadian Institute for Health Information.
3. The Drivers of Dispensing Costs, 2016/17 to 2017/18
The moderate rate of change in dispensing costs in 2017/18 was markedly lower than the growth in drug costs, continuing the trend of slower growth observed over the last few years. The combined cost increase from smaller prescription sizes and decrease in the volume of units dispensed shaped the overall change in dispensing costs.
Like drug costs, changes in dispensing costs are driven by a number of “push” and “pull” effects. The net effect of these opposing forces yields the overall rate of change.
Demographic effect: Changes in the number of active beneficiaries, as well as shifts in the age or gender distribution.
Drug volume effect: Changes in the number of units dispensed to patients.
Fee effect: Changes in the average dispensing fee per prescription.
Prescription size effect: Changes in the number of units dispensed per prescription.
In this section, a comprehensive cost driver analysis is used to determine how much public plan dispensing costs would have changed between 2016/17 and 2017/18 if only one factor (e.g., the average dispensing fee) was considered while all the others remained the same.Footnote V
Figure 3.1 provides insight into the pressures driving changes in dispensing costs from 2012/13 to 2017/18. Excluding the impact of OHIP+, the demographic effect declined for the third year, pushing costs up by 1.4%, which indicates a slower growth in the number of active beneficiaries. In contrast, the upward pressure from the prescription size effect, which had been declining in recent years, increased from 0.8% in 2016/17 to a more significant push of 2.5% in 2017/18. Changes in the average dispensing fee per prescription decreased dispensing costs by 0.5% in 2017/18; while the volume effect shrank from a fairly steady increase in previous years to pull costs down by 1.1% in 2017/18, reflecting a slower growth in the number of units dispensed to patients.
Figure 3.1 Dispensing cost drivers, NPDUIS public plans*, 2012/13 to 2017/18
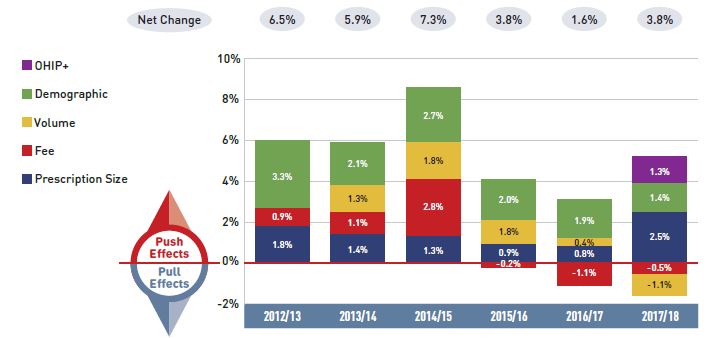
Figure description
This column graph describes the key factors or effects that impacted the rates of change in dispensing costs across all NPDUIS public drug plans for each year from 2012/13 to 2017/18. Each column is broken out to give the positive or negative contribution of each effect: demographic; volume; fee; and prescription size. For 2017/18, the effects of the recent Ontario Health Insurance Plan Plus (OHIP+) program are shown separately. The net change is given for each year.
| |
2012/13 |
2013/14 |
2014/15 |
2015/16 |
2016/17 |
2017/18 |
| OHIP+ |
– |
– |
– |
– |
– |
1.3% |
| Demographic |
3.3% |
2.1% |
2.7% |
2.0% |
1.9% |
1.4% |
| Volume |
0.0% |
1.3% |
1.8% |
1.8% |
0.4% |
-1.1% |
| Fee |
0.9% |
1.1% |
2.8% |
-0.2% |
-1.1% |
-0.5% |
| Prescription size |
1.8% |
1.4% |
1.3% |
0.9% |
0.8% |
2.5% |
| Net change |
6.5% |
5.9% |
7.3% |
3.8% |
1.6% |
3.8% |
Note: Values may not add to totals due to rounding and the cross effect.
In Ontario, the long-term care (LTC) prescriptions were excluded from the dispensing costs analysis, as their dispensing patterns may differ from those of the general beneficiary population. The LTC sub-program contributed less than 0.1% to the growth of dispensing costs to the total NPDUIS public plans. This change in approach only appears in 2017/18.
* British Columbia, Alberta, Saskatchewan, Manitoba, Ontario, New Brunswick, Nova Scotia, Prince Edward Island, Newfoundland and Labrador, Yukon, and the Non-Insured Health Benefits Program.
Data source: National Prescription Drug Utilization Information System Database, Canadian Institute for Health Information.
Dispensing costs in the NPDUIS public plans increased by 3.8% or $86.1 million in 2017/18, reaching a total of $2.3 billion. The 3.8% growth rate was double that of the previous year, and similar to the increase in 2015/16.
Ontario’s new OHIP+ program, introduced in the last quarter of the 2017/18 fiscal year, added $28.8 million to the dispensing costs, pushing costs upward by 2.4% in Ontario and by 1.3% in all the NPDUIS public drug plans for the entire year.
The overall rate of change in dispensing costs varied widely among individual plans (Figure 3.2), from a high of 7.6% in Alberta to a low of -6.2% in Manitoba. The high growth in Alberta was driven by a steady increase in both the demographic and prescription size effects. In Manitoba, the reduction in dispensing costs resulted mainly from a drop in the fee effect following the introduction of a cap on dispensing fees in August 2017.
In other jurisdictions, the overall growth in dispensing costs was more moderate. In Ontario, the long-term care (LTC) prescriptions were separated out from this cost drivers analysis, as they may not have a typical dispensing frequency, e.g., significantly higher number of prescriptions per patient than in the general beneficiary population, due to the more specialized needs of their patients. LTC patients only accounted for a small portion of all recipients, contributing less than 0.1% to the 5.4% rate of growth in Ontario dispensing cost of 2017/18.
Figure 3.2 Rates of change in dispensing costs, NPDUIS public drug plans, 2016/17 to 2017/18
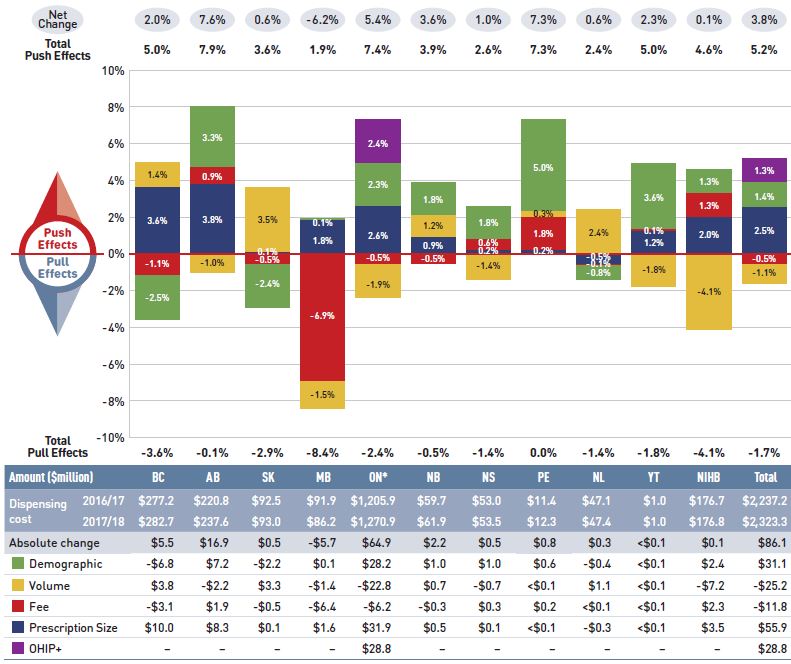
Figure description
This column graph and table describe the key factors or effects that impacted the rates of change in dispensing costs for each of the NPDUIS public drug plans from 2016/17 to 2017/18. Each column is broken out to give the positive or negative contribution of each effect: demographic; volume; fee; and prescription size. The effects of the recent Ontario Health Insurance Plan Plus (OHIP+) program are shown separately. The total positive push effect, negative pull effect, and net change are given for each year.
| |
British Columbia |
Alberta |
Saskatchewan |
Manitoba |
Ontario |
New Brunswick |
Nova Scotia |
Prince Edward Island |
Newfoundland and Labrador |
Yukon |
Non-Insured Health Benefits |
Total |
| Demographic |
-2.5% |
3.3% |
-2.4% |
0.1% |
2.3% |
1.8% |
1.8% |
5.0% |
-0.8% |
3.6% |
1.3% |
1.4% |
| Volume |
1.4% |
-1.0% |
3.5% |
-1.5% |
-1.9% |
1.2% |
-1.4% |
0.3% |
2.4% |
-1.8% |
-4.1% |
-1.1% |
| Fee |
-1.1% |
0.9% |
-0.5% |
-6.9% |
-0.5% |
-0.5% |
0.6% |
1.8% |
-0.1% |
0.1% |
1.3% |
-0.5% |
| Prescription size |
3.6% |
3.8% |
0.1% |
1.8% |
2.6% |
0.9% |
0.2% |
0.2% |
-0.5% |
1.2% |
2.0% |
2.5% |
| OHIP+ |
– |
– |
– |
– |
2.4% |
– |
– |
– |
– |
– |
– |
1.3% |
| Total push effect |
5.0% |
7.9% |
3.6% |
1.9% |
7.4% |
3.9% |
2.6% |
7.3% |
2.4% |
5.0% |
4.6% |
5.2% |
| Total pull effect |
-3.6% |
-1.0% |
-2.9% |
-8.4% |
-2.4% |
-0.5% |
-1.4% |
0.0% |
-1.4% |
-1.8% |
-4.1% |
-1.7% |
| Net change |
2.0% |
7.6% |
0.6% |
-6.2% |
5.4% |
3.6% |
1.0% |
7.3% |
0.6% |
2.3% |
0.1% |
3.8% |
An accompanying table gives the corresponding changes in millions of dollars, as well as the total dispensing costs in 2016/17 and 2017/18 and the absolute change for each plan.
| |
British Columbia |
Alberta |
Saskatchewan |
Manitoba |
Ontario |
New Brunswick |
Nova Scotia |
Prince Edward Island |
Newfoundland and Labrador |
Yukon |
Non-Insured Health Benefits |
Total |
| Dispensing cost 2016/17 |
$277.2 |
$220.8 |
$92.5 |
$91.9 |
$1,205.9 |
$59.7 |
$53.0 |
$11.4 |
$47.1 |
$1.0 |
$176.7 |
$2,237.2 |
| Dispensing cost 2017/18 |
$282.7 |
$237.6 |
$93.0 |
$86.2 |
$1,270.9 |
$61.9 |
$53.5 |
$12.3 |
$47.4 |
$1.0 |
$176.8 |
$2,323.3 |
| Absolute change |
$5.5 |
$16.9 |
$0.5 |
-$5.7 |
$64.9 |
$2.2 |
$0.5 |
$0.8 |
$0.3 |
$0.0 |
$0.1 |
$86.1 |
| Demographic |
-$6.8 |
$7.2 |
-$2.2 |
$0.1 |
$28.2 |
$1.0 |
$1.0 |
$0.6 |
-$0.4 |
$0.0 |
$2.4 |
$31.1 |
| Volume |
$3.8 |
-$2.2 |
$3.3 |
-$1.4 |
-$22.8 |
$0.7 |
-$0.7 |
$0.0 |
$1.1 |
$0.0 |
-$7.2 |
-$25.2 |
| Fee |
-$3.1 |
$1.9 |
-$0.5 |
-$6.4 |
-$6.2 |
-$0.3 |
$0.3 |
$0.2 |
$0.0 |
$0.0 |
$2.3 |
-$11.8 |
| Prescription size |
$10.0 |
$8.3 |
$0.1 |
$1.6 |
$31.9 |
$0.5 |
$0.1 |
$0.0 |
-$0.3 |
$0.0 |
$3.5 |
$55.9 |
| OHIP+ |
– |
– |
– |
– |
$28.8 |
– |
– |
– |
– |
– |
– |
$28.8 |
Note: Values may not add to totals due to rounding and the cross effect.
* In Ontario, the long-term care (LTC) prescriptions were excluded from the dispensing costs analysis, as their dispensing patterns may differ from those of the general beneficiary population. The LTC sub-program contributed less than 0.1% to the total increase in dispensing costs for all NPDUIS public plans.
Data source: National Prescription Drug Utilization Information System Database, Canadian Institute for Health Information.
The contribution of the fee effect, which reflects changes in the average dispensing fee per prescription, is directly related to the individual reimbursement policy of each public drug plan.
In 2017/18, the rates of change in the average dispensing fee per prescription varied across NPDUIS drug plans, with most of the plans showing modest changes ranging from -1.1% to 1.8%, while Manitoba had a relatively large drop of 6.9% due to its recent fee-capping policy initiative. Over the past five years, Prince Edward Island, Alberta, and Saskatchewan have had relatively high growth in fees, with compound annual growth rates of 2.2%, 2.1%, and 1.5%, respectively.
Table 3.1 reports the average dispensing fee per prescription from 2013/14 to 2017/18, along with the rate of growth between 2016/17 and 2017/18 and the compound annual growth rate for the entire period. The results are an average across all prescriptions and include a range of dispensing fees. An overview of the dispensing fee policies of the NPDUIS public drug plans is available in the Reference Documents section of the NPDUIS Analytical Studies page on the PMPRB website.
Table 3.1 Average dispensing fee per prescription, NPDUIS public drug plans, 2013/14 to 2017/18
| Jurisdiction |
2013/14 |
2014/15 |
2015/16 |
2016/17 |
2017/18 |
Growth rate 2016/17 to 2017/18 |
CAGR*, 2013/4 to 2017/18 |
| British Columbia |
$7.40 |
$7.35 |
$7.30 |
$7.26 |
$7.18 |
-1.1% |
-0.8% |
| Alberta |
$13.29 |
$14.13 |
$14.29 |
$14.33 |
$14.45 |
0.9% |
2.1% |
| Saskatchewan |
$10.30 |
$10.82 |
$10.91 |
$10.97 |
$10.92 |
-0.5% |
1.5% |
| Manitoba |
$8.97 |
$9.19 |
$9.35 |
$9.48 |
$8.82 |
-6.9% |
-0.4% |
| Ontario† |
$7.41 |
$7.72 |
$7.72 |
$7.59 |
$7.55 |
-0.5% |
0.5% |
| New Brunswick |
$10.36 |
$10.41 |
$10.54 |
$10.54 |
$10.48 |
-0.5% |
0.3% |
| Nova Scotia |
$11.49 |
$11.31 |
$11.19 |
$11.25 |
$11.32 |
0.6% |
-0.4% |
| Prince Edward Island |
$10.31 |
$10.21 |
$10.93 |
$11.03 |
$11.23 |
1.8% |
2.2% |
| Newfoundland and Labrador |
$12.20 |
$12.19 |
$12.34 |
$12.39 |
$12.38 |
-0.1% |
0.4% |
| Yukon |
$5.81 |
$5.77 |
$5.76 |
$5.80 |
$5.81 |
0.1% |
0.0% |
| NIHB |
- |
$8.57 |
$8.60 |
$8.74 |
$8.86 |
1.3% |
1.1% |
Note: This analysis only includes data for beneficiaries that met their deductible and received public reimbursement.
* Compound annual growth rate.
† Ontario long-term care (LTC) sub-plan prescriptions were excluded from all years of this analysis, as their dispensing patterns may differ from those of the general beneficiary population.
The addition of Ontario’s OHIP+ program, implemented in the last quarter of 2017/18, was also excluded from this analysis to allow for comparison with historical results.
Data source: National Prescription Drug Utilization Information System Database, Canadian Institute for Health Information.
Various plans have specific policies in place related to fill frequency and compensation. The average dispensing fee per prescription is also related to prescription size: plans with lower average dispensing fees generally reimburse prescriptions with shorter days’ supply and vice versa. British Columbia, Manitoba, Ontario, and the NIHB, which had some of the lowest dispensing fees in 2017/18, generally reimbursed prescriptions with relatively small average sizes. Decreases in the average days’ supply per prescription can exert an upward pressure on dispensing costs, as a greater number of prescriptions are required to dispense the same volume of drugs.
The results for the average days’ supply per prescription suggest that prescription size was either stable or declined slightly in most public drug plans from 2013/14 to 2017/18. The exception was Saskatchewan, where the average days’ supply increased. British Columbia and Alberta had the largest proportional decreases in average prescription size since 2016/17, at -5.1% and -3.4%, respectively.
Figure 3.3 depicts the trend in average days’ supply per prescription from 2013/14 to 2017/18. The results represent the average across all prescriptions for oral solid formulations and encompass brand-name and generic medicines for both acute and maintenance therapies.
Figure 3.3 Average days’ supply per prescription, NPDUIS public drug plans, 2013/14 to 2017/18
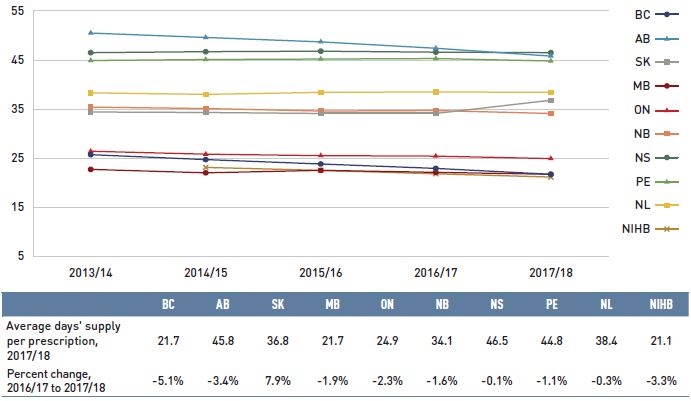
Figure description
This line graph shows the trend in average days’ supply per prescription from 2013/14 to 2017/18 for each NPDUIS public drug plan. A table below the graph shows the average days’ supply per prescription for 2017/18 and the percent change from 2016/17 to 2017/18.
| |
2013/14 |
2014/15 |
2015/16 |
2016/17 |
2017/18 |
Percent change, 2016/17 to 2017/18 |
| British Columbia |
25.7 |
24.7 |
23.8 |
22.9 |
21.7 |
-5.1% |
| Alberta |
50.5 |
49.6 |
48.7 |
47.4 |
45.8 |
-3.4% |
| Saskatchewan |
34.4 |
34.3 |
34.1 |
34.1 |
36.8 |
7.9% |
| Manitoba |
22.7 |
22.0 |
22.5 |
22.1 |
21.7 |
-1.9% |
| Ontario |
26.4 |
25.8 |
25.5 |
25.4 |
24.9 |
-2.3% |
| New Brunswick |
35.4 |
35.1 |
34.6 |
34.7 |
34.1 |
-1.6% |
| Nova Scotia |
46.5 |
46.7 |
46.8 |
46.6 |
46.5 |
-0.1% |
| Prince Edward Island |
44.9 |
45.1 |
45.2 |
45.3 |
44.8 |
-1.1% |
| Newfoundland and Labrador |
38.3 |
38.0 |
38.4 |
38.5 |
38.4 |
-0.3% |
| Non-Insured Health Benefits |
– |
23.1 |
22.5 |
21.8 |
21.1 |
-3.3% |
Note: This analysis only includes data for beneficiaries that met their deductible and received public reimbursement.
The analysis was limited to data for oral solid formulations. Yukon is not reported due to data limitations.
Data source: National Prescription Drug Utilization Information System Database, Canadian Institute for Health Information.
Although the average days’ supply and dispensing fee per prescription are useful measures for comparison, the roster of medicines covered by each plan also factors into the average dispensing cost. Comparing the dispensing costs for the same suite of medicines can provide greater insight into the differences between plans.
Figure 3.4 compares the dispensing costs across jurisdictions for the 18 generic medicines reduced to 18% of their brand-name reference price through the pCPA. Dispensing costs for one million tablets of each medicine are given for two fiscal years: 2013/14 and 2017/18. These medicines collectively accounted for 18.7% and 20.4% of the total NPDUIS public drug plan dispensing costs in 2013/14 and 2017/18, respectively.
Dispensing costs between 2013/14 and 2017/18 increased in all provinces except Saskatchewan, Manitoba, and Nova Scotia. The NIHB had the highest dispensing costs in 2017/18 at $245,000, taking over the top spot from Saskatchewan, which totalled $281,000 in 2013/14. The highest rates of increase were observed in Alberta and Prince Edward Island, while Saskatchewan and Manitoba had the largest decreases.
While the same drugs were studied across all plans, the disease profile of the beneficiary populations and the type of therapy for which the drugs were prescribed (acute or maintenance) influenced the average days’ supply and, hence, the overall dispensing costs for each plan.
Figure 3.4 Dispensing costs ($thousand) for one million tablets, pCPA 18% generic medicines*, NPDUIS public drug plans, 2013/14 and 2017/18
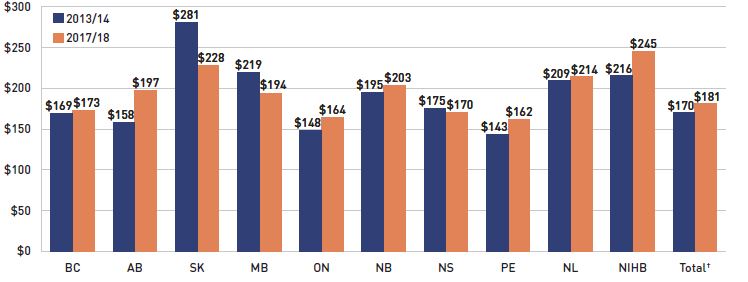
Figure description
This bar graph shows the dispensing cost in thousands of dollars for one million tablets of the generic medicines reduced to 18% of their brand reference price through recent pan-Canadian Pharmaceutical Alliance policy initiative. The dispensing costs are given for 2013/14 and 2017/18 for each NPDUIS public drug plan, as well as total results for all plans.
| |
British Columbia |
Alberta |
Saskatchewan |
Manitoba |
Ontario |
New Brunswick |
Nova Scotia |
Prince Edward Island |
Newfoundland and Labrador |
Non-Insured Health Benefits |
Total† |
| 2013/14 |
$169 |
$158 |
$281 |
$219 |
$148 |
$195 |
$175 |
$143 |
$209 |
$216 |
$170 |
| 2017/18 |
$173 |
$197 |
$228 |
$194 |
$164 |
$203 |
$170 |
$162 |
$214 |
$245 |
$181 |
Note: Long-term care homes were excluded from this analysis, as they may not have a typical dispensing frequency due to the more specialized needs of their patients. The following sub-plans were not included in the analysis: BC: Permanent Residents of Licensed Residential Care Facilities; MB: Personal Home Care/Nursing Homes; NB: Individuals in Licensed Residential Facilities, Nursing Home Residents; ON: Long Term Care, Home Care and Homes for Special Care.
Yukon is not reported due to data limitations.
* Subject to pCPA policies that reduced the prices of these medicines to 18% of their brand-name reference price: atorvastatin, ramipril, venlafaxine, amlodipine, omeprazole, rabeprazole, rosuvastatin, pantoprazole, citalopram, simvastatin, clopidogrel, gabapentin, metformin, olanzapine, donepezil, ezetimibe, quetiapine, and zopiclone.
† Total results for the drug plans captured in this figure.
Data source: National Prescription Drug Utilization Information System Database, Canadian Institute for Health Information.
Appendix A: Drug Reviews and Approvals
In Canada, Health Canada, the Patented Medicine Prices Review Board (PMPRB), and the Canadian Agency for Drugs and Technologies in Health (CADTH) are responsible for drug approvals, price reviews, and health technology assessments, respectively. This appendix provides an overview of recent trends in drug reviews and approvals.Footnote VI
Health Canada
Health Canada grants the authority to market a drug in Canada by issuing a Notice of Compliance (NOC) once it has met the regulatory requirements for safety, efficacy, and quality. In 2017, Health Canada issued NOCs for 36 new active substances: 12 biologics and 24 small molecule pharmaceuticals. There was a notable increase in the number of biologics, from 3 and 5 in 2014 and 2015, respectively, to 12 in 2017 (Figure A1).Footnote VII
Figure A1 New active substances approved by Health Canada, 2013 to 2017
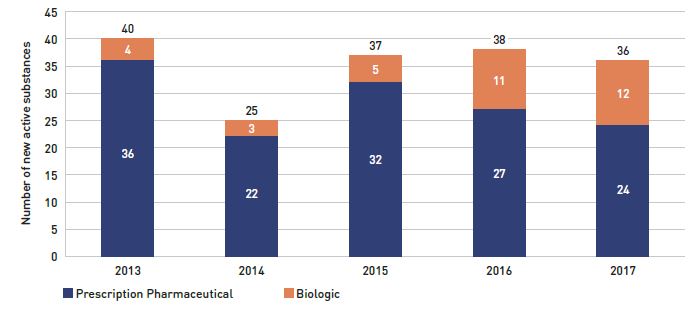
Figure description
This stacked column graph shows the number of new active substances approved by Health Canada from 2013 to 2017. The number of prescription pharmaceuticals and biologics are given for each year.
Year |
Prescription pharmaceutical |
Biologic |
Total |
| 2013 |
36 |
4 |
40 |
| 2014 |
22 |
3 |
25 |
| 2015 |
32 |
5 |
37 |
| 2016 |
27 |
11 |
38 |
| 2017 |
24 |
12 |
36 |
Note: “Prescription pharmaceutical” and “biologic” are terms used to define product types when submitting a Notice of Compliance (NOC) to Health Canada.
Data source: Notice of Compliance Database, Health Canada.
Patented Medicine Prices Review Board
The PMPRB reviews the factory-gate prices of patented medicines sold in Canada and ensures that they are not excessive. As part of the price review process, the PMPRB’s Human Drug Advisory Panel (HDAP) evaluates each new medicine and assigns a recommended level of therapeutic improvement.
The PMPRB completed scientific reviews for 136 of the 176 medicines approved by Heath Canada between 2013 and 2017. Over this five-year period, only 11% were classified in the Substantial Improvement or Breakthrough categories. Of the rest, 71% demonstrated Slight or No Improvement over existing therapies, while 18% were classified in the Moderate Improvement category (Figure A2).
Figure A2 New medicines reviewed by the Patented Medicine Prices Review Board by level of therapeutic improvement, 2013 to 2017*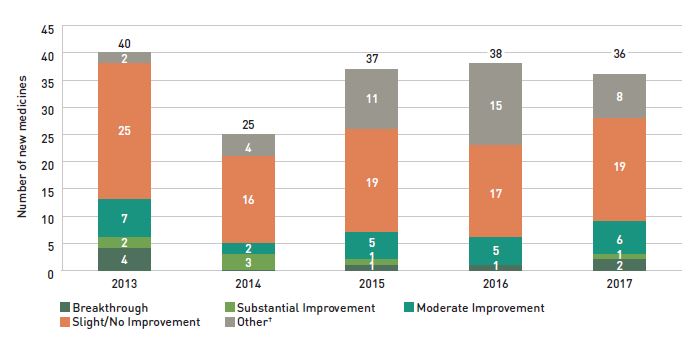
Figure description
This stacked column graph gives the distribution of new medicines reviewed by the Patented Medicine Prices Review Board from 2013 to 2017 by their assessed level of therapeutic improvement.
Year |
Breakthrough |
Substantial Improvement |
Moderate Improvement |
Slight or No Improvement |
Other† |
Total |
| 2013 |
4 |
2 |
7 |
25 |
2 |
40 |
| 2014 |
0 |
3 |
2 |
16 |
4 |
25 |
| 2015 |
1 |
1 |
5 |
19 |
11 |
37 |
| 2016 |
1 |
0 |
5 |
17 |
15 |
38 |
| 2017 |
2 |
1 |
6 |
19 |
8 |
36 |
Note: Medicines reviewed by the PMPRB prior to the implementation of the 2010 Guidelines have been merged as follows: category 2 medicines are included in the Breakthrough category; category 1 medicines are included in the Slight/No Improvement category; and category 3 medicines are included in the Moderate Improvement category.
* The year of reporting reflects the year in which the Notice of Compliance was issued (Figure A1) rather than the year that the PMPRB conducted its price review.
† New medicines not reported to the PMPRB as of the 2017 Annual Report.
Data source: Notice of Compliance Database, Health Canada; Patented Medicine Prices Review Board (PMPRB).
Canadian Agency for Drugs and Technologies in Health
CADTH’s Common Drug Review (CDR) provides reimbursement recommendations and advice to Canada’s publicly funded drug plans (except for Quebec) based on an evaluation of the clinical, economic, and patient evidence of drugs marketed in Canada. The jurisdictions take these recommendations under advisement when making formulary listing decisions and in price negotiations.
Figure A3 summarizes the CDR recommendations for fiscal years 2013/14 to 2017/18.Footnote VIII The total number of CDR recommendations dropped to 31 in 2017/18, following an increase from 34 in 2013/14 to 51 in 2016/17. All the recommendations made in 2017/18 were positive: 30 medicines were recommended as “reimburse with clinical criteria and/or conditions” and one as “reimburse”, while none received a “do not reimburse” recommendation.
As of April 1, 2016, CADTH no longer accepts confidential drug prices, as the submitted prices are disclosed in the recommendations and reports.
Figure A3 Common Drug Review reimbursement recommendations, 2012/13 to 2017/18
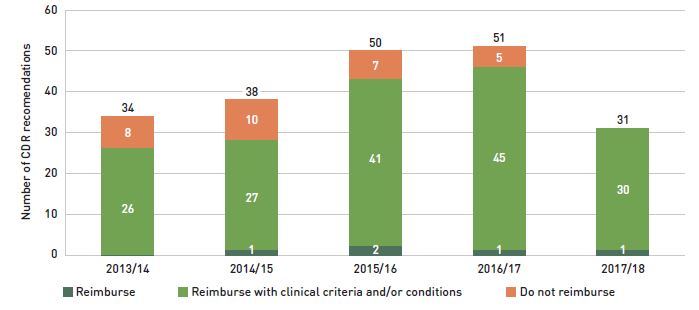
Figure description
The column graph shows the total number of Common Drug Review reimbursement recommendations from 2013/14 to 2017/18 broken out by category of recommendation.
Year |
Reimburse |
Reimburse with clinical criteria and/or conditions |
Do not reimburse |
Total |
| 2013/14 |
0 |
26 |
8 |
34 |
| 2014/15 |
1 |
27 |
10 |
38 |
| 2015/16 |
2 |
41 |
7 |
50 |
| 2016/17 |
1 |
45 |
5 |
51 |
| 2017/18 |
1 |
30 |
0 |
31 |
Note: Drugs may have multiple recommendations if they are reviewed for more than one indication.
CADTH currently uses three possible recommendation categories to guide the reimbursement decisions of participating jurisdictions. For this analysis, “Reimburse with clinical criteria and/or conditions” includes recommendations completed prior to May 2016 for “List with clinical criteria and/or conditions,” “List in a similar manner to other drugs in class,” and “Do not list at submitted price”. “Reimburse” is equivalent to the previous “List” category, and likewise, “Do not reimburse” corresponds to “Do not list”.
Data source: CADTH Common Drug Review Reports.
Appendix B: Distribution of New Patients on Select DMARDs by Jurisdiction
Figure B1 presents the distribution of new public drug plan patients on select disease-modifying antirheumatic drugs (DMARDs) by NPDUIS jurisdiction following the entry of Inflectra into the market.
Variations among plans may be driven by differing plan designs, eligibility for reimbursement, and the demographic and disease profiles of the beneficiary populations, among other considerations.
Figure B1 Distribution of new public drug plan patients on select disease-modifying antirheumatic drugs (DMARDs) by jurisdiction, 2017/18
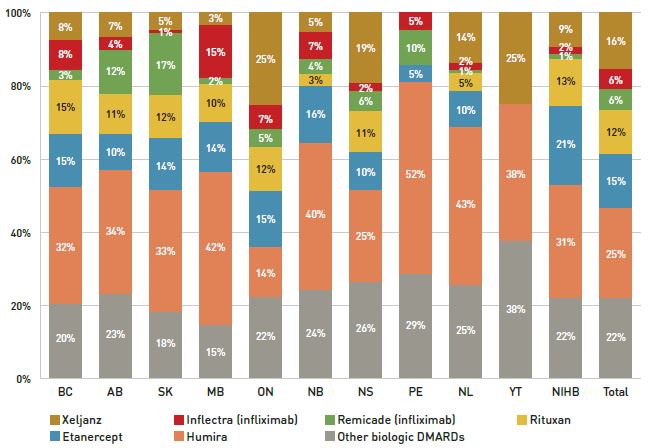
Figure description
A stacked bar graph breaks down the distribution of new patients started on a non-conventional disease-modifying antirheumatic for each of the NPDUIS public plans in 2017/18. The distribution is also given for the total across all plans.
| |
Xeljanz |
Inflectra (infliximab) |
Remicade (infliximab) |
Rituxan |
Etanercept |
Humira |
Other biologic DMARDs |
| British Columbia |
8% |
8% |
3% |
15% |
15% |
32% |
20% |
| Alberta |
7% |
4% |
12% |
11% |
10% |
34% |
23% |
| Saskatchewan |
5% |
1% |
17% |
12% |
14% |
33% |
18% |
| Manitoba |
3% |
15% |
2% |
10% |
14% |
42% |
15% |
| Ontario |
25% |
7% |
5% |
12% |
15% |
14% |
22% |
| New Brunswick |
5% |
7% |
4% |
3% |
16% |
40% |
24% |
| Nova Scotia |
19% |
2% |
6% |
11% |
10% |
25% |
26% |
| Prince Edward Island |
- |
5% |
10% |
- |
5% |
52% |
29% |
| Newfoundland and Labrador |
14% |
2% |
1% |
5% |
10% |
43% |
25% |
| Yukon |
25% |
- |
- |
- |
- |
38% |
38% |
| Non-Insured Health Benefits |
9% |
2% |
1% |
13% |
21% |
31% |
22% |
| All plans |
16% |
6% |
6% |
12% |
15% |
25% |
22% |
Note: Other biologic DMARDs included Simponi, Orencia, Actemra and Cimzia.
Results do not distinguish between use for rheumatoid arthritis and for other indications.
Totals may not add to 100% due to rounding.
Data source: National Prescription Drug Utilization Information System Database, Canadian Institute for Health Information.
Appendix C: Top 50 Patented Medicines by Drug Cost, NPDUIS Public Drug Plans, 2017/18 ($million)
| Rank |
Trade name (medicinal ingredient) |
Manufacturer |
Total |
BC |
AB |
SK |
MB |
ON |
NB |
NS |
PE |
NL |
YT |
NIHB |
| 1 |
Epclusa (sofosbuvir/velpatasvir) |
Gilead Sciences Canada Inc. |
$454.40 |
$117.88 |
$22.18 |
$13.09 |
$14.70 |
$239.87 |
$3.09 |
$1.25 |
– |
$1.16 |
$0.46 |
$40.71 |
| 2 |
Remicade (infliximab) |
Janssen Inc. |
$390.98 |
$91.98 |
$81.92 |
$37.78 |
$35.38 |
$113.02 |
$8.68 |
$9.54 |
$1.90 |
$3.99 |
$0.46 |
$6.32 |
| 3 |
Humira (adalimumab) |
AbbVie Corporation |
$290.70 |
$83.40 |
$42.99 |
$23.33 |
$25.20 |
$82.86 |
$6.46 |
$9.24 |
$2.61 |
$5.34 |
$0.55 |
$8.73 |
| 4 |
Eylea (aflibercept) |
Bayer Inc. |
$271.09 |
– |
$1.54 |
$3.80 |
– |
$259.57 |
$3.88 |
– |
$0.60 |
$0.43 |
$0.06 |
$1.20 |
| 5 |
Lucentis (ranibizumab) |
Novartis Pharmaceuticals Canada Inc. |
$205.20 |
– |
$10.57 |
$2.10 |
– |
$183.29 |
$4.60 |
– |
$0.16 |
$2.06 |
$0.02 |
$2.38 |
| 6 |
Revlimid (lenalidomide) |
Celgene Inc. |
$156.16 |
– |
– |
– |
$9.29 |
$125.49 |
$5.63 |
$7.37 |
$1.31 |
$5.10 |
$0.29 |
$1.69 |
| 7 |
Enbrel (etanercept) |
Immunex Corporation |
$148.89 |
$31.61 |
$19.24 |
$9.12 |
$14.12 |
$57.12 |
$3.39 |
$4.46 |
$0.67 |
$1.24 |
$0.29 |
$7.63 |
| 8 |
Lantus (insulin glargine) |
Sanofi-aventis Canada Inc. |
$147.24 |
$16.57 |
$15.72 |
$9.63 |
$2.40 |
$84.05 |
$2.33 |
$2.13 |
$0.26 |
$0.23 |
$0.07 |
$13.87 |
| 9 |
Advair (salmeterol / fluticasone propionate) |
GlaxoSmithKline Inc. |
$127.89 |
$13.48 |
$15.82 |
$4.23 |
$5.57 |
$75.04 |
$4.14 |
$2.93 |
$0.26 |
$1.54 |
$0.20 |
$4.69 |
| 10 |
Eliquis (apixaban) |
Bristol-Myers Squibb Canada |
$113.50 |
$7.83 |
$10.23 |
$3.27 |
$2.33 |
$87.13 |
$0.83 |
$0.73 |
$0.12 |
$0.08 |
$0.04 |
$0.92 |
| 11 |
Coversyl (perindopril erbumine) |
Servier Canada Inc. |
$111.79 |
$2.59 |
$13.46 |
$4.83 |
$1.85 |
$75.20 |
$3.95 |
$3.63 |
$0.49 |
$1.68 |
$0.04 |
$4.08 |
| 12 |
Januvia (sitagliptin) |
Merck Canada Inc. |
$103.20 |
$0.01 |
$6.03 |
$2.24 |
$1.16 |
$84.18 |
$1.94 |
$0.77 |
$0.02 |
$0.11 |
$0.01 |
$6.73 |
| 13 |
Xarelto (rivaroxaban) |
Bayer Inc. |
$99.88 |
$9.16 |
$12.76 |
$4.01 |
$2.55 |
$65.22 |
$2.32 |
$1.54 |
$0.22 |
$0.44 |
<$0.01 |
$1.67 |
| 14 |
Janumet (sitagliptin / metformin hydrochloride) |
Merck Canada Inc. |
$97.90 |
$0.01 |
$5.37 |
$1.00 |
$0.09 |
$86.76 |
$1.06 |
$0.25 |
<$0.01 |
$0.01 |
– |
$3.36 |
| 15 |
Harvoni (sofosbuvir/ledipasvir) |
Gilead Sciences Canada Inc. |
$97.81 |
$22.59 |
$8.64 |
$3.30 |
$0.69 |
$46.47 |
$1.93 |
$0.84 |
– |
$0.30 |
$0.76 |
$12.27 |
| 16 |
Zepatier (grazoprevir/elbasvir) |
Merck Canada Inc. |
$85.25 |
$20.09 |
$4.08 |
$5.16 |
$2.82 |
$42.52 |
$0.37 |
$0.17 |
– |
– |
– |
$10.04 |
| 17 |
Invega Sustenna (paliperidone) |
Janssen Inc. |
$85.14 |
$20.01 |
$1.10 |
$3.10 |
$1.91 |
$48.11 |
$2.65 |
$0.44 |
$0.11 |
$0.55 |
$0.02 |
$7.13 |
| 18 |
Symbicort (formoterol fumarate dihydrate / budesonide) |
AstraZeneca Canada Inc. |
$76.26 |
$6.73 |
$10.94 |
$2.66 |
$2.19 |
$47.91 |
$1.23 |
$1.96 |
$0.18 |
$0.66 |
$0.06 |
$1.73 |
| 19 |
Abilify (aripiprazole) |
Otsuka Pharmaceutical Co., Ltd. |
$68.18 |
$10.42 |
$1.29 |
$1.10 |
$2.96 |
$49.17 |
$0.78 |
$0.30 |
$0.06 |
$0.07 |
<$0.01 |
$2.02 |
| 20 |
Prolia (denosumab) |
Amgen Canada Inc. |
$58.53 |
$0.88 |
$1.31 |
$0.47 |
$0.27 |
$55.17 |
$0.11 |
$0.16 |
$0.01 |
$0.01 |
$0.01 |
$0.14 |
| 21 |
Stelara (ustekinumab) |
Janssen Inc. |
$58.08 |
$8.09 |
$10.83 |
$3.79 |
$3.97 |
$23.81 |
$2.81 |
$1.88 |
$0.26 |
$1.54 |
$0.04 |
$1.06 |
| 22 |
Spiriva (tiotropium) |
Boehringer Ingelheim |
$58.05 |
$3.27 |
$7.91 |
$2.24 |
$1.01 |
$38.61 |
$1.49 |
$1.47 |
$0.18 |
$0.44 |
$0.08 |
$1.34 |
| 23 |
Simponi (golimumab) |
Janssen Inc. |
$54.85 |
$9.82 |
$7.56 |
$5.05 |
$3.27 |
$19.91 |
$1.97 |
$2.03 |
$0.35 |
$1.82 |
$0.09 |
$2.97 |
| 24 |
Imbruvica (ibrutinib) |
Janssen Inc. |
$53.15 |
– |
– |
– |
$3.72 |
$45.64 |
$1.98 |
$0.71 |
– |
$0.70 |
$0.24 |
$0.17 |
| 25 |
Flovent HFA (fluticasone propionate) |
GlaxoSmithKline Inc. |
$51.95 |
$5.61 |
$1.77 |
$2.38 |
$1.18 |
$28.01 |
$2.23 |
$1.60 |
$0.33 |
$2.12 |
$0.09 |
$6.64 |
| 26 |
Triumeq (abacavir/lamivudine/dolutegravir) |
ViiV Healthcare ULC |
$45.49 |
– |
– |
$1.73 |
$2.04 |
$37.65 |
$0.93 |
– |
– |
$0.29 |
$0.10 |
$2.77 |
| 27 |
Trajenta (linagliptin) |
Boehringer Ingelheim |
$44.77 |
$5.46 |
$2.35 |
$0.86 |
$0.49 |
$33.79 |
$0.59 |
$0.03 |
$0.01 |
$0.02 |
– |
$1.18 |
| 28 |
Zytiga (abiraterone acetate) |
Janssen Inc. |
$42.78 |
– |
– |
– |
$2.45 |
$37.05 |
$1.21 |
$1.00 |
$0.07 |
$0.61 |
$0.02 |
$0.37 |
| 29 |
Tecfidera (dimethyl fumarate) |
Biogen Canada Inc. |
$42.29 |
$8.47 |
$8.41 |
$6.19 |
$2.30 |
$10.44 |
$2.68 |
$1.59 |
$0.09 |
$1.45 |
$0.23 |
$0.47 |
| 30 |
Soliris (eculizumab) |
Alexion Pharma GmbH |
$41.36 |
– |
$4.74 |
– |
$1.09 |
$34.21 |
$0.25 |
– |
$0.12 |
– |
– |
$0.95 |
| 31 |
Pradaxa (dabigatran etexilate) |
Boehringer Ingelheim |
$40.91 |
$2.88 |
$4.60 |
$1.10 |
$0.93 |
$29.44 |
$0.79 |
$0.66 |
$0.08 |
$0.10 |
– |
$0.33 |
| 32 |
Invokana (canagliflozin) |
Janssen Inc. |
$40.37 |
– |
$2.40 |
$0.87 |
$0.43 |
$33.23 |
$0.37 |
$0.01 |
<$0.01 |
$0.01 |
<$0.01 |
$3.05 |
| 33 |
Sandostatin LAR (octreotide) |
Novartis Pharmaceuticals Canada Inc. |
$37.41 |
$0.03 |
$5.18 |
$0.53 |
$3.31 |
$25.01 |
$1.10 |
$1.00 |
– |
$0.60 |
– |
$0.66 |
| 34 |
Botox (onabotulinumtoxina) |
Allergan Inc. |
$36.62 |
$5.17 |
$5.03 |
$0.87 |
$0.97 |
$22.48 |
$0.34 |
$0.78 |
– |
– |
$0.06 |
$0.92 |
| 35 |
Jardiance (empagliflozin) |
Boehringer Ingelheim |
$36.61 |
<$0.01 |
$2.59 |
$0.45 |
$0.31 |
$31.30 |
$0.32 |
$0.01 |
$0.01 |
<$0.01 |
$0.01 |
$1.61 |
| 36 |
NovoRapid (insulin aspart) |
Novo Nordisk Canada Inc. |
$36.48 |
$3.08 |
$3.31 |
$0.96 |
$1.22 |
$22.51 |
$0.62 |
$1.24 |
$0.49 |
$0.63 |
$0.03 |
$2.39 |
| 37 |
Orencia (abatacept) |
Bristol-Myers Squibb Canada |
$36.23 |
$10.70 |
$5.53 |
$2.00 |
$1.26 |
$12.55 |
$0.62 |
$1.30 |
$0.23 |
$0.26 |
$0.10 |
$1.68 |
| 38 |
Copaxone (glatiramer acetate) |
Teva Canada Limited |
$33.45 |
$5.46 |
$9.69 |
$3.43 |
$3.91 |
$8.93 |
$0.60 |
– |
$0.21 |
$0.56 |
$0.08 |
$0.58 |
| 39 |
Actonel DR (risedronate sodium) |
Allergan Pharma Co. |
$33.10 |
– |
– |
$0.17 |
– |
$32.93 |
– |
– |
– |
– |
– |
– |
| 40 |
Xtandi (enzalutamide) |
Astellas Pharma Canada Inc. |
$32.22 |
– |
– |
– |
$2.32 |
$24.63 |
$1.57 |
$2.14 |
$0.36 |
$0.85 |
$0.06 |
$0.29 |
| 41 |
Lumigan RC (bimatoprost) |
Allergan Inc. |
$31.28 |
$2.82 |
$1.93 |
$0.91 |
$0.77 |
$22.40 |
$0.50 |
$0.85 |
$0.20 |
$0.38 |
$0.01 |
$0.52 |
| 42 |
Breo ellipta (vilanterol / fluticasone furoate) |
GlaxoSmithKline Inc. |
$29.54 |
$3.15 |
$2.82 |
$1.32 |
$1.11 |
$19.04 |
$0.67 |
$0.59 |
$0.10 |
$0.24 |
$0.01 |
$0.49 |
| 43 |
Gilenya (fingolimod) |
Novartis Pharmaceuticals Canada Inc. |
$29.39 |
$8.31 |
$10.95 |
$0.57 |
$1.47 |
$5.19 |
$1.08 |
$0.92 |
$0.24 |
$0.17 |
$0.04 |
$0.45 |
| 44 |
Lupron depot (leuprolide acetate) |
AbbVie Corporation |
$28.91 |
$0.88 |
$0.17 |
$0.22 |
$0.25 |
$24.14 |
$0.76 |
$0.87 |
$0.18 |
$0.69 |
– |
$0.75 |
| 45 |
Risperdal Consta (risperidone) |
Janssen Inc. |
$27.86 |
$3.70 |
$0.36 |
$1.60 |
$1.37 |
$15.98 |
$0.99 |
$0.23 |
$0.23 |
$0.23 |
$0.03 |
$3.14 |
| 46 |
Jakavi (ruxolitinib) |
Novartis Pharmaceuticals Canada Inc. |
$27.59 |
– |
– |
– |
$1.28 |
$23.99 |
$1.48 |
$0.74 |
– |
$0.07 |
$0.04 |
– |
| 47 |
Abilify Maintena (aripiprazole) |
Otsuka Pharmaceutical Co., Ltd. |
$27.00 |
$7.78 |
$0.27 |
$1.28 |
$0.28 |
$14.85 |
$0.57 |
$0.12 |
$0.03 |
$0.16 |
$0.02 |
$1.65 |
| 48 |
Vyvanse (lisdexamfetamine dimesylate) |
Shire Pharma Canada ULC |
$26.96 |
$1.04 |
$1.25 |
$1.36 |
$1.08 |
$18.98 |
$0.35 |
$0.08 |
$0.03 |
$0.06 |
$0.01 |
$2.71 |
| 49 |
Genvoya (emtricitabine/elvitegravir/cobicistat) |
Gilead Sciences Canada Inc. |
$26.48 |
– |
– |
$1.81 |
$0.91 |
$21.02 |
$0.47 |
– |
– |
$0.08 |
$0.08 |
$2.10 |
| 50 |
Actemra (tocilizumab) |
Hoffmann-La Roche Limited |
$26.34 |
$4.68 |
$4.15 |
$2.00 |
$1.82 |
$11.18 |
$0.20 |
$0.42 |
$0.03 |
$0.44 |
$0.08 |
$1.34 |
| |
|
Total |
$4,327.48 |
$555.61 |
$389.00 |
$177.91 |
$171.99 |
$2,637.05 |
$88.89 |
$69.99 |
$12.81 |
$39.50 |
$4.88 |
$179.86 |
| |
|
Share of all patented medicines |
76% |
80% |
79% |
75% |
74% |
75% |
75% |
73% |
77% |
72% |
75% |
74% |
Data source: National Prescription Drug Utilization Information System Database, Canadian Institute for Health Information.
Appendix D: Top 50 Multi-Source Generic Medicines by Drug Cost, NPDUIS Public Drug Plans, 2017/18 ($million)
| Rank |
Medicinal ingredient |
Total |
BC |
AB |
SK |
MB |
ON |
NB |
NS |
PE |
NL |
YT |
NIHB |
| 1 |
Atorvastatin |
$89.72 |
$9.34 |
$10.12 |
$3.11 |
$2.00 |
$55.47 |
$1.90 |
$2.34 |
$0.51 |
$1.24 |
$0.15 |
$3.55 |
| 2 |
Rosuvastatin |
$77.14 |
$5.68 |
$8.66 |
$3.00 |
$1.06 |
$48.98 |
$2.17 |
$2.72 |
$0.60 |
$1.78 |
$0.05 |
$2.44 |
| 3 |
Pantoprazole |
$57.55 |
$2.93 |
$7.83 |
$1.94 |
$0.73 |
$37.00 |
$2.45 |
$0.97 |
$0.39 |
$0.42 |
$0.04 |
$2.85 |
| 4 |
Amlodipine |
$53.14 |
$5.39 |
$5.98 |
$1.96 |
$1.06 |
$33.93 |
$0.95 |
$1.34 |
$0.38 |
$0.34 |
$0.07 |
$1.74 |
| 5 |
Gabapentin |
$43.10 |
$9.03 |
$4.79 |
$1.90 |
$2.14 |
$16.10 |
$1.47 |
$0.88 |
$0.29 |
$0.15 |
$0.05 |
$6.31 |
| 6 |
Pregabalin |
$33.33 |
$0.15 |
– |
$1.67 |
$0.06 |
$29.17 |
$0.37 |
$0.49 |
$0.04 |
$0.11 |
$0.07 |
$1.19 |
| 7 |
Ramipril |
$29.51 |
$5.62 |
$2.85 |
$1.25 |
$0.64 |
$15.04 |
$0.64 |
$0.66 |
$0.23 |
$0.57 |
$0.09 |
$1.92 |
| 8 |
Olanzapine |
$29.35 |
$4.98 |
$0.95 |
$0.80 |
$1.38 |
$16.99 |
$1.35 |
$0.47 |
$0.19 |
$0.46 |
$0.02 |
$1.77 |
| 9 |
Metformin |
$28.67 |
$3.49 |
$3.32 |
$1.58 |
$0.82 |
$14.71 |
$0.69 |
$0.89 |
$0.27 |
$0.58 |
$0.05 |
$2.27 |
| 10 |
Duloxetine |
$28.36 |
$0.22 |
$2.99 |
$1.17 |
$0.54 |
$21.89 |
$0.14 |
$0.10 |
<$0.01 |
$0.01 |
$0.02 |
$1.27 |
| 11 |
Rabeprazole |
$27.00 |
$2.75 |
$0.58 |
$1.74 |
$0.73 |
$15.67 |
$0.30 |
$2.02 |
$0.11 |
$1.42 |
$0.01 |
$1.67 |
| 12 |
Escitalopram |
$26.03 |
$3.90 |
$2.22 |
$0.36 |
$0.18 |
$17.73 |
$0.13 |
$0.17 |
<$0.01 |
$0.08 |
$0.01 |
$1.26 |
| 13 |
Venlafaxine |
$25.71 |
$4.72 |
$2.27 |
$1.40 |
$1.10 |
$11.85 |
$1.05 |
$0.75 |
$0.19 |
$0.78 |
$0.02 |
$1.57 |
| 14 |
Quetiapine |
$25.48 |
$3.22 |
$1.00 |
$0.92 |
$1.19 |
$15.32 |
$1.23 |
$0.43 |
$0.09 |
$0.61 |
$0.01 |
$1.47 |
| 15 |
Sertraline |
$23.26 |
$3.62 |
$1.46 |
$1.20 |
$0.88 |
$12.22 |
$0.86 |
$0.77 |
$0.17 |
$0.66 |
$0.02 |
$1.42 |
| 16 |
Clopidogrel |
$21.19 |
$1.62 |
$1.90 |
$0.72 |
$0.70 |
$13.87 |
$0.59 |
$0.64 |
$0.11 |
$0.37 |
$0.02 |
$0.65 |
| 17 |
Omeprazole |
$19.91 |
$0.45 |
$1.01 |
$0.43 |
$1.94 |
$9.38 |
$1.22 |
$1.66 |
$0.30 |
$0.98 |
$0.11 |
$2.42 |
| 18 |
Nifedipine |
$18.58 |
$0.71 |
$1.92 |
$0.66 |
$0.76 |
$10.49 |
$1.15 |
$0.94 |
$0.14 |
$0.86 |
$0.02 |
$0.93 |
| 19 |
Ranitidine |
$17.60 |
$2.61 |
$0.74 |
$1.07 |
$0.49 |
$8.65 |
$0.51 |
$1.01 |
$0.19 |
$0.92 |
$0.01 |
$1.38 |
| 20 |
Metoprolol |
$17.11 |
$2.14 |
$2.35 |
$1.24 |
$0.80 |
$7.18 |
$0.61 |
$1.05 |
$0.19 |
$0.82 |
$0.02 |
$0.71 |
| 21 |
Lansoprazole |
$16.95 |
$0.38 |
$1.07 |
$0.13 |
$0.09 |
$14.45 |
$0.16 |
$0.06 |
<$0.01 |
$0.01 |
$0.01 |
$0.59 |
| 22 |
Clozapine |
$16.92 |
$8.97 |
$0.48 |
$1.65 |
$2.61 |
– |
$0.90 |
<$0.01 |
$0.04 |
$0.54 |
$0.01 |
$1.71 |
| 23 |
Diltiazem |
$16.72 |
$2.38 |
$1.40 |
$0.67 |
$0.52 |
$9.76 |
$0.68 |
$0.54 |
$0.14 |
$0.20 |
$0.02 |
$0.40 |
| 24 |
Salbutamol |
$16.66 |
$2.35 |
$0.66 |
$0.76 |
$0.59 |
$9.00 |
$0.64 |
$0.56 |
$0.12 |
$0.41 |
$0.03 |
$1.54 |
| 25 |
Fentanyl |
$16.06 |
$1.88 |
$1.08 |
$1.32 |
$0.94 |
$9.89 |
$0.30 |
$0.25 |
$0.03 |
$0.06 |
$0.05 |
$0.25 |
| 26 |
Donepezil |
$16.06 |
$1.36 |
$1.06 |
$0.12 |
$0.22 |
$12.34 |
$0.31 |
$0.35 |
$0.06 |
$0.16 |
$0.01 |
$0.08 |
| 27 |
Ezetimibe |
$15.92 |
$0.01 |
$1.01 |
$0.68 |
$0.13 |
$12.80 |
$0.35 |
$0.35 |
$0.03 |
$0.19 |
<$0.01 |
$0.35 |
| 28 |
Hydromorphone |
$15.90 |
$4.17 |
$0.98 |
$1.04 |
$0.54 |
$7.56 |
$0.35 |
$0.43 |
$0.11 |
$0.20 |
$0.02 |
$0.51 |
| 29 |
Risperidone |
$15.81 |
$2.81 |
$0.46 |
$1.02 |
$0.89 |
$8.04 |
$0.77 |
$0.31 |
$0.12 |
$0.46 |
$0.01 |
$0.93 |
| 30 |
Oxycodone/paracetamol |
$15.79 |
$0.73 |
$0.70 |
<$0.01 |
$0.51 |
$11.87 |
$0.35 |
$0.14 |
$0.08 |
$0.40 |
<$0.01 |
$1.03 |
| 31 |
Nabilone |
$15.52 |
$2.70 |
$0.90 |
$0.02 |
$1.14 |
$9.61 |
$0.50 |
$0.31 |
<$0.01 |
$0.19 |
$0.01 |
$0.16 |
| 32 |
Citalopram |
$15.21 |
$2.32 |
$1.37 |
$0.94 |
$0.68 |
$6.77 |
$0.81 |
$0.75 |
$0.20 |
$0.35 |
$0.02 |
$1.01 |
| 33 |
Candesartan |
$15.00 |
$1.50 |
$1.63 |
$0.65 |
$0.19 |
$9.40 |
$0.34 |
$0.41 |
$0.07 |
$0.42 |
$0.02 |
$0.37 |
| 34 |
Fluoxetine |
$14.97 |
$2.67 |
$1.24 |
$1.03 |
$0.82 |
$6.70 |
$0.45 |
$0.34 |
$0.12 |
$0.37 |
$0.01 |
$1.22 |
| 35 |
Epinephrine |
$14.97 |
$1.24 |
$0.80 |
$1.06 |
$0.35 |
$9.20 |
$0.21 |
$0.12 |
$0.01 |
$0.06 |
$0.01 |
$1.90 |
| 36 |
Levodopa/decarboxylase inibitor |
$14.87 |
$1.39 |
$1.56 |
$0.62 |
$0.42 |
$9.68 |
$0.26 |
$0.39 |
$0.09 |
$0.19 |
$0.02 |
$0.25 |
| 37 |
Amoxicillin |
$14.86 |
$1.24 |
$0.83 |
$0.91 |
$0.33 |
$8.97 |
$0.20 |
$0.19 |
$0.08 |
$0.29 |
$0.01 |
$1.80 |
| 38 |
Valsartan |
$14.54 |
$1.17 |
$2.56 |
$0.78 |
$0.26 |
$8.71 |
$0.10 |
$0.38 |
$0.08 |
$0.11 |
$0.01 |
$0.38 |
| 39 |
Tamsulosin |
$14.28 |
$1.52 |
$2.72 |
$0.79 |
$0.32 |
$7.40 |
$0.51 |
$0.29 |
$0.10 |
$0.27 |
$0.03 |
$0.33 |
| 40 |
Cefalexin |
$14.28 |
$1.47 |
$0.89 |
$1.50 |
$0.43 |
$6.77 |
$0.19 |
$0.28 |
$0.06 |
$0.23 |
$0.01 |
$2.43 |
| 41 |
Simvastatin |
$14.21 |
$1.05 |
$1.74 |
$0.79 |
$0.31 |
$8.35 |
$0.43 |
$0.63 |
$0.13 |
$0.39 |
$0.02 |
$0.37 |
| 42 |
Risedronic acid |
$14.17 |
$0.20 |
$1.62 |
$0.33 |
$0.09 |
$10.89 |
$0.24 |
$0.49 |
$0.04 |
$0.10 |
<$0.01 |
$0.18 |
| 43 |
Paroxetine |
$13.26 |
$1.80 |
$1.02 |
$0.81 |
$0.58 |
$6.28 |
$0.58 |
$0.50 |
$0.11 |
$0.63 |
$0.02 |
$0.93 |
| 44 |
Gliclazide |
$13.21 |
$0.60 |
$1.16 |
$0.52 |
$0.65 |
$7.43 |
$0.36 |
$0.67 |
$0.17 |
$0.42 |
$0.02 |
$1.22 |
| 45 |
Ondansetron |
$13.08 |
$1.47 |
$2.78 |
$0.15 |
$1.31 |
$5.43 |
$0.16 |
$0.25 |
<$0.01 |
$0.03 |
$0.01 |
$1.49 |
| 46 |
Bupropion |
$12.59 |
$2.30 |
$1.13 |
$0.60 |
$0.53 |
$6.58 |
$0.30 |
$0.25 |
$0.03 |
$0.18 |
$0.02 |
$0.66 |
| 47 |
Valproic acid |
$12.47 |
$2.87 |
$0.40 |
$0.61 |
$0.67 |
$6.15 |
$0.50 |
$0.18 |
$0.09 |
$0.32 |
$0.01 |
$0.65 |
| 48 |
Glyceryl trinitrate |
$12.41 |
$1.72 |
$1.48 |
$0.62 |
$0.39 |
$6.31 |
$0.45 |
$0.66 |
$0.12 |
$0.31 |
$0.04 |
$0.32 |
| 49 |
Methotrexate |
$11.88 |
$1.76 |
$1.78 |
$0.54 |
$0.38 |
$5.64 |
$0.31 |
$0.36 |
$0.07 |
$0.18 |
$0.02 |
$0.85 |
| 50 |
Irbesartan |
$11.79 |
$0.45 |
$1.98 |
$0.42 |
$0.36 |
$7.53 |
$0.18 |
$0.30 |
$0.06 |
$0.11 |
<$0.01 |
$0.38 |
| |
Total |
$1,132.10 |
$129.02 |
$101.41 |
$49.20 |
$36.42 |
$661.20 |
$31.68 |
$31.04 |
$6.76 |
$20.93 |
$1.31 |
$63.12 |
| |
Share of all multi-source generic medicines |
61% |
60% |
57% |
59% |
51% |
63% |
60% |
60% |
61% |
57% |
52% |
57% |
Data source: National Prescription Drug Utilization Information System Database, Canadian Institute for Health Information.
Appendix E: Top 50 Single-Source Non-Patented Medicines by Drug Cost, NPDUIS Public Drug Plans, 2017/18 ($thousand)
| Rank |
Trade name (medicinal ingredient) |
Manufacturer |
Total |
BC |
AB |
SK |
MB |
ON |
NB |
NS |
PE |
NL |
YT |
NIHB |
| 1 |
Fragmin (dalteparin sodium) |
Pfizer Canada Inc. |
$38,079 |
$8,525 |
$3,396 |
$714 |
$3,187 |
$19,153 |
$690 |
$1,428 |
$34 |
$2 |
$173 |
$777 |
| 2 |
Levemir Penfill (insulin detemir) |
Novo Nordisk Canada Inc. |
$36,686 |
$3,071 |
$4,575 |
$1,065 |
$116 |
$24,799 |
$334 |
$1,036 |
$78 |
$173 |
$18 |
$1,422 |
| 3 |
Grastofil (filgrastim) |
Apotex Inc. |
$28,955 |
$4,888 |
$585 |
$20 |
$16 |
$22,028 |
$962 |
- |
$61 |
$148 |
$40 |
$206 |
| 4 |
Aubagio (teriflunomide) |
Sanofi Genzyme, a division of Sanofi-aventis Canada Inc. |
$26,411 |
$6,766 |
$2,071 |
$2,371 |
$1,267 |
$10,243 |
$1,663 |
$1,183 |
$133 |
$409 |
$19 |
$286 |
| 5 |
Zoladex LA (goserelin) |
TerSera Therapeutics LLC |
$19,401 |
$4 |
- |
- |
$37 |
$16,583 |
$674 |
$1,245 |
$243 |
$262 |
$105 |
$247 |
| 6 |
Rebif (interferon beta-1a) |
EMD Serono, a division of EMD Inc. Canada |
$18,517 |
$3,014 |
$3,628 |
$2,199 |
$1,799 |
$6,359 |
$691 |
- |
$194 |
$271 |
$34 |
$327 |
| 7 |
Aranesp HAS-free (darbepoetin alfa) |
Amgen Canada Inc. |
$16,660 |
- |
$7,545 |
$295 |
$13 |
$4,712 |
$1,121 |
- |
- |
$1,077 |
$21 |
$1,875 |
| 8 |
Innohep (tinzaparin sodium) |
Leo Pharma Inc. |
$13,323 |
$546 |
$4,887 |
$1,805 |
$13 |
$5,629 |
$9 |
$6 |
$11 |
- |
- |
$418 |
| 9 |
Lovenox with preservative (enoxaparin sodium) |
Sanofi-aventis Canada Inc. |
$11,618 |
$191 |
$1,248 |
$512 |
$35 |
$8,511 |
$399 |
$57 |
$37 |
$193 |
$2 |
$433 |
| 10 |
Fucidin (fusidic acid) |
Leo Pharma Inc. |
$10,681 |
$908 |
$423 |
$265 |
$222 |
$7,615 |
$129 |
$181 |
$18 |
$142 |
$2 |
$777 |
| 11 |
Inflectra (infliximab) |
Celltrion Healthcare Co., Ltd |
$10,334 |
$3,117 |
$741 |
$138 |
$1,091 |
$4,826 |
$61 |
$84 |
- |
$49 |
$65 |
$162 |
| 12 |
Lemtrada (alemtuzumab) |
Sanofi Genzyme, a division of Sanofi-aventis Canada Inc. |
$9,729 |
- |
$2,712 |
$3,299 |
$280 |
$3,080 |
- |
$47 |
- |
- |
- |
$311 |
| 13 |
Mirena (levonorgestrel) |
Bayer Inc. |
$9,008 |
$1,484 |
$188 |
$368 |
$239 |
$3,830 |
$142 |
$34 |
$14 |
$143 |
- |
$2,567 |
| 14 |
Betaseron (interferon beta-1b) |
Bayer Inc. |
$6,079 |
$906 |
$778 |
$884 |
$860 |
$2,373 |
$113 |
- |
$46 |
$101 |
- |
$19 |
| 15 |
Protopic (tacrolimus) |
Leo Pharma Inc. |
$5,926 |
$93 |
$58 |
$41 |
$59 |
$5,277 |
$17 |
$12 |
$2 |
$2 |
- |
$363 |
| 16 |
Premarin vaginal (conjugated estrogens) |
Pfizer Canada Inc. |
$5,689 |
$891 |
$942 |
$380 |
$132 |
$2,607 |
$164 |
$131 |
$45 |
$116 |
$11 |
$271 |
| 17 |
Remodulin (treprostinil) |
United Therapeutics Corporation |
$5,527 |
$1,625 |
- |
- |
$317 |
$2,289 |
$982 |
- |
- |
- |
- |
$314 |
| 18 |
Aggrenox (dipyridamole / acetylsalicylic acid) |
Boehringer Ingelheim |
$4,998 |
$34 |
$514 |
$70 |
$32 |
$4,136 |
$37 |
$47 |
- |
$33 |
$1 |
$94 |
| 19 |
Trandate (labetalol hydrochloride) |
Paladin Labs Inc. |
$4,478 |
$576 |
$391 |
$250 |
$202 |
$2,111 |
$168 |
$309 |
$61 |
$108 |
$1 |
$301 |
| 20 |
Lamisil (terbinafine hydrochloride) |
Novartis Pharmaceuticals Canada Inc. |
$4,238 |
- |
$305 |
$107 |
$3 |
$3,501 |
$45 |
$48 |
- |
$48 |
$5 |
$177 |
| 21 |
Apo-Ciclesonide (ciclesonide) |
Apotex Inc. |
$4,065 |
- |
- |
$25 |
- |
$4,040 |
- |
- |
- |
- |
<$1 |
- |
| 22 |
Elmiron (pentosan polysulfate sodium) |
Janssen Inc. |
$3,524 |
$1,587 |
$348 |
$93 |
$224 |
$339 |
$239 |
$400 |
$26 |
$82 |
- |
$185 |
| 23 |
Fluanxol Depot (flupentixol decanoate) |
Lundbeck Canada Inc. |
$3,450 |
$550 |
$68 |
$225 |
$147 |
$2,088 |
$54 |
$66 |
<$1 |
$54 |
$2 |
$194 |
| 24 |
Vimizim (elosulfase alfa) |
BioMarin International Ltd |
$3,230 |
- |
- |
- |
- |
$1,576 |
- |
- |
- |
- |
- |
$1,654 |
| 25 |
Depo-Provera (medroxyprogesterone acetate) |
Pfizer Canada Inc. |
$3,081 |
$311 |
$28 |
$212 |
$120 |
$1,029 |
$88 |
$17 |
$11 |
$110 |
- |
$1,155 |
| 26 |
Pentoxifylline SR (pentoxifylline) |
AA Pharma Inc. |
$3,026 |
$391 |
$339 |
$110 |
$53 |
$1,898 |
$22 |
$25 |
$8 |
$101 |
$2 |
$76 |
| 27 |
Elaprase (idursulfase) |
Shire Human Genetic Therapies Inc. |
$3,013 |
- |
- |
- |
- |
$3,013 |
- |
- |
- |
- |
- |
- |
| 28 |
Ferriprox (deferiprone) |
ApoPharma Inc. |
$2,596 |
$690 |
$74 |
- |
- |
$1,832 |
- |
- |
- |
- |
- |
- |
| 29 |
Soriatane (acitretin) |
Actavis Specialty Pharmaceuticals Co. |
$2,427 |
$266 |
$156 |
$105 |
$66 |
$1,454 |
$65 |
$117 |
$13 |
$65 |
|
$121 |
| 30 |
Tobradex (dexamethasone/tobramycin) |
Novartis Pharmaceuticals Canada Inc. |
$2,380 |
$253 |
$280 |
$165 |
$24 |
$1,346 |
$45 |
$64 |
$4 |
$60 |
$2 |
$136 |
| 31 |
Solu-Medrol (methylprednisolone) |
Pfizer Canada Inc. |
$2,378 |
$197 |
$120 |
$41 |
$10 |
$1,700 |
$28 |
$79 |
$51 |
$48 |
$2 |
$103 |
| 32 |
Apo-Lamivudine HBV (lamivudine) |
Apotex Inc. |
$2,304 |
$1,026 |
$76 |
$25 |
$46 |
$1,046 |
$16 |
$16 |
- |
$4 |
$2 |
$46 |
| 33 |
pdp-Amantadine Hydrochloride (amantadine hydrochloride) |
Pendopharm, a division of Pharmascience Inc. |
$2,233 |
$272 |
$184 |
$138 |
$51 |
$1,334 |
$67 |
$75 |
$19 |
$40 |
$2 |
$51 |
| 34 |
Qvar (beclomethasone dipropionate HFA) |
Valeant Canada LP/Valeant Canada S.E.C. |
$2,230 |
$209 |
$240 |
$362 |
$77 |
$999 |
$39 |
$30 |
$3 |
$7 |
$3 |
$259 |
| 35 |
Nat-Oseltamivir (oseltamivir) |
Natco Pharma Inc. |
$2,229 |
$201 |
- |
$81 |
$28 |
$1,766 |
$24 |
$48 |
- |
$3 |
- |
$79 |
| 36 |
Inspra (eplerenone) |
Pfizer Canada Inc. |
$2,222 |
$79 |
$177 |
$46 |
$12 |
$1,830 |
$35 |
$24 |
- |
$4 |
- |
$15 |
| 37 |
Hp-PAC (lansoprazole, amoxicillin, clarithromycin) |
Takeda Pharmaceuticals U.S.A. Inc. |
$2,169 |
$416 |
$111 |
$55 |
$5 |
$994 |
$1 |
$29 |
- |
$36 |
- |
$522 |
| 38 |
Midodrine (midodrine hydrochloride) |
AA Pharma Inc. |
$2,051 |
$314 |
$180 |
$70 |
$101 |
$1,214 |
$38 |
$29 |
$3 |
$33 |
$1 |
$68 |
| 39 |
One-Alpha (alfacalcidol) |
Leo Pharma Inc. |
$1,984 |
$679 |
$50 |
$88 |
$6 |
$923 |
$56 |
$51 |
<$1 |
$25 |
$5 |
$100 |
| 40 |
Apo-Quinapril/HCTZ (quinapril/hydrochlorothiazide) |
Apotex Inc. |
$1,964 |
$95 |
$157 |
$83 |
$27 |
$1,385 |
$15 |
$68 |
$7 |
$78 |
$3 |
$46 |
| 41 |
Zovirax (acyclovir) |
Valeant Canada LP/Valeant Canada S.E.C. |
$1,951 |
$662 |
- |
$3 |
$221 |
- |
$218 |
- |
$36 |
$245 |
$10 |
$556 |
| 42 |
Cerezyme (imiglucerase) |
Sanofi Genzyme, a division of Sanofi-aventis Canada Inc. |
$1,929 |
- |
- |
- |
$931 |
- |
- |
- |
- |
$551 |
- |
$448 |
| 43 |
Monurol (fosfomycin) |
Paladin Labs Inc. |
$1,909 |
$239 |
$234 |
$34 |
$1 |
$1,359 |
$5 |
$20 |
$2 |
$1 |
$1 |
$14 |
| 44 |
Cytomel (liothyronine) |
Pfizer Canada Inc. |
$1,840 |
$1,203 |
$421 |
- |
$69 |
$8 |
$32 |
$29 |
- |
$13 |
$6 |
$60 |
| 45 |
Clopixol Depot (zuclopenthixol decanoate) |
Lundbeck Canada Inc. |
$1,759 |
$547 |
$39 |
$209 |
$46 |
$577 |
$73 |
$16 |
- |
$72 |
- |
$181 |
| 46 |
Mestinon USP (pyridostigmine bromide) |
Valeant Canada LP/Valeant Canada S.E.C. |
$1,660 |
$214 |
$194 |
$108 |
$89 |
$870 |
$37 |
$68 |
$8 |
$21 |
$3 |
$49 |
| 47 |
Lomotil (diphenoxylate hydrochloride, atropine sulfate) |
Pfizer Canada Inc. |
$1,612 |
$118 |
$311 |
$82 |
$19 |
$935 |
$42 |
$40 |
$2 |
$57 |
<$1 |
$7 |
| 48 |
Thyrogen (thyrotropin alfa) |
Sanofi Genzyme, a division of Sanofi-aventis Canada Inc. |
$1,411 |
- |
$348 |
- |
- |
$955 |
$20 |
$47 |
- |
- |
- |
$40 |
| 49 |
Locacorten Vioform (flumethasone pivalate / clioquinol) |
Paladin Labs Inc. |
$1,346 |
$142 |
$46 |
$32 |
$18 |
$979 |
$23 |
$24 |
$5 |
$23 |
<$1 |
$52 |
| 50 |
Entocort (budesonide, sodium chloride) |
Tillotts Pharma GmbH |
$1,344 |
$273 |
$483 |
$80 |
$93 |
$129 |
$113 |
$106 |
$6 |
$5 |
$4 |
$51 |
| Total |
$355,655 |
$47,574 |
$39,648 |
$17,256 |
$12,407 |
$197,281 |
$9,792 |
$7,337 |
$1,185 |
$5,013 |
$547 |
$17,615 |
| Share of all single-source non-patented medicines |
86% |
85% |
87% |
85% |
83% |
87% |
84% |
80% |
76% |
77% |
89% |
77% |
Data source: National Prescription Drug Utilization Information System Database, Canadian Institute for Health Information.
Appendix F: Top 50 Manufacturers by Drug Cost, NPDUIS Public Drug Plans, 2017/18 ($million)
| Rank |
Company |
Total |
BC |
AB |
SK |
MB |
ON |
NB |
NS |
PE |
NL |
YT |
NIHB |
| 1 |
Janssen Inc. |
$855.02 |
$144.31 |
$107.46 |
$63.07 |
$57.06 |
$390.95 |
$22.85 |
$17.44 |
$2.98 |
$10.60 |
$0.99 |
$37.32 |
| 2 |
Gilead Sciences Canada Inc. |
$646.66 |
$147.22 |
$34.39 |
$21.13 |
$19.46 |
$350.99 |
$6.51 |
$2.26 |
- |
$1.86 |
$1.36 |
$61.48 |
| 3 |
Apotex Inc. |
$514.19 |
$48.24 |
$34.17 |
$17.31 |
$16.76 |
$334.81 |
$12.68 |
$8.59 |
$2.08 |
$8.02 |
$0.60 |
$30.91 |
| 4 |
Novartis Pharmaceuticals Canada Inc. |
$473.99 |
$24.41 |
$41.84 |
$8.85 |
$12.38 |
$351.66 |
$12.76 |
$7.10 |
$0.76 |
$5.99 |
$0.35 |
$7.88 |
| 5 |
Bayer Inc. |
$430.71 |
$13.96 |
$19.72 |
$12.51 |
$5.95 |
$354.80 |
$7.95 |
$3.30 |
$1.04 |
$3.22 |
$0.07 |
$8.20 |
| 6 |
Teva Canada Ltd |
$385.41 |
$37.23 |
$34.90 |
$18.70 |
$16.12 |
$229.51 |
$9.02 |
$8.96 |
$1.90 |
$8.02 |
$0.40 |
$20.65 |
| 7 |
Merck Canada Inc. |
$377.19 |
$25.59 |
$21.84 |
$10.53 |
$5.41 |
$281.57 |
$5.21 |
$2.55 |
$0.20 |
$0.77 |
$0.05 |
$23.47 |
| 8 |
AbbVie Corporation |
$331.18 |
$86.04 |
$43.42 |
$23.96 |
$26.08 |
$114.63 |
$7.31 |
$10.11 |
$2.79 |
$6.09 |
$0.62 |
$10.14 |
| 9 |
Sandoz Canada Inc. |
$277.46 |
$29.26 |
$23.81 |
$11.47 |
$6.94 |
$178.44 |
$5.05 |
$5.82 |
$0.88 |
$3.67 |
$0.38 |
$11.73 |
| 10 |
Boehringer Ingelheim |
$255.35 |
$19.75 |
$25.44 |
$6.98 |
$5.51 |
$178.47 |
$5.06 |
$4.73 |
$0.90 |
$1.70 |
$0.23 |
$6.59 |
| 11 |
GlaxoSmithKline Inc. |
$252.11 |
$28.89 |
$24.53 |
$9.95 |
$9.16 |
$146.61 |
$7.73 |
$5.96 |
$0.83 |
$4.30 |
$0.34 |
$13.79 |
| 12 |
AstraZeneca Canada Inc. |
$203.01 |
$22.95 |
$23.44 |
$8.56 |
$4.56 |
$129.50 |
$2.33 |
$3.43 |
$0.40 |
$1.24 |
$0.10 |
$6.51 |
| 13 |
Sanofi-aventis Canada Inc. |
$198.11 |
$19.29 |
$18.44 |
$11.72 |
$2.97 |
$119.40 |
$3.48 |
$3.51 |
$0.57 |
$1.08 |
$0.09 |
$17.59 |
| 14 |
Celgene Inc. |
$175.00 |
$0.01 |
- |
- |
$10.04 |
$142.00 |
$6.09 |
$7.78 |
$1.44 |
$5.47 |
$0.31 |
$1.86 |
| 15 |
Pfizer Canada Inc. |
$174.92 |
$24.36 |
$12.56 |
$6.29 |
$10.21 |
$100.41 |
$4.29 |
$5.31 |
$0.59 |
$2.22 |
$0.35 |
$8.32 |
| 16 |
Bristol-Myers Squibb Canada |
$173.72 |
$19.29 |
$16.58 |
$5.44 |
$5.79 |
$116.11 |
$2.62 |
$2.75 |
$0.42 |
$0.81 |
$0.17 |
$3.73 |
| 17 |
Sanis Health Inc. |
$168.64 |
$26.65 |
$24.10 |
$10.52 |
$8.06 |
$65.78 |
$8.35 |
$7.68 |
$1.27 |
$5.29 |
$0.57 |
$10.36 |
| 18 |
Immunex Corporation |
$157.65 |
$33.68 |
$20.61 |
$9.50 |
$14.56 |
$60.33 |
$3.46 |
$5.06 |
$0.69 |
$1.32 |
$0.29 |
$8.15 |
| 19 |
Servier Canada Inc. |
$155.17 |
$2.79 |
$19.23 |
$8.02 |
$2.76 |
$102.01 |
$5.91 |
$5.24 |
$0.64 |
$2.53 |
$0.05 |
$6.00 |
| 20 |
Pharmascience Inc. |
$135.95 |
$18.87 |
$11.14 |
$8.45 |
$4.98 |
$71.77 |
$3.75 |
$3.70 |
$0.68 |
$3.11 |
$0.16 |
$9.33 |
| 21 |
Mylan Pharmaceuticals ULC |
$123.25 |
$14.51 |
$12.57 |
$4.19 |
$6.09 |
$69.14 |
$4.15 |
$3.04 |
$0.59 |
$2.39 |
$0.08 |
$6.49 |
| 22 |
Novo Nordisk Canada Inc. |
$116.00 |
$10.96 |
$13.77 |
$3.25 |
$2.75 |
$67.35 |
$2.32 |
$5.71 |
$0.94 |
$3.08 |
$0.15 |
$5.69 |
| 23 |
Purdue Pharma |
$109.48 |
$6.92 |
$10.59 |
$6.68 |
$5.77 |
$69.85 |
$3.27 |
$2.27 |
$0.22 |
$0.72 |
$0.08 |
$3.12 |
| 24 |
Amgen Canada Inc. |
$101.21 |
$2.94 |
$12.65 |
$0.96 |
$0.28 |
$77.01 |
$1.95 |
$0.31 |
$0.05 |
$1.87 |
$0.06 |
$3.12 |
| 25 |
Hoffmann-La Roche Ltd |
$101.09 |
$18.13 |
$12.69 |
$5.55 |
$6.29 |
$44.63 |
$2.31 |
$3.01 |
$0.39 |
$1.83 |
$0.22 |
$6.05 |
| 26 |
Allergan Inc. |
$99.63 |
$10.70 |
$9.67 |
$2.84 |
$2.35 |
$66.67 |
$1.23 |
$2.20 |
$0.27 |
$0.84 |
$0.08 |
$2.79 |
| 27 |
Otsuka Pharmaceutical Co., Ltd |
$95.19 |
$18.19 |
$1.56 |
$2.38 |
$3.24 |
$64.02 |
$1.35 |
$0.42 |
$0.09 |
$0.24 |
$0.03 |
$3.68 |
| 28 |
Sivem Pharmaceuticals ULC |
$87.08 |
$17.29 |
$24.54 |
$7.17 |
$8.19 |
<$0.01 |
$5.73 |
$9.51 |
$2.92 |
$3.36 |
- |
$8.39 |
| 29 |
Astellas Pharma Canada Inc. |
$86.57 |
$0.03 |
$2.05 |
$2.26 |
$5.65 |
$67.12 |
$3.19 |
$2.49 |
$0.36 |
$0.95 |
$0.07 |
$2.39 |
| 30 |
Eli Lilly Canada Inc. |
$78.14 |
$11.52 |
$5.61 |
$5.39 |
$3.90 |
$34.98 |
$2.98 |
$2.51 |
$1.14 |
$3.35 |
$0.18 |
$6.58 |
| 31 |
Biogen Canada Inc. |
$70.19 |
$14.02 |
$11.85 |
$7.51 |
$6.59 |
$20.19 |
$4.49 |
$1.95 |
$0.25 |
$2.01 |
$0.26 |
$1.07 |
| 32 |
AA Pharma Inc. |
$59.60 |
$12.85 |
$4.41 |
$3.43 |
$2.18 |
$28.01 |
$1.86 |
$1.75 |
$0.38 |
$1.33 |
$0.06 |
$3.33 |
| 33 |
ViiV Healthcare ULC |
$58.80 |
- |
- |
$2.53 |
$2.75 |
$46.89 |
$1.32 |
- |
- |
$0.42 |
$0.10 |
$4.80 |
| 34 |
Valeant Canada LP/Valeant Canada S.E.C. |
$58.04 |
$6.07 |
$6.15 |
$1.80 |
$1.88 |
$35.48 |
$1.68 |
$1.23 |
$0.23 |
$1.07 |
$0.03 |
$2.43 |
| 35 |
Sanofi Genzyme, a division of Sanofi-aventis Canada Inc. |
$53.82 |
$6.77 |
$5.13 |
$6.35 |
$4.04 |
$25.76 |
$1.68 |
$1.50 |
$0.13 |
$0.96 |
$0.02 |
$1.48 |
| 36 |
BGP Pharma ULC |
$52.34 |
$5.83 |
$6.73 |
$2.05 |
$1.64 |
$30.12 |
$1.30 |
$1.88 |
$0.30 |
$0.82 |
$0.06 |
$1.61 |
| 37 |
Actavis Pharma Co. |
$50.56 |
$6.62 |
$5.50 |
$1.10 |
$2.19 |
$30.20 |
$0.95 |
$0.85 |
$0.11 |
$0.61 |
$0.05 |
$2.38 |
| 38 |
Leo Pharma Inc. |
$45.85 |
$3.15 |
$6.38 |
$2.88 |
$0.40 |
$29.13 |
$0.45 |
$0.33 |
$0.04 |
$0.41 |
$0.03 |
$2.66 |
| 39 |
Allergan Pharma Co. |
$42.42 |
$0.81 |
$0.61 |
$0.57 |
$0.21 |
$38.85 |
$0.21 |
$0.48 |
$0.06 |
$0.13 |
<$0.01 |
$0.48 |
| 40 |
Alexion Pharma GmbH |
$41.36 |
- |
$4.74 |
- |
$1.09 |
$34.21 |
$0.25 |
- |
$0.12 |
- |
- |
$0.95 |
| 41 |
Taro Pharmaceuticals Inc. |
$40.44 |
$3.38 |
$2.52 |
$1.80 |
$1.50 |
$25.76 |
$0.71 |
$1.03 |
$0.26 |
$0.77 |
$0.03 |
$2.67 |
| 42 |
Shire Pharma Canada ULC |
$38.78 |
$3.43 |
$2.02 |
$2.43 |
$1.38 |
$25.01 |
$0.54 |
$0.21 |
$0.04 |
$0.18 |
$0.03 |
$3.50 |
| 43 |
UCB Canada Inc. |
$29.63 |
$6.03 |
$1.36 |
$1.48 |
$0.73 |
$17.68 |
$0.19 |
$0.86 |
$0.11 |
$0.21 |
$0.04 |
$0.94 |
| 44 |
Auro Pharma Inc. |
$28.84 |
$3.75 |
$2.72 |
$0.85 |
$1.06 |
$17.94 |
$0.31 |
$0.36 |
$0.08 |
$0.33 |
$0.02 |
$1.41 |
| 45 |
Ranbaxy Pharmaceuticals Canada Inc. |
$28.12 |
$5.15 |
$1.99 |
$0.85 |
$0.45 |
$16.93 |
$0.42 |
$0.40 |
$0.09 |
$0.44 |
$0.09 |
$1.31 |
| 46 |
Paladin Labs Inc. |
$23.71 |
$5.51 |
$2.61 |
$1.12 |
$0.93 |
$10.10 |
$0.53 |
$0.86 |
$0.15 |
$0.38 |
$0.02 |
$1.50 |
| 47 |
Indivior UK Ltd |
$23.40 |
$6.21 |
$0.60 |
$0.20 |
$0.18 |
$6.15 |
$0.05 |
$0.07 |
$0.05 |
$0.16 |
$0.01 |
$9.70 |
| 48 |
Mint Pharmaceuticals Inc. |
$21.83 |
$3.92 |
$2.52 |
$1.10 |
$0.58 |
$10.99 |
$0.24 |
$0.68 |
$0.14 |
$0.18 |
$0.18 |
$1.31 |
| 49 |
Pendopharm, a division of Pharmascience Inc. |
$21.34 |
$4.15 |
$1.66 |
$1.38 |
$0.78 |
$10.08 |
$0.58 |
$0.49 |
$0.13 |
$0.35 |
$0.03 |
$1.70 |
| 50 |
EMD Serono, a division of EMD Inc. Canada |
$21.28 |
$3.94 |
$3.68 |
$2.24 |
$2.17 |
$7.51 |
$0.77 |
- |
$0.19 |
$0.36 |
$0.03 |
$0.38 |
| |
Total |
$8,149.39 |
$985.59 |
$736.48 |
$355.30 |
$321.99 |
$4,847.53 |
$189.38 |
$167.69 |
$30.88 |
$107.06 |
$9.56 |
$397.92 |
Data source: National Prescription Drug Utilization Information System Database, Canadian Institute for Health Information.