Generics360 – Generic Drugs in Canada, 2018
Acknowledgements
This report was prepared by the Patented Medicine Prices Review Board (PMPRB) as part of the National Prescription Drug Utilization Information System (NPDUIS) initiative.
The PMPRB wishes to acknowledge and thank the members of the NPDUIS Advisory Committee for their expert oversight and guidance in the preparation of this report. Please note that the statements, findings, and conclusions do not necessarily reflect those of the members or their organizations.
Appreciation goes to Carol McKinley for coordinating this project and to Orlando Manti and Jun Yu for their contribution to the analysis, as well as to Tanya Potashnik, Elena Lungu, and Jeffrey Menzies for their oversight of the report. The PMPRB also wishes to acknowledge the contribution of the analytical staff Brian O’Shea and Yvonne Zhang; and the editorial staff Sarah Parker and Shirin Paynter.
Disclaimer
NPDUIS operates independently of the regulatory activities of the Board of the PMPRB. The research priorities, data, statements, and opinions expressed or reflected in NPDUIS reports do not represent the position of the PMPRB with respect to any regulatory matter. NPDUIS reports do not contain information that is confidential or privileged under sections 87 and 88 of the Patent Act, and the mention of a medicine in a NPDUIS report is not and should not be understood as an admission or denial that the medicine is subject to filings under sections 80, 81, or 82 of the Patent Act or that its price is or is not excessive under section 85 of the Patent Act.
Although this information is based in part on data obtained from the IQVIA MIDAS® Database, the statements, findings, conclusions, views, and opinions expressed in this report are exclusively those of the PMPRB and are not attributable to IQVIA.
Contact Information
Patented Medicine Prices Review Board
Standard Life Centre
Box L40
333 Laurier Avenue West
Suite 1400
Ottawa, ON K1P 1C1
Telephone: 1-877-861-2350
TTY: 613-288-9654
Email: PMPRB.Information-Renseignements.CEPMB@pmprb-cepmb.gc.ca
Executive Summary
Generics360 reports on the latest trends in the Canadian generic drug market within an international context. Canada has established one of the strongest generic markets in the industrialized world, though domestic prices have historically been much higher than international levels.
Over the past decade, generic price-setting policies initiated by individual provincial governments and through the pan-Canadian Pharmaceutical Alliance (pCPA) have resulted in a notable decline in generic prices. The latest initiative, a five-year joint agreement between the pCPA and the Canadian Generic Pharmaceutical Association (CGPA), has gained the greatest ground, bringing Canadian prices closely in line with international norms.
To support policy decision making, the PMPRB has been monitoring changes in the generic landscape in Canada since 2007. This edition of Generics360 reviews the decade-long impact of generic pricing policies in Canada, focusing on the effect of the most recent initiatives. The findings highlight trends in the reported sales (revenues), utilization (the number of units sold), and prices of generic medicines.
The international markets examined include the Organisation for Economic Co-operation and Development (OECD) members, with a focus on the seven countries the PMPRB considers in reviewing the prices of patented medicines (PMPRB7): France, Germany, Italy, Sweden, Switzerland, the United Kingdom (UK), and the United States (US).
The information in this report will inform discussions and support evidence-based decision making for policy makers, the pharmaceutical industry, clinicians, and patients.
Background
Since 2010, generic pricing policies have greatly reduced the price of generic medicines in Canada, resulting in substantial cost savings for all Canadians. These policies were initially led by individual provinces, but have been established collectively through the pCPA as of 2013.
On April 1, 2018, a new five-year agreement between the pCPA and the CGPA came into effect, reducing the prices of 67 of the most commonly prescribed medicines in Canada to approximately 10% to 18% of their brand reference product.
The price reductions attained through these policies apply equally to all Canadians, whether they are covered by public drug plans, private insurers, or pay out of pocket.
For a summary of the provincial and pCPA policy initiatives implemented since 2010, see the reference documents section of the Analytical Studies page on the PMPRB website.
Key Findings
Canada has one of the strongest generic drug markets in the OECD in terms of sales and utilization
- Sales of generic medicines in Canada rose from $3.0 billion in 2006 to $5.4 billion in 2018; this rate of increase is well within the range of the PMPRB7 countries and in line with the OECD average.
- Generic use accounted for 76% of the volume of drugs in the Canadian pharmaceutical market in 2018, the third highest retail market share among the OECD countries after the US and Germany.
- Canadians spent $164 per capita on generics in 2018, ranking second among the OECD countries, in part due to high domestic use of generic medicines.
While generic use in Canada is increasing, the share of sales has been decreasing, due to provincial pricing policies and growth in the patented medicine market
- Although generic use has increased, spending levels in 2018 were virtually the same as in 2010 due to the implementation of pricing policies.
- The sales growth of patented medicines has outpaced that of generics since 2011, diminishing the generic share of Canadian pharmaceutical spending.
- The share of generic units sold increased from 62% of the Canadian pharmaceutical market in 2010 to 76% in 2018, while the share of generic spending decreased from 32% to 25% over the same period.
- National retail spending on generic medicines in Canada dropped by 7% in 2018, principally due to price decreases that took effect partway through the year.
Provincial and pCPA generic pricing policies have significantly reduced generic prices in Canada over the last decade, gradually narrowing the gap with international levels
- Generic prices in Canada have fallen more than prices in comparable countries, decreasing by almost 60% from the last quarter of 2007 (Q4-2007) to Q4-2018, with a more significant 80% drop for some of the most commonly used medicines.
- Price reductions, as well as a slightly weakening Canadian dollar, have contributed toward aligning Canadian and foreign generic price levels over the past several years.
The most recent pCPA–CGPA initiative has brought Canadian prices closely in line with international levels
- Mean generic drug prices in the PMPRB7 countries were 5% higher than in Canada in Q4-2018, while median prices, which reduce the influence of extremely high or low values, were 13% lower. This represents a significant improvement from Q4-2017 when mean PMPRB7 prices were 11% below Canadian prices and median prices were 27% lower.
- In 2018, generic prices in Canada were 11th highest in the OECD, in line with Italy, the US, and France, and slightly above Germany, although prices in the UK and Sweden were still 25% and 33% lower, respectively.
- Canada’s international standing in 2018 is a marked improvement over 2016, when Canada ranked seventh highest in the OECD for generic prices, with Germany, France, and Italy approximately 25% lower.
Lower-priced, higher-sales generic markets made the greatest gain toward price alignment with international levels
- Generic medicines set to 10% of their brand reference price under the recent pCPA initiative made great strides toward price alignment with international levels, from a 40% difference in median prices in 2016 to being on par in 2018.
- Canadian generic sales have shifted toward lower-priced medicines. In 2016, those priced at 18% or less of their brand reference made up around 40% of all generic unit sales; by 2018, the same share was made up of generics priced at 10% or less of their reference.
- Although generics with annual sales over $10 million still had the largest differential between Canadian and median international prices, this gap narrowed from 36% in 2016 to 15% in 2018.
Data source
The primary data source for the analysis is the IQVIA MIDAS® Database for the fourth quarter of 2018 (Q4-2018). International price comparisons are based on manufacturer-level retail prices for 584 leading oral solid prescription medicines, making up 76% of all generic sales in Canada ($933 million) in Q4-2018.
Canadian data is reported at the national level and includes sales of generic medicines in all retail markets: public, private, and out-of-pocket.
Introduction
Over the last decade, provincial pricing policies and pan-Canadian Pharmaceutical Alliance (pCPA) initiatives have led to significant declines in the prices of generic prescription medicines in Canada. Between 2007 and 2017, the average price of generic medicines dropped by a staggering 50%, gradually narrowing the gap between Canadian and international pricing levels. However, in 2017 there was still a marked difference between average Canadian and international generic prices.
In April 2018, the pCPA and the Canadian Generic Pharmaceutical Association (CGPA) took additional action, jointly launching a new initiative to further reduce the prices of 67 of the most commonly prescribed generic medicines to as little as 10% of their brand-name equivalents. This included treatments for high blood pressure, high cholesterol, and depression, collectively used by millions of Canadians.Footnote 1 This report measures the effect of this important change on generic prices in Canada, highlighting the impact on Canada’s relative international ranking.
To inform policy discussions and support evidence-based decision making, the PMPRB has been monitoring changes in the generic landscape in Canada since 2007 (PMPRB 2010a, 2010b, 2011, 2013, 2014, 2016, 2017, 2018a). Building on these previous analyses, this edition of Generics360 reviews the decade-long impact of generic pricing policies in Canada, focusing on the most recent policy change.
The first section of this report provides a comprehensive overview of the entire Canadian generic market in 2018, examining trends in domestic and international sales and utilization. The remaining two sections compare Canadian and international price levels for a selection of oral solid medicines, which represent over 75% of generic spending in Canada. Price comparisons focus on the PMPRB7, highlighting generics affected by the recent initiative.
Provincial policies and pCPA pricing initiatives have had a widespread impact on generic price levels in Canada. Not only does the public sector account for a sizable share of the national market (41.8% of prescribed drug spending in 2018; CIHI 2018), but it also has a higher generic market capture than the private sector (71% versus 55% of prescriptions in 2013; PMPRB 2015). Furthermore, the lower prices attained through generic pricing policies for the public drug plans also apply to the private sector.
For an overview of the provincial generic pricing policies implemented since 2010 and the pCPA initiatives, see the reference documents section of the Analytical Studies page on the PMPRB website.
Methods
The IQVIA MIDAS® Database (all rights reserved) was the main source of data for Canadian and international sales, utilization, and pricing information, with a focus on national retail markets. For Canada, the national retail market encompasses payers in all market segments (public, private, and out-of-pocket). Sales and prices reported are based on manufacturer ex-factory list prices. For more information on the MIDAS Database and other NPDUIS source materials, see the reference documents section of the Analytical Studies page on the PMPRB website.
For this study, a generic medicine is defined as any unique combination of medicinal ingredient, strength, and form sold under the name of its active ingredient and classified according to the IQVIA definition of a generic product, including both patentedFootnote 2 and non-patented medicines. Sales refer to revenues reported in the MIDAS Database, while utilization refers to the number of units sold. The average prices, sales, and volume data reported encompass all versions of a medicine available in a particular country, produced by any manufacturer in any strength and form.
International markets examined include the Organisation for Economic Co-operation and Development (OECD) members, with an emphasis on the seven countries the PMPRB considers in reviewing the prices of patented medicines (PMPRB7): France, Germany, Italy, Sweden, Switzerland, the United Kingdom (UK), and the United States (US).
Annual and quarterly results are reported, with a focus on the latest available period. Market spot exchange rates were used to convert foreign currency prices into their Canadian dollar equivalents. OECD sales averages were determined by converting all of the local currencies into US dollars.
The overview in Section 1 is based on the entire retail pharmaceutical generic market in each country, unless otherwise noted. The pricing analyses in Sections 2 and 3 are based on a select group of oral solid medicines identified using the criteria described below.
Pricing Analysis
Average foreign-to-Canadian price ratios were calculated for a variety of bilateral and multilateral measures. Bilateral price ratios compare the generic price levels for an individual country to those in Canada, while multilateral ratios compare the minimum, median, mean, and maximum prices across all countries (PMPRB7 or OECD) to those in Canada. The resulting ratios reflect how much more or less Canadians would have paid for generic medicines if they had paid the corresponding international prices. These values are Canadian sales-weighted arithmetic averages of the corresponding foreign-to-Canadian price ratios for individual medicines. For more details on the how foreign-to-Canadian price ratios are calculated, see the reference documents section of the Analytical Studies page on the PMPRB website.
Selection criteria for generics
The pricing analysis examines 584 leading generic medicines in Canada with available prices in international markets. These medicines accounted for Canadian retail sales of approximately $933 million in the fourth quarter of 2018 (Q4-2018), representing slightly over three quarters of all generic sales (see the Summary Table).
The analysis is restricted to oral solid prescription medicines that have been on the market for at least one year and had estimated annual Canadian retail sales of at least $1 million in 2018. This avoids issues that may result from the inconsistent reporting of non-solid medicines and from medicines that were newly genericized for which the competitive market structure and pricing may not have reached a stable level.
For international comparisons, only medicines with the same form and strength were considered. Multilateral median and mean measures were restricted to medicines with available prices in three or more foreign markets and in two or more foreign markets for the minimum and the maximum measures.
Summary Table: Generic medicines selected for pricing analysis, Q4-2018
| |
Number of medicines |
Sales |
| All generics |
1,694 |
$1,225 million |
| Select generics |
584 |
$933 million |
| Select share of all generics |
34.5% |
76.2% |
Note: Results reflect prescription sales in the retail market based on manufacturer ex-factory list prices.
Data source: IQVIA MIDAS® Database, October–December 2018. All rights reserved.
Limitations
The international prices available in the IQVIA MIDAS® Database are estimated manufacturer ex-factory list prices. They do not capture off-invoice price rebates and allowances, which manufacturers may provide to retailers to stock their interchangeable products. Consequently, the prices reported do not necessarily reflect the net revenue to manufacturers.
These prices may be different from other price points in the distribution chain, such as wholesaler or pharmacy retail prices. Therefore, the reported prices may not reflect the prices the consumer paid or what public and private plans reimbursed.
The methodology that MIDAS uses for estimating prices varies by country. It depends on the distribution system and the availability of public data at various points in the distribution chain. This data includes the manufacturer’s price, the wholesale price, and the pharmacy price in specific markets. Depending on the country, manufacturer, wholesale, or retail prices may represent estimates based on assumed regulated margins and/or markups.
Canadian data is based on the national market and includes sales in the public, private, and out-of-pocket market segments. While public plans cover a broad range of generic medicines, the private sector may cover generics not reimbursed by public plans or prices that that fall outside the provincial policies. This report does not measure the extent to which generic prices differ among provinces and payers.
Provincial generic pricing policies may not be fully reflected in this report due to the nature of the national-level analysis and the broad basket of generics included in the analysis. Although the selection of medicines reported in the study represents a significant component of the generic market in Canada, a portion of the market was excluded by the selection criteria.
This analysis highlights the impact of the five-year pCPA–CGPA joint initiative. Because it was introduced in April, partway through the year, results based on the entire 2018 calendar year do not reflect the full effect of the change.
Note that this report does not attempt to assess the extent of the savings that may result from this initiative, as this is beyond the scope of the analysis.
1. Overview of the Entire Generic Market
Canada has one of the strongest generic markets in the OECD, ranking among the top few countries in terms of generic use and per capita spending.
Canadians spent $5.4 billion on generic medicines in 2018, which is on par with the sales levels in 2010. Although there has been a sizable growth in generic use over the last decade, the price of generic medicines has dropped significantly due to provincial and pCPA initiatives, virtually eliminating any increase in overall spending.
Compared to generic retail sales, which fell 7.0% in 2018, patented medicines have experienced robust sales growth over the last several years, contributing to a reduction in the generic revenue share of the Canadian pharmaceutical market.
Overall, since 2006, generic retail spending in Canada has increased by 82%, from $3.0 billion in 2006 to $5.4 billion in 2018. Prior to 2010, Canadian spending was growing at a steep compound annual growth rate (CAGR) of 16.2%, greatly outpacing the growth in other countries. After the implementation of new provincial and pCPA policies, generic sales growth was virtually zero, with a CAGR of -0.1% from 2010 to 2018.
Figure 1.1 shows the growth in retail sales for the entire generic market in Canada and for each of the PMPRB7 countries from 2006 to 2018, as well as the OECD average. The results are given as an index, with each line representing the cumulative change in sales for each country since 2006. The growth in Canadian sales falls well within the range of the PMPRB7 comparator countries and is in line with the OECD average.
Figure 1.1 Index of Canadian and international retail sales for generic medicines, 2006 to 2018
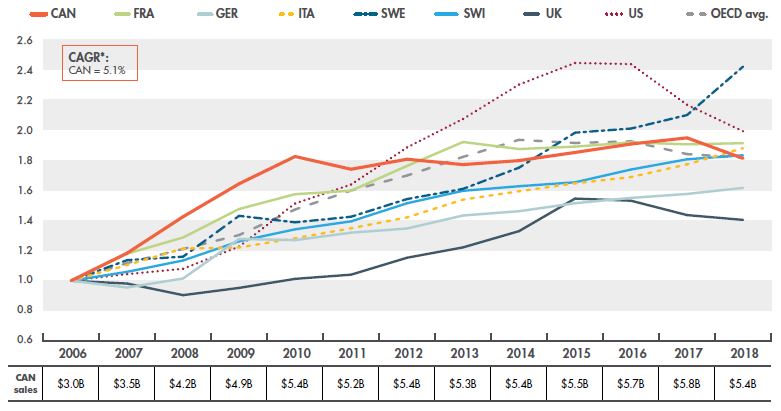
Figure description
This line graph gives the indexed rate of growth of generic retail sales for Canada and the seven PMPRB comparator countries, as well as the average for the Organisation for Economic Co-operation and Development countries. From 2006 to 2018, the compound annual growth rate for Canada was 5.1%.
| Country |
2006 |
2007 |
2008 |
2009 |
2010 |
2011 |
2012 |
2013 |
2014 |
2015 |
2016 |
2017 |
2018 |
| Canada |
1.00 |
1.18 |
1.42 |
1.64 |
1.82 |
1.74 |
1.81 |
1.77 |
1.80 |
1.85 |
1.91 |
1.95 |
1.81 |
| France |
1.00 |
1.18 |
1.29 |
1.48 |
1.57 |
1.60 |
1.76 |
1.92 |
1.87 |
1.89 |
1.92 |
1.90 |
1.91 |
| Germany |
1.00 |
0.95 |
1.01 |
1.28 |
1.27 |
1.32 |
1.35 |
1.43 |
1.46 |
1.51 |
1.55 |
1.58 |
1.62 |
| Italy |
1.00 |
1.10 |
1.21 |
1.22 |
1.28 |
1.35 |
1.42 |
1.54 |
1.59 |
1.65 |
1.69 |
1.77 |
1.88 |
| Sweden |
1.00 |
1.14 |
1.16 |
1.43 |
1.39 |
1.42 |
1.54 |
1.61 |
1.75 |
1.98 |
2.01 |
2.10 |
2.42 |
| Switzerland |
1.00 |
1.06 |
1.13 |
1.26 |
1.34 |
1.39 |
1.51 |
1.60 |
1.63 |
1.65 |
1.74 |
1.81 |
1.83 |
| United Kingdom |
1.00 |
0.98 |
0.90 |
0.95 |
1.01 |
1.04 |
1.15 |
1.22 |
1.33 |
1.54 |
1.53 |
1.44 |
1.40 |
| United States |
1.00 |
1.04 |
1.08 |
1.23 |
1.51 |
1.64 |
1.88 |
2.07 |
2.30 |
2.44 |
2.44 |
2.17 |
1.99 |
| OECD average |
1.00 |
1.12 |
1.21 |
1.30 |
1.47 |
1.60 |
1.70 |
1.82 |
1.93 |
1.91 |
1.92 |
1.84 |
1.82 |
The table below the graph gives the total Canadian generic retail sales for each year: 2006: $3.0 billion; 2007: $3.5 billion; 2008: $4.2 billion; 2009: $4.9 billion; 2010: $5.4 billion; 2011: $5.2 billion; 2012: $5.4 billion; 2013: $5.3 billion; 2014: $5.4 billion; 2015: $5.5 billion; 2016: $5.7 billion; 2017: $5.8 billion; 2018: $5.4 billion.
Note: Results reflect the amount spent on generic prescription medicines in the national retail markets based on manufacturer ex-factory list prices. The rates of growth are based on sales data reported in the local currency of each country; average OECD sales were determined by converting all currencies into US dollars.
* Compound annual growth rate.
Data source: IQVIA MIDAS® Database. All rights reserved.
The rate of change in annual spending for generic medicines can also be assessed in relation to the corresponding change in patented medicine sales. The growth in generic sales in Canada greatly surpassed that of patented medicines until 2010, when the trend shifted with the introduction of generic pricing policies. The rate of change in generic retail sales has since been consistently lower than the change in patented medicines sales.
As shown in Figure 1.2, retail patented medicine sales grew by 7.6% in 2017, while generic sales increased by only 2.1%. Following the latest initiative, sales of generics dropped by 7.0% in 2018.Footnote 3 The potential to realize additional savings in coming years may be limited, as many of the top-selling generic medicines have been included in recent pricing initiatives.
Figure 1.2 Rate of change in retail sales, generic versus patented medicines, Canada, 2007 to 2018
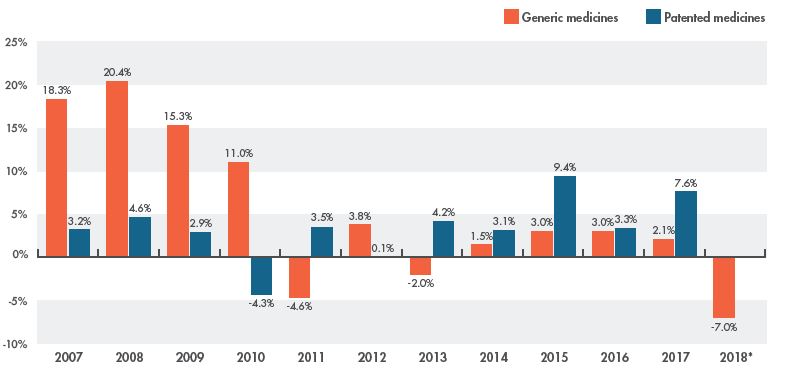
Figure description
This column graph compares the rate of change in retail sales of generic and patented medicines from 2007 to 2018. The rate of change for generic retail sales in Canada was -7.0% in 2018; the change for patented medicines was not available at the time of analysis.
|
2007 |
2008 |
2009 |
2010 |
2011 |
2012 |
2013 |
2014 |
2015 |
2016 |
2017 |
| Generic medicines |
18.3% |
20.4% |
15.3% |
11.0% |
-4.6% |
3.8% |
-2.0% |
1.5% |
3.0% |
3.0% |
2.1% |
| Patented medicines |
3.2% |
4.6% |
2.9% |
-4.3% |
3.5% |
0.1% |
4.2% |
3.1% |
9.4% |
3.3% |
7.6% |
Note: Results reflect prescription sales in the national retail market based on manufacturer ex-factory list prices. Historical results have been recalculated using the latest available data; thus although the trends align, the annual rates of change in generic sales may not exactly match previously published values.
* The rate of change in the sales of patented medicines for 2018 was not available at the time of analysis.
Data source: For generic medicines: IQVIA MIDAS® Database. All rights reserved.
For patented medicines: PMPRB Annual Report, 2017.
Despite the continued uptake in generic use, which increased from 62% to 76% of the pharmaceutical retail market between 2010 and 2018, the share of generic sales declined from 32% to 25% over the same period. This trend reflects the impact of generic price reductions, as well as the markedly stronger growth in the brand-name segment. Figure 1.3 illustrates the trends in the pharmaceutical market share of generic and brand-name medicines in Canada from 2006 to 2018 in terms of the number of units sold and sales revenues.
Figure 1.3 Generic share of the Canadian pharmaceutical retail market, 2006 to 2018
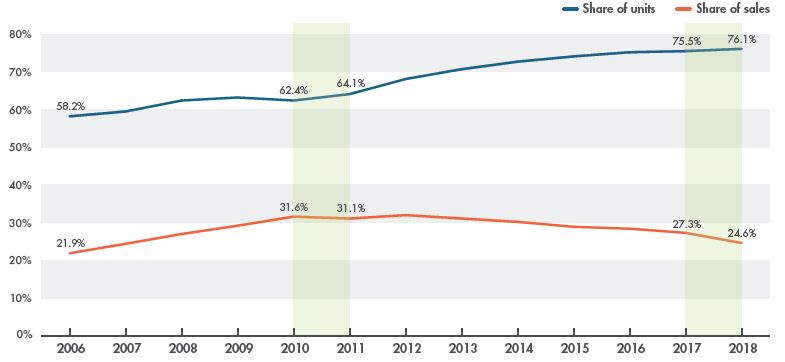
Figure description
Fig. 1.3 Generic share of the Canadian pharmaceutical retail market, 2006 to 2018
This line graph gives the generic share of the retail pharmaceutical market in Canada from 2006 to 2018 in terms of spending (sales) and units sold.
|
2006 |
2007 |
2008 |
2009 |
2010 |
2011 |
2012 |
2013 |
2014 |
2015 |
2016 |
2017 |
2018 |
| Share of units |
58.2% |
59.5% |
62.4% |
63.2% |
62.4% |
64.1% |
68.1% |
70.7% |
72.7% |
74.1% |
75.2% |
75.5% |
76.1% |
| Share of sales |
21.9% |
24.4% |
27.0% |
29.2% |
31.6% |
31.1% |
32.0% |
31.1% |
30.2% |
28.9% |
28.4% |
27.3% |
24.6% |
Note: The results reflect prescription sales in the national retail market based on manufacturer ex-factory list prices.
Data source: IQVIA MIDAS® Database. All rights reserved.
The 76% generic retail market share of units in Canada represents one of the highest rates of generic use among the OECD countries in 2018, ranking third after the US (81%) and Germany (77%). In terms of spending, the 25% generic market share in Canada was in line with the OECD median and similar to the share of sales in France, but lower than Italy (30%) and the UK (37%). Figure 1.4 compares the generic shares of spending and units in Canada with the other OECD countries in 2018.
Figure 1.4 Retail market share of generic medicines, OECD, 2018
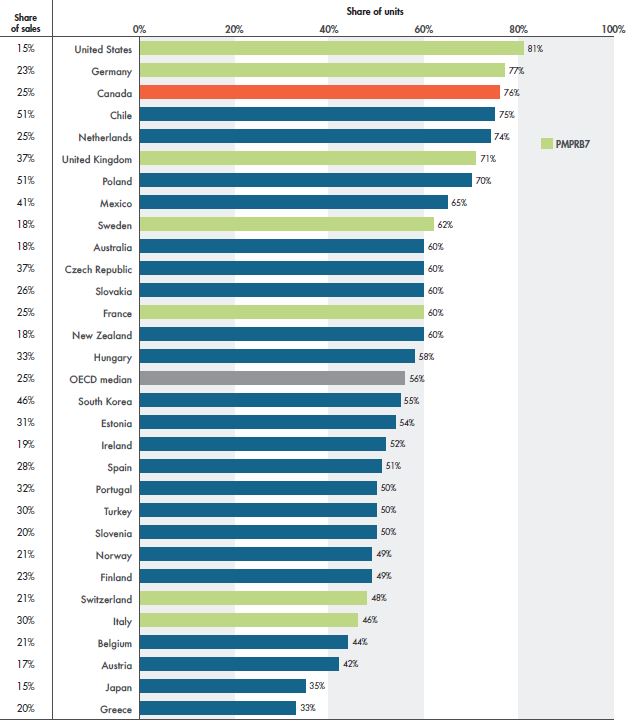
Figure description
This horizontal bar graph depicts the generic medicine shares of the retail pharmaceutical market for the Organisation for Economic Co-operation and Development countries in 2018. The bars represent the share of units for each country, while the share of sales is listed in a table to the left of the graph.
| Country |
Generic share of units |
Generic share of sales |
| United States |
81% |
15% |
| Germany |
77% |
23% |
| Canada |
76% |
25% |
| Chile |
75% |
51% |
| Netherlands |
74% |
25% |
| United Kingdom |
71% |
37% |
| Poland |
70% |
51% |
| Mexico |
65% |
41% |
| Sweden |
62% |
18% |
| Australia |
60% |
18% |
| Czech Republic |
60% |
37% |
| Slovakia |
60% |
26% |
| France |
60% |
25% |
| New Zealand |
60% |
18% |
| Hungary |
58% |
33% |
| OECD median |
56% |
25% |
| South Korea |
55% |
46% |
| Estonia |
54% |
31% |
| Ireland |
52% |
19% |
| Spain |
51% |
28% |
| Portugal |
50% |
32% |
| Turkey |
50% |
30% |
| Slovenia |
50% |
20% |
| Norway |
49% |
21% |
| Finland |
49% |
23% |
| Switzerland |
48% |
21% |
| Italy |
46% |
30% |
| Belgium |
44% |
21% |
| Austria |
42% |
17% |
| Japan |
35% |
15% |
| Greece |
33% |
20% |
Note: Results reflect prescription sales in the national retail market based on manufacturer ex-factory list prices reported in the local currency of each country; average OECD sales were determined by converting all currencies into US dollars.
Data source: IQVIA MIDAS® Database. All rights reserved.
In 2018, Canadians spent more on generic medicines than residents of any other OECD country, except the US, primarily due to their higher rate of use. While this report focuses on retail sales and prices, Figure 1.5 examines generic spending per capita in the combined retail and hospital markets for the OECD countries. This provides another perspective on Canada’s position internationally. Per capita generic spending is expressed in Canadian dollars in terms of (a) absolute amounts and (b) at purchasing power parity (PPP). PPP measures the relative cost of living among countries by comparing a standard “basket” of goods and services at the prices prevailing in each country. Because PPP represents relative costs of living, it offers a simple way to account for the differences in overall national price levels when comparing individual prices, incomes, and other monetary values across countries.
Figure 1.5 Generic spending per capita, retail and hospital markets, OECD, 2018
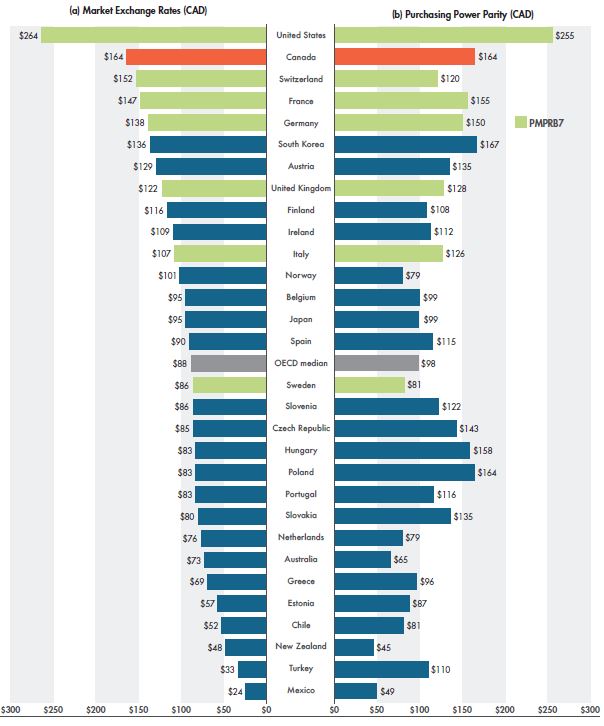
Figure description
These two side-by-side horizontal bar graphs give the per capita generic drug spending for the Organisation for Economic Co-operation and Development countries in 2018. The first graph gives the per capita combined retail and hospital sales for each country at market exchange rates, while the second gives the per capita combined retail and hospital sales at purchasing power parity. Both sets of values are expressed in Canadian dollars.
| Country |
Per capita sales in Canadian dollars at market exchange rates |
Per capita sales in Canadian dollars at purchasing power parity |
| United States |
$264 |
$255 |
| Canada |
$164 |
$164 |
| Switzerland |
$152 |
$120 |
| France |
$147 |
$155 |
| Germany |
$138 |
$150 |
| South Korea |
$136 |
$167 |
| Austria |
$129 |
$135 |
| United Kingdom |
$122 |
$128 |
| Finland |
$116 |
$108 |
| Ireland |
$109 |
$112 |
| Italy |
$107 |
$126 |
| Norway |
$101 |
$79 |
| Belgium |
$95 |
$99 |
| Japan |
$95 |
$99 |
| Spain |
$90 |
$115 |
| OECD median |
$88 |
$98 |
| Sweden |
$86 |
$81 |
| Slovenia |
$86 |
$122 |
| Czech Republic |
$85 |
$143 |
| Hungary |
$83 |
$158 |
| Poland |
$83 |
$164 |
| Portugal |
$83 |
$116 |
| Slovakia |
$80 |
$135 |
| Netherlands |
$76 |
$79 |
| Australia |
$73 |
$65 |
| Greece |
$69 |
$96 |
| Estonia |
$57 |
$87 |
| Chile |
$52 |
$81 |
| New Zealand |
$48 |
$45 |
| Turkey |
$33 |
$110 |
| Mexico |
$24 |
$49 |
Note: Results reflect prescription sales in the combined national retail and hospital markets based on manufacturer ex-factory list prices.
Data source: Sales data: IQVIA MIDAS® Database. All rights reserved.
Purchasing power parity conversion: PMPRB.
2. International Price Comparisons for Select Generics
Provincial and pCPA generic pricing policies have significantly reduced generic prices in Canada over the last decade, gradually narrowing the gap with international levels. Generic prices in Canada have fallen more than prices in comparable countries, with even more significant declines for some of the most commonly used medicines.
Price reductions, as well as a slightly weakening Canadian dollar, have contributed toward aligning Canadian and foreign generic price levels over the past several years, countering price decreases in other countries. In 2018, generic prices in Canada were 11th highest in the OECD, in line with Italy, the US, and France, and slightly above Germany, although prices in the UK and Sweden were still considerably lower.
This section focuses on 584 leading generic medicines in Canada with prices available in international markets. These medicines accounted for slightly over three quarters of all generic sales in Canada in Q4-2018.
Trends in pricing
With the introduction of provincial and pCPA pricing policies, generic prices in Canada underwent a period of rapid decline between 2010 and 2013, followed by a more gradual rate of decrease until the end of 2017. In Q2-2018, Canadian generic prices dropped significantly, and by Q4-2018, average prices were 59% lower than a decade before. The drop was even greater for the most common generics: those reduced to 18% of their brand reference prices fell by an average of 62%, while those reduced to 10% dropped by almost 80%.
Figure 2.1 gives the trends in generic pricing in Canada since 2007, along with the OECD average, as well as the overall generic price reductions for the PMPRB7 during this period. The change in price is expressed as an index, with prices in Q4-2007 set to a value of one. The generic price reduction represents the cumulative change in the corresponding price since 2007 based on the local currency for each country.
The price of generic medicines in Canada has dropped more than prices in many other major pharmaceutical markets, including all of the PMPRB7 countries. The graph shows that the price reduction in Canada follows a stepwise pattern, which aligns with the timing of the implementation of pricing policies, followed by subsequent periods of relative stability.
Figure 2.1 Price indices and generic price reductions, Canada and the PMPRB7*, Q4-2007 to Q4-2018
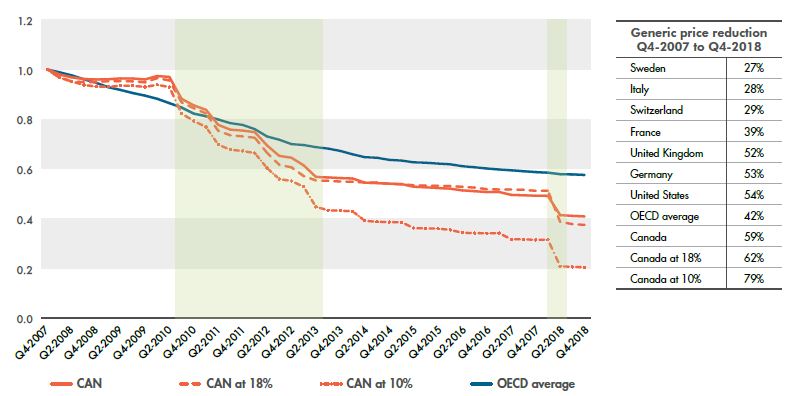
Figure description
This line graph and accompanying table focus on the price reductions for generic medicines from the fourth quarter of 2007 (Q4-2007) to the fourth quarter of 2008 (Q4-2018). The line graph gives the price indices for all generic medicines in Canada, as well as those at 18% and 10% of their brand-reference prices, and compares these with the average for the Organisation for Economic Co-operation and Development (OECD) countries over the same period. The accompanying table gives the associated generic price reductions for the Canadian markets and OECD average, as well as for each of the PMPRB7 countries.
Price indices:
|
Canada: all generics |
Canada: generics at 18% |
Canada: generics at 10% |
OECD average |
| Q4-2007 |
1.00 |
1.00 |
1.00 |
1.00 |
| Q1-2008 |
0.98 |
0.97 |
0.97 |
0.99 |
| Q2-2008 |
0.97 |
0.95 |
0.95 |
0.98 |
| Q3-2008 |
0.96 |
0.95 |
0.94 |
0.96 |
| Q4-2008 |
0.96 |
0.95 |
0.93 |
0.95 |
| Q1-2009 |
0.96 |
0.95 |
0.93 |
0.93 |
| Q2-2009 |
0.96 |
0.95 |
0.93 |
0.92 |
| Q3-2009 |
0.96 |
0.95 |
0.93 |
0.91 |
| Q4-2009 |
0.96 |
0.95 |
0.93 |
0.89 |
| Q1-2010 |
0.97 |
0.97 |
0.94 |
0.88 |
| Q2-2010 |
0.97 |
0.96 |
0.93 |
0.86 |
| Q3-2010 |
0.88 |
0.87 |
0.82 |
0.85 |
| Q4-2010 |
0.86 |
0.84 |
0.79 |
0.82 |
| Q1-2011 |
0.84 |
0.82 |
0.77 |
0.81 |
| Q2-2011 |
0.78 |
0.75 |
0.70 |
0.80 |
| Q3-2011 |
0.76 |
0.74 |
0.68 |
0.78 |
| Q4-2011 |
0.75 |
0.73 |
0.67 |
0.78 |
| Q1-2012 |
0.75 |
0.73 |
0.66 |
0.76 |
| Q2-2012 |
0.69 |
0.66 |
0.60 |
0.73 |
| Q3-2012 |
0.65 |
0.62 |
0.56 |
0.72 |
| Q4-2012 |
0.65 |
0.61 |
0.55 |
0.70 |
| Q1-2013 |
0.61 |
0.57 |
0.53 |
0.70 |
| Q2-2013 |
0.57 |
0.55 |
0.45 |
0.69 |
| Q3-2013 |
0.57 |
0.55 |
0.43 |
0.68 |
| Q4-2013 |
0.56 |
0.55 |
0.43 |
0.67 |
| Q1-2014 |
0.56 |
0.55 |
0.43 |
0.66 |
| Q2-2014 |
0.54 |
0.55 |
0.39 |
0.65 |
| Q3-2014 |
0.54 |
0.55 |
0.39 |
0.65 |
| Q4-2014 |
0.54 |
0.54 |
0.39 |
0.64 |
| Q1-2015 |
0.54 |
0.54 |
0.39 |
0.63 |
| Q2-2015 |
0.53 |
0.53 |
0.36 |
0.63 |
| Q3-2015 |
0.53 |
0.53 |
0.36 |
0.63 |
| Q4-2015 |
0.52 |
0.53 |
0.36 |
0.62 |
| Q1-2016 |
0.52 |
0.53 |
0.36 |
0.62 |
| Q2-2016 |
0.51 |
0.53 |
0.34 |
0.61 |
| Q3-2016 |
0.51 |
0.53 |
0.34 |
0.61 |
| Q4-2016 |
0.51 |
0.52 |
0.34 |
0.60 |
| Q1-2017 |
0.51 |
0.52 |
0.34 |
0.60 |
| Q2-2017 |
0.50 |
0.52 |
0.32 |
0.59 |
| Q3-2107 |
0.49 |
0.52 |
0.32 |
0.59 |
| Q4-2017 |
0.49 |
0.51 |
0.32 |
0.59 |
| Q1-2018 |
0.49 |
0.51 |
0.32 |
0.58 |
| Q2-2018 |
0.41 |
0.39 |
0.21 |
0.58 |
| Q3-2018 |
0.41 |
0.38 |
0.21 |
0.58 |
| Q4-2018 |
0.41 |
0.38 |
0.21 |
0.58 |
Price reductions from Q4-2007 to Q4-2018:
| Country |
Generic price reduction |
| Sweden |
27% |
| Italy |
28% |
| Switzerland |
29% |
| France |
39% |
| United Kingdom |
52% |
| Germany |
53% |
| United States |
54% |
| OECD average |
42% |
| Canada: all generics |
59% |
| Canada: generics at 18% |
62% |
| Canada: generics at 10% |
79% |
Note: Results are based on manufacturer ex-factory list prices in the national retail markets. The analysis was restricted to oral solid generic medicines that had been on the market for at least one year.
The price reduction for each country is calculated using the local currency and country-specific sale weights for the generic medicines. CAN at 18% and 10% refer to the 67 generic medicines reduced to 18% and 10% of their brand reference prices through the pCPA–CGPA pricing policy introduced in April 2018.
* France, Germany, Italy, Sweden, Switzerland, the United Kingdom, and the United States.
Data source: IQVIA MIDAS® Database, October–December 2007 to October–December 2018. All rights reserved.
Multilateral price comparisons
The international price comparisons reported in this section are expressed as foreign-to-Canadian generic price ratios where the average generic price level in Canada is set to one and the corresponding foreign prices are determined to be either higher than (above) or lower than (below) this level. Multilateral price ratios compare the generic price levels in Canada with levels across all countries analyzed, while bilateral price ratios compare the generic price levels in Canada with those in each individual country.
For a more complete definition of the measures reported and an in-depth description of how the average foreign-to-Canadian price ratios are calculated, see the reference documents section of the
Analytical Studies page on the PMPRB website.
While foreign price changes and currency fluctuations may contribute to the gap between Canadian and foreign price levels, Figure 2.2 clearly shows that the trend in price differentials is closely related to generic price declines in Canada, as reported in Figure 2.1. That is, as Canadian prices decline, the gap between Canadian and international prices narrows.
This effect is captured by the annual change in foreign-to-Canadian price ratios, which compare generic prices in other countries to prices available in Canada. Figure 2.2 shows the trend in multilateral foreign-to-Canadian ratios for the PMPRB7 from Q4-2010 to Q4-2018. In Q4-2010, the median price in the PMPRB7 markets was almost 50% less than in Canada; this decreased gradually to 27% by Q4-2017, and then abruptly to 13% in Q4-2018. When mean values are considered, there is an even closer congruence between foreign and Canadian prices. In 2018, the mean PMPRB7 generic price was 5% higher than the average Canadian price; however, this was mainly due to the influence of the average Swiss price, which was more than twice as high as any other PMPRB7 country.Footnote 4
The table below Figure 2.2 reports the number of generic medicines included in the analysis and their corresponding Canadian generic sales (in millions of dollars) in Q4-2018. Based on the availability of pricing data, 381 medicines were used to calculate the mean and median foreign-to-Canadian price ratios, and 430 were used to calculate the minimum and maximum ratios.
Figure 2.2 Multilateral foreign-to-Canadian generic price ratios, PMPRB7*, Q4-2010 to Q4-2018
Figure description
This line graph gives the trend in multilateral foreign-to-Canadian price ratios for the seven PMPRB comparator countries from the fourth quarter of 2010 (Q4-2010) to the fourth quarter of 2018 (Q4-2018). The Canadian generic price level is set to one. Ratios greater than one indicate higher average foreign prices, while ratios less than one indicate lower foreign prices.
| Quarter year |
Mean |
Median |
Minimum |
Maximum |
| Q4-2010 |
0.60 |
0.51 |
0.25 |
1.14 |
| Q4-2011 |
0.62 |
0.54 |
0.26 |
1.15 |
| Q4-2012 |
0.67 |
0.57 |
0.26 |
1.20 |
| Q4-2013 |
0.80 |
0.69 |
0.30 |
1.64 |
| Q4-2014 |
0.81 |
0.69 |
0.31 |
1.70 |
| Q4-2015 |
0.89 |
0.72 |
0.36 |
2.05 |
| Q4-2016 |
0.89 |
0.70 |
0.30 |
2.03 |
| Q4-2017 |
0.89 |
0.73 |
0.30 |
1.94 |
| Q4-2018 |
1.05 |
0.87 |
0.37 |
2.26 |
The attached table gives information on the medicines used in the calculation of the price ratios for the fourth quarter of 2018.
| Measured values |
Number of medicines |
Canadian sales for medicines |
| Mean and median |
381 |
$685.1 million |
| Minimum and maximum |
430 |
$757.6 million |
Note: Results are based on manufacturer ex-factory list prices in the national retail markets.
The analysis was restricted to oral solid generic medicines that had been on the market for at least one year.
Minimum and maximum values were calculated for generic medicines with prices available in at least two foreign markets; mean and median values were calculated for generic medicines with prices available in at least three foreign markets.
* France, Germany, Italy, Sweden, Switzerland, the United Kingdom, and the United States.
Data source: IQVIA MIDAS® Database, October–December 2010 to October–December 2018. All rights reserved.
What Factors Influence the Change in Foreign-to-Canadian Price Ratios?
Four main factors, or drivers, influence the change in foreign-to-Canadian price ratios over time: price changes in Canada; price changes in foreign markets; changes in currency exchanges rates; and changes in the mix or the relative use of generic medicines being compared. Some of these factors act positively, serving to help close the gap between Canadian and foreign prices; others act negatively, widening the gap.
In 2014, median PMPRB7 prices were 31% lower than Canadian prices, but by 2018, this gap had reduced considerably to 13%, representing a positive change of 18%. Declining generic prices in Canada were the primary positive driving force, contributing to closing the gap by 31%. Slightly more favorable foreign exchange rates due to a weakening Canadian dollar also helped to narrow the gap by an additional 4%. However, declining prices in foreign markets increased the gap between Canadian and foreign prices by 10%. The change in the expenditure weights of the medicines included in the calculations and the cross effect from the interaction between drivers also contributed negatively to the overall change.
Over two thirds of the Canadian price decline can be attributed to the generic medicines that were reduced to 10% of their brand reference price.
The results are very similar when average OECD prices are compared to Canadian levels. In 2018, mean OECD and PMPRB7 prices were almost on par with average Canadian prices at 3% and 5% higher, respectively, while median OECD prices were 15% lower than average Canadian levels (Figure 2.3).
Appendix A provides foreign-to-Canadian multilateral price ratios for the 25 top-selling generics included in this analysis.
Figure 2.3 Multilateral foreign-to-Canadian generic price ratios, PMPRB7* and OECD, Q4-2018
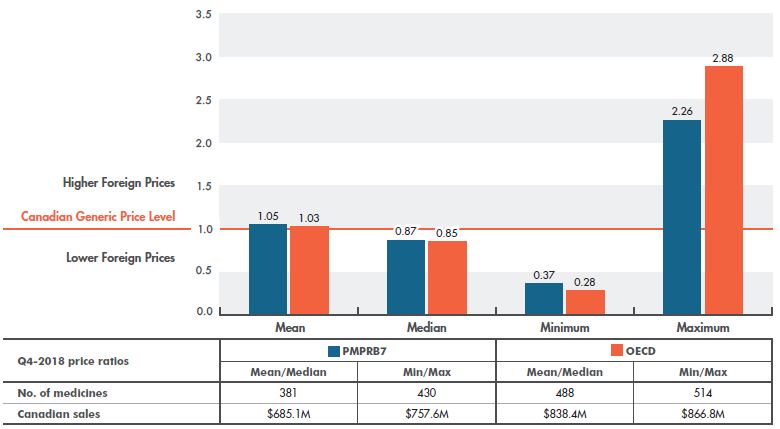
Figure description
This column graph gives the multilateral foreign-to-Canadian price ratios for the seven PMPRB comparator countries (PMPRB7) and the Organisation for Economic Co-operation and Development (OECD) countries for the fourth quarter of 2018. The Canadian generic price level is set to one. Ratios greater than one indicate higher foreign prices, while ratios less than one indicate lower foreign prices.
| Countries |
Minimum |
Mean |
Median |
Maximum |
| PMPRB7 |
0.37 |
1.05 |
0.87 |
2.26 |
| OECD |
0.28 |
1.03 |
0.85 |
2.88 |
The attached table gives information on the medicines used in the calculation of the price ratios for the fourth quarter of 2018.
| Measured values |
Number of medicines |
Canadian sales for medicines |
| PMPRB7 mean and median |
381 |
$685.1 million |
| PMPRB7 minimum and maximum |
430 |
$757.6 million |
| OECD mean and median |
488 |
$838.4 million |
| OECD minimum and maximum |
514 |
$866.8 million |
Note: Results are based on manufacturer ex-factory list prices in the national retail markets.
The analysis was restricted to oral solid generic medicines that had been on the market for at least one year.
Minimum and maximum values were calculated for generic medicines with prices available in at least two foreign markets; mean and median values were calculated for generic medicines with prices available in at least three foreign markets.
* France, Germany, Italy, Sweden, Switzerland, the United Kingdom, and the United States.
Data source: IQVIA MIDAS® Database, October–December 2018. All rights reserved.
Bilateral price comparisons
The recent gains in closing the gap between Canadian and foreign prices are clearly observed in bilateral comparisons with individual countries. Canadian generic prices are now generally on par with prices in France, Germany, and Italy, demonstrating a remarkable improvement over earlier results. In Q4-2010, the average generic prices in these countries were approximately 50% lower than Canadian levels. By Q4-2016, this difference had been reduced to 25%, before the gap was closed in Q4-2018. Smaller gains were made toward aligning Canadian pricing with Sweden and the UK. The US saw even greater price reductions than Canada, narrowing the gap as a result. Prices in Switzerland, which were lower than Canadian levels in Q4-2010, continue to increase, and are now more than double the level in any of the comparator countries.
Figure 2.4 gives the average bilateral foreign-to-Canadian price ratios for the PMPRB7 in Q4-2016 and Q4-2018. The varying degrees of change in the bilateral foreign-to-Canadian price ratios reflect the evolution of generic prices in the respective foreign markets, as well as varying exchange rates. The table below the graph indicates the number of medicines used in the price comparison.
Figure 2.4 Bilateral foreign-to-Canadian generic price ratios, PMPRB7*, Q4-2016 and Q4-2018
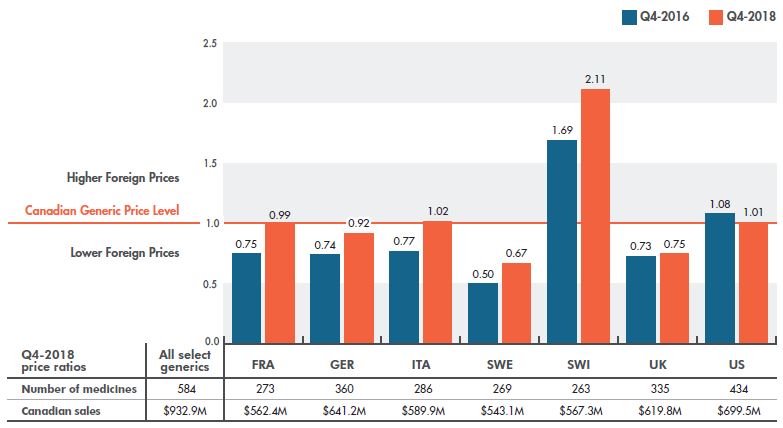
Figure description
This column graph compares the bilateral foreign-to-Canadian price ratios for the seven PMPRB comparator countries in the fourth quarter of 2016 (Q4-2016) and the fourth quarter of 2018 (Q4-2018). The Canadian generic price level is set to one. Ratios greater than one indicate higher foreign prices, while ratios less than one indicate lower foreign prices.
| Country |
Foreign-to-Canadian price ratio for Q4-2016 |
Foreign-to-Canadian price ratio for Q4-2018 |
| France |
0.75 |
0.99 |
| Germany |
0.74 |
0.92 |
| Italy |
0.77 |
1.02 |
| Sweden |
0.50 |
0.67 |
| Switzerland |
1.69 |
2.11 |
| United Kingdom |
0.73 |
0.75 |
| United States |
1.08 |
1.01 |
The attached table gives information on the medicines used in the calculation of the price ratios for the fourth quarter of 2018.
| Country |
Number of medicines |
Canadian sales for medicines |
| Canada (all select generics) |
584 |
$932.9 million |
| France |
273 |
$562.4 million |
| Germany |
360 |
$641.2 million |
| Italy |
286 |
$589.9 million |
| Sweden |
269 |
$543.1 million |
| Switzerland |
263 |
$567.3 million |
| United Kingdom |
335 |
$619.8 million |
| United States |
434 |
$699.5 million |
Note: Results are based on manufacturer ex-factory list prices in the national retail markets.
The analysis was restricted to oral solid generic medicines that had been on the market for at least one year.
* France, Germany, Italy, Sweden, Switzerland, the United Kingdom, and the United States.
Data source: IQVIA MIDAS® Database, October–December 2016 and October–December 2018. All rights reserved.
The prices of generics in Canada were the 11th highest in the OECD in Q4-2018, an improvement over the 7th place ranking in Q4-2016. Generic prices in 10 of the OECD countries were within 10% of Canadian price levels in Q4-2018, suggesting a general trend toward greater price alignment.
Figure 2.5 gives the bilateral foreign-to-Canadian price ratios for the OECD countries. While generic prices in Canada have greatly improved in terms of international ranking, median OECD prices calculated at the medicine level were still 15% lower than Canadian prices, with some other countries—such as the UK, Australia, Sweden, and the Netherlands—having much lower prices.
The number of medicines used to compare Canadian and international levels varies for each individual country, and may have been relatively low in some cases. Although this may influence individual bilateral results, the overall trend is clear.
Figure 2.5 Bilateral foreign-to-Canadian generic price ratios, OECD, Q4-2018
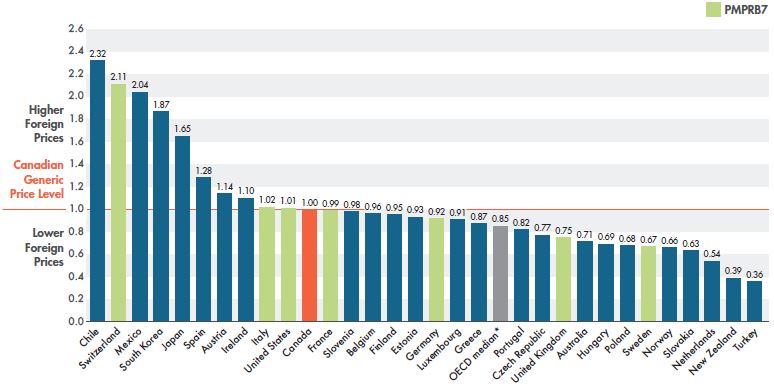
Figure description
This column graph gives the bilateral foreign-to-Canadian price ratios for Organisation for Economic Co-operation and Development countries for the fourth quarter of 2018. The Canadian generic price level is set to one. Ratios greater than one indicate higher foreign prices, while ratios less than one indicate lower foreign prices.
| Country |
Foreign-to-Canadian price ratio |
| Chile |
2.32 |
| Switzerland |
2.11 |
| Mexico |
2.04 |
| South Korea |
1.87 |
| Japan |
1.65 |
| Spain |
1.28 |
| Austria |
1.14 |
| Ireland |
1.10 |
| Italy |
1.02 |
| United States |
1.01 |
| Canada |
1.00 |
| France |
0.99 |
| Slovenia |
0.98 |
| Belgium |
0.96 |
| Finland |
0.95 |
| Estonia |
0.93 |
| Germany |
0.92 |
| Luxembourg |
0.91 |
| Greece |
0.87 |
| OECD median* |
0.85 |
| Portugal |
0.82 |
| Czech Republic |
0.77 |
| United Kingdom |
0.75 |
| Australia |
0.71 |
| Hungary |
0.69 |
| Poland |
0.68 |
| Sweden |
0.67 |
| Norway |
0.66 |
| Slovakia |
0.63 |
| Netherlands |
0.54 |
| New Zealand |
0.39 |
| Turkey |
0.36 |
Note: Results are based on manufacturer ex-factory list prices in the national retail markets.
The analysis was restricted to oral solid generic medicines that had been on the market for at least one year.
* The OECD median does not represent the median result for the individual countries reported in this graph; it is calculated at the medicine level for generics with prices available in at least three foreign markets.
Data source: IQVIA MIDAS® Database, October–December 2018. All rights reserved.
3. International Price Comparisons by Market Segment for Select Generics
Lower-priced generics have made the greatest gains in closing the gap with international levels, with medicines at 10% and 18% of their brand reference price now making up a higher proportion of Canadian sales.
In terms of market size, generics with the highest sales showed the most improvement over the last two years, but still have a higher price differential than those with smaller Canadian markets.
The difference between generic prices in Canada and internationally varies appreciably depending on the market segment examined. Figure 3.1 gives the multilateral foreign-to-Canadian generic price ratios for the PMPRB7 by market size. For generic medicines with annual sales in Canada of $1 to $5 million, Canadian prices were generally on par with the PMPRB7 in Q4-2018, with a 10% higher mean and an 8% lower median foreign price. In contrast, for generic medicines with Canadian sales greater than $10 million, mean foreign prices were approximately the same as Canadian prices and median foreign prices were 15% lower. This suggests that Canada may not be benefiting from the same economy of scale as its comparators.
Despite this discrepancy, over the last two years, higher-selling generics have made the greatest gain toward price alignment (Figure 3.2), reducing the gap between Canadian and median foreign prices from 36% in Q4-2016 to 15% in Q4-2018. The gap between mean foreign and Canadian prices, which was 17% in Q4-2016, was completely eliminated in Q4-2018.
Figure 3.1 Multilateral foreign-to-Canadian generic price ratios by market size, PMPRB7*, Q4-2018
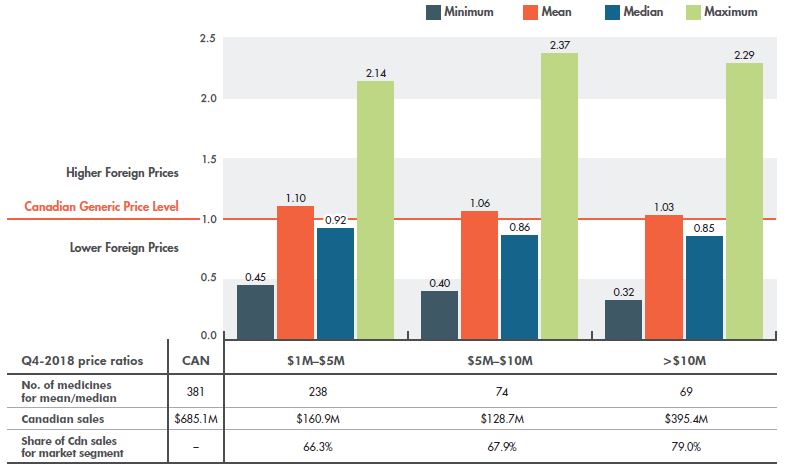
Figure description
This column graph compares the multilateral foreign-to-Canadian price ratios for the seven PMPRB comparator countries in the fourth quarter of 2018 by market size. The markets analyzed comprise generic medicines with Q4-2018 sales of $1 to $5 million; $5 to $10 million; and over $10 million. The Canadian generic price level is set to one. Ratios greater than one indicate higher foreign prices, while ratios less than one indicate lower foreign prices.
| Market size by Canadian sales |
Minimum |
Mean |
Median |
Maximum |
| $1 to $5 million |
0.45 |
1.10 |
0.92 |
2.14 |
| $5 to $10 million |
0.40 |
1.06 |
0.86 |
2.37 |
| Over $10 million |
0.32 |
1.03 |
0.85 |
2.29 |
The attached table gives information on the medicines used in the calculation of the mean and median price ratios for the fourth quarter of 2018.
|
Medicines with sales of 1 to 5 million dollars |
Medicines with sales of 5 to 10 million dollars |
Medicines with sales of over 10 million dollars |
Total |
| Number of medicines used to calculate the mean and median |
238 |
74 |
69 |
381 |
| Canadian sales for medicines |
$160.9 million |
$128.7 million |
$395.4 million |
$685.1 million |
| Share of Canadian sales for market segment |
66.3% |
67.9% |
79.0% |
- |
Note: Results are based on manufacturer ex-factory list prices in the national retail markets.
Market size is based on annual Canadian sales. The analysis was restricted to oral solid generic medicines that had been on the market for at least one year. Minimum and maximum values were calculated for medicines with prices available in at least two foreign markets; mean and median values were calculated for medicines with prices available in at least three foreign markets.
* France, Germany, Italy, Sweden, Switzerland, the United Kingdom, and the United States.
Data source: IQVIA MIDAS® Database, October–December 2018. All rights reserved.
Figure 3.2 Multilateral foreign-to-Canadian generic price ratios by market size, PMPRB7*, Q4-2016 and Q4-2018
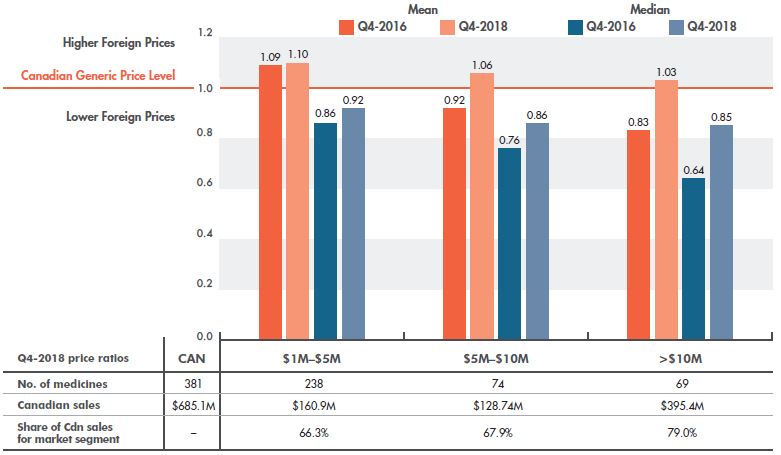
Figure description
This column graph compares the mean and median foreign-to-Canadian price ratios for the seven PMPRB comparator countries for the fourth quarter of 2016 (Q4-2016) and the fourth quarter of 2018 (Q4-2018) by market size. The markets analyzed comprise generic medicines with annual sales of $1 to $5 million; $5 to $10 million; and over $10 million. The Canadian generic price level is set to one. Ratios greater than one indicate higher average foreign prices, while ratios less than one indicate lower foreign prices.
|
Medicines with sales of 1 to 5 million dollars |
Medicines with sales of 5 to 10 million dollars |
Medicines with sales of over 10 million dollars |
| Mean foreign-to-Canadian price ratio for Q4-2016 |
1.09 |
0.92 |
0.83 |
| Mean foreign-to-Canadian price ratio for Q4-2018 |
1.10 |
1.06 |
1.03 |
| Median foreign-to-Canadian price ratio for Q4-2016 |
0.86 |
0.76 |
0.64 |
| Median foreign-to-Canadian price ratio for Q4-2018 |
0.92 |
0.86 |
0.85 |
The attached table gives information on the medicines used in the calculation of the mean and median price ratios for the fourth quarter of 2018.
|
Medicines with sales of 1 to 5 million dollars |
Medicines with sales of 5 to 10 million dollars |
Medicines with sales of over 10 million dollars |
Total |
| Number of medicines used to calculate the mean and median |
238 |
74 |
69 |
381 |
| Canadian sales |
$160.9 million |
$128.7 million |
$395.4 million |
$685.1 million |
| Share of Canadian sales for market segment |
66.3% |
67.9% |
79.0% |
- |
Note: Results are based on manufacturer ex-factory list prices in the national retail markets.
Market size is based on annual Canadian sales. The analysis was restricted to oral solid generic medicines that had been on the market for at least one year. Mean and median values were calculated for medicines with prices available in at least three foreign markets.
* France, Germany, Italy, Sweden, Switzerland, the United Kingdom, and the United States.
Data source: IQVIA MIDAS® Database, October–December 2016 and October–December 2018. All rights reserved.
The recent change in generic pricing in Canada can also be examined in terms of generic-to-brand price ratios. Figure 3.3 reports the cumulative generic unit sales by generic-to-brand price ratio for Q4-2016 and Q4-2018 for the select generics. The shift in the volume of units between Q4-2016 and Q4-2018 demonstrates that the recent policy change greatly affected sales in the lower price ranges, with approximately 60% of the total volume of generic medicines coming in at under 18% of the brand reference price compared to approximately 40% in Q4-2016.
Figure 3.3 Cumulative generic sales by generic-to-brand price ratio, Q4-2016 and Q4-2018
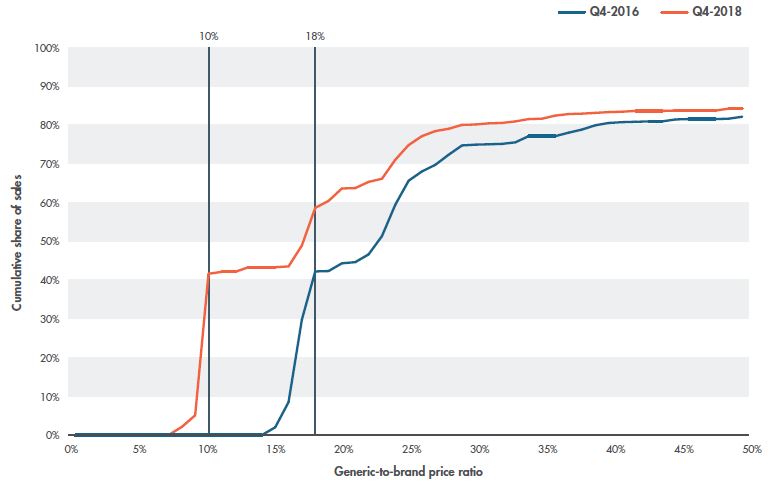
Figure description
This line graph illustrates the cumulative share of generic unit sales for generic-to-brand price ratios from 1% to 50% in Q4-2016 and Q4-2018.
| Generic-to-brand price ratio |
Cumulative share of sales in Q4-2016 |
Cumulative share of sales in Q4-2018 |
| 1% |
0.0% |
0.0% |
| 2% |
0.0% |
0.0% |
| 3% |
0.0% |
0.0% |
| 4% |
0.0% |
0.0% |
| 5% |
0.0% |
0.0% |
| 6% |
0.0% |
0.0% |
| 7% |
0.0% |
0.0% |
| 8% |
0.0% |
2.1% |
| 9% |
0.0% |
5.1% |
| 10% |
0.0% |
41.6% |
| 11% |
0.0% |
42.1% |
| 12% |
0.0% |
42.1% |
| 13% |
0.0% |
43.3% |
| 14% |
0.0% |
43.3% |
| 15% |
2.0% |
43.3% |
| 16% |
8.5% |
43.5% |
| 17% |
29.8% |
48.9% |
| 18% |
42.2% |
58.6% |
| 19% |
42.3% |
60.4% |
| 20% |
44.3% |
63.6% |
| 21% |
44.6% |
63.7% |
| 22% |
46.6% |
65.3% |
| 23% |
51.3% |
66.1% |
| 24% |
59.4% |
71.0% |
| 25% |
65.6% |
74.8% |
| 26% |
68.0% |
77.1% |
| 27% |
69.7% |
78.4% |
| 28% |
72.3% |
79.0% |
| 29% |
74.7% |
80.0% |
| 30% |
74.9% |
80.1% |
| 31% |
75.0% |
80.4% |
| 32% |
75.1% |
80.5% |
| 33% |
75.5% |
80.9% |
| 34% |
77.1% |
81.5% |
| 35% |
77.1% |
81.6% |
| 36% |
77.1% |
82.4% |
| 37% |
78.0% |
82.8% |
| 38% |
78.8% |
82.9% |
| 39% |
79.9% |
83.1% |
| 40% |
80.5% |
83.3% |
| 41% |
80.7% |
83.4% |
| 42% |
80.8% |
83.6% |
| 43% |
80.9% |
83.6% |
| 44% |
80.9% |
83.6% |
| 45% |
81.4% |
83.7% |
| 46% |
81.5% |
83.7% |
| 47% |
81.5% |
83.7% |
| 48% |
81.5% |
83.7% |
| 49% |
81.6% |
84.2% |
| 50% |
82.1% |
84.2% |
Note: Results are based on manufacturer ex-factory list prices in the entire national retail market. The analysis was restricted to oral solid generic medicines that had been on the market for at least one year.
Data source: IQVIA MIDAS® Database, October–December 2016 and October–December 2018. All rights reserved.
Among the market segments targeted by the recent policy initiative, the greatest change in foreign-to-Canadian differentials can be seen in medicines reduced to 10% of their brand reference price. As shown in Figure 3.4, median Canadian prices are now on par with foreign prices after closing a considerable gap of 40% between Q4-2016 and Q4-2018, while mean foreign prices in Q4-2018 were 25% higher than Canadian levels. For generics reduced to 18% of their brand price, the relative change between pricing in 2016 and 2018 was very similar to the change seen for all generics. These results clearly demonstrate the impact of the most recent agreement between the pCPA and CGPA.
Figure 3.4 Multilateral foreign-to-Canadian price ratios by pricing tier, PMPRB7*, Q4-2016 and Q4-2018
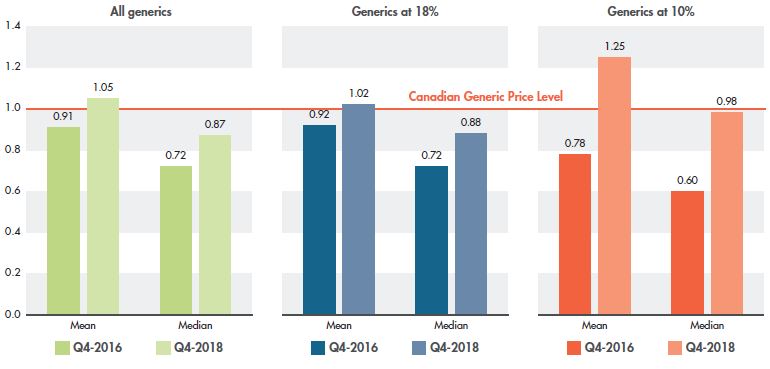
Figure description
This set of three column graphs gives the mean and median foreign-to-Canadian price ratios for Q4-2016 and Q4-2018 for all select generic medicines in Canada as well as for those at 18% and 10% of their brand-name reference price.
| |
Mean Q4-2016 |
Mean Q4-2018 |
Median Q4-2016 |
Median Q4-2018 |
| All generics |
0.91 |
1.05 |
0.72 |
0.87 |
| Generics at 18% |
0.92 |
1.02 |
0.72 |
0.88 |
| Generics at 10% |
0.78 |
1.25 |
0.60 |
0.98 |
Note: Results are based on manufacturer ex-factory list prices in the national retail markets.
The analysis was restricted to oral solid generic medicines that had been on the market for at least one year. Mean and median values were calculated for medicines with prices available in at least three foreign markets.
* France, Germany, Italy, Sweden, Switzerland, the United Kingdom and the United States.
Data source: IQVIA MIDAS® Database, October–December 2016 and October–December 2018. All rights reserved.
References
CIHI. 2016. Prescribed Drug Spending in Canada, 2018: A Focus on Public Drug Programs. Ottawa: Canadian Institute for Health Information. Available: https://www.cihi.ca/en/health-spending/2018/prescribed-drug-spending-in-canada
PMPRB. 2010a. Generic Drugs in Canada: Price Trends and International Price Comparisons, 2007. Ottawa: Patented Medicine Prices Review Board. Available: http://www.pmprb-cepmb.gc.ca/view.asp?ccid=868&lang=en
PMPRB. 2010b. Generic Drugs in Canada: Market Structure — Trends and Impacts. Ottawa: Patented Medicine Prices Review Board. Available: http://www.pmprb-cepmb.gc.ca/view.asp?ccid=949&lang=en
PMPRB. 2011. Generic Drugs in Canada: International Price Comparisons and Potential Cost Savings. Ottawa: Patented Medicine Prices Review Board. Available: http://www.pmprb-cepmb.gc.ca/view.asp?ccid=870&lang=en
PMPRB. 2013. Analytical Snapshot: International Generic Price Comparison, Early 2011. Ottawa: Patented Medicine Prices Review Board. Available: http://www.pmprb-cepmb.gc.ca/view.asp?ccid=487&lang=en
PMPRB. 2014. Generic Drugs in Canada, 2013. Ottawa: Patented Medicine Prices Review Board. Available: http://www.pmprb-cepmb.gc.ca/view.asp?ccid=1122&lang=en
PMPRB. 2015. Private Drug Plans in Canada. Part 1: Generic Market 2005–2013. Ottawa: Patented Medicine Prices Review Board. Available: http://www.pmprb-cepmb.gc.ca/view.asp?ccid=1200&lang=en
PMPRB. 2016. Generics360: Generic Drugs in Canada, 2014. Ottawa: Patented Medicine Prices Review Board. Available: http://www.pmprb-cepmb.gc.ca/view.asp?ccid=1233&lang=en
PMPRB. 2017. Poster: Generic Drugs in Canada, 2015. Ottawa: Patented Medicine Prices Review Board. Available: http://www.pmprb-cepmb.gc.ca/view.asp?ccid=1301&lang=en
PMPRB. 2018a. Generics360: Generic Drugs in Canada, 2016. Ottawa: Patented Medicine Prices Review Board. Available: http://www.pmprb-cepmb.gc.ca/view.asp?ccid=1347&lang=en
PMPRB. 2018b. Annual Report 2017. Ottawa: Patented Medicine Prices Review Board. Available: http://www.pmprb-cepmb.gc.ca/view.asp?ccid=1380&lang=en
Appendix A: Multilateral Price Comparison at Ingredient Level
Table A1 lists the 25 top-selling generics in Canada ranked in order of sales, along with the number of PMPRB7 countries with recorded sales of each medicinal ingredient in Q4-2018. Multilateral price comparisons are based on the highest-selling strength and form of each individual generic in Canada.
Table A1 Multilateral foreign-to-Canadian generic price ratios for top 25 generics in Canada, PMPRB7*, Q4-2018
This table gives multilateral comparisons of the foreign-to-Canadian price ratios for the 25 top-selling generic medicines in Canada in the fourth quarter of 2018. The Canadian generic price level is set to one. Ratios greater than one indicate higher average foreign prices, while ratios less than one indicate lower foreign prices.
| Top-selling generics in Canada |
Highest-selling strength and form in Canada |
Canadian price |
Foreign-to-Canadian price ratio |
| Rank |
Generic |
Number of countries with sales |
Minimum |
Maximum |
Median |
Mean |
| 1 |
Atorvastatin† |
7 |
Film-ctd tabs, 20 mg |
0.2148 |
0.20 |
2.96 |
0.48 |
0.88 |
| 2 |
Pantoprazole† |
7 |
Enteric-ctd tabs, 40 mg |
0.1952 |
0.26 |
2.41 |
0.93 |
1.09 |
| 3 |
Rosuvastatin† |
4 |
Film-ctd tabs, 10 mg |
0.1336 |
0.67 |
3.07 |
1.86 |
1.86 |
| 4 |
Pregabalin‡ |
6 |
Capsules, 75 mg |
0.2984 |
0.33 |
1.66 |
1.16 |
1.11 |
| 5 |
Oxycodone |
7 |
Film-ctd tabs ret, 40 mg |
2.1774 |
0.36 |
2.26 |
0.64 |
0.92 |
| 6 |
Escitalopram‡ |
7 |
Film-ctd tabs, 10 mg |
0.4227 |
0.14 |
1.04 |
0.37 |
0.45 |
| 7 |
Amlodipine† |
7 |
Tabs, 5 mg |
0.1331 |
0.12 |
2.80 |
0.23 |
0.73 |
| 8 |
Duloxetine |
7 |
Other capsules, 60 mg |
0.9643 |
0.24 |
1.21 |
0.27 |
0.55 |
| 9 |
Tadalafil |
5 |
Film-ctd tabs, 20 mg |
12.0354 |
0.31 |
0.77 |
0.54 |
0.54 |
| 10 |
Levothyroxine sodium |
7 |
Tabs, 75 μg |
0.0949 |
0.42 |
3.71 |
0.69 |
1.25 |
| 11 |
Methylphenidate |
7 |
Ret capsules, 40 mg |
2.3378 |
0.63 |
1.61 |
1.05 |
1.05 |
| 12 |
Progesterone |
6 |
Capsules, 100 mg |
1.2263 |
0.13 |
0.55 |
0.21 |
0.24 |
| 13 |
Zopiclone† |
6 |
Film-ctd tabs, 7.5 mg |
0.2828 |
0.15 |
1.43 |
0.70 |
0.69 |
| 14 |
Venlafaxine† |
7 |
Ret capsules, 75 mg |
0.1824 |
0.44 |
3.61 |
1.41 |
1.55 |
| 15 |
Valacyclovir‡ |
7 |
Film-ctd tabs, 500 mg |
0.6266 |
0.44 |
4.34 |
1.70 |
1.79 |
| 16 |
Sildenafil |
7 |
Film-ctd tabs, 100 mg |
8.2061 |
0.17 |
1.08 |
0.52 |
0.58 |
| 17 |
Gabapentin† |
7 |
Capsules, 300 mg |
0.1007 |
0.62 |
4.41 |
2.31 |
2.16 |
| 18 |
Metformin† |
7 |
Film-ctd tabs, 500 mg |
0.0245 |
0.74 |
2.53 |
1.71 |
1.61 |
| 19 |
Quetiapine† |
7 |
Film-ctd tabs, 25 mg |
0.0493 |
0.98 |
7.42 |
1.60 |
2.99 |
| 20 |
Fluoxetine‡ |
7 |
Capsules, 20 mg |
0.3302 |
0.13 |
1.28 |
0.52 |
0.58 |
| 21 |
Lansoprazole |
7 |
Other capsules, 30 mg |
0.4602 |
0.11 |
1.35 |
0.59 |
0.59 |
| 22 |
Ondansetron |
7 |
Film-ctd tabs, 8 mg |
5.0597 |
0.24 |
1.46 |
1.13 |
0.91 |
| 23 |
Clozapine |
7 |
Tabs, 100 mg |
2.6411 |
0.19 |
0.37 |
0.24 |
0.26 |
| 24 |
Amoxicillin |
7 |
Capsules, 500 mg |
0.3365 |
0.22 |
0.66 |
0.23 |
0.35 |
| 25 |
Montelukast‡ |
7 |
Film-ctd tabs, 10 mg |
0.8420 |
0.15 |
1.17 |
0.55 |
0.59 |
Note: The list of 25 top-selling generics reported reflects the ranking at the Canadian national level and includes public, private, and out-of-pocket market segments.
Only the leading formulations for each generic are represented. Minimum and maximum values were calculated for medicines with prices available in at least two foreign markets; mean and median values were calculated for medicines with prices available in at least three foreign markets. Five generics were excluded from the list due to lack of available data to calculate mean and median: esomeprazole, sertraline‡, bupropion, nifedipine, and ramipril†.
For presentation purposes, the scale reporting the foreign-to-Canadian price ratio was limited to 4.0; observations higher than this value are not depicted here.
* France, Germany, Italy, Sweden, Switzerland, the United Kingdom and the United States.
† Generics at 10% of their brand reference price as per the pCPA–CGPA agreement.
‡ Generics at 18% of their brand reference price as per the pCPA–CGPA agreement.
Data source: IQVIA MIDAS® Database, October–December 2018. All rights reserved.