What is the “Expense” for Expensive Drugs for Rare Diseases?
Elena Lungu – Manager Policy Development, PMPRB
Presentation in CADTH Symposium
April 2019
PDF - 780 KB
Less than 1% of the Canadian population accounts for 42% of patented medicine sales
Between 2006 and 2017, the number of medicines in Canada with an annual per beneficiary cost of at least $10K increased by over 200% and now account for 42% of patented medicine sales.
Share of sales for high-cost patented medicines, 2006 to 2017
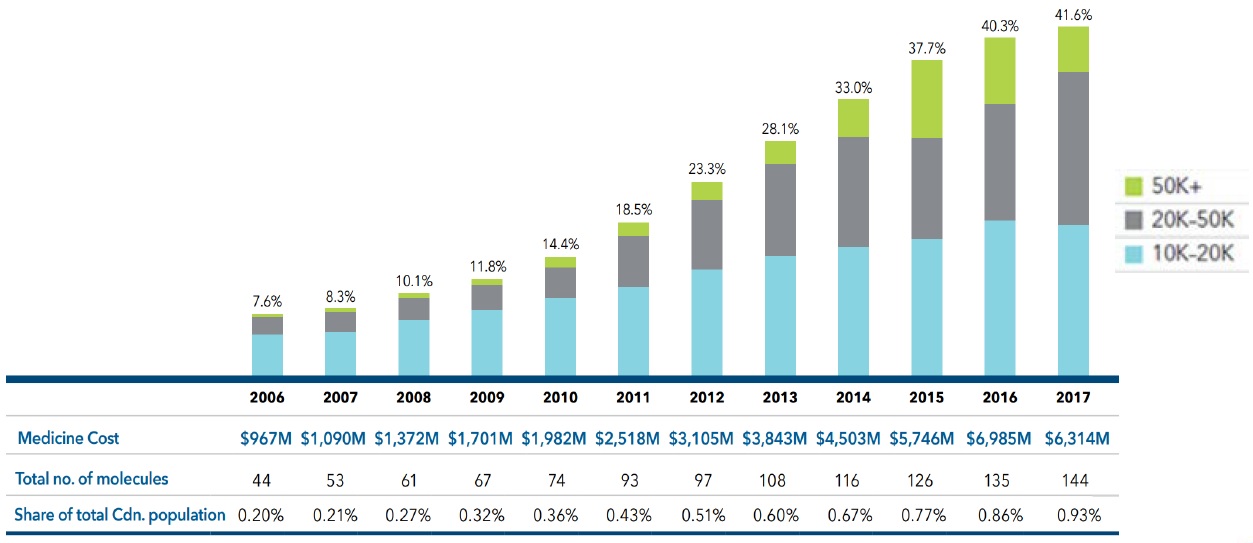
Figure description
This bar graph depicts the high-cost medicine share of total patented medicine sales per year from 2006 to 2017. The bars are subdivided into three bands based on average annual costs: $10 to $20 thousand; $20 to $50 thousand; and greater than $50 thousand.
The table below the graph gives additional information including the medicine cost, the total number of molecules, the estimated treatment population as a share of total Canadian population for each year.
| Year |
Share of sales for medicines costing $10 to $20 thousand |
Share of sales for medicines
costing $20 to $50 thousand |
Share of sales for medicines
costing greater than $50 thousand |
Total share of sales
of high-cost medicines |
Medicine cost in millions of dollars |
Total number of molecules |
Share total Canadian population |
| 2006 |
5.2% |
2.1% |
0.3% |
7.6% |
$967 |
44 |
0.20% |
| 2007 |
5.5% |
2.4% |
0.4% |
8.3% |
$1,090 |
53 |
0.21% |
| 2008 |
6.9% |
2.7% |
0.5% |
10.1% |
$1,372 |
61 |
0.27% |
| 2009 |
8.1% |
3.0% |
0.7% |
11.8% |
$1,701 |
67 |
0.32% |
| 2010 |
9.6% |
3.5% |
1.3% |
14.4% |
$1,982 |
74 |
0.36% |
| 2011 |
10.8% |
6.0% |
1.7% |
18.5% |
$2,518 |
93 |
0.43% |
| 2012 |
12.9% |
8.2% |
2.2% |
23.3% |
$3,105 |
97 |
0.51% |
| 2013 |
14.5% |
10.9% |
2.7% |
28.1% |
$3,843 |
108 |
0.60% |
| 2014 |
15.6% |
12.9% |
4.5% |
33.0% |
$4,503 |
116 |
0.67% |
| 2015 |
16.5% |
12.0% |
9.2% |
37.7% |
$5,746 |
126 |
0.77% |
| 2016 |
18.7% |
13.8% |
7.8% |
40.3% |
$6,985 |
135 |
0.86% |
| 2017 |
18.2% |
18.1% |
5.3% |
41.6% |
$6,314 |
144 |
0.93% |
Figure source: PMPRB Annual Report, 2017.
Data source: PMPRB; IQVIA Private Pay Direct Drug Plan Database, 2006‒2017.
Is high-cost becoming the norm for new drug launches?
- Orphan medicines are increasingly dominating the market, accounting for nearly half of new launches
- Over one quarter of the new medicines in 2016 and 2017 were developed for the treatment of cancer and many came with a high cost, averaging approximately $13,700 for a 28-day treatment
- The majority of non-oncology medicines launched in 2016 and 2017 were high-cost, with 31 of the 37 with available treatment costs exceeding $10,000 annually
New medicines launched in Canada and the PMPRB7, 2009 to 2017
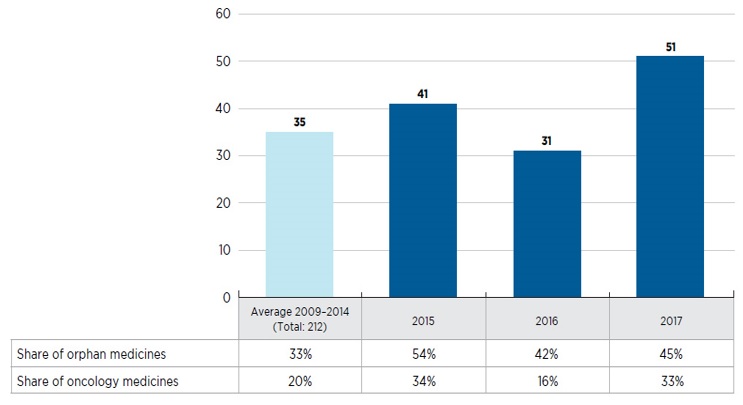
Figure description
This bar graph depicts the number of new medicines launched in Canada and the PMPRB7 from 2009 to 2017. A yearly average is provided for the 212 medicines introduced between 2009 and 2014. A table below the graph shows the share of orphan and oncology medicines for each year.
| |
Average 2009 to 2014 |
2015 |
2016 |
2017 |
| Number of new medicines |
35 |
41 |
31 |
51 |
| Share of oncology medicines |
20% |
34% |
16% |
33% |
| Share of orphan medicines |
33% |
54% |
42% |
45% |
US Food and Drug Administration’s Center for Drug Evaluation and Research (CDER) New Drugs Program: 2018 Update
In calendar year 2018 so far, CDER has approved 55 new molecular entities, including 31 orphan drugs. For the first time ever, the majority of new molecular entities approved are orphan drugs to treat rare diseases.
Increasing number of EDRDs being introduced
79 EDRDs approved in Canada by the end of 2018
Defined as having an orphan designation and an estimated treatment costs exceeding $100,000 per year for non-cancer drugs, and $7,500 per 28 days for cancer drugs
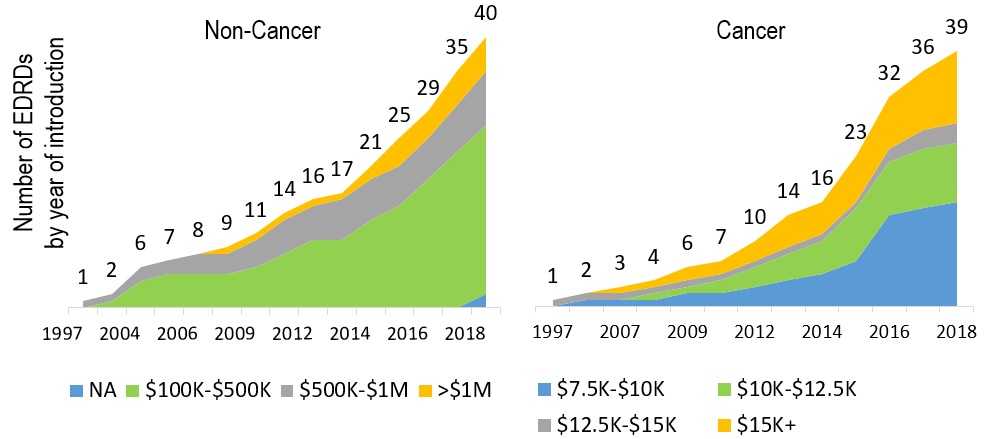
Figure description
These two graphs present the cumulative number of expensive drugs for rare diseases approved in Canada between 1997 and 2018. The left-hand graph give the number of non-cancer medicines broken out by annual estimated treatment cost bands: $100 to $500 thousand; $500 thousand to $1 million; and greater than $1million. Cumulative totals are given for 1997 and then from 2002 to 2018.
The right-hand graph give the number of cancer medicines broken out by 28-day estimated treatment cost bands: $7.5 to $10 thousand; $10 to $12.5 thousand; and $12.5 to $15 thousand; and greater than $15 thousand. Cumulative totals are given for 1997 and then from 2005 to 2018.
Non-cancer medicines: Number of medicines by annual treatment cost
|
Year |
Not available |
$100 to $500 thousand |
$500 thousand to $1 million |
Greater than $1 million |
Cumulative total |
| 1997 |
0 |
0 |
1 |
0 |
1 |
| 2002 |
0 |
1 |
1 |
0 |
2 |
| 2004 |
0 |
4 |
2 |
0 |
6 |
| 2005 |
0 |
5 |
2 |
0 |
7 |
| 2006 |
0 |
5 |
3 |
0 |
8 |
| 2007 |
0 |
5 |
3 |
1 |
9 |
| 2009 |
0 |
6 |
4 |
1 |
11 |
| 2010 |
0 |
8 |
5 |
1 |
14 |
| 2012 |
0 |
10 |
5 |
1 |
16 |
| 2013 |
0 |
10 |
6 |
1 |
17 |
| 2014 |
0 |
13 |
6 |
2 |
21 |
| 2015 |
0 |
15 |
6 |
4 |
25 |
| 2016 |
0 |
19 |
6 |
4 |
29 |
| 2017 |
0 |
23 |
7 |
5 |
35 |
| 2018 |
2 |
25 |
8 |
5 |
40 |
Cancer medicines: Number of medicines by 28-day treatment cost
|
Year |
$7.5 to $10 thousand |
$10 to $12.5 thousand |
$12.5 to $15 thousand |
Greater than $15 thousand |
Cumulative total |
| 1997 |
0 |
0 |
1 |
0 |
1 |
| 2005 |
1 |
0 |
1 |
0 |
2 |
| 2007 |
1 |
0 |
1 |
1 |
3 |
| 2008 |
1 |
1 |
1 |
1 |
4 |
| 2009 |
2 |
1 |
1 |
2 |
6 |
| 2010 |
2 |
2 |
1 |
2 |
7 |
| 2012 |
3 |
3 |
1 |
3 |
10 |
| 2013 |
4 |
4 |
1 |
5 |
14 |
| 2014 |
5 |
5 |
1 |
5 |
16 |
| 2015 |
7 |
8 |
1 |
7 |
23 |
| 2016 |
14 |
8 |
2 |
8 |
32 |
| 2017 |
15 |
9 |
3 |
9 |
36 |
| 2018 |
16 |
9 |
3 |
11 |
39 |
Source: PMPRB.
EDRD – fastest growing market segment
EDRD share of pharmaceutical sales
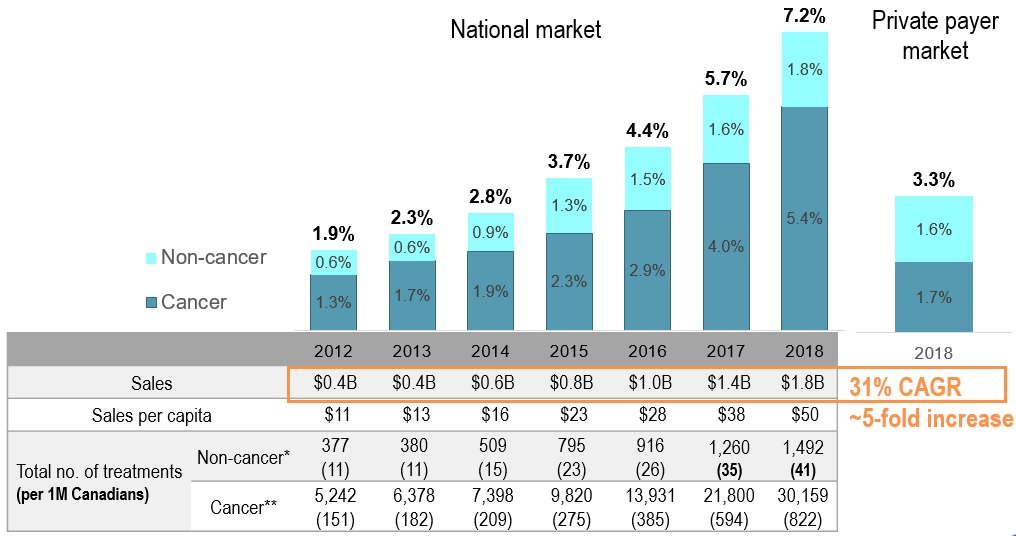
Figure description
This bar graph gives the expensive drugs for rare diseases share of pharmaceutical sales for the Canadian national market from 2012 to 2018. A table below the graph gives additional information on sales, which increased five-fold over the time period (with a compound annual growth rate of 31%), as well as the cancer versus non-cancer medicine split.
The expensive drugs for rare diseases share of pharmaceutical sales is also provided for the private payer market in 2018: 1.7% cancer medicines and 1.6% non-cancer medicines, for a total of 3.3%.
For the National Market
| |
2012 |
2013 |
2014 |
2015 |
2016 |
2017 |
2018 |
| Share of pharmaceutical sales: cancer medicines |
1.3% |
1.7% |
1.9% |
2.3% |
2.9% |
4.0% |
5.4% |
| Share of pharmaceutical sales: non-cancer medicines |
0.6% |
0.6% |
0.9% |
1.3% |
1.5% |
1.6% |
1.8% |
| Share of pharmaceutical sales: total expensive medicines |
1.9% |
2.3% |
2.8% |
3.7% |
4.4% |
5.7% |
7.2% |
| Total sales (billions of dollars) |
$0.4 |
$0.4 |
$0.6 |
$0.8 |
$1.0 |
$1.4 |
$1.8 |
| Sales per capita |
$11 |
$13 |
$16 |
$23 |
$28 |
$38 |
$50 |
| Total no. of treatments for non-cancer medicines (number per 1 million Canadians) |
377
(11) |
380
(11) |
509
(15) |
795
(23) |
916
(26) |
1,260
(35) |
1,492
(41) |
| Total no. of treatments for cancer medicines (number per 1 million Canadians) |
5,242
(151) |
6,378
(182) |
7,398
(209) |
9,820
(275) |
13,931
(385) |
21,800
(594) |
30,159
(822) |
*For non-cancer, the total number of treatments were estimated based on the annual treatment cost
**For cancer, the total number of treatments were estimated based on the highest of (1) the average cost per beneficiary in private drug plans, or (2) the estimated cost of four courses of 28-day treatment.
Data source: PMPRB, MIDAS™ database, 2017, IQVIA. All rights reserved, IQVIA Private Pay Direct Drug Plan Database, 2018.
EDRD spending in Canada above international norms
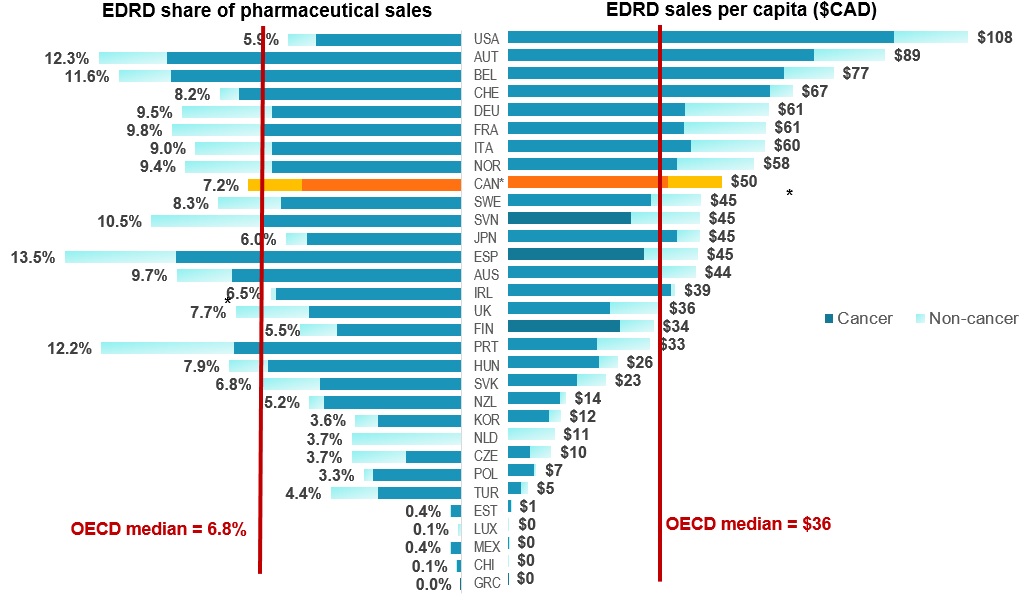
Figure description
The left side of this butterfly graph gives the expensive drugs for rare diseases share of pharmaceutical sales in each of the OECD countries, while the right side gives the sales per capita.
| Country | Sales per capita in Canadian dollars | Share of pharmaceutical sales |
| Cancer | Non-cancer | Total | Cancer | Non-cancer | Share |
| Greece |
$ 0.03 |
$ - |
$ 0.03 |
0.0% |
0.0% |
0.0% |
| Chile |
$ 0.14 |
$ 0.01 |
$ 0.15 |
0.1% |
0.0% |
0.1% |
| Mexico |
$ 0.20 |
$ 0.01 |
$ 0.20 |
0.4% |
0.0% |
0.4% |
| Luxembourg |
$ - |
$ 0.41 |
$ 0.41 |
0.0% |
0.1% |
0.1% |
| Estonia |
$ 0.67 |
$ 0.01 |
$ 0.67 |
0.4% |
0.0% |
0.4% |
| Turkey |
$ 3.02 |
$ 1.71 |
$ 4.73 |
2.8% |
1.6% |
4.4% |
| Poland |
$ 6.07 |
$ 0.64 |
$ 6.71 |
3.0% |
0.3% |
3.3% |
| Czech Republic |
$ 5.21 |
$ 5.06 |
$ 10.27 |
1.9% |
1.8% |
3.7% |
| Netherlands |
$ - |
$ 11.00 |
$ 11.00 |
0.0% |
3.7% |
3.7% |
| South Korea |
$ 9.78 |
$ 2.63 |
$ 12.41 |
2.8% |
0.8% |
3.6% |
| New Zealand |
$ 12.27 |
$ 1.36 |
$ 13.63 |
4.7% |
0.5% |
5.2% |
| Slovakia |
$ 16.21 |
$ 6.85 |
$ 23.06 |
4.8% |
2.0% |
6.8% |
| Hungary |
$ 21.47 |
$ 4.36 |
$ 25.83 |
6.6% |
1.3% |
7.9% |
| Portugal |
$ 21.06 |
$ 12.36 |
$ 33.42 |
7.7% |
4.5% |
12.2% |
| Finland |
$ 26.32 |
$ 7.96 |
$ 34.28 |
4.2% |
1.3% |
5.5% |
| United Kingdom |
$ 24.09 |
$ 11.72 |
$ 35.81 |
5.2% |
2.5% |
7.7% |
| Ireland |
$ 38.44 |
$ 0.93 |
$ 39.37 |
6.3% |
0.2% |
6.5% |
| Australia |
$ 35.67 |
$ 8.52 |
$ 44.19 |
7.8% |
1.9% |
9.7% |
| Spain |
$ 32.11 |
$ 12.57 |
$ 44.68 |
9.7% |
3.8% |
13.5% |
| Japan |
$ 39.75 |
$ 5.33 |
$ 45.08 |
5.3% |
0.7% |
6.0% |
| Slovenia |
$ 28.93 |
$ 16.18 |
$ 45.11 |
6.8% |
3.8% |
10.5% |
| Sweden |
$ 33.64 |
$ 11.83 |
$ 45.48 |
6.1% |
2.1% |
8.3% |
| Canada |
$ 37.63 |
$ 12.69 |
$ 50.32 |
5.4% |
1.8% |
7.2% |
| Norway |
$ 39.67 |
$ 18.26 |
$ 57.93 |
6.4% |
3.0% |
9.4% |
| Italy |
$ 42.95 |
$ 17.47 |
$ 60.42 |
6.4% |
2.6% |
9.0% |
| France |
$ 41.31 |
$ 19.25 |
$ 60.56 |
6.7% |
3.1% |
9.8% |
| Germany |
$ 41.53 |
$ 19.80 |
$ 61.33 |
6.4% |
3.1% |
9.5% |
| Switzerland |
$ 61.55 |
$ 5.37 |
$ 66.91 |
7.6% |
0.7% |
8.2% |
| Belgium |
$ 64.85 |
$ 11.69 |
$ 76.55 |
9.9% |
1.8% |
11.6% |
| Austria |
$ 71.91 |
$ 16.74 |
$ 88.65 |
10.0% |
2.3% |
12.3% |
| USA |
$ 90.65 |
$ 17.52 |
$ 108.17 |
4.9% |
1.0% |
5.9% |
| OECD median |
– |
– |
$36 |
– |
– |
6.8% |
Data source: MIDAS™ database, IQVIA. All rights reserved
Note: Results based on list prices and not reflective of managed entry agreements
* Estimated by complementing MIDAS™ results with PMPRB, and IQVIA Private Pay Direct Drug Plan Databases
Hypothesis: Rare disease drugs are expensive, because of the need to recuperate costs with fewer patients
Distribution of patented drugs by highest sales* in the first 5 years
| |
Share of drugs with $10 to $50 million in sales |
Share of drugs with $50 to $100 million in sales |
Share of drugs with greater than $100 million in sales |
Total share of drugs with sales greater than $10 million in sales |
Average sales per drug |
| Lower-cost drugs, less than $10 thousand annually |
25% |
5% |
5% |
35% |
$21 million |
| Higher-cost drugs, equal to or greater than $10 thousand annually |
39% |
11% |
9% |
59% |
$39 million |
| EDRDs ** |
34% |
6% |
10% |
50% |
$29 million |
* In 2018 dollars; drugs introduced in the last 20 years.
** EDRDs include drugs with more than 2 years of sales.
Note: Results not reflective of managed entry agreements.
Alternative hypothesis: Higher prices = higher sales
- An EDRD is more likely to result in high sales than a lower-cost drug
- A higher-cost drug is even more likely to result in high sales than a lower-cost drug
"Medicines for orphan diseases, despite smaller patient populations, have the commercial potential to generate revenue for the originator companies at least as great as for non-orphan medicines." World Health Organization’s Access to Medicines, Vaccines and Pharmaceuticals Technical Report Pricing of Cancer Medicines and its Impacts