The Oncology Drug Market: A High-Growth, High-Price Therapeutic Area
PDF - 546 KB
Over the past decade, the Canadian oncology market has been characterized by significant sales growth and increasing treatment costs, giving rise to concerns around affordability and access. Sales have almost tripled, treatment costs have nearly doubled, and drugs with 28-day treatment costs over $10,000 now represent one third of total sales. The predominance of oncology medicines in the pipeline suggests that these trends are likely to continue.
This analysis examines the trends in availability, pricing, treatment costs, and sales in Canadian and international oncology markets from 2009 to 2018. International markets examined include the Organisation for Economic Co-operation and Development (OECD) members, with a focus on the seven countries the PMPRB considers in reviewing the prices of patented medicines (PMPRB7): France, Germany, Italy, Sweden, Switzerland, the United Kingdom (UK), and the United States (US).
1. Oncology sales have almost tripled over the last decade
Canada had the second highest rate of growth in oncology sales among the PMPRB7, following the UK. Canadian sales reached $3.2 billion in 2018, up from $1.2 billion in 2009, for a compound annual growth rate of 12%. The rate of increase was much more pronounced in the last two years, at 17% and 23%, respectively.
These rates of change have far exceeded the growth in sales for the overall pharmaceutical market in Canada. As a result, the oncology share of total prescription pharmaceutical sales more than doubled from 6% to 13%. Nearly one third of the growth in pharmaceutical sales in Canada over the past 10 years can be attributed to oncology medicines.
The Canadian oncology market is also highly concentrated, with the top 10 medicines accounting for 58% of sales.
Oncology sales index, Canada and the PMPRB7, 2009 to 2018
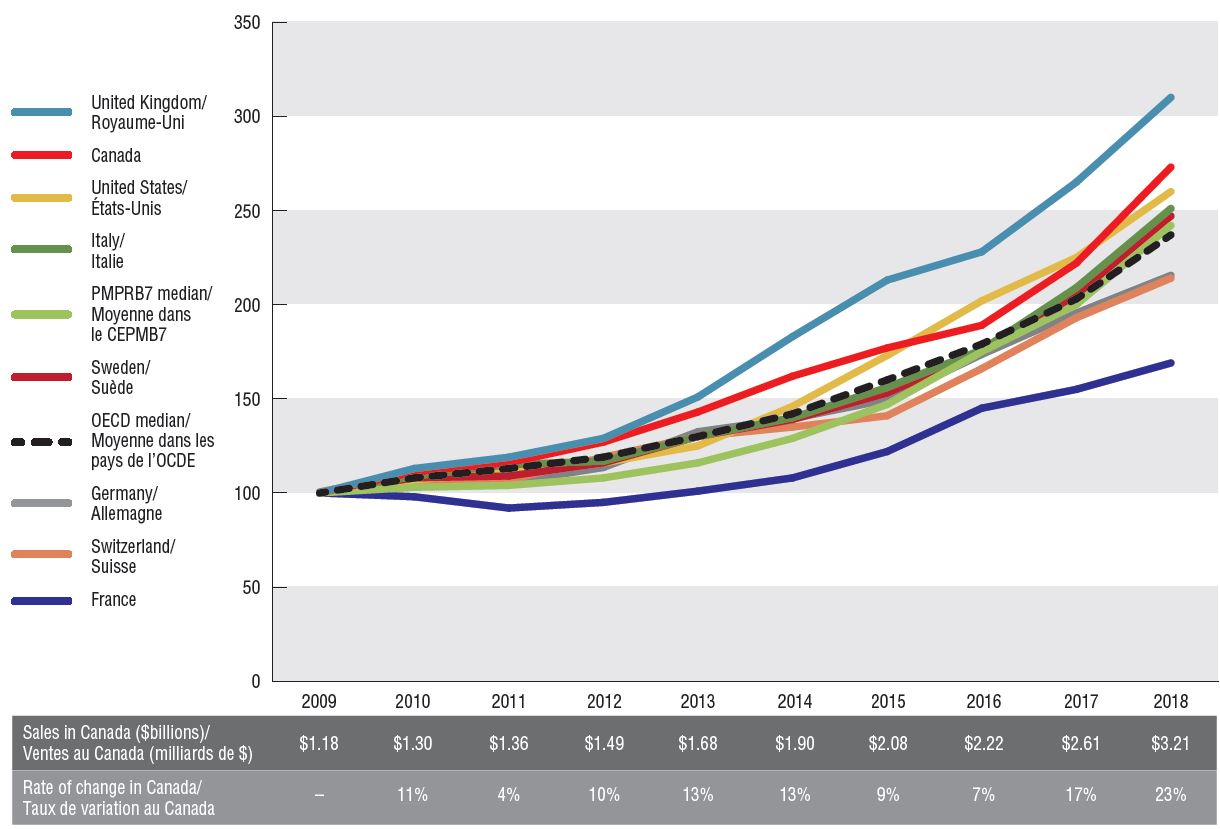
Figure description
This line graph gives an index of all oncology sales in Canada and each of the PMPRB7 countries from 2009 to 2018, with sales in 2009 set to a value of one. Indices are also given for the PMPRB7 and Organisation for Economic Co-operation and Development medians. The total sales in Canada, as well as the percent change from the 2009 Canadian sales are listed annually in a table below the graph.
| |
2009 |
2010 |
2011 |
2012 |
2013 |
2014 |
2015 |
2016 |
2017 |
2018 |
| Sales in Canada, in billions of dollars |
$1.18 |
$1.30 |
$1.36 |
$1.49 |
$1.68 |
$1.90 |
$2.08 |
$2.22 |
$2.61 |
$3.21 |
| Rate of change in Canada |
– |
11% |
4% |
10% |
13% |
13% |
9% |
7% |
17% |
23% |
| United Kingdom |
100 |
113 |
119 |
129 |
151 |
183 |
213 |
228 |
265 |
310 |
| Canada |
100 |
111 |
116 |
127 |
143 |
162 |
177 |
189 |
222 |
273 |
| United States |
100 |
107 |
111 |
116 |
125 |
146 |
173 |
202 |
225 |
260 |
| Italy |
100 |
109 |
115 |
117 |
130 |
140 |
156 |
176 |
209 |
251 |
| PMPRB7 median |
100 |
108 |
109 |
116 |
130 |
139 |
153 |
175 |
205 |
247 |
| Sweden |
100 |
103 |
104 |
108 |
116 |
129 |
147 |
175 |
200 |
242 |
| Organisation for Economic Co-operation and Development median |
100 |
108 |
113 |
119 |
130 |
142 |
160 |
179 |
203 |
237 |
| Germany |
100 |
110 |
105 |
113 |
132 |
139 |
149 |
173 |
195 |
215 |
| Switzerland |
100 |
105 |
107 |
119 |
130 |
135 |
141 |
166 |
193 |
214 |
| France |
100 |
98 |
92 |
95 |
101 |
108 |
122 |
145 |
155 |
169 |
Notes: Sales were projected for Canadian oncology drugs for which data was not available. Indexed figures are reported in local currency with the sales in 2009 set to a value of 100.
2. Treatment costs for oncology medicines have nearly doubled since 2009
A heightened focus on oncology drug development in recent years has resulted in important new medicines being introduced at increasingly higher treatment costs. The sales-weighted average treatment cost per 28-day cycle grew from $4,000 to $7,600 over the last decade. This was driven in part by an influx of new higher-cost oncology medicines, with median levels rising from $5,200 in 2009 to $11,500 in 2018. Medicines with 28-day treatment costs exceeding $10,000 now account for $1 billion in sales in Canada, or nearly one third of the oncology market.
Sales and treatment costs of oncology medicines, Canada, 2009 to 2018
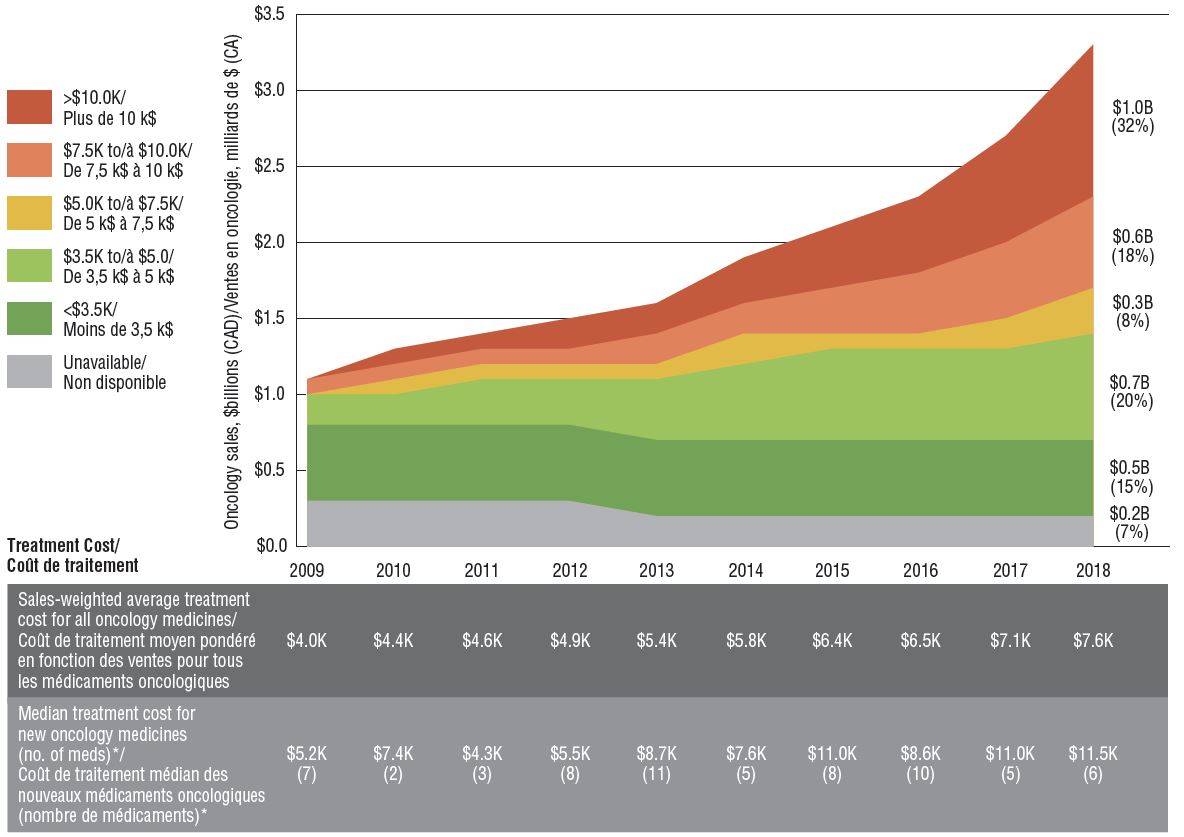
Figure description
This area graph illustrates the distribution of oncology sales by treatment cost for each year from 2009 to 2018. Treatment costs are divided into the following ranges: less than $3,500; $3,500 to $5,000; $5000 to $7,500; $7,500 to $10,000; and greater than $10,000. The share of sales for which treatment costs were unavailable is also shown. Sales for each range in 2018 are given in billions of Canadian dollars, and as a share of total oncology sales.
| |
2009 |
2010 |
2011 |
2012 |
2013 |
2014 |
2015 |
2016 |
2017 |
2018 (sales) |
2018 (share) |
| <$3,500 |
$0.5 |
$0.5 |
$0.5 |
$0.5 |
$0.5 |
$0.5 |
$0.5 |
$0.5 |
$0.5 |
$0.5 |
15% |
| $3,500 to $5,000 |
$0.2 |
$0.2 |
$0.3 |
$0.3 |
$0.4 |
$0.5 |
$0.6 |
$0.6 |
$0.6 |
$0.7 |
20% |
| $5000 to $7,500 |
<$0.1 |
$0.1 |
$0.1 |
$0.1 |
$0.1 |
$0.2 |
$0.1 |
$0.1 |
$0.2 |
$0.3 |
8% |
| $7,500 to $10,000 |
$0.1 |
$0.1 |
$0.1 |
$0.1 |
$0.2 |
$0.2 |
$0.3 |
$0.4 |
$0.5 |
$0.6 |
18% |
| >$10,000 |
<$0.1 |
$0.1 |
$0.1 |
$0.2 |
$0.2 |
$0.3 |
$0.4 |
$0.5 |
$0.7 |
$1.0 |
32% |
| Treatment cost unavailable |
$0.3 |
$0.3 |
$0.3 |
$0.3 |
$0.2 |
$0.2 |
$0.2 |
$0.2 |
$0.2 |
$0.2 |
7% |
| Total |
$1.2 |
$1.3 |
$1.4 |
$1.5 |
$1.7 |
$1.9 |
$2.1 |
$2.2 |
$2.6 |
$3.2 |
100% |
A table below gives the sales-weighted average treatment cost for all oncology medicines, by year, the median treatment cost of oncology medicines by the year their Notice of Compliance was issued, and the number of medicines that received a Notice of Compliance in each year for which a treatment cost was available in the data.
| |
2009 |
2010 |
2011 |
2012 |
2013 |
2014 |
2015 |
2016 |
2017 |
2018 |
| Sales-weighted average treatment cost for all oncology medicines, in thousands of dollars |
$4.0 |
$4.4 |
$4.6 |
$4.9 |
$5.4 |
$5.8 |
$6.4 |
$6.5 |
$7.1 |
$7.6 |
| Median treatment cost for new oncology medicines, in thousands of dollars |
$5.2 |
$7.4 |
$4.3 |
$5.5 |
$8.7 |
$7.6 |
$11.0 |
$8.6 |
$11.0 |
$11.5 |
| Number of approved oncology medicines with available treatment cost |
7 |
2 |
3 |
8 |
11 |
5 |
8 |
10 |
5 |
6 |
Note: Based on medicines for which treatment costs were available.
* By year of Health Canada Notice of Compliance (NOC).
3. Canada pays some of the highest prices for oncology medicines, though many major markets have greater availability
Foreign-to-Canadian price ratios for patented oncology medicines reveal that many major markets such as Germany, the UK, Sweden, and France had lower prices than Canada in 2018, with OECD median prices 10% below Canadian levels.
In terms of the availability of new cancer treatments, Canada ranked below all PMPRB7 countries, with 50 of the 82 new oncology medicines (61%) showing Canadian sales by Q4-2018. The 50 medicines sold in Canada made up 95% of international sales for all new oncology medicines, a higher share than the OECD median (90%) and in line with the PMPRB7, suggesting that the important, higher-selling oncology medicines were among those available in the Canadian market.
Foreign-to-Canadian price ratios for patented oncology medicines, 2018
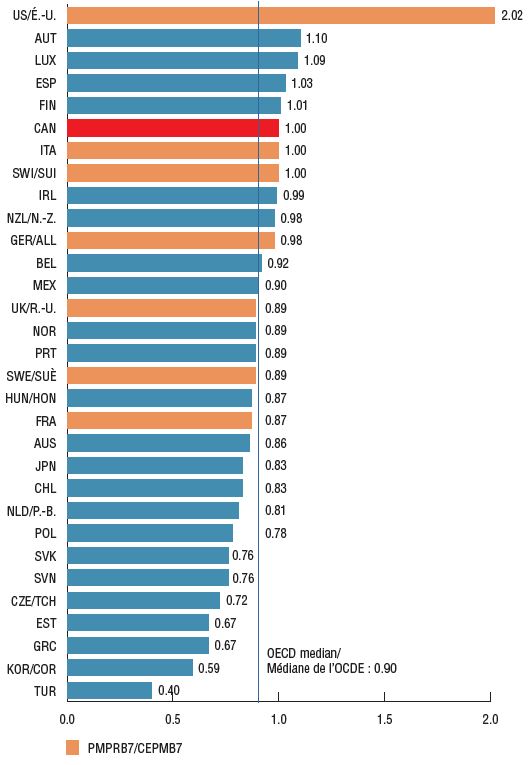
Figure description
This bar graph gives the foreign-to-Canadian price ratio for oncology medicines in each country in the Organisation for Economic Co-operation and Development in 2018. The median ratio is also given. The price in Canada is set to a value of one.
| Country |
Ratio |
| United States |
2.02 |
| Austria |
1.10 |
| Luxembourg |
1.09 |
| Spain |
1.03 |
| Finland |
1.01 |
| Canada |
1.00 |
| Italy |
1.00 |
| Switzerland |
1.00 |
| Ireland |
0.99 |
| New Zealand |
0.98 |
| Germany |
0.98 |
| Belgium |
0.92 |
| Organisation for Economic Co-operation and Development median |
0.90 |
| Mexico |
0.90 |
| United Kingdom |
0.89 |
| Norway |
0.89 |
| Portugal |
0.89 |
| Sweden |
0.89 |
| Hungary |
0.87 |
| France |
0.87 |
| Australia |
0.86 |
| Japan |
0.83 |
| Chile |
0.83 |
| Netherlands |
0.81 |
| Poland |
0.78 |
| Slovenia |
0.76 |
| Slovakia |
0.76 |
| Czech Republic |
0.72 |
| Greece |
0.67 |
| Estonia |
0.67 |
| South Korea |
0.59 |
| Turkey |
0.40 |
Share of new oncology medicines* with sales, Q4-2018
Share of total OECD sales for new oncology medicines*, Q4-2018
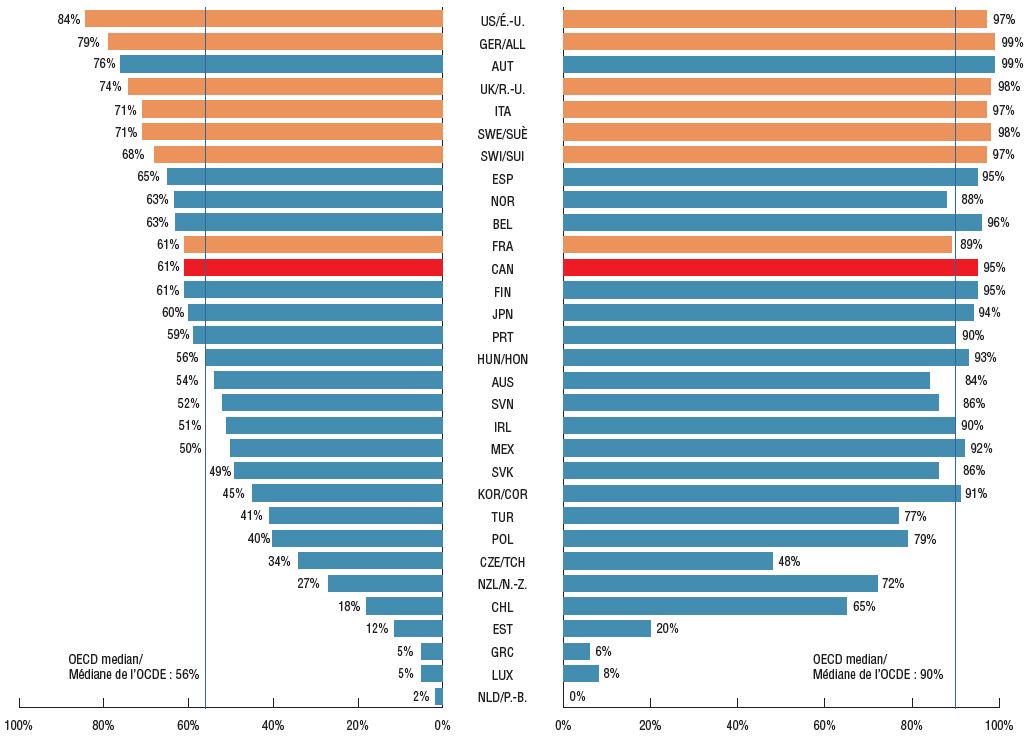
Figure description
This is a split bar graph. For each country in the Organisation for Economic Co-operation and Development, the left side of the graph gives the share of the new oncology medicines launched in Canada and the PMPRB7 between 2009 and 2017 that have sales as of the fourth quarter of 2018. The right side of the graph gives the corresponding share of total Organisation for Economic Co-operation and Development sales for new oncology medicines in the fourth quarter of 2018. A median is presented for each side of the graph.
| Country |
Share of new oncology medicines with sales |
Share of total Organisation for Economic Co-operation and Development sales for new oncology medicines |
| United States |
84% |
97% |
| Germany |
79% |
99% |
| Austria |
76% |
99% |
| United Kingdom |
74% |
98% |
| Italy |
71% |
97% |
| Sweden |
71% |
98% |
| Switzerland |
68% |
97% |
| Spain |
65% |
95% |
| Norway |
63% |
88% |
| Belgium |
63% |
96% |
| France |
61% |
89% |
| Canada |
61% |
95% |
| Finland |
61% |
95% |
| Japan |
60% |
94% |
| Portugal |
59% |
90% |
| Hungary |
56% |
93% |
| Australia |
54% |
84% |
| Slovenia |
52% |
86% |
| Ireland |
51% |
90% |
| Mexico |
50% |
92% |
| Slovakia |
49% |
86% |
| South Korea |
45% |
91% |
| Turkey |
41% |
77% |
| Poland |
40% |
79% |
| Czech Republic |
34% |
48% |
| New Zealand |
27% |
72% |
| Chile |
18% |
65% |
| Estonia |
12% |
20% |
| Greece |
5% |
6% |
| Luxembourg |
5% |
8% |
| Netherlands |
2% |
0% |
| Organisation for Economic Co-operation and Development median |
56% |
90% |
* Based on the 82 new oncology medicines that were approved in Canada and PMPRB7 between 2009 and 2017.
Data Sources
Availability, uptake, and pricing information - IQVIA MIDAS™ Database (all rights reserved).
Population data - World Bank.
Limitations
Canadian and international sales and list prices available in the IQVIA MIDAS™ Database are estimated manufacturer factory-gate list prices and do not reflect off-invoice price rebates and allowances, managed entry agreements, or patient access schemes.
Oncology medicines were selected based on the Anatomical Therapeutic Chemical Classification (ATC) codes and information from pan-Canadian Oncology Drug Review (pCODR), and Cancer Care Ontario (CCO). Medicines for supportive care were excluded.
Disclaimer
Although this information is based in part on data obtained under license from IQVIA’s MIDAS™ and Private Drug Plan databases, the statements, findings, conclusions, views, and opinions expressed in this study are exclusively those of the PMPRB and are not attributable to IQVIA.