Meds Entry Watch, 2017
Acknowledgements
This report prepared by the Patented Medicine Prices Review Board (PMPRB) as part of the National Prescription Drug Utilization Information System (NPDUIS) initiative.
The PMPRB wishes to acknowledge and thank the members of the NPDUIS Advisory Committee for their expert oversight and guidance in the preparation of this report. Please note that the statements, findings, and conclusions do not necessarily reflect those of the members or their organizations.
Appreciation goes to Jared Berger for leading this analytical project, as well as to Tanya Potashnik and Elena Lungu for their oversight in the development of the report. The PMPRB also wishes to acknowledge the contribution of the analytical staff Karine Landry, Lokanadha Cheruvu, and Jun Yu; and the contribution of the editorial staff Carol McKinley, Sarah Parker, and Shirin Paynter.
Disclaimer
NPDUIS operates independently of the regulatory activities of the Board of the PMPRB. The research priorities, data, statements, and opinions expressed or reflected in NPDUIS reports do not represent the position of the PMPRB with respect to any regulatory matter. NPDUIS reports do not contain information that is confidential or privileged under sections 87 and 88 of the Patent Act, and the mention of a medicine in a NPDUIS report is not and should not be understood as an admission or denial that the medicine is subject to filings under sections 80, 81, or 82 of the Patent Act or that its price is or is not excessive under section 85 of the Patent Act.
Although this information is based in part on data provided under license from the IQVIA MIDAS™ Database, the statements, findings, conclusions, views, and opinions expressed in this report are exclusively those of the PMPRB and are not attributable to IQVIA.
Contact Information
Patented Medicine Prices Review Board
Standard Life Centre
Box L40
333 Laurier Avenue West
Suite 1400
Ottawa, ON K1P 1C1
Telephone: 1-877-861-2350
TTY: 613-288-9654
Email: PMPRB.Information-Renseignements.CEPMB@pmprb-cepmb.gc.ca
Executive Summary
This is the third edition of the PMPRB’s Meds Entry Watch report, which explores the market entry dynamics of new medicines within a Canadian and international context. Building on the retrospective analysis of trends since 2009, this report focuses on medicines that received first-time market approval through the US Food and Drug Administration (FDA), the European Medicines Agency (EMA), and/or Health Canada in 2016 and 2017, and analyzes their uptake, pricing, sales, and availability as of the last quarter of 2017 (Q4-2017). This edition includes a new section on biosimilar medicines approved between 2006 and 2017.
The information in this publication informs decision makers, researchers, and patients of the evolving market dynamics of emerging health therapies in Canadian and international markets.
The IQVIA MIDAS™ Database was the primary source for the sales and list prices of new medicines in Canadian and international markets, as well as for the quantity sold.
International markets examined include the Organisation for Economic Co-operation and Development (OECD) members, with a focus on the seven countries the PMPRB considers in reviewing the prices of patented medicines (PMPRB7): France, Germany, Italy, Sweden, Switzerland, the United Kingdom (UK), and the United States (US).
Key Findings
(A) Trends in New Medicine Launches, 2009 to 2016
- Important new medicines have been launched since 2009, accounting for approximately 30% of brand-name medicine sales in Canada by 2017.
- From 2009 to 2016, slightly less than half (48%) of all new medicines were launched in Canada, in line with the OECD median (43%) but behind all PMPRB7 countries, many of which have lower average patented medicine prices.
- The share of new medicine sales in Canada was comparatively high (94%), suggesting that the important, higher-selling medicines were launched.
- Orphan medicines are increasingly dominating the market, accounting for 42% of new launches in 2016 and 45% in 2017, a significant increase from the 33% average share between 2009 and 2014.
- Over one quarter of the new medicines in 2016 and 2017 were developed for the treatment of cancer and many came with a high cost, averaging approximately $13,700 for a 28-day treatment.
- The majority of non-oncology medicines launched in 2016 and 2017 were high-cost, with 31 of the 37 with available treatment costs exceeding $10,000 annually. These preliminary results suggest that lower-cost medicines may become the exception rather than norm for new launches.
(B) 2016 New Medicine Launches
Fewer new medicines were launched in 2016.
- 31 new medicines received market approval through the FDA, the EMA, and/or Health Canada in 2016, significantly fewer than in 2015 and less than the average annual rate of 35 medicines launched from 2009 to 2014.
- Of the new medicines launched in 2016, 13 (42%) received an orphan designation from the FDA and/or the EMA, consistent with an increasing trend observed over the last several years.
- 13 of the new launches were classified as biologics and 5 were oncology products.
- Many new medicines came with a high cost: 4 were oncology medicines with costs exceeding $5,000 per 28-day treatment and 13 were non-oncology medicines with annual costs exceeding $10,000.
- Of the 8 new medicines assessed by the PMPRB, only 1 demonstrated more than a slight therapeutic improvement.
Fewer medicines were launched in Canada than in the US and Europe in 2016, although Canada compared favourably to the OECD in terms of sales.
- 15 of the 31 new medicines launched in 2016 were approved for sale in Canada by Q4-2017, compared to 23 approved by the FDA and 22 by the EMA.
- 7 of the 15 approved medicines recorded sales in Canada by the end of Q4-2017, placing Canada 11th in the OECD, lower than almost all PMPRB7 countries.
- These 7 medicines represented 82% of total sales for new launches in the OECD, suggesting that the higher-selling medicines were among those approved in Canada.
Antivirals for hepatitis C accounted for the majority of the sales of new medicines launched in 2016.
- Overall, sales for new medicines were highly concentrated, with antivirals to treat hepatitis C making up over 66% of new medicine sales in Canada and the PMPRB7 in Q4-2017.
- An antiviral for hepatitis C was the top-selling new medicine in Q4-2017, accounting for 52% of new medicine sales in Canada and the PMPRB7.
(C) 2017 New Medicine Launches
A greater than average number of new medicines were launched in 2017, many of which were higher-cost medicines.
- 51 new medicines received market approval through the FDA, the EMA, and/or Health Canada in 2017, significantly more than in 2016.
- Nearly half (23) of the new launches received an orphan designation from the FDA and/or the EMA.
- 18 of the new launches were classified as biologics and 17 were oncology medicines.
- Based on preliminary results, 18 of the 20 non-oncology medicines with available prices had treatment costs that exceeded $10,000 annually, and all oncology medicines had costs that exceeded $5,000 for a 28-day treatment.
(D) Biosimilar Market
Canada lags behind Europe in terms of biosimilar availability and uptake.
- Health Canada approved less than half (6) of the 14 biosimilar medicines available in international markets, lagging behind the EMA (13).
- Europe generally has earlier approval dates for the first biosimilar of a biologic, as well as earlier first sales.
- While there have been great successes in the European market in terms of the uptake and pricing of these medicines, biosimilars are often priced higher in Canada and their uptake is relatively modest.
The next edition of this publication will build on this analysis to provide further insight into the medicines introduced in 2017 and identify new medicines approved in 2018.
Introduction
Meds Entry Watch is an annual PMPRB publication that explores the dynamics of new medicines entering Canadian and international markets, providing information on their availability, launch timing, market penetration, sales, and prices.
This report builds on the two previous editions to provide a broader retrospective analysis of medicines that have entered the market since 2009, and offers a detailed analysis of the new medicines approved in 2016 along with a preliminary examination of those approved in 2017. New medicines are identified for each year based on their first date of market approval by the US Food and Drug Administration (FDA), the European Medicines Agency (EMA), and/or Health Canada.
This issue of Meds Entry Watch also features a new section highlighting the emerging market for biosimilars. It reports on biosimilar availability, uptake, and pricing, and compares these findings with the international experience.
The report consists of four main parts: Part A provides a high-level review of longer-term trends from 2009 to 2016; Part B focuses on medicines that received market approval in 2016; Part C presents a preliminary analysis of the medicines approved in 2017; and Part D examines the approvals of biosimilars in Canada and the PMPRB7 since 2006.
This publication informs decision makers, researchers, and patients of emerging health therapies in Canadian and international pharmaceutical markets.
Methods
This report analyzes new medicines that received initial market approval through the FDA, the EMA, and/or Health Canada in 2016 and 2017. For the purpose of this study, new medicines are reported at the medicinal ingredient level. A new medicine was considered to be launched during the calendar year it received first-time market authorization from any of these regulatory bodies, even if it was not yet approved for reimbursement or if there were no recorded sales in the available data. Using these criteria, 31 new medicines were identified for the 2016 analysis in Section B and 51 were identified for the preliminary analysis of 2017 medicines in Section C. The approval of these medicines in Canadian and international markets was assessed as of the end of 2017.
International markets examined include the Organisation for Economic Co-operation and Development (OECD) members, with a focus on the seven countries the PMPRB considers in reviewing the prices of patented medicines (PMPRB7): France, Germany, Italy, Sweden, Switzerland, the United Kingdom (UK), and the United States (US).
The IQVIA MIDAS™ Database (all rights reserved) was the main data source for the sales and list prices of new medicines in Canadian and international markets, as well as the number of units sold. MIDAS™ data reflects the national retail and hospital sectors of each country, including payers in all market segments (public, private, and out-of-pocket). Sales and volume data encompass all versions of a substance available in a particular country, produced by any manufacturer in any strength and form. For more information on the MIDAS™ Database and other NPDUIS source materials, see the Reference Documents section of the Analytical Studies page on the PMPRB website.
Canadian prices were based on MIDAS™ data, if available; otherwise, they were taken from publicly available results of the Common Drug Review (CDR) or pan-Canadian Oncology Drug Review (pCODR) processes published by the Canadian Agency for Drugs and Technologies in Health (CADTH). Treatment costs were calculated using Canadian list prices where possible; if not, the foreign median price or available foreign price was used. Information on dosing regimens was taken from the product monographs published by Health Canada, or from the FDA or EMA if not available. All medicines were reviewed as of Q3-2018.
Prices and foreign-to-Canadian price ratios were reported for the highest-selling form and strength of each medicine in Canada, or in the PMPRB7 if no Canadian prices were available at the time of the analysis. The bilateral price ratios presented in this report are expressed as an index with the Canadian price set to a value of one and the international measures reported relative to this value. For example, a result above one indicates a correspondingly higher average price in the specific foreign market. For more details on how foreign-to-Canadian price ratios are calculated, see the Reference Documents section of the Analytical Studies page on the PMPRB website.
Prices and sales available in foreign currencies were converted into Canadian dollars using the 12-month or 3-month average exchange rate for the year or quarter, respectively.
Historical results for the period from 2009 to 2014 were based on the methodology employed in the first issue of Meds Entry Watch, which identified new medicines based on the date of first recorded sales in the MIDAS™ Database. This change in methodology is not expected to have a meaningful impact on the overall results.
Limitations
New medicines were selected for analysis based on their date of market approval by the FDA, the EMA, and/or Health Canada; however, some may have an earlier approval date in other international markets. In addition, the medicines included in this analysis do not necessarily represent all of those introduced in 2016 and 2017, as other national regulatory bodies not examined in this report may have approved additional medicines. Nevertheless, this should have a very limited effect on the results, as the FDA and EMA are major regulatory bodies representing very large international markets and have regulatory approaches similar to those in Canada.
This report reflects the initial market penetration of these new medicines, and their availability and uptake are expected to increase in subsequent years. The availability of a new medicine in a given country at any point in time is influenced by a variety of factors including the manufacturer’s decision to launch, as well as the timing of that decision; the regulatory approval process in place; and the existing market dynamics. The availability of biosimilar medicines also depends on the length of the remaining patent protection for the reference biologic, as well as data exclusivity and any related patent litigation, which may extend the time between approval and the date of first sales.
Market approval through the EMA does not necessarily mean that the medicine is available in any given European country. Likewise, medicines approved through the FDA or Health Canada may not necessarily be reimbursed and/or have any recorded sales.
Medicines with low sales may not be reported in the IQVIA MIDAS™ Database, and thus, the sales of new medicines in any given country may be slightly under-reported. However, as the effect is expected to be relatively consistent across all markets, this should have only a minimal impact on the overall findings.
Canadian and international sales and prices are based on manufacturer list prices as reported in the MIDAS™ Database, and according to IQVIA do not capture price rebates, managed entry agreements (also known as product listing agreements), or patient access schemes . The methodology used by MIDAS™ for estimating medicine prices varies by country, depending on data availability, and may include assumed regulated margins and/or markups.
Publicly available prices from the Canadian Agency for Drugs and Technologies in Health (CADTH) are based on the manufacturers’ submitted prices, which may differ upon market entry.
Aggregated international sales and pricing data are heavily skewed towards the United States due to its relatively large population, and as a result, the ranking of medicines by international sales generally reflects the order of sales in the US.
The assessment of medicine availability in Canada does not consider non-marketed medicines available through programs that authorize the sale of medicines in exceptional circumstances, such as the Special Access Programme in Canada (SAP).
A. Trends in New Medicine Launches, 2009–2016
New medicines launched since 2009 accounted for almost one third of brand-name sales by Q4-2017, with the share of orphan and cancer medicines increasing in recent years. Nearly half of the medicines launched from 2009 to 2016 had recorded Canadian sales by Q4-2017, placing Canada 13th in the OECD and behind all PMPRB7 countries, many of which have lower average patented medicine prices. Despite this, Canada ranked sixth in terms of the share of total new medicine sales, which suggests that many of the top-selling medicines were approved by Health Canada.
In 2016, 31 new medicines received first-time market approval through the FDA, the EMA, and/or Health Canada, slightly fewer than the yearly average of 35 reported from 2009 to 2014 (Figure A1). Close to half (13) of these medicines received an orphan designation from the FDA and/or EMA, higher than the 33% average share from 2009 to 2014.
In contrast, 2017 was a very active year in terms of market approvals, with 51 new medicines approved through the FDA, the EMA, and/or Health Canada. Nearly half (23) of these medicines received an orphan designation, while one third (17) were approved for cancer indications, continuing the increasing trend observed over the last several years.
The mix of therapeutic classes among new medicines has shifted over time, with a higher representation of antineoplastic agents, antivirals, and blood coagulation medicines in 2015–2017 compared to 2009–2014. The number of approvals has also increased for central nervous system medicines, ophthalmologicals, antithrombotic agents, and non-steroidal products for inflammatory skin disorders.
Figure A1 New medicines launched in Canada and the PMPRB7*, 2009 to 2017
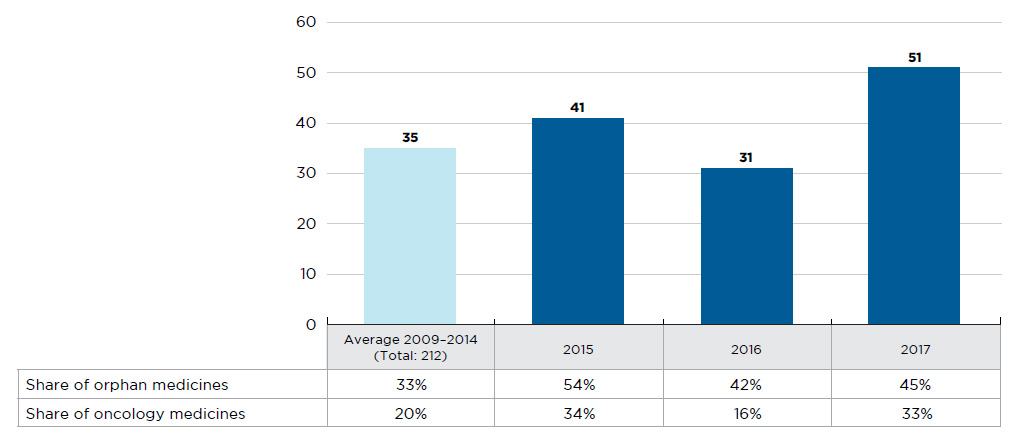
Figure description
This bar graph depicts the number of new medicines launched in Canada and the PMPRB7 from 2009 to 2017. The number of medicines introduced between 2009 and 2014 is averaged from a cumulative total of 212. A table shows the share of orphan and oncology medicines for each annual total.
blank
| |
Average 2009‒2014 |
2015 |
2016 |
2017 |
| Number of new medicines |
35 |
41 |
31 |
51 |
| Share of oncology medicines |
20% |
34% |
16% |
33% |
| Share of orphan medicines |
33% |
54% |
42% |
45% |
Note: New medicines launched between 2009 and 2014 were identified based on the date of first reported sales, while those reported for 2015 onward were determined based on the date of first-time market approval by the US Food and Drug Administration, the European Medicines Agency, and/or Health Canada.
* France, Germany, Italy, Sweden, Switzerland, the United Kingdom, and the United States.
Data source: IQVIA MIDAS™ Database, 2009 to 2014 (all rights reserved); US Food and Drug Administration, European Medicines Agency, and Health Canada databases.
New medicines have had a steep year-over-year uptake in sales. By Q4-2017, those launched between 2009 and 2016 accounted for 30% of the total brand-name pharmaceutical market in Canada and internationally (Figure A2).
In any given year, the impact of new medicines on pharmaceutical sales depends on their number and therapeutic relevance. For example, the new direct-acting antivirals (DAAs) for hepatitis C launched in 2014 continue to have a high impact on sales, accounting for one fifth of the new medicine share of the brand-name pharmaceutical market by Q4-2017.
For Canada and the PMPRB7, the sales of medicines that received market approval in 2016 accounted for 2.3% of all pharmaceutical sales in Q4-2017 and were strongly driven by the introduction of new DAA treatments.
Figure A2 New medicine cumulative share of all brand-name medicine sales by launch year (2009 to 2016), Canada and the PMPRB7*
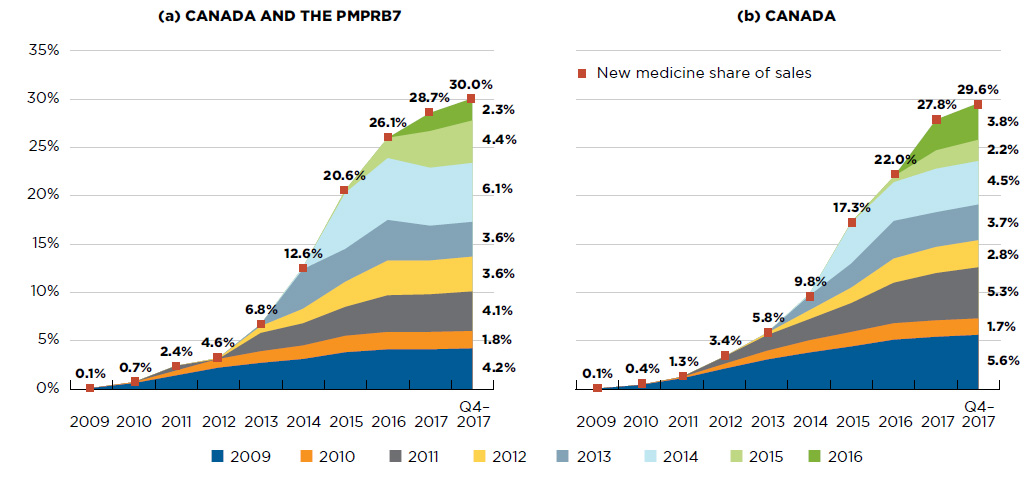
Figure description
This figure consists of two area graphs depicting the new medicine cumulative share of total brand-name drug sales by launch year. It tracks the percentage of new medicine launches in yearly sales up to the fourth quarter of 2017. New medicine share of sales for each year are also marked. The first graph is for both Canada and the seven PMPRB comparator countries and the second is for Canada alone.
(a) Canada and PMPRB7
blank
| Launch year |
2009 |
2010 |
2011 |
2012 |
2013 |
2014 |
2015 |
2016 |
2017 |
Q4-2017 |
| 2009 |
0.1% |
0.6% |
1.4% |
2.2% |
2.7% |
3.1% |
3.8% |
4.1% |
4.1% |
4.2% |
| 2010 |
|
0.1% |
0.5% |
0.9% |
1.2% |
1.4% |
1.7% |
1.8% |
1.8% |
1.8% |
| 2011 |
|
|
0.5% |
1.4% |
1.9% |
2.3% |
3.0% |
3.8% |
3.9% |
4.1% |
| 2012 |
|
|
|
0.1% |
0.7% |
1.5% |
2.6% |
3.6% |
3.5% |
3.6% |
| 2013 |
|
|
|
|
0.2% |
4.1% |
3.4% |
4.2% |
3.6% |
3.6% |
| 2014 |
|
|
|
|
|
0.2% |
5.8% |
6.4% |
6.0% |
6.1% |
| 2015 |
|
|
|
|
|
|
0.3% |
2.1% |
3.8% |
4.4% |
| 2016 |
|
|
|
|
|
|
|
|
1.9% |
2.3% |
| New medicine share of sales |
0.1% |
0.7% |
2.4% |
4.6% |
6.8% |
12.6% |
20.6% |
26.1% |
28.7% |
30.0% |
(b) Canada
blank
| Launch year |
2009 |
2010 |
2011 |
2012 |
2013 |
2014 |
2015 |
2016 |
2017 |
Q4-2017 |
| 2009 |
<0.1% |
0.4% |
1.1% |
2.1% |
3.0% |
3.8% |
4.4% |
5.1% |
5.4% |
5.6% |
| 2010 |
|
<0.1% |
0.1% |
0.5% |
0.9% |
1.3% |
1.5% |
1.7% |
1.7% |
1.7% |
| 2011 |
|
|
<0.1% |
0.8% |
1.6% |
2.2% |
3.0% |
4.2% |
4.9% |
5.3% |
| 2012 |
|
|
|
<0.1% |
0.2% |
0.9% |
1.6% |
2.5% |
2.7% |
2.8% |
| 2013 |
|
|
|
|
<0.1% |
1.5% |
2.5% |
3.9% |
3.6% |
3.7% |
| 2014 |
|
|
|
|
|
0.2% |
4.2% |
4.0% |
4.5% |
4.5% |
| 2015 |
|
|
|
|
|
|
0.1% |
0.6% |
1.9% |
2.2% |
| 2016 |
|
|
|
|
|
|
|
|
3.2% |
3.8% |
| New medicine share of sales |
0.1% |
0.4% |
1.3% |
3.4% |
5.8% |
9.8% |
17.3% |
22.0% |
27.8% |
29.6% |
Note: New medicines launched between 2009 and 2014 were identified based on the date of first reported sales, while those reported for 2015 onward were determined based on the date of first-time market approval by the US Food and Drug Administration, the European Medicines Agency, and/or Health Canada.
* France, Germany, Italy, Sweden, Switzerland, the United Kingdom, and the United States.
Data source: IQVIA MIDAS™ Database, 2009 to 2017. All rights reserved.
Of the 284 medicines launched in Canada and the PMPRB7 from 2009 to 2016, 48% had recorded sales in Canada by Q4-2017 (Figure A3). While this represented a greater share than the OECD median of 43%, it was less than all PMPRB7 countries, including many that have lower average list prices for patented medicines (PMPRB 2018a). Canada ranked sixth in terms of the share of OECD sales of these medicines in Q4-2017. The new medicines launched in Canada accounted for 94% of the OECD sales of all new medicines analyzed, which was significantly higher than the OECD median of 83% and more in line with the PMPRB7. This suggests that many of the higher-selling new medicines were launched in Canada, which may have been partially influenced by Canada’s proximity to the US market.
Figure A3 Share of new medicines launched in Canada and the PMPRB7* from 2009 to 2016 with available sales, and their respective share of OECD sales, by country, Q4-2017 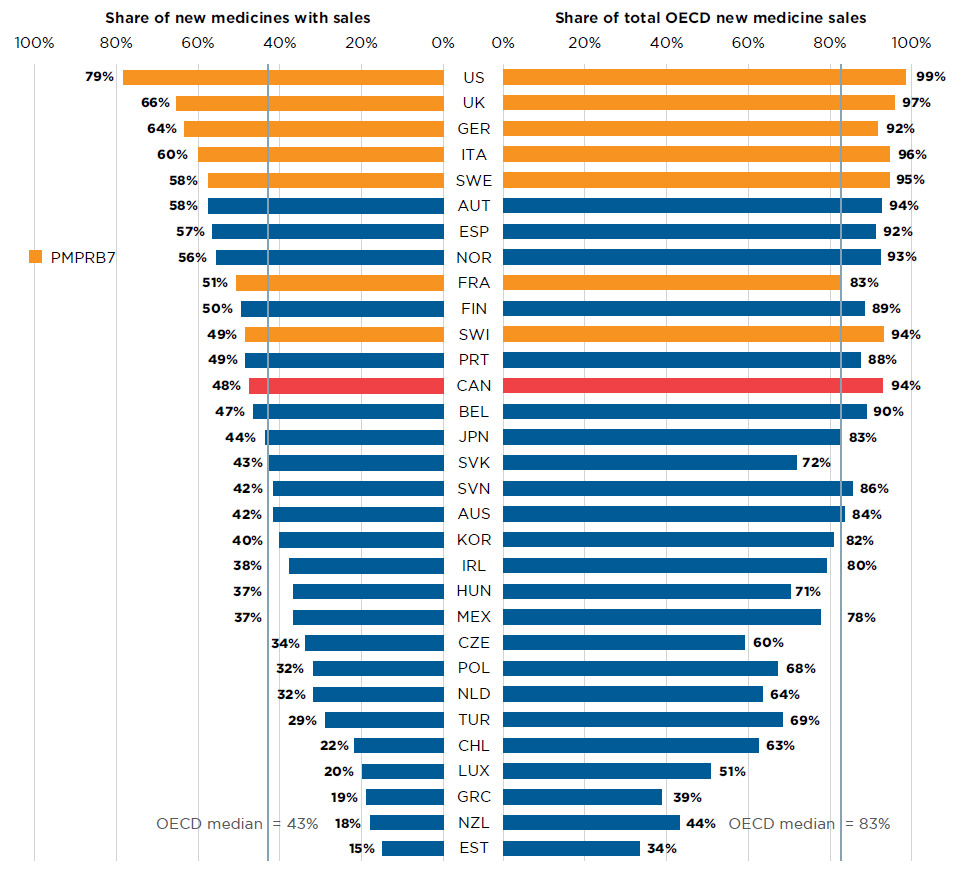
Figure description
This is a split bar graph. For each country in the Organisation for Economic Co-operation and Development, one side of the graph gives the market share of the new medicines launched in Canada and its seven PMPRB comparator countries from 2009 to 2016. The other side gives the respective share of the Organisation for Economic Co-operation and Development sales in the fourth quarter of 2017. The Organisation for Economic Co-operation and Development median is shown for each side of the graph.
blank
| Country |
Share of new medicines with sales |
Share of total Organisation for Economic Co-operation and Development new medicine sales |
| United States |
79% |
99% |
| United Kingdom |
66% |
97% |
| Germany |
64% |
92% |
| Italy |
60% |
96% |
| Sweden |
58% |
95% |
| Austria |
58% |
94% |
| Spain |
57% |
92% |
| Norway |
56% |
93% |
| France |
51% |
83% |
| Finland |
50% |
89% |
| Switzerland |
49% |
94% |
| Portugal |
49% |
88% |
| Canada |
48% |
94% |
| Belgium |
47% |
90% |
| Japan |
44% |
83% |
| Slovakia |
43% |
72% |
| Slovenia |
42% |
86% |
| Australia |
42% |
84% |
| Korea |
40% |
82% |
| Ireland |
38% |
80% |
| Hungary |
37% |
71% |
| Mexico |
37% |
78% |
| Czech Republic |
34% |
60% |
| Poland |
32% |
68% |
| Netherlands |
32% |
64% |
| Turkey |
29% |
69% |
| Chile |
22% |
63% |
| Luxembourg |
20% |
51% |
| Greece |
19% |
39% |
| New Zealand |
18% |
44% |
| Estonia |
15% |
34% |
| OECD median |
43% |
83% |
Note: New medicines launched between 2009 and 2014 were identified based on the date of first reported sales, while those reported for 2015 onward were determined based on the date of first-time market approval by the US Food and Drug Administration, the European Medicines Agency, and/or Health Canada.
Sales are based on manufacturer list prices and include sales for all OECD countries.
* France, Germany, Italy, Sweden, Switzerland, the United Kingdom, and the United States.
Data source: IQVIA MIDAS™ Database, 2017. All rights reserved.
B. New Medicine Launches, 2016
While fewer medicines were approved for market in Canada, Europe, and the United States in 2016 than in previous years, over half had high treatment costs. Of the new medicines assessed by the PMPRB, none offered a notable therapeutic improvement over existing therapies.
By the end of 2017, approximately half (15) of the 31 new medicines launched in 2016 were approved in Canada. Both the FDA and the EMA, which represent two of the largest international markets, approved more new medicines than Canada, 23 and 22, respectively, but relatively fewer than in previous years (Figure B1).
Of the 15 medicines approved in Canada, 7 had sales data available in MIDAS™ by Q4-2017. This placed Canada 11th in the OECD in terms of the number of new medicines sold and 10th in terms of the corresponding OECD sales of these new medicines, at 82%. The US market, which ranked first among all OECD countries, recorded sales for 18 of the medicines approved in 2016, representing 98% of the OECD sales. These results reflect the initial market penetration, and the availability and uptake in sales for these new medicines are expected to increase in subsequent years.
Figure B1 Number of 2016 new medicines with market approval and their share of OECD sales as of Q4-2017 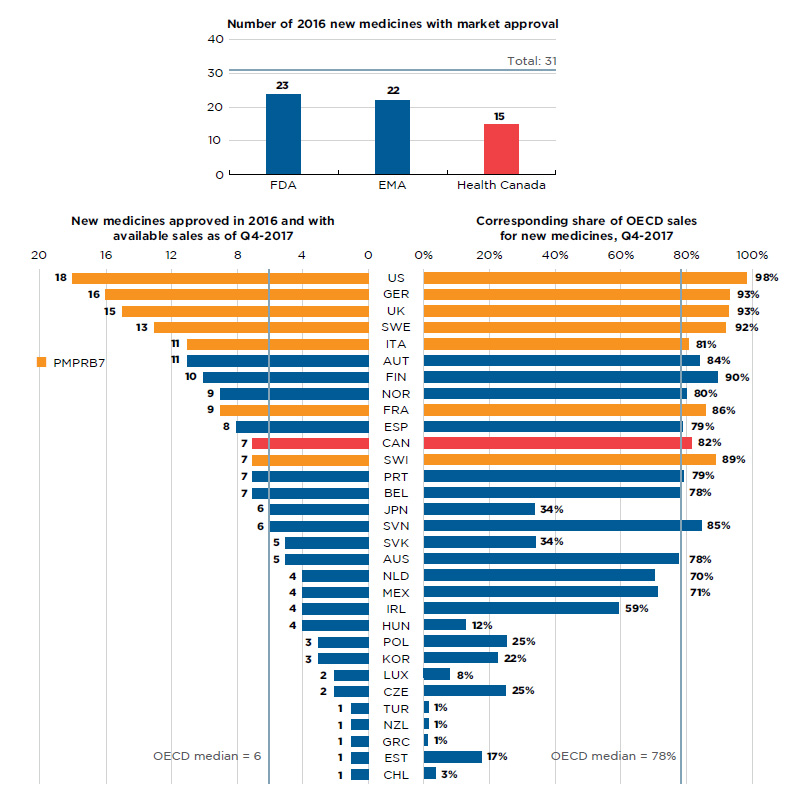
Figure description
Section 1: This bar graph reports the number of 2016 new medicines that had received market approval by the Food and Drug Administration (FDA) in the United States, the European Medicines Agency (EMA), and Health Canada as of the end of 2017. A total of 31 new medicines were launched in 2016.
blank
| FDA |
EMA |
Health Canada |
| 23 |
22 |
15 |
Section 2: This is a split bar graph showing the number of new medicines approved and with available sales as of the fourth quarter of 2017 and the corresponding share of 2017 fourth quarter sales in 31 countries. The Organisation for Economic Co-operation and Development median is shown for each side of the graph.
blank
| Country |
New medicines approved in 2016 and with available sales
as of Q4-2017 |
Corresponding share of OECD sales
for new medicines, Q4-2017 |
| United States |
18 |
98% |
| Germany |
16 |
93% |
| United Kingdom |
15 |
93% |
| Sweden |
13 |
92% |
| Italy |
11 |
81% |
| Austria |
11 |
84% |
| Finland |
10 |
90% |
| Norway |
9 |
80% |
| France |
9 |
86% |
| Spain |
8 |
79% |
| Canada |
7 |
82% |
| Switzerland |
7 |
89% |
| Portugal |
7 |
79% |
| Belgium |
7 |
78% |
| Japan |
6 |
34% |
| Slovenia |
6 |
85% |
| Slovakia |
5 |
34% |
| Australia |
5 |
78% |
| Netherlands |
4 |
70% |
| Mexico |
4 |
71% |
| Ireland |
4 |
59% |
| Hungary |
4 |
12% |
| Poland |
3 |
25% |
| Korea |
3 |
22% |
| Luxembourg |
2 |
8% |
| Czech Republic |
2 |
25% |
| Turkey |
1 |
1% |
| New Zealand |
1 |
1% |
| Greece |
1 |
1% |
| Estonia |
1 |
17% |
| Chile |
1 |
3% |
| OECD median |
6 |
78% |
Note: Based on medicines that received market approval through the US Food and Drug Administration (FDA), the European Medicines Agency (EMA), and/or Health Canada in 2016 with recorded sales data as of Q4-2017.
Sales are based on manufacturer list prices and include sales for the selected new medicines in all OECD countries.
Data source: IQVIA MIDAS™ Database, 2017 (all rights reserved); US Food and Drug Administration, European Medicines Agency, and Health Canada databases.
Although new medicines launched in Canada and the PMPRB7 in 2016 covered a wide range of therapeutic classes, their sales were highly concentrated. Ten of the 31 medicines, representing the top four therapeutic classes, accounted for over 90% of all 2016 new medicine sales in Canada and the PMPRB7 by Q4-2017. Two medicines used in the treatment of hepatitis C, Epclusa and Zepatier, together made up 66% of these sales. Only 5 of the 31 new medicines were approved for treatment of cancer, which is a significant decrease from the 34% share in 2015.
As illustrated, nearly half (13) of the 2016 new medicines received an orphan designation from the FDA and/or the EMA, and an equal number were biologics. Fewer new cancer medicines were approved in 2016 than in 2015.
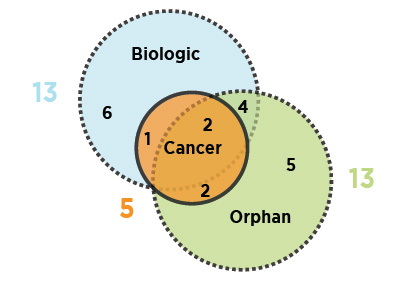
Figure description
This is a Venn diagram illustrating the overlap between orphan, biologic, and oncology medicines among the 2016 new medicines: 13 medicines were biologic, 13 had an orphan designation, and five were cancer medicines. Four were both biologic and orphan, one was both biologic and oncological, two were both orphan and oncological, and two were biologic cancer medicines that also received an orphan designation.
Data source: US Food and Drug Administration, European Medicines Agency, and Health Canada databases.
Table B1 lists the new medicines launched in 2016. For each medicine, the country with the first reported sales is given, along with the availability in Canada, the share of sales in Q4-2017, and the prices and corresponding treatment costsFootnote 1. Prices are reported for the highest-selling form and strength of each medicine at the time of the analysis.
Many new medicines came with a high treatment cost: four oncology medicines had costs exceeding $5,000 for a 28-day regimen; and 13 non-oncology medicines had costs exceeding $10,000 per year. In fact, some far exceeded these benchmarks: the average 28-day treatment cost for oncology medicines was approximately $10,900; while the treatment costs for non-oncology medicines were more varied, with five medicines exceeding $100,000 annually.
As observed in previous editions of Meds Entry Watch, Canadian list prices for new medicines at introduction are generally in line with those observed in European markets and considerably below those in the US. Note that this relationship may change, as other PMPRB reporting has shown that the foreign prices of some of the top-selling medicines have declined over time while the Canadian prices have increased slightly, which may explain the relatively high patented prices in Canada (PMPRB 2016, 2018b). Appendix I provides the bilateral foreign-to-Canadian price ratios for new medicines launched in Canada and the PMPRB7 in 2016.
Table B1 New medicines approved in 2016, availability, share of sales, prices, and treatment costs, ranked by therapeutic class share of sales, Q4-2017
(a) Medicines with sales data in MIDAS™ as of Q4-2017
| Rank |
Therapeutic class* |
Medicine
(trade name,
form, strength,
volume)† |
Availability |
Sales |
No. of countries with sales |
Price (CAD) |
Treatment cost** |
First sale in Canada
and the
PMPRB7‡ |
First sale in Canada |
Share of new medicine sales (%) |
Canada§ |
PMPRB7‡ |
Treatment cost (CAD) |
Annual/Course |
| Min |
Median |
Max |
| 1 |
J5-Antivirals for systemic use |
Velpatasvir (Epclusa, film-ctd tabs, 400 mg + 100 mg) |
US |
Jun-16 |
Aug-16 |
51.9 |
66.3 |
8 |
707i |
452 |
760 |
987 |
59,400 |
12-week treatment |
| 2 |
Grazoprevir, elbasvir (Zepatier, film-ctd tabs, 50 mg + 100 mg) |
CAN |
Jan-16 |
Jan-16 |
14.4 |
8 |
649i |
452 |
512 |
724 |
54,500 |
12-week treatment |
| 3 |
D5-Nonsteroidal products for inflammatory skin disorders |
Ixekizumab (Taltz, prefill autoinj, 80 mg/mL)B |
US |
Apr-16 |
Aug-16 |
7.4 |
9.0 |
8 |
1,524i |
1,372 |
1,666 |
5,706 |
27,400 / 19,800 |
First year / subsequent years |
| 4 |
Crisaborole (Eucrisa, ointment, 2%, 60 g) |
US |
Feb-17 |
Jun-18†† |
1.6 |
1 |
- |
- |
- |
NA |
NA |
NA |
| 5 |
N7-Other CNS Drugs |
Nusinersen sodium (Spinraza, vial, 2.4 mg/mL, 5 mL)O |
US |
Feb-17 |
Jun-17†† |
8.3 |
8.3 |
6 |
118,000ii |
81,396 |
117,465 |
134,166 |
708,000 / 354,000 |
First year / subsequent years |
| 6 |
Pitolisant (Wakix, film-ctd tabs, 18 mg)O |
FRA |
Mar-16 |
- |
<0.1 |
4 |
- |
11.47 |
15.37 |
16.81 |
11,100 |
Annual |
| 7 |
L1-Antineoplastics |
Atezolizumab (Tecentriq, infus.via/bot., 60 mg/mL, 20 mL)B,C |
US |
May-16 |
May-17 |
4.0 |
7.0 |
6 |
6,776ii |
5,632 |
7,098 |
9,899 |
9,000 |
28-day cycle |
| 8 |
Olaratumab (Lartruvo, infus.via/bot., 10 mg/mL, 50 mL)B,C,O |
US |
Nov-16 |
Nov-17†† |
1.6 |
6 |
2,074iii |
1,858 |
2,297 |
2,714 |
11,600 |
28-day cycle |
| 9 |
Venetoclax (Venclexta, film-ctd tabs, 100 mg)C,O |
US |
Apr-16 |
Oct-16 |
1.4 |
7 |
68.75i |
63.28 |
83.34 |
100 |
1,800 / 7,700 |
Ramp-up / subsequent 28-day cycles |
| 10 |
Rucaparib (Rubraca, film-ctd tabs, 300 mg)C,O |
US |
Dec-16 |
- |
0.1 |
1 |
- |
- |
- |
137 |
15,300 |
28-day cycle |
| 11 |
S1-Ophthalmologicals |
Lifitegrast (Xiidra, ophth u-d liq., 5%) |
US |
Jul-16 |
Dec-17†† |
4.4 |
4.4 |
1 |
- |
- |
- |
9.34 |
6,800 |
Annual |
| 12 |
A5-Cholagogues and hepatic protectors |
Obeticholic acid (Ocaliva, film-ctd tabs, 5 mg)O |
US |
Jun-16 |
May-17†† |
1.1 |
1.1 |
6 |
98.63ii |
115 |
155 |
236 |
36,000 |
Annual |
| 13 |
N3-Anti-epileptics |
Brivaracetam (Brivlera, film-ctd tabs, 50 mg) |
UK |
Jan-16 |
Jun-16 |
1.0 |
1.0 |
6 |
4.46i |
2.30 |
3.42 |
20.01 |
3,300 |
Annual |
| 14 |
B2-Blood coagulation system, other products |
Albutrepenonacog alfa (Idelvion, vial dry, 2000 IU)B,O |
US |
Apr-16 |
Jan-16†† |
0.8 |
1.0 |
4 |
- |
5,990 |
6,175 |
6,589 |
449,500 |
Annual |
| 15 |
Lonoctocog alfa (Afstyla, inf. dry bottle, 2000 IU)B |
US |
Jun-16 |
Dec-16†† |
0.2 |
4 |
- |
2,216 |
2,804 |
3,265 |
306,200 to 765,500 |
Annual |
| 16 |
N5-Psycholeptics |
Pimavanserin (Nuplazid, film-ctd tabs, 17 mg) |
US |
Jun-16 |
- |
0.5 |
0.5 |
1 |
- |
- |
- |
50.85 |
37,100 |
Annual |
| 17 |
M5-Other drugs for disorders of the musculo-skeletal system |
Eteplirsen (Exondys 51, infus.via/bot., 50 mg/mL, 10 mL)B,O |
US |
Oct-16 |
- |
0.4 |
0.4 |
1 |
- |
- |
- |
8,189 |
638,800 |
Annual |
| 18 |
R3-Anti-asthma and COPD products |
Reslizumab (Cinqair, infus.via/bot., 10 mg/mL, 10 mL)B |
US |
May-16 |
Jul-17 |
0.4 |
0.4 |
5 |
618i |
555 |
742 |
1,002 |
16,900 |
Annual |
| 19 |
A16-Other alimentary tract and metabolism products |
Migalastat (Galafold, capsules, 123 mg)O |
SWE |
May-16 |
Sep-17†† |
0.3 |
0.3 |
5 |
1,700ii |
1,591 |
1,670 |
1,707 |
310,300 |
Annual |
| 20 |
N4-Anti-Parkinson drugs |
Opicapone (Ongentys, capsules, 50 mg) |
UK |
Jul-16 |
- |
0.1 |
0.1 |
2 |
- |
4.62 |
- |
7.01 |
2,100 |
Annual |
| 21 |
H4-Other hormones |
Etelcalcetide (Parsabiv, vial IV, 5 mg/mL, 1 mL) |
SWE |
Nov-16 |
- |
0.1 |
0.1 |
5 |
- |
40.36 |
45.30 |
55.42 |
3,500 to 21,200 |
Annual |
| 22 |
J6-Sera and gamma-globulins |
Bezlotoxumab (Zinplava, infus.via/bot., 25 mg/mL, 40 mL)B |
US |
Oct-16 |
- |
<0.1 |
<0.1 |
1 |
- |
- |
- |
4,645 |
3,300 |
Dose |
(b) Medicines without sales data in MIDAS™ as of Q4-2017
| Rank |
Therapeutic class* |
Medicine (trade name)† |
Availability |
| First approval in Canada and the PMPRB7‡ |
First approval in Canada |
| 23 |
J05-Antivirals for systemic use |
Asunaprevir (Sunvepra) |
HC |
- |
Mar-16†† |
| 24 |
M09-Other drugs for disorders of the musculo-skeletal system |
Autologous cultured
chondrocytes on a porcine
collagen membrane (MACI)B |
FDA |
Dec-16 |
- |
| 25 |
D03-Preparations for treatment of wounds and ulcers |
Betulae cortex dry extract (Episalvan) |
EMA |
Jan-16 |
- |
| 26 |
L01-Antineoplastics |
Zalmoxis (nalotimagene carmaleucel)B,C,O,G |
EMA |
Aug-16 |
- |
| 27 |
V09-Diagnostic radiopharmaceuticals |
Fluciclovine F 18 (Axumin) |
FDA |
May-16 |
- |
| 28 |
V09-Diagnostic radiopharmaceuticals |
Gallium Ga 68 dotatate
(Netspot)O |
FDA |
Jun-16 |
- |
| 29 |
L03 -Immunostimulants |
Strimvelis (gene therapy product)B,O,G |
EMA |
May-16 |
- |
| 30 |
J06 -Immune sera and immunoglobulins |
Obiltoxaximab (Anthim)B,O |
FDA |
Mar-16 |
- |
| 31 |
J07 -Vaccines |
Vaccine, pandemic influenza H5N1 (AstraZeneca)B |
EMA |
May-16 |
- |
Notes: A new medicine was considered to be launched if it received market approval through the US Food and Drug Administration (FDA), the European Medicines Agency (EMA), and/or Health Canada in 2016.
Availability and sales information refer to all forms and strengths of the medicine, while pricing and treatment costs are based on the highest-selling form and strength indicated. Sales are based on manufacturer list prices.
* Level 2 of the Anatomical Classification of Pharmaceutical Products, as reported in MIDAS™, except for the new medicines without sales data in MIDAS™, for which the reporting is based on the Anatomic Therapeutic Chemical (ATC) Classification System maintained by the World Health Organization (WHO).
† B: biologic; C: cancer; O: orphan medicines; G: gene therapies.
‡ France, Germany, Italy, Sweden, Switzerland, the United Kingdom, and the United States.
§ Sources for Canadian unit prices:
- i MIDAS™ Database, Q4-2017.
- ii CADTH's Canadian Drug Expert Committee Recommendation report.
- iii pCODR Expert Review Committee (pERC) Recommendation report.
** Treatment costs were calculated using Canadian list prices if available; otherwise, the foreign median price or available foreign price was used. Information on dosing regimens was taken from the product monograph provided by Health Canada, or the
FDA or
EMA if unavailable though Health Canada.
†† No Canadian sales data in MIDAS™ as of Q4-2017. Notice of Compliance issued as of December 31, 2018.
Data source: IQVIA MIDAS™ Database, 2017 (all rights reserved); US Food and Drug Administration Novel Drugs 2016; European Medicines Agency Human Medicines Highlights 2016; Health Canada New Drug Authorizations: 2016 Highlight.
Tables B2 and B3 focus on the new medicines approved for market in Canada. Table B2 provides an overview of the assessments and recommendations for these medicines, while Table B3 provides further details on the pharmacoeconomic assessments conducted by CADTH through the Common Drug Review (CDR) and the pan-Canadian Oncology Drug Review (pCODR).
Of the medicines launched in 2016, only half were authorized for market in Canada by the end of 2017. By the third quarter of 2018, only 12 had received CADTH recommendations for public reimbursement of which 7 had completed pan-Canadian Pharmaceutical Alliance (pCPA) negotiations and five others had negotiations underway.
The nine non-oncology medicines reviewed by the CDR received a recommendation to reimburse with clinical criteria and/or conditions, and the three oncology medicines reviewed by pCODR were recommended for funding on the condition that their cost effectiveness be improved to an acceptable level.
The scientific review conducted by the PMPRB’s Human Drug Advisory Panel (HDAP) found that only 1 of the 15 new medicines, obeticholic acid (Ocaliva), offered a moderate improvement over comparator medicines, while 7 were deemed to offer slight or no improvement. The remaining seven medicines had not been reported to the PMPRB or their level of therapeutic improvement had not yet been assessed and made publicly available as of Q3-2018Footnote 2.
A review of the private drug plan data reveals that over half (8) of the 15 new medicines were reimbursed by at least one private drug plan by the end of 2017. However, these are preliminary results, and their interpretation is limited. For example, if the approval date in Canada was near the end of the 2017 calendar year, the uptake in private plans may only have occurred in 2018 and would not be reflected in these results.
Table B2 Assessments, recommendations, and reimbursement decisions for 2016 new medicines launched in Canada by Q4-2017
| ATC* |
Medicine
(trade name)† |
Health
Canada
approval |
PMPRB level of therapeutic improvement |
CADTH
recommendation‡ |
pCPA
negotiation
status§ |
Private plans |
| Notice of Compliance |
Break-through |
Sub-
stantial
improve-
ment |
Moderate
improve-
ment |
Slight
or
no
improve-
ment |
Reimburse |
Reimburse
with
clinical
criteria
and/or
conditions |
Do
not
reimburse |
Active |
Completed
and
closed |
No
negotiations |
Covered |
| J5 |
Velpatasvir (Epclusa) |
Jul-16 |
|
|
|
X |
|
X |
|
|
X |
|
X |
Grazoprevir, elbasvir
(Zepatier) |
Jan-16 |
|
|
|
X |
|
X |
|
|
X |
|
X |
| N7 |
Nusinersen sodium
(Spinraza)O |
Jun-17 |
** |
|
X |
|
|
X |
|
|
| D5 |
Ixekizumab (Taltz)B |
May-16 |
|
|
|
X |
|
X |
|
|
X |
|
X |
| L1 |
Atezolizumab (Tecentriq)B,C |
Apr-17 |
|
|
|
X |
|
X |
|
X |
|
|
X |
| Olaratumab (Lartruvo)B,C,O |
Nov-17 |
** |
|
X |
|
X |
|
|
|
| Venetoclax (Venclexta)C,O |
Sep-16 |
|
|
|
X |
|
X |
|
X |
|
|
X |
| S1 |
Lifitegrast (Xiidra) |
Dec-17 |
** |
|
|
|
|
|
|
|
| A5 |
Obeticholic acid (Ocaliva)O |
May-17 |
|
|
X |
|
|
X |
|
|
X |
|
X |
| N3 |
Brivaracetam (Brivlera) |
Mar-16 |
|
|
|
X |
|
X |
|
X |
|
|
X |
| B2 |
Albutrepenonacog alfa
(Idelvion)B,O |
Jan-16 |
** |
|
|
|
|
|
|
|
| Lonoctocog alfa (Afstyla)B |
Dec-16 |
** |
|
|
|
|
|
|
|
| R3 |
Reslizumab (Cinqair)B |
Jul-16 |
** |
|
X |
|
X |
|
|
X |
| A16 |
Migalastat (Galafold)O |
Sep-17 |
** |
|
X |
|
|
X |
|
|
| J5 |
Asunaprevir (Sunvepra) |
Mar-16 |
|
|
|
X |
|
X |
|
|
X |
|
|
Note: Non-oncology medicines were assessed through CADTH’s Common Drug Review process, while oncology medicines were assessed through the pan-Canadian Oncology Drug Review (pCODR) process. All cancer medicines assessed by pCODR received a recommendation of “funding conditional on cost-effectiveness being improved.”
* Level 2 of the Anatomical Classification of Pharmaceutical Products, as reported in MIDAS™.
† B: biologic; C: cancer; O: orphan medicines.
‡ Initial or final recommendation issued as of Q3-2018.
§ As of Q3-2018.
** This medicine has not yet been reported to the PMPRB or its level of therapeutic improvement has not yet been assessed and made publicly available by Q3-2018.
Data source: IQVIA Private Drug Plan database, 2017; Health Canada Notice of Compliance database; PMPRB New Patented Medicines database; Canadian Agency for Drugs and Technologies in Health (CADTH) reports; pan-Canadian Pharmaceutical Alliance (pCPA) reports.
Table B3 reports information related to the results of the health technology assessments: the indications assessed; the recommended condition for reimbursement; the primary evaluation; the range of reported incremental cost-effectiveness ratios (ICER) reported; and the price reduction required for the medicine to achieve an ICER of $50,000 per quality-adjusted life year (QALY). The results suggest that most new medicines launched in Canada are not cost-effective at their submitted prices, and the vast majority of these medicines were approved on the condition that their price be reduced. At the high end of the reported range, the price of some medicines would need to be decreased by more than 95% in order to achieve an ICER of $50,000 per QALY.
Table B3 Summary of Common Drug Review and pan-Canadian Oncology Drug Review assessments for 2016 new medicines approved in Canada
by Q4-2017
Medicine
(trade name)* |
Date of recommendation† |
Indication |
Conditional on price‡ |
Type of evaluation (primary)§ |
Incremental cost-effectiveness
ratio (ICER) ($) |
Price reduction range ($50,000 per QALY) |
Velpatasvir
(Epclusa) |
Oct-16 |
Hepatitis C, chronic |
Yes |
CUA |
>50,000 to >140,000 per QALY |
- |
| Grazoprevir, elbasvir (Zepatier) |
May-16 |
Hepatitis C, chronic |
Yes |
CUA |
>60,000 per QALY |
26%–44% |
| Nusinersen sodium (Spinraza)O |
Dec-17 |
Spinal muscular atrophy |
Yes |
CUA |
7,400,000 to 24,400,000 per QALY |
Substantial** |
Ixekizumab
(Taltz)B |
Oct-16 |
Psoriasis, moderate to severe plaque |
Yes |
CUA |
119,564 to 393,762 per QALY |
27%–55% |
| Aug-18 |
Arthritis, psoriatic |
74,949 to 393,762 per QALY |
63% |
| Obeticholic acid (Ocaliva)O |
Jul-17 |
Primary biliary cholangitis |
Yes |
CUA |
118,341 to 218,310 per QALY |
50%–70% |
| Brivaracetam (Brivlera) |
Jan-17 |
Epilepsy, partial-onset seizures |
Yes |
CMA |
NA |
- |
Reslizumab
(Cinqair)B |
Mar-17 |
Asthma, eosinophilic |
Yes |
CUA/CMA |
888,000 to 1,200,000 per QALY |
95% |
Migalastat
(Galafold)O |
Jan-18 |
Fabry disease |
- |
CUA |
200,487 to 55,935,921 per QALY |
- |
| Asunaprevir (Sunvepra) |
Jul-16 |
Hepatitis C, chronic |
Yes |
CUA |
NA |
- |
| Atezolizumab (Tecentriq)B,C |
Jun-18 |
Non-small cell lung cancer |
- |
CUA/CEA |
215,028 to 644,071 per QALY |
- |
| Olaratumab (Lartruvo)B,C,O |
Apr-18 |
Advanced soft tissue sarcoma (STS) |
- |
CUA/CEA |
224,817 to 263,340 per QALY |
- |
| Venetoclax (Venclexta)C,O |
Mar-18 |
Chronic lymphocytic leukemia |
Yes |
CUA/CEA |
139,074 to 1,474,649 per QALY |
Substantial |
Note: The type of evaluation and the incremental cost-effectiveness ratio (ICER) are based on the CDR estimate (base case) and the pCODR Economic Guidance Panel (EGP) evaluations. The table reports the low-bound and high-bound range estimated for all comparators and conditions analyzed. Cost-utility analysis (CUA) and cost-effectiveness analysis (CEA) evaluations are provided as a range per quality-adjusted life year (QALY). Additional information can be accessed at https://www.cadth.ca.
* B: biologic; C: cancer; O: orphan medicines.
† Initial or final recommendation issued as of Q3-2018.
‡ Price was explicitly defined as a condition for reimbursement.
§ CUA: cost-utility analysis; CMA: cost-minimization analysis; CEA: cost-effectiveness analysis.
** Under a scenario of a 95% price reduction for nusinersen, the incremental cost-utility ratios (ICURs) still exceeded $400,000 per QALY.
Data source: Canadian Agency for Drugs and Technologies in Health (CADTH) reports.
Some of the medicines approved in 2016 are in pre-registration or undergoing Phase III clinical trials for additional indications, and thus have the potential for greater market penetration in the future. Of the 31 new medicines approved in 2016, 9 were in Phase III clinical trials or pre-registration for additional indications in Canada or the PMPRB7 countries as of Q3-2018 (Table B4). This included 4 of the 15 medicines approved in Canada by Q4-2017.
Table B4 Pipeline indications for new medicines approved in 2016, Q3-2018
| Medicine |
Therapeutic area |
Marketed indications |
Pipeline indications |
Phase |
| Approved in Canada |
| AtezolizumabB,C |
Oncology |
Non-small cell lung cancer, metastatic transitional (urothelial) tract cancer |
Metastatic melanoma, breast cancer, metastatic breast cancer, renal cell carcinoma, fallopian tube cancer, muscle invasive bladder cancer, peritoneal cancer, epithelial ovarian cancer, head and neck cancer squamous cell carcinoma, squamous non-small cell lung cancer, metastatic hormone refractory (castration resistant, androgen-independent) prostate cancer, metastatic hepatocellular carcinoma, small cell lung cancer |
Phase III |
| IxekizumabB |
Immunology;
musculo skeletal disorders |
Plaque psoriasis (psoriasis vulgaris), psoriatic arthritis |
Axial spondyloarthritis |
Pre-registration (EU, US) |
| Obeticholic acidO |
Gastrointestinal |
Primary biliary cirrhosis |
Non-alcoholic steatohepatitis |
Phase III |
| VenetoclaxC,O |
Oncology |
Relapsed chronic lymphocytic leukemia (CLL), refractory chronic lymphocytic leukemia (CLL) |
Acute myelocytic leukemia |
Pre-registration (US) |
| Acute myelocytic leukemia, mantle cell lymphoma, refractory multiple myeloma, relapsed multiple myeloma, chronic lymphocytic leukemia (CLL) |
Phase III |
| Not yet approved in Canada, Q4-2017 |
Betulae cortex
dry extract |
Dermatology |
Wounds |
Epidermolysis bullosa |
Phase III |
Nalotimagene
carmaleucelB,C,O |
Immunology |
Hematopoietic stem cell transplantation |
Leukemias |
Phase III |
| Pimavanserin |
Central nervous system |
Psychosis |
Schizophrenia, dementia |
Phase III |
| PitolisantO |
Central nervous system |
Narcolepsy |
Cataplexy |
Phase III |
| RucaparibC,O |
Oncology |
Fallopian tube cancer, epithelial ovarian cancer, metastatic ovarian cancer, peritoneal cancer |
Metastatic hormone refractory (castration resistant, androgen-independent) prostate cancer |
Phase III |
Data source: GlobalData, 2017.
C. New Medicine Launches, 2017
A greater than average number of new medicines were approved in Canada, Europe, and the United States in 2017. Nearly half received an orphan designation, and many were biologics and/or oncology medicines. Treatment costs continued to be high, with one new orphan medicine introduced at an annual cost of close to one million dollars.
In 2017, 51 new medicines received first-time market approval through the FDA, the EMA, and/or Health Canada, significantly more than in 2016 and higher than the yearly average of 35 from 2009 to 2014. As of the third quarter of 2018, Canada had approved almost half (23) of these new launches, trailing behind the EMA (29) and the FDA (49) (Figure C1).
Figure C1 Number of 2017 medicines with market approval, Q3-2018
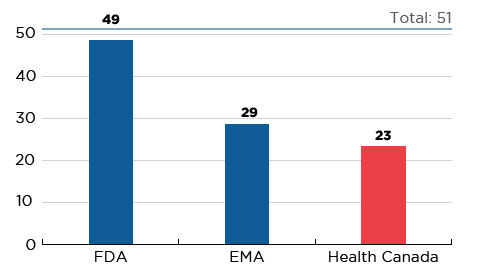
Figure description
This bar graph reports the number of 2017 new medicines that had received market approval by the Food and Drug Administration (FDA) in the United States, the European Medicines Agency (EMA), and Health Canada as of the third quarter of 2018. A total of 51 new medicines were launched in 2017.
| FDA |
EMA |
Health Canada |
| 49 |
29 |
23 |
Note: Based on medicines that received market approval through the US Food and Drug Administration (FDA), the European Medicines Agency (EMA) and/or Health Canada in 2017.
Data source: US Food and Drug Administration, European Medicines Agency, and Health Canada databases.
By Q4-2017, 34 new medicines had available sales in Europe, the US, and/or Canada. Over three quarters (28) of these had treatment costs exceeding $10,000 per year. Table C1 provides a full list of the 51 new medicines launched in 2017 along with the country with first reported sales, the availability in Canada, and the prices and treatment costs where availableFootnote 3. Note that this information reflects the early availability and uptake of these medicines in the markets analyzed. Prices are reported for the highest-selling form and strength of each medicine.
The next edition of Meds Entry Watch will provide a more detailed analysis of the new medicines launched in 2017.
Table C1 New medicines approved in 2017, availability, prices, and treatment costs, Q4-2017
(a) Medicines with sales data in MIDAS™ as of Q4-2017
| Medicine (trade name, form, strength, volume)* |
Therapeutic class† |
Availability |
Price (CAD) |
Treatment cost** |
| First sale in Canada and the PMPRB7‡ |
First sale in Canada |
No. of countries with sales |
Canada§ |
PMPRB7‡ |
Treatment cost (CAD) |
Annual / Course of treatment |
| Min |
Median |
Max |
| Abaloparatide (Tymlos, prefill pens, 80 y/mL, 1.56 mL) |
H4-Other hormones |
US |
Jun-17 |
- |
1 |
- |
- |
- |
1,957 |
23,500 |
Annual |
| Abemaciclib (Verzenio, tablets, 150 mg)C |
L1-Antineoplastics |
US |
Oct-17 |
- |
1 |
- |
- |
- |
229 |
12,800 |
28-day cycle |
| Acalabrutinib (Calquence, capsules, 100 mg)C,O |
L1-Antineoplastics |
US |
Nov-17 |
- |
1 |
- |
- |
- |
275 |
16,700 |
28-day cycle |
| Avelumab (Bavencio, infus.via/bot., 20 mg/mL, 10 mL)B,C,O |
L1-Antineoplastics |
US |
Mar-17 |
Dec-17†† |
5 |
1,325iii |
1,135 |
1,368 |
1,787 |
9,300 |
28-day cycle |
| Baricitinib (Olumiant, film-ctd tabs, 4 mg)O |
M1-Anti-inflammatory and anti-rheumatic products |
SWE |
Feb-17 |
Aug-18†† |
5 |
- |
34.46 |
44.28 |
61.55 |
16,100 |
Annual |
| Benralizumab (Fasenra, prefill syrng sc, 30 mg/mL, 1 mL)B |
R3-Anti-asthma and COPD products |
US |
Nov-17 |
Feb-18†† |
1 |
- |
- |
- |
5,832 |
46,700 / 37,900 |
First year / subsequent years |
| Brigatinib (Alunbrig, film-ctd tabs, 30 mg)C,O |
L1-Antineoplastics |
US |
May-17 |
Jul-18†† |
1 |
- |
- |
- |
93.38 |
15,700 |
28-day cycle |
| Brodalumab (Siliq, prefill syrng sc, 140 mg/mL, 1.5 mL)B |
L4-Immunosuppressants |
SWE |
Jul-17 |
Mar-18†† |
4 |
645ii |
945 |
1,123 |
2,112 |
18,100 / 16,800 |
First year / subsequent years |
| Cerliponase alfa (Brineura, infus.via/bot., 30 mg/mL, 15 mL)B,O |
N7-Other CNS drugs |
FRA |
May-17 |
- |
2 |
- |
27,512 |
- |
34,513 |
806,300 |
Annual |
| Copanlisib (Aliqopa, inf. dry bottle, 60 mg)C,O |
L1-Antineoplastics |
US |
Sep-17 |
- |
1 |
- |
- |
- |
4,858 |
14,600 |
28-day cycle |
| Deutetrabenazine (Austedo, coated tablets, 12 mg)O |
N7-Other CNS drugs |
US |
Jun-17 |
- |
1 |
- |
- |
- |
101 |
24,400 / 146,700 |
Annual (6 mg/48 mg) |
| Dupilumab (Dupixent, prefill syrng sc, 150 mg/mL, 2 mL)B |
D5-Nonsteroidal products for inflammatory skin disorders |
US |
Mar-17 |
Nov-17†† |
3 |
1,154ii |
1,054 |
1,145 |
1,716 |
31,200 / 30,000 |
First year / subsequent years |
| Durvalumab (Imfinzi, vial IV, 50 mg/mL, 10 mL)B,C |
L1-Antineoplastics |
US |
May-17 |
Nov-17 |
2 |
4,070 |
4,010 |
- |
4,010 |
11,400 |
28-day cycle |
| Edaravone (Radicava, inf. bags, 300 y/mL, 100 mL)O |
N7-Other CNS drugs |
US |
Aug-17 |
Oct-18†† |
1 |
- |
- |
- |
646 |
173,200 / 168,000 |
First year / subsequent years |
| Emicizumab (Hemlibra, vial sc, 150 mg/mL, 1 mL)B,O |
B2-Blood coagulation system, other products |
US |
Nov-17 |
Aug-18†† |
1 |
- |
- |
- |
17,282 |
677,500 / 629,100 |
First year / subsequent years |
| Enasidenib (Idhifa, film-ctd tabs, 100 mg)C,O |
L1-Antineoplastics |
US |
Aug-17 |
- |
1 |
- |
- |
- |
962 |
26,900 |
28-day cycle |
| Glecaprevir, pibrentasvir (Maviret, film-ctd tabs, 100 mg + 40 mg) |
J5-Antivirals for systemic use |
SWE |
Jul-17 |
Sep-17 |
7 |
235i |
180 |
229 |
253 |
39,400 to 78,900 |
8- to 16-week treatment |
| Guselkumab (Tremfya, prefill syrng sc, 100 mg/mL, 1 mL)B |
D5-Nonsteroidal products for inflammatory skin disorders |
US |
Jul-17 |
Nov-17 |
3 |
3,153i |
5,291 |
- |
11,551 |
22,100 / 20,500 |
First year / subsequent years |
| Latanoprostene bunod (Vyzulta, drops eye, 0.02%, 5 mL) |
S1-Ophthalmologicals |
US |
Nov-17 |
- |
1 |
- |
- |
- |
4.38 |
NA |
Annual (per eye) |
| Letermovir (Prevymis, film-ctd tabs, 480 mg)O |
J5-Antivirals for systemic use |
US |
Nov-17 |
Nov-17†† |
1 |
251ii |
- |
- |
241 |
25,100 |
100-day treatment |
| Midostaurin (Rydapt, capsules, 25 mg)C,O |
L1-Antineoplastics |
FRA |
Oct-16 |
Sep-17 |
5 |
171i |
46.51 |
160 |
235 |
12,800 |
28-day cycle |
| Naldemedine (Symproic, film-ctd tabs, 200 y) |
A6-Drugs for constipation and bowel cleansers |
US |
Oct-17 |
- |
1 |
- |
- |
- |
12.72 |
4,600 |
Annual |
| Niraparib (Zejula, capsules, 100 mg)C,O |
L1-Antineoplastics |
US |
Apr-17 |
- |
2 |
- |
171 |
- |
191 |
15,200 |
28-day cycle |
| Ocrelizumab (Ocrevus, infus.via/bot., 30 mg/mL, 10 mL)B |
N7-Other CNS drugs |
US |
Apr-17 |
Sep-17 |
3 |
8,528i |
8,861 |
- |
18,554 |
34,100 |
Annual |
| Plecanatide (Trulance, tablets, 3 mg) |
A6-Drugs for constipation and bowel cleansers |
US |
Mar-17 |
- |
1 |
- |
- |
- |
14.24 |
5,200 |
Annual |
| Ribociclib (Kisqali, film-ctd tabs, 200 mg)C |
L1-Antineoplastics |
US |
Mar-17 |
Mar-18†† |
5 |
99.20iii |
69.66 |
117 |
212 |
6,250 |
28-day cycle |
| Sarilumab (Kevzara, prefill syrng sc, 175 mg/mL, 1.14 mL)B |
M1-Anti-inflammatory and anti-rheumatic products |
CAN |
Feb-17 |
Feb-17 |
4 |
710i |
975 |
- |
1,842 |
18,500 |
Annual |
| Tivozanib (Fotivda, capsules, 1.34 mg)C |
L1-Antineoplastics |
GER |
Nov-17 |
- |
1 |
- |
- |
- |
261 |
5,500 |
28-day cycle |
| Vaborbactam (Vabomere, inf. dry bottle, 1 g + 1 g) |
J1-Systemic antibacterials |
US |
Oct-17 |
- |
1 |
- |
- |
- |
196 |
16,400 |
14-day treatment |
| Valbenazine (Ingrezza, capsules, 40 mg)O |
N7-Other CNS drugs |
US |
May-17 |
- |
1 |
- |
- |
- |
205 |
147,800 |
Annual |
| Vestronidase alfa (Mepsevii, infus.via/bot., 2 mg/mL, 5 mL)B,O |
A16-Other alimentary tract and metabolism products |
US |
Nov-17 |
- |
1 |
- |
- |
- |
3,634 |
944,800 |
Annual (25kg) |
| Voxilaprevir (Vosevi, film-ctd tabs, 400 mg + 100 mg + 100 mg) |
J5-Antivirals for systemic use |
SWE |
Jul-17 |
Sep-17 |
5 |
723i |
788 |
883 |
999 |
60,700 |
12-week treatment |
| Inotuzumab ozogamicin (Besponsa, inf. dry bottle, 900 y/mg)C,B,O |
L1-Antineoplastics |
FRA |
Apr-17 |
Mar-18†† |
4 |
14,406iii |
11,885 |
16,265 |
21,920 |
49,000 / 40,800 |
21-day cycle / subsequent 28-day cycle |
| Neratinib (Nerlynx, film-ctd tabs, 40 mg)C |
L1-Antineoplastics |
US |
Sep-17 |
- |
1 |
- |
- |
- |
71.79 |
12,100 |
28-day cycle |
| Telotristat ethyl (Xermelo, film-ctd tabs, 250 mg)C,O |
A7-Antidiarrhoeals, oral electrolyte replacers and intestinal anti-inflammatories |
US |
Mar-17 |
Oct-18†† |
3 |
- |
18.38 |
31.41 |
75.40 |
2,600 |
28-day cycle |
(b) Medicines without sales data in MIDAS™ as of Q4-2017
| Medicine (trade name)* |
Therapeutic class† |
Availability |
| First approval in Canada and the PMPRB7‡ |
First approval in Canada |
| Angiotensin II (Giapreza) |
C01-Cardiac therapy |
FDA |
Dec-17 |
- |
| Axicabtagene ciloleucel (Yescarta)B,C,O,G |
L03-Immunostimulants |
FDA |
Oct-17 |
- |
| Benznidazole (Benznidazole)O |
P01-Antiprotozoals |
FDA |
Aug-17 |
- |
| Betrixaban (Bevyxxa) |
B01-Antithrombotic agents |
FDA |
Jun-17 |
- |
| Coagulation Factor IX [recombinant], glycoPEGylated (Rebinyn)B |
B02-Antihemorrhagics |
FDA |
May-17 |
Nov-17†† |
| Delafloxacin (Baxdela) |
J01-Antibacterials for systemic use |
FDA |
Jun-17 |
- |
| Ertugliflozin (Steglatro) |
A10-Drugs used in diabetes |
FDA |
Dec-17 |
May-18†† |
| Macimorelin (Macrilen)O |
H01-Pituitary and hypothalamic hormones and analogues |
FDA |
Dec-17 |
- |
| Netarsudil (Rhopressa) |
S01-Ophthalmologicals |
FDA |
Dec-17 |
- |
| Ozenoxacin (Zebiax) |
D06-Antibiotics and chemotherapeutics for dermatological use |
FDA |
Dec-17 |
May-17†† |
| Padeliporfin (Tookad)C |
L01-Antineoplastic agents |
EMA |
Nov-17 |
- |
| Cenegermin (Oxervate)B,O |
S01-Ophthalmologicals |
EMA |
Jul-17 |
- |
| Semaglutide (Ozempic) |
A10-Drugs used in diabetes |
FDA |
Dec-17 |
Jan-18†† |
| Tisagenlecleucel (Kymriah)B,C,O,G |
L03-Immunostimulants |
FDA |
Aug-17 |
Sep-18†† |
| Herpes zoster vaccine [recombinant, adjuvanted] (Shingrix Vaccine)B |
J07-Vaccines |
HC |
Oct-17 |
Oct-17†† |
| Voretigene neparvovec (Luxturna)B,O,G |
S01-Ophthalmologicals |
FDA |
Dec-17 |
- |
Note: A new medicine was considered to be launched if it received market approval through the US Food and Drug Administration (FDA), the European Medicines Agency (EMA), and/or Health Canada in 2017.
Availability and sales information refers to all forms and strengths of the medicine while pricing and treatment costs are based on the highest-selling form and strength indicated. Sales are based on manufacturer list prices.
* B: biologic; C: cancer; O: orphan medicines; G: gene therapies.
† Level 2 of the Anatomical Classification of Pharmaceutical Products, as reported in MIDAS™, except for the new medicines without sales data in MIDAS™, for which the reporting is based on the Anatomic Therapeutic Chemical (ATC) Classification System maintained by the World Health Organization (WHO).
‡ France, Germany, Italy, Sweden, Switzerland, the United Kingdom, and the United States.
§ Sources for Canadian unit prices:
- i MIDAS™ Database, Q4-2017.
- ii CADTH's Canadian Drug Expert Committee Recommendation report.
- iii pCODR Expert Review Committee (pERC) Recommendation report.
** Treatment costs were calculated using Canadian list prices if available; otherwise, the foreign median price or available foreign price was used. Information on dosing regimens was taken from the product monograph provided by Health Canada, or the
FDA or
EMA if unavailable though Health Canada.
†† No Canadian sales data in MIDAS™ as of Q4-2017. Notice of Compliance issued as of December 31, 2018.
Data source: IQVIA MIDAS™ Database, 2017 (all rights reserved); US Food and Drug Administration Novel Drugs 2017; European Medicines Agency Human Medicines Highlights 2017; Health Canada Notice of Compliance database.
D. Biosimilar Market, 2006–2017
Over the last decade, a growing number of biosimilars have entered international markets, as important biologic medicines near the end of their patent life. The foreign experience has been marked by earlier biosimilar entry, and greater uptake than what is observed in Canada.
This new section reports on the availability, pricing, and uptake of biosimilar medicines approved by the FDA, EMA, and/or Health Canada from 2006 to 2017. For the purpose of this analysis, a biosimilar medicine encompasses all approved biosimilar trade names.
The majority of biosimilars were introduced to the market within the last four years. As of 2017, a total of 14 new biosimilar medicines were approved in Canada, Europe, and the US (see Figure D1). The EMA had the greatest number of approvals (13), the FDA had significantly fewer (9), and Health Canada approved less than half (6) of the new biosimilars.
The time between the approval and first sales for biosimilar medicines in a given country at any point in time is influenced by a variety of factors, including the length of the remaining patent protection for the reference biologic and any relevant patent litigation, as well as the manufacturer's decision to launch and the timing of that decision.
Figure D1 Cumulative number of biosimilar medicines approved from 2006 to 2017
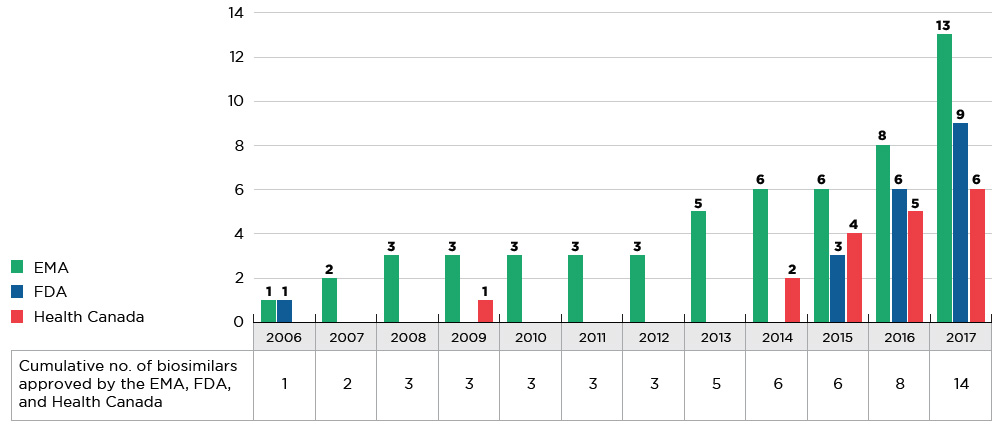
Figure description
This figure consists of a bar graph and accompanying table. The bar graph gives the number of biosimilar medicines approved from 2006 to 2017 by each of three regulatory agencies: the Food and Drug Administration (FDA) in the United States, the European Medicines Agency (EMA), and Health Canada. An associated table provides the combined total number of biosimilar medicines approved across these agencies. Both the graph and table report cumulative annual results.
blank
| |
2006 |
2007 |
2008 |
2009 |
2010 |
2011 |
2012 |
2013 |
2014 |
2015 |
2016 |
2017 |
| EMA |
1 |
2 |
3 |
3 |
3 |
3 |
3 |
5 |
6 |
6 |
8 |
13 |
| FDA |
1 |
- |
- |
- |
- |
- |
- |
- |
- |
3 |
6 |
9 |
| Health Canada |
- |
- |
- |
1 |
- |
- |
- |
- |
2 |
4 |
5 |
6 |
| Cumulative number of biosimilars approved |
1 |
2 |
3 |
3 |
3 |
3 |
3 |
5 |
6 |
6 |
8 |
14 |
Data source: US Food and Drug Administration (FDA), European Medicines Agency (EMA), and Health Canada databases.
The 14 approved biosimilars and their reference biologics are an important market segment, accounting for $3.5 billion in sales in Canada and 13.3% of the international market for prescription medicines in 2017. Table D1 explores the availability and uptake for these 14 biosimilars as of the end of 2017.
The results show that Europe generally had earlier approval dates for the first biosimilar of a biologic, as well as earlier sales availability. As of 2017, there was an average of 3.2 approved trade names for each biosimilar medicine in Europe compared to only 1.7 in CanadaFootnote 4. However, an assessment of the level of competition in the biosimilar market is beyond the scope of this study.
While the uptake of biosimilars has been relatively high in many OECD countries, including the PMPRB7, the uptake in Canada has been more modest. The overall OECD median biosimilar uptake in Q4-2017 was 31.1%, compared to only 6.8% in Canada. Further information on select biosimilar uptake by country is available in Appendix II.
Table D1 Availability and uptake of biosimilars in Canada and internationally
| Medicine (reference biologic) |
Sales in Canada,
2017,
$million |
Share of pharmaceutical market (sales), 2017 |
First biosimilar approval* |
First biosimilar sales* |
Biosimilar uptake,
share of units,
Q4-2017
(no. of countries†)
|
| Canada |
PMPRB7 and Canada |
EMA |
FDA |
Health Canada |
EU |
US |
Canada |
OECD median |
PMPRB7 median |
Canada |
| Infliximab (Remicade) |
1,092.1 |
4.5% |
1.3% |
Sep-13 |
May-17 |
Jan-14 |
Q4-2013 |
Q4-2016 |
Q1-2015 |
40.5%
(25) |
45.4%
(7) |
4.0% |
| Adalimumab (Humira) |
717.4 |
2.9% |
3.4% |
Mar-17 |
Sep-16 |
May-18 |
- |
- |
- |
- |
- |
- |
| Etanercept (Enbrel) |
316.3 |
1.3% |
1.8% |
Jan-16 |
Aug-16 |
Aug-16 |
Q1-2016 |
- |
Q4-2016 |
9.9%
(16) |
37.4%
(5) |
3.1% |
| Trastuzumab (Herceptin) |
277.4 |
1.1% |
0.7% |
Nov-17 |
Dec-17 |
- |
Q2-2018 |
- |
- |
- |
- |
- |
| Insulin glargine (Lantus) |
274.4 |
1.1% |
1.7% |
Sep-14 |
Dec-15 |
Sep-15 |
Q2-2015 |
Q4-2016 |
Q1-2016 |
8.1%
(25) |
8.5%
(7) |
2.6% |
| Rituximab (MabThera/Rituxan) |
255.7 |
1.1% |
0.9% |
Feb-17 |
- |
- |
Q2-2017 |
- |
- |
6.1%
(10) |
19.6%
(4) |
- |
| Filgrastim (Neupogen) |
128.1 |
0.5% |
0.2% |
Sep-08 |
Mar-15 |
Dec-15 |
Q4-2008 |
Q2-2016 |
Q2-2016 |
88.6%
(28) |
91.1%
(7) |
43.5% |
| Bevacizumab (Avastin) |
112.7 |
0.5% |
0.7% |
Jan-18 |
Sep-17 |
Apr-18 |
- |
- |
- |
- |
- |
- |
| Epoetin alfa (Eprex/Erypo; Epogen/Procrit) |
101.6 |
0.4% |
0.5% |
Aug-07 |
May-18 |
- |
Q4-2007 |
- |
- |
80.5%
(20) |
57.5%
(6) |
- |
| Insulin lispro (Humalog) |
85.6 |
0.4% |
1.1% |
Jul-17 |
Nov-17 |
Nov-17 |
Q4-2017 |
Q1-2018 |
- |
- |
- |
- |
| Enoxaparin‡ (Clexane/Lovenox) |
61.2 |
0.3% |
0.3% |
Sep-16 |
NA |
- |
Q1-2017 |
NA |
- |
0.4%
(3) |
0.4%
(3) |
- |
| Somatropin (Genotropin) |
38.7 |
0.2% |
0.5% |
Apr-06 |
May-06 |
Apr-09 |
Q2-2006 |
Q1-2007 |
Q3-2009 |
11.5%
(25) |
12.4%
(7) |
22.6% |
| Teriparatide (Forsteo/Forteo) |
24.1 |
0.1% |
0.2% |
Jan-17 |
- |
- |
- |
- |
- |
- |
- |
- |
| Follitropin alfa (GONAL-f) |
19.6 |
0.1% |
0.1% |
Sep-13 |
- |
- |
Q2-2014 |
- |
- |
40.1%
(19) |
27.9%
(5) |
- |
| Total |
3,504.9 |
14.4% |
13.3% |
Sales-weighted average |
31.1% |
37.8% |
6.8% |
Note: This table reports biosimilars that received first market approval through the US Food and Drug Administration (FDA), the European Medicines Agency (EMA), and/or Health Canada by Q4-2017.
* Assessed as of Q2-2018.
† Includes only countries with recorded biosimilar sales in MIDAS™.
‡ Enoxaparin (Lovenox) was not approved under a Biologic License Application in the US. While generic versions of this medicine have been approved under the FDA’s Abbreviated New Drug Application, they are not considered to be biosimilars in the US and thus are not reflected in this analysis.
Data source: IQVIA MIDAS™ Database, 2017 (all rights reserved); US Food and Drug Administration, European Medicines Agency, and Health Canada databases.
A review of biosimilars in the OECD markets indicates that the median price discounts relative to the reference biologic are greater in Canada than in other countries. However, the prices of most biosimilars in Canada are still higher than in international markets because the reference biologics have higher prevailing prices.
Table D2 highlights the international price differential by reporting the median foreign-to-Canadian price ratios based on the PMPRB7 and the OECD markets.
Table D2 Prices, uptake, and discount rates of biosimilars with sales as of Q4-2017
Biosimilar
(highest-selling form and strength) |
Price in
Canada ($) |
Foreign-to-Canadian price ratios |
Median foreign prices (CAD) |
Discount relative to reference biologic, Q4-2017 |
| PMPRB7 |
OECD |
PMPRB7 |
OECD |
Canada |
PMPRB7 |
OECD |
Infliximab
(inf. dry bottle, 100 mg) |
535 |
1.08 |
0.93 |
578 |
495 |
45.0% |
12.8% |
17.2% |
Etanercept
(prefill autoinj, 50 mg/mL, 0.98 mL) |
274 |
0.84 |
0.87 |
231 |
237 |
30.6% |
18.2% |
13.9% |
Insulin glargine
(prefill pens, 100 IU/mL, 3 mL) |
14.30 |
0.85 |
0.77 |
12.08 |
11.00 |
23.9% |
16.2% |
12.8% |
Rituximab
(infus.via/bot., 10 mg/mL, 50 mL) |
- |
- |
- |
1,638 |
1,524 |
- |
10.0% |
11.8% |
Filgrastim
(prefill syrng, 600 y/mL, 0.5 mL) |
144 |
0.61 |
0.41 |
88.09 |
59.52 |
17.6% |
11.4% |
16.7% |
Epoetin alfa
(prefill syrng, 40 K/mL, 1 mL) |
- |
- |
- |
329 |
314 |
- |
12.1% |
9.3% |
Enoxaparin
(prefill syrng sc, 10 K/mL, 0.4 mL) |
- |
- |
- |
3.62 |
3.62 |
- |
15.6% |
15.6% |
Somatropin
(cartridges, 20 IU/mL, 1.5 mL) |
308 |
1.08 |
0.88 |
333 |
272 |
18.2% |
16.5% |
16.6% |
Follitropin alfa
(prefill pens, 600 IU/mL, 1.5 mL) |
- |
- |
- |
- |
- |
- |
14.4% |
10.4% |
| Sales-weighted average |
|
0.97 |
0.85 |
|
|
36.7% |
13.7% |
15.1% |
Data source: IQVIA MIDAS™ Database, October–December 2017. All rights reserved.
References
Canadian Agency for Drugs and Technologies in Health. 2018. International policies on the appropriate use of biosimilar drugs. Ottawa: CADTH. (Environmental scan; no. 80). Available: https://cadth.ca/international-policies-appropriate-use-biosimilar-drugs
European Medicines Agency. 2017. Human Medicines Highlights 2016. Available: http://www.ema.europa.eu/ema/index.jsp?curl=pages/news_and_events/news/2017/01/news_detail_002678.jsp&mid=WC0b01ac058004d5c1
European Medicines Agency. 2018. Human Medicines Highlights 2017. Available: http://www.ema.europa.eu/ema/index.jsp?curl=pages/news_and_events/news/2018/01/news_detail_002886.jsp&mid=WC0b01ac058004d5c1
Food and Drug Administration. 2017. Novel Drugs 2016. Silver Spring, Maryland: US FDA, Center for Drug Evaluation and Research. Available: https://www.fda.gov/Drugs/DevelopmentApprovalProcess/DrugInnovation/ucm483775.htm
Food and Drug Administration. 2018. Novel Drugs 2017. Silver Spring, Maryland: US FDA, Center for Drug Evaluation and Research. Available: https://www.fda.gov/Drugs/DevelopmentApprovalProcess/DrugInnovation/ucm537040.htm
Health Canada. 2017. Health Canada New Drug Authorizations: 2016 Highlights. Ottawa: Health Canada. Available: https://www.canada.ca/en/health-canada/services/publications/drugs-health-products/health-canada-new-drug-authorizations-2016-highlights.html
Patented Medicine Prices Review Board. 2016. Market Intelligence Report: Biologic Response Modifier Agents, 2015. Ottawa: PMPRB. Available: http://www.pmprb-cepmb.gc.ca/view.asp?ccid=1286&lang=en
Patented Medicine Prices Review Board. 2018a. PMPRB Annual Report 2017. Ottawa: PMPRB. Available: http://www.pmprb-cepmb.gc.ca/en/reporting/annual-reports
Patented Medicine Prices Review Board. 2018b. Market Intelligence Report: Anti-Vascular Endothelial Growth Factor (Anti-VEGF) Drugs for Retinal Conditions, 2017. Ottawa: PMPRB. Available: http://www.pmprb-cepmb.gc.ca/view.asp?ccid=1416&lang=en
Appendices
Appendix I: Foreign-to-Canadian Price Ratios
Bilateral foreign-to-Canadian price ratios compare the prices for each PMPRB7 country to prices available in Canada. The ratios reflect how much more or less Canadians would have paid for new medicines if they had paid the average of the prices in another country. The average price of a new medicine in Canada is set to one and the corresponding foreign prices are reported relative to this value.
For a more complete definition of the measures reported and an in-depth description of how the foreign-to-Canadian price ratios are calculated, see the Reference Documents section of the Analytical Studies page on the PMPRB website.
Table I Bilateral foreign-to-Canadian price ratios for 2016 new medicines launched in Canada by Q4-2017
| Medicine (trade name) form, strength, volume* |
FRA |
GER |
ITA |
SWE |
SWI |
UK |
US |
Velpatasvir (Epclusa)
film-ctd tabs, 400 mg + 100 mg |
1.09 |
1.07 |
1.26 |
1.07 |
0.64 |
0.97 |
1.40 |
Grazoprevir, elbasvir (Zepatier)
film-ctd tabs, 50 mg + 100 mg |
0.79 |
0.73 |
1.12 |
0.74 |
0.70 |
0.99 |
1.05 |
Nusinersen sodium (Spinraza)O
vial, 2.4 mg/mL, 5mL |
1.05 |
1.14 |
- |
1.01 |
0.99 |
0.94 |
0.69 |
Ixekizumab (Taltz)B
prefill autoinj, 80 mg/mL |
0.90 |
1.54 |
- |
0.98 |
1.10 |
1.09 |
3.74 |
Atezolizumab (Tecentriq)B,C
infus.via/bot., 60 mg/mL, 20 mL |
- |
1.13 |
- |
- |
0.96 |
0.83 |
1.46 |
Olaratumab (Lartruvo)B,C,O
infus.via/bot., 10 mg/mL, 50 mL |
- |
1.11 |
0.90 |
0.92 |
1.21 |
- |
1.31 |
Venetoclax (Venclexta)C,O
film-ctd tabs, 100 mg |
1.21 |
1.34 |
1.21 |
1.01 |
- |
0.92 |
1.46 |
Obeticholic acid (Ocaliva)O
film-ctd tabs, 5 mg |
1.77 |
1.75 |
1.40 |
1.16 |
- |
1.20 |
2.40 |
Brivaracetam (Brivlera)
film-ctd tabs, 50 mg |
- |
0.52 |
- |
0.76 |
0.85 |
0.77 |
4.49 |
Reslizumab (Cinqair)B
infus.via/bot., 10 mg/mL, 10 mL |
- |
1.21 |
- |
0.90 |
- |
1.20 |
1.62 |
Migalastat (Galafold)O
capsules, 123 mg |
0.98 |
1.00 |
0.97 |
0.94 |
- |
1.00 |
- |
* B: biologic; C: cancer; O: orphan medicines.
Data source: IQVIA MIDAS™ Database, October–December 2017. All rights reserved.
Appendix II: Biosimilar Uptake of Top-selling Biologics in Canada
Biosimilar uptake in Canadian and international markets is impacted by several contributing factors. Alongside variations in the number and time of approvals, a wide range of policies have been implemented internationally to promote the use of biosimilar medicines. These policies cover the interchangeability, switching, and substitution of biosimilar medicines, as well as their pricing and procurement.
The following figures report the uptake by country for four of the highest-selling biosimilars in Canada: infliximab, etanercept, insulin glargine, and filgrastim. The results suggest that biosimilar uptake in Canada is relatively low compared to that in other OECD countries, many of which have policies in place to encourage a higher rate of use.
While a review of international biosimilar policies is outside the scope of this study, previous work published by CADTHFootnote 5 suggests that these include, but are not limited to, automatic substitution (US, Germany, France, and Australia), recommendations to prescribe biosimilars for treatment-naive patients, and the encouragement of physician-led switching for patients already treated with a reference biologic (Germany, France, Norway, Finland, and Australia).
For example, Norway, which is one of the countries with the highest biosimilar uptake, has implemented effective policies to promote the use of filgrastim, infliximab, and etanercept, resulting in an uptake of greater than 80% for each of these medicines. Norway promotes physician switching from the reference biologic to its biosimilar, and employs a national tending system for hospital medicines to require the use of the cheapest available product. They have also listed biosimilars as the official choice of medicines for indications such as rheumatoid arthritis, ankylosing spondylitis, Crohn’s disease, and ulcerative colitis.
The reported results reflect a snapshot of biosimilar uptake as of Q4-2017, and any differences may be due to the length of time that the biosimilar has been on the market.
Figure II Biosimilar share of units for top-selling biologics in Canada, by medicine, OECD countries, Q4-2017
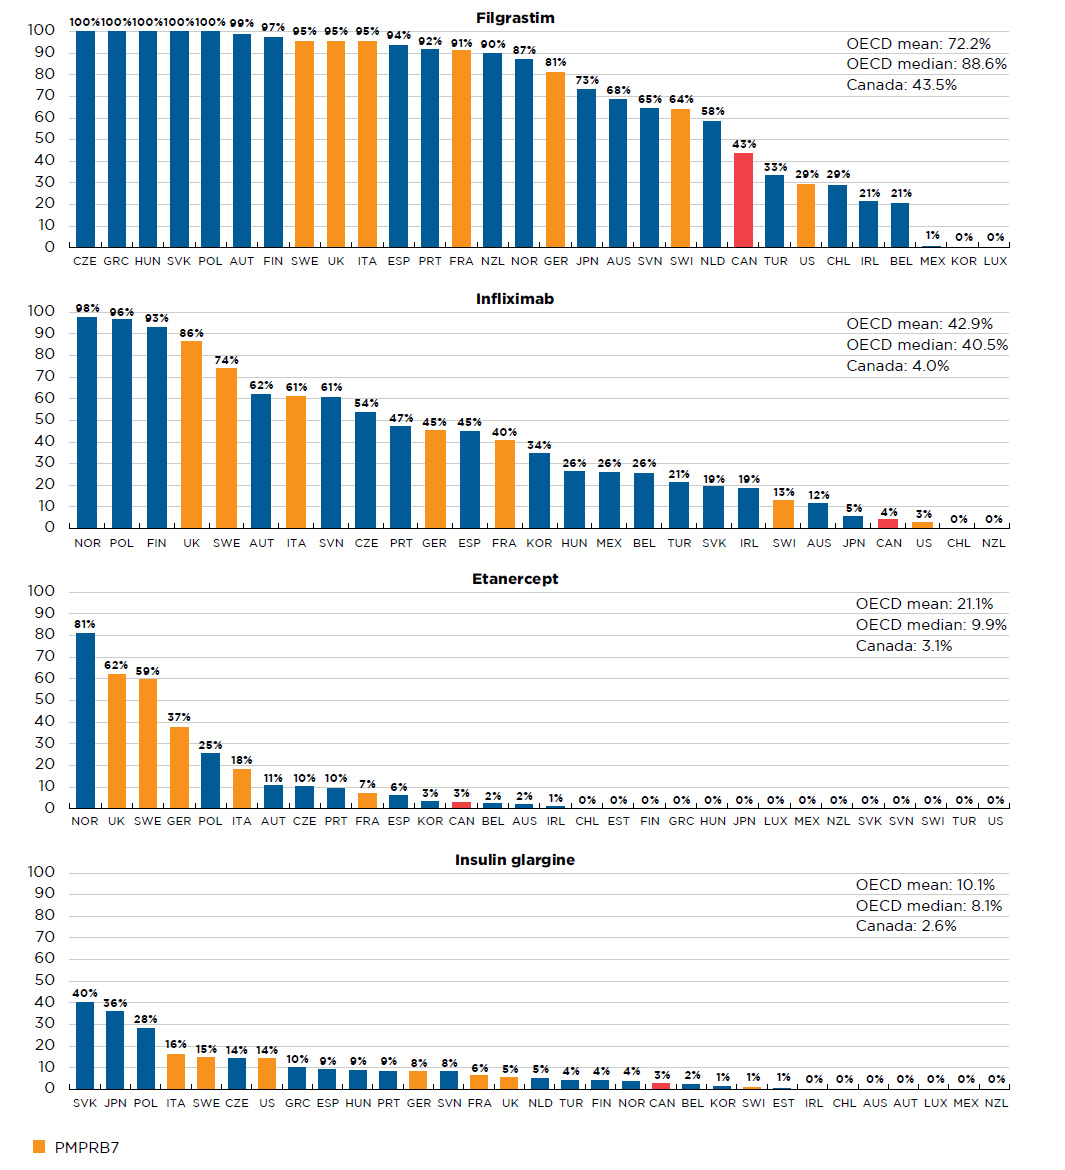
Figure description
This figure consists of four bar graphs with the share of units by country for four biosimilar medicines: filigrastim, infliximab, etanercept, and insulin glargine.
blank
| Filgrastim |
Infliximab |
Etanercept |
Insulin glargine |
| Country |
Share of units |
Country |
Share of units |
Country |
Share of units |
Country |
Share of units |
| Czech Republic |
100% |
Norway |
98% |
Norway |
81% |
Slovakia |
40% |
| Greece |
100% |
Poland |
96% |
United Kingdom |
62% |
Japan |
36% |
| Hungary |
100% |
Finland |
93% |
Sweden |
59% |
Poland |
28% |
| Slovakia |
100% |
United Kingdom |
86% |
Germany |
37% |
Italy |
16% |
| Poland |
100% |
Sweden |
74% |
Poland |
25% |
Sweden |
15% |
| Austria |
99% |
Austria |
62% |
Italy |
18% |
Czech Republic |
14% |
| Finland |
97% |
Italy |
61% |
Austria |
11% |
United States |
14% |
| Sweden |
95% |
Slovenia |
61% |
Czech Republic |
10% |
Greece |
10% |
| United Kingdom |
95% |
Czech Republic |
54% |
Portugal |
10% |
Spain |
9% |
| Italy |
95% |
Portugal |
47% |
France |
7% |
Hungary |
9% |
| Spain |
94% |
Germany |
45% |
Spain |
6% |
Portugal |
9% |
| Portugal |
92% |
Spain |
45% |
Korea |
3% |
Germany |
8% |
| France |
91% |
France |
40% |
Canada |
3.1% |
Slovenia |
8% |
| New Zealand |
90% |
Korea |
34% |
Belgium |
2% |
France |
6% |
| Norway |
87% |
Hungary |
26% |
Australia |
2% |
United Kingdom |
5% |
| Germany |
81% |
Mexico |
26% |
Ireland |
1% |
Netherlands |
5% |
| Japan |
73% |
Belgium |
26% |
Chile |
0% |
Turkey |
4% |
| Australia |
68% |
Turkey |
21% |
Estonia |
0% |
Finland |
4% |
| Slovenia |
65% |
Slovakia |
19% |
Finland |
0% |
Norway |
4% |
| Switzerland |
64% |
Ireland |
19% |
Greece |
0% |
Canada |
2.6% |
| Netherlands |
58% |
Switzerland |
13% |
Hungary |
0% |
Belgium |
2% |
| Canada |
43.5% |
Australia |
12% |
Japan |
0% |
Korea |
1% |
| Turkey |
33% |
Japan |
5% |
Luxembourg |
0% |
Switzerland |
1% |
| United States |
29% |
Canada |
4.0% |
Mexico |
0% |
Estonia |
1% |
| Chile |
29% |
United States |
3% |
New Zealand |
0% |
Ireland |
0% |
| Ireland |
21% |
Chile |
0% |
Slovakia |
0% |
Chile |
0% |
| Belgium |
21% |
New Zealand |
0% |
Slovenia |
0% |
Australia |
0% |
| Mexico |
1% |
- |
- |
Switzerland |
0% |
Austria |
0% |
| Korea |
0% |
- |
- |
Turkey |
0% |
Luxembourg |
0% |
| Luxembourg |
0% |
- |
- |
United States |
0% |
Mexico |
0% |
| - |
- |
- |
- |
- |
- |
New Zealand |
0% |
| OECD mean |
72.2% |
42.9% |
21.1% |
10.1% |
| OECD median |
88.6% |
40.5% |
9.9% |
8.1% |
Note: Countries without recorded biosimilar sales in MIDAS™ are excluded from the calculation of OECD averages.
Data source: International Policies on the Appropriate Use of Biosimilar Drugs (Canadian Agency for Drugs and Technologies in Health, 2018); IQVIA MIDAS™ Database, 2017 (all rights reserved).