Market Intelligence Report: Anti-Vascular Endothelial Growth Factor (Anti-VEGF)
Drugs for Retinal Conditions, 2017
Acknowledgements
This report was prepared by the Patented Medicine Prices Review Board (PMPRB) as part of the National Prescription Drug Utilization Information System (NPDUIS) initiative.
The PMPRB wishes to acknowledge and thank the members of the NPDUIS Advisory Committee for their expert oversight and guidance in the preparation of this report. Please note that the statements, findings, and conclusions do not necessarily reflect those of the members or their organizations.
Appreciation goes to the PMPRB staff Tanya Potashnik and Elena Lungu for their oversight in the development of the report as well as to Brian O’Shea for leading this analytical project. The PMPRB also wishes to acknowledge the contribution of the analytical staff Karine Landry, Nevzeta Bosnic, Yvonne Zhang, and Jared Berger; and the contribution of the editorial staff Carol McKinley, Sarah Parker, and Shirin Paynter.
Disclaimer
NPDUIS operates independently of the regulatory activities of the Board of the PMPRB. The research priorities, data, statements, and opinions expressed or reflected in NPDUIS reports do not represent the position of the PMPRB with respect to any regulatory matter. NPDUIS reports do not contain information that is confidential or privileged under sections 87 and 88 of the Patent Act, and the mention of a medicine in a NPDUIS report is not and should not be understood as an admission or denial that the medicine is subject to filings under sections 80, 81, or 82 of the Patent Act or that its price is or is not excessive under section 85 of the Patent Act.
Although this information is based in part on data obtained from the NPDUIS Database of the Canadian Institute for Health Information (CIHI) and under license from IQVIA’s MIDAS™ Database, the IQVIA Payer Insight Database, and the IQVIA Private Pay Direct Drug Plan Database, the statements, findings, conclusions, views, and opinions expressed in this report are exclusively those of the PMPRB and are not attributable to CIHI or IQVIA.
Contact Information
Patented Medicine Prices Review Board
Standard Life Centre
Box L40
333 Laurier Avenue West
Suite 1400
Ottawa, ON K1P 1C1
Telephone: 1-877-861-2350
TTY: 613-288-9654
Email: PMPRB.Information-Renseignements.CEPMB@pmprb-cepmb.gc.ca
Executive Summary
The PMPRB Market Intelligence Report series provides detailed information on specific therapeutic market segments of importance to Canadians. These targeted analyses are designed to inform policy discussions, aid in evidence-based decision making, and provide Canadians with insight into issues pertaining to pharmaceutical pricing and utilization in Canada and internationally.
This edition of the report analyzes the rapidly growing market for biologic anti-vascular endothelial growth factor (anti-VEGF) drugs used in the treatment of wet (neovascular) age-related macular degeneration (AMD) and other retinal conditions. AMD is the leading cause of visual impairment in adults over 50, with the more serious "wet" form affecting over 100,000 CanadiansFootnote i.
The development of anti-VEGF drugs has offered significant improvements in the treatment of these conditions, resulting in a remarkable uptake in their use and an increase in related costs. The impact is especially high for public drug plans given the prevalence of AMD and other age-related retinal diseases among the senior population.
The analysis focuses on Lucentis (ranibizumab), launched in 2007, and Eylea (aflibercept), launched in 2013, the two biologic anti-VEGF drugs approved for retinal conditions, and also reports on Avastin (bevacizumab), launched in 2005, an anti-VEGF drug approved for cancer treatment that has widespread off-label use for some retinal conditions.
The report provides insight into the use of these drugs, their market shares, pricing, and annual treatment costs. It explores Canadian markets from the national as well as public and private payer perspectives, positioning them within an international context. The findings focus on the 2017 calendar year, with a retrospective look at trends over the past decade.
International markets examined include the Organisation for Economic Co-operation and Development (OECD) members, with a focus on the seven countries the PMPRB considers in reviewing the prices of patented medicines (PMPRB7): France, Germany, Italy, Sweden, Switzerland, the United Kingdom (UK), and the United States (US).
Key Findings
Canadian use and sales of anti-VEGF drugs Lucentis and Eylea are amongst the highest in the OECD
- In 2017, the combined sales of Lucentis and Eylea in Canada climbed to $692 million, an increase of $100 million or 16.7% over the previous year. Since 2008, cumulative sales for Lucentis and Eylea in Canada have amounted to more than $3.6 billion.
- Biologic anti-VEGF drugs for retinal conditions account for an increasing share of the total Canadian pharmaceutical market, reaching 2.8% in 2017, well above the OECD median.
- Canada had the second-highest sales per capita and the third-highest consumption per capita of Lucentis and Eylea in the OECD. Of the PMPRB7 comparator countries, only Switzerland had greater per capita sales and consumption rates.
Anti-VEGF drugs are predominantly reimbursed by public drug plans in Canada, as the senior population has a higher prevalence of AMD and other age-related retinal conditions
- Public drug plans were the first payer of prescription costs for 82% of the national retail sales for Lucentis and Eylea, while private and out-of-pocket payers accounted for 12% and 6%, respectively.
- Lucentis and Eylea accounted for over 6% of 2017 drug costs in NPDUIS public plans with available data, compared to less than 1% in private plans.
- Public plans paid for 99% of the prescription costs related to these drugs for their eligible beneficiaries.
Anti-VEGF drugs for retinal conditions have relatively high treatment costs and a sizable patient population
- There is limited competition in the anti-VEGF market for retinal conditions, with only Lucentis and Eylea approved in Canada, and Avastin used off label.
- The average annual treatment cost for Lucentis is about $8,500 in public and private drug plans, while Eylea is comparable at around $8,300 in public plans and $8,700 in private plans. Avastin comes at a fraction of this cost, estimated at $400 based on the dosage regimen for wet AMD considered by CADTH.
- The combination of relatively high treatment costs and a large number of beneficiaries makes anti-VEGFs for retinal conditions the second most important therapeutic subclass in terms of drug costs in public plans, after tumor necrosis factor alpha inhibitors (anti-TNFs), which include many of the biologic DMARDs analyzed in the previous edition of this report. These two subclasses fall outside the trends observed in other top therapeutic areas.
The prices for Lucentis and Eylea are markedly higher in Canada than in foreign markets, with important cost implications especially for Canadian public payers
- Canadian list prices of Lucentis and Eylea are the second highest among the PMPRB7, trailing only the US, with median PMPRB7 prices 37% lower for Lucentis and 15% lower for Eylea in 2017.
- Compared to the OECD countries, the price differentials are even greater, with the median OECD price 39% lower for Lucentis and 26% lower for Eylea than in Canada in 2017.
- While the price differentials were less pronounced in the case of Avastin, Canada still had the third highest price amongst the PMPRB7, and the median OECD price was 20% lower than in Canada in 2017.
- The cost implications of paying higher list prices for Lucentis and Eylea in Canada are substantial, totaling an estimated $168 million nationally in 2017 when compared to the median PMPRB7 price, with most of the impact falling on public plans.
Data sources: The data sources for international, Canadian national, and Canadian public and private drug plans are: the IQVIA MIDAS™ Database (all rights reserved); the Canadian Institute for Health Information’s NPDUIS Database; IQVIA’s Private Drug Plan Database; IQVIA’s Payer Insight Database; IQVIA's Canadian Drug Store and Hospital Purchases Audit; and the PMPRB Human Drug Advisory Panel reviews.
Limitations:
The reported data does not differentiate between indications, so the drug utilization and costs reported are associated with all uses. Foreign and Canadian national sales and prices are based on manufacturer list prices, while drug plan costs are based on the amounts accepted for reimbursement. None of the values reported capture off-invoice price rebates, managed entry agreements (also known as product listing agreements), or patient access schemes. Thus, the price differentials and the cost implications presented here may be overestimated or underestimated depending on the actual rebated prices in Canada and foreign markets.
Introduction
The amount spent on biologic drugs has increased markedly over the last two decades, putting considerable pressure on Canadian and international pharmaceutical spending. The first edition of the PMPRB Market Intelligence Report examined the Canadian and international markets for biologic response modifier agents for rheumatoid arthritis. This second edition provides insight into another high-growth class of biologics: the anti-vascular endothelial growth factor (anti-VEGF) drugs used in the treatment of wet (neovascular) age-related macular degeneration (AMD) and other retinal conditions.
AMD is the leading cause of visual impairment in adults over 50, with the more serious "wet" form affecting over 100,000 CanadiansFootnote 1. In Canada, the
prevalence rate is similar to that in the US and many
European countries, but somewhat greater than
in other regions in the world. The launch of the anti-VEGF drugs for retinal conditions offered significant improvements in the treatment of the wet AMD, resulting in a remarkable uptake in the use and related costs of these drugs.
This report focuses on Lucentis and Eylea, the two anti-VEGF drugs approved for the treatment of retinal conditions in Canada. Avastin is included for comparison where applicable, given its off-label use for retinal conditions. Canadian and international markets are examined to provide insight into the use of these drugs, their market shares, pricing, and annual treatment costs. The analysis targets the 2017 calendar year, while also providing a retrospective look at trends over the last decade.
Given the importance of anti-VEGF drugs in Canada, the results of this study are intended to inform policy discussions and aid in evidence-based decision making, while providing Canadians with insight into pharmaceutical pricing and utilization in Canada and internationally.
Age-related macular degeneration (AMD)
There are two forms of AMD: wet and dry. Wet (neovascular) AMD is the more serious form, occurring when blood vessels below the retina grow abnormally, leaking blood and damaging the macula. Wet AMD accounts for approximately only 10% of all AMD cases, but can result in permanent vision loss within weeks or months. The Canadian Ophthalmological Society considers anti-VEGF injections the best available therapy to treat wet AMDFootnote 2.
Dry AMD, which is the more common form of the disease, is caused by the aging of cells beneath the retina. It tends to progress more slowly than the wet form and vision is degraded over the course of several years. The progression of dry AMD can be slowed by treatment with a specific vitamin regimenFootnote 2. None of the anti-VEGFs in this report are indicated for the treatment of dry AMD.
Methods
Drug Selection
This report focuses on biologic anti-VEGF drugs approved for the treatment of retinal conditions in Canada: Lucentis (ranibizumab) and Eylea (aflibercept). Avastin (bevacizumab) is also included in some of the analysis due to its off-label use for retinal conditions.
Drug selection was based on the PMPRB’s Human Drug Advisory Panel (HDAP) scientific assessments of medicines for wet AMD. As part of these assessments, HDAP provides recommendations for the selection of appropriate comparator medicines to be used in the PMPRB’s price review process.
Lucentis and Eylea are assigned to the same fourth-level World Health Organization (WHO) Anatomical Therapeutic Chemical (ATC) class: S01LA - antineovascularisation agents. This class also includes the non-biologic medicines verteporfin, anecortave, and pegaptanib, which are not included in this report. Verteporfin (Visudyne) is used in photodynamic therapy for wet AMD; however, the Canadian Ophthalmological Society ranks it as less effective than anti-VEGF therapyFootnote 2. Anecortave and pegaptanib are not available in Canada, the latter being initially approved (2005) but later withdrawn from the market (2008).
While Avastin belongs to the ATC class L01XC - monoclonal antibodies indicated for the treatment of cancer, it has widely recognized off-label use for retinal conditions. It was used as a comparator in the HDAP assessment of Eylea for wet AMD (2014), and the Canadian Agency for Drugs and Technologies in Health (CADTH) included Avastin in its 2016 therapeutic review of anti-VEGF drugs for the treatment of retinal conditionsFootnote 3. The WHO lists Avastin in its Essential Medicines List as an ophthalmological preparationFootnote 4.
Approach
International markets examined include the Organisation for Economic Co-operation and Development (OECD) members, with a focus on the seven countries the PMPRB considers in reviewing the prices of patented medicines (PMPRB7): France, Germany, Italy, Sweden, Switzerland, the United Kingdom (UK), and the United States (US).
Canadian and international rates of drug consumption per capita were determined by converting the physical quantity of drugs sold into annual treatment doses per patient and expressing the result on a per capita basis. Annual treatment doses were based on PMPRB HDAP dosage regimens, which consider information from clinical trials, product monographs, and other relevant guidelines.
Average foreign-to-Canadian price ratios for the selected drugs were calculated for a variety of bilateral and multilateral measures. Bilateral price ratios compare the price levels for an individual country to those in Canada, while multilateral ratios compare the prices across all countries (PMPRB7 or OECD) to those in Canada. The resulting ratios reflect how much more or less Canadians would have paid for anti-VEGF drugs if they had paid average international prices (multilateral measures) or the prices in a specific country (bilateral measures). For more details on how foreign-to-Canadian price ratios are calculated, see the Reference Documents section of the Analytical Studies page on the PMPRB website.
Data Sources
The findings presented in this report are based on the analysis of a number of databases. The results pertaining to the Canadian national and international drug sales, prices, and utilization are based on data captured in the IQVIA MIDAS™ Database (all rights reserved). The NPDUIS Database from the Canadian Institute for Health Information (CIHI) was used in the analyses of the public drug plan market, while the IQVIA Private Drug Plan database was used in the analyses of the private drug plan market. The IQVIA Payer Insights databases provided information on the market breakdown by payer type, and the IQVIA Canadian Drug Store and Hospital Purchases Audit (CDH) was used for an analysis of provincial sales distribution. For more information on these data sources, see the Reference Documents section of the Analytical Studies page on the PMPRB website.
Limitations
The market for anti-VEGFs for retinal conditions is a complex therapeutic area, marked by multiple retinal indications for Lucentis and Eylea, by the off-label use of Avastin, as well as by the use of multiple doses from a single vial, among other issues. The results reported do not distinguish between indications and, thus, include the drug utilization and costs associated with all uses. For example, the results for Lucentis and Eylea do not distinguish between their use for wet AMD and for other retinal indications, and the results for Avastin do not differentiate between its approved use for cancer and its off-label use for retinal conditions. While the practice of extracting multiple doses from a single vial is expected to impact the use and the treatment cost of these drugs, these aspects are not the focus of this study.
Foreign and Canadian national sales and prices are based on manufacturer list prices, while drug plan costs are based on the amounts accepted for reimbursement. None of the values reported capture off-invoice price rebates, managed entry agreements (also known as product listing agreements), or patient access schemes.
Thus, the price differentials and the cost implications presented here may be overestimated or underestimated depending on the actual rebated prices in Canada and foreign markets.
Depending on the country, anti-VEGF drugs may be dispensed through the retail or hospital sectors or a combination of both. The prices reported here may vary depending on the differences between the procurement processes in these sectors.
Some of the public drug plans participating in the NPDUIS initiative do not report data on drugs used for retinal conditions, as they are reimbursed through special eye care programs (British Columbia, Manitoba, and Nova Scotia), thus the total Canadian public drug plan use is underestimated. The results are also heavily skewed by Ontario due to the relatively large size of this public drug plan.
While the data limitations and complexity of treatment make it difficult to gain a complete picture of the market for anti-VEGFs for retinal conditions, the findings in this report provide insight into Canada’s position internationally in terms of use, sales, and pricing.
1. Drug Status in Canada
Anti-VEGFs have been used in the treatment of retinal conditions in Canada for over a decade. Lucentis (ranibizumab), the first market entrant in 2007, brought a breakthrough or substantial level of therapeutic improvement over existing therapies. Eylea (aflibercept), which has a similar therapeutic profile, was introduced six years later and classified as providing a moderate level of improvement. Avastin (bevacizumab), which was launched in 2005, is not approved for retinal conditions in Canada, but is used off label and is reimbursed by some public plans.
Lucentis and Eylea were first approved to treat wet AMD and later received approvals for other retinal conditions including diabetic macular edema and choroidal neovascularization. While Avastin has only received market approval for cancer indications in Canada, it has been used off label for the treatment of wet AMDFootnote 5. Internationally, the off-label use of Avastin is common in the USFootnote 6 and is considered as a cost-saving measure in the UKFootnote 7. In 2015, FranceFootnote 8 officially approved the off label use of Avastin for retinal conditions, followed by ItalyFootnote 9 in 2018. The timeline of Canadian launch and subsequent approvals for these drugs is laid out in Figure 1.1.
Figure 1.1 Canadian market approvals for anti-VEGF drugs Lucentis, Eylea, and Avastin
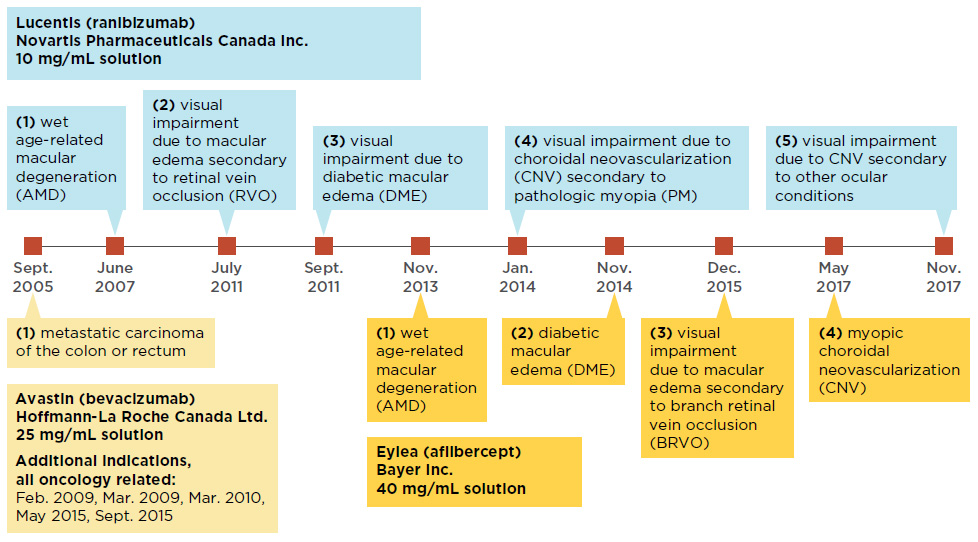
Figure description
This figure shows a timeline of the market approvals for Lucentis, Eylea, and Avastin.
blank
| |
Lucentis (ranubizumab)
Novartis Pharmaceuticals Canada Inc.
10 mg/mL solution |
Eylea (aflibercept)
Bayer Inc.
40 mg/mL solution |
Avastin (bevacizumab)
Hoffmann-La Roche Canada Ltd
25 mg/mL solution |
| September 2005 |
|
|
First – metastatic carcinoma of the colon or rectum
Additional indications, all oncology related: February 2009, March 2009, March 2010, May 2015, September 2015 |
| June 2007 |
First – wet age-related macular degeneration (AMD) |
|
|
| July 2011 |
Second – visual impairment due to macular edema secondary to retinal vein occlusion (RVO) |
|
|
| September 2011 |
Third – visual impairment due to diabetic macular edema (DME) |
|
|
| November 2013 |
|
First – wet age-related macular degeneration (AMD) |
|
| January 2014 |
Fourth – visual impairment due to choroidal neovascularization (CNV) secondary to pathologic myopia (PM) |
|
|
| November 2014 |
|
Second – diabetic macular edema (DME) |
|
| December 2015 |
|
Third – visual impairment due to macular edema secondary to branch retinal vein occlusion (BRVO) |
|
| May 2017 |
|
Fourth – myopic choroidal neovascularization (CNV) |
|
| November 2017 |
Fifth – visual impairment due to choroidal neovascularization (CNV) secondary to other ocular conditions |
|
|
Data source: Health Canada’s Drug Product Database and Notice of Compliance Database.
Background
Health Canada
Health Canada provides market authorization to drug products that have been assessed for safety, efficacy, and quality.
PMPRB – HDAP
All new patented medicines reported to the PMPRB are subject to a scientific evaluation as part of the price review process. This is conducted by the Human Drug Advisory Panel (HDAP), which makes recommendations on the level of therapeutic improvement, the primary use (where required), the selection of medicines to be used for comparison purposes, and the comparable dosage regimens.
CADTH – CDR
Through the Common Drug Review (CDR) process, the Canadian Agency for Drugs and Technologies in Health (CADTH) conducts evaluations of the clinical, economic, and patient evidence on drugs. These evaluations are used to provide reimbursement recommendations and advice to Canada’s federal, provincial, and territorial public drug plans, with the exception of Quebec, where the Institut national d’excellence en santé et en services sociaux (INESSS) performs a similar function.
pCPA
The pan-Canadian Pharmaceutical Alliance (pCPA) conducts joint provincial/territorial negotiations for brand-name and generic drugs in Canada to achieve greater value for publicly funded drug programs and patients. All brand-name drugs coming forward for funding through the CDR or pan-Canadian Oncology Drug Review (pCODR) processes are considered for negotiation.
Following their launches, both Lucentis and Eylea received a recommendation from CADTH to list with criteria or conditions in public drug plans, and each plan subsequently reimbursed at least one of the drugs.
Table 1.2 reports on the Canadian assessments, recommendations, negotiation status, and reimbursement decisions for Lucentis, Eylea, and Avastin, as well as any associated biosimilars approved for use in Canada or internationally.
The PMPRB’s Human Drug Advisory Panel (HDAP) classified Lucentis as providing a breakthrough or substantial level of therapeutic improvement for its wet AMD indication and found no comparable medicines available at introduction. HDAP compared Eylea, the next anti-VEGF entrant, to Lucentis and Avastin and found that it brought a moderate level of therapeutic improvement for wet AMD due to its decreased treatment burden, as it requires less frequent injections (bimonthly rather than monthly). The HDAP assessment of Avastin, which was launched before Lucentis and Eylea, was based on its oncology indication, in accordance with its market approval.
CADTH’s Common Drug Review (CDR) recommended that both Lucentis and Eylea be listed with criteria or conditions in public plans for the wet AMD indication. For Lucentis, the CDR recommended a maximum of 15 vials per patient. For Eylea, the recommendation was conditional on the treatment costing less than therapy with Lucentis, as the two drugs were found to be “clinically equivalent…for maintaining vision in treatment-naïve patients with wet AMD.”Footnote 10 Both drugs were subsequently recommended with criteria or conditions for other retinal indications.
While Avastin has not been assessed individually by the CDR for any retinal conditions, it was included in a 2016 CADTH therapeutic review of anti-VEGFs for the treatment of retinal conditions including wet AMD, where it was recommended as “the preferred initial anti-VEGF therapy, based on similar clinical effectiveness and lower cost” compared to Lucentis and EyleaFootnote 3.
All three anti-VEGFs analyzed in this report have been the subject of negotiations through the pan-Canadian Pharmaceutical Alliance (pCPA), with varying results. The pCPA did not complete negotiations for Lucentis, instead recommending that provinces and territories pursue their own individual negotiations for its use in choroidal neovascularization. For Eylea, the pCPA completed two negotiations, one for wet AMD and other retinal conditions, and the second for macular edema secondary to branch retinal vein occlusion. Three negotiations for Avastin have been completed by the pCPA, all for cancer indications.
In Canada, each public drug plan reimburses beneficiaries based on their own specific eligibility criteria, cost-sharing structures, and formulary listing decisions. Anti-VEGFs for retinal conditions are broadly covered by all public drug plans: Lucentis is reimbursed by all plans, while Eylea is reimbursed by all but Manitoba. Avastin is reimbursed for off-label retinal use by public plans in British Columbia, Alberta, Manitoba, New Brunswick, Nova Scotia, Yukon and the NIHB. In some provinces, these drugs are listed in the general formularies, while in others they are part of special eye care programs (e.g., British Columbia, Alberta, Manitoba, and Nova Scotia).
Only one biosimilar version of Lucentis, which was launched in India, is currently available internationally. There are no biosimilars of Eylea available in Canada or in international markets. A biosimilar of Avastin was recently approved in the USFootnote 11 and the European UnionFootnote 12 in September 2017 and January 2018, respectively, and received Notice of Compliance in Canada in April 2018 with two indications for cancer.
There are a number of new treatments for wet AMD in development, most notably brolucizumabFootnote 13 and abiciparFootnote 14. These two medicines each completed Phase III trials in 2018, demonstrating non-inferiority to Eylea and Lucentis, respectively. Both were studied with dosage regimens of one injection every 12 weeks, representing an advantage over existing anti-VEGF treatments which required more frequent dosing. It is uncertain when, or if, either of these medicines will be launched.
Table 1.2 Assessments, recommendations, negotiation status, and reimbursement decisions for anti-VEGFs for retinal conditions in Canada
| Trade name (medicinal ingredient), manufacturer |
PMPRB HDAP assessment |
CADTH recommendations* |
pCPA negotiation status |
Public reimbursement |
Biosimilar availability |
| Canada |
International |
Lucentis
(ranibizumab), Novartis |
Category 2: equivalent to Breakthrough or Substantial Improvement |
Mar. 2008 Wet AMD: LWCC, 15 vials per patient.
Mar. 2012 Macular edema, diabetic: LWCC, 9 vials per patient.
Oct. 2012 Macular edema secondary to RVO: LWCC, 24 month duration, 10–12 vials per patient.
Feb. 2015 Choroidal neovascularisation, myopic: LWCC, should not exceed cost of therapy with verteporfin.
May 2016 Anti-VEGFs for Retinal Conditions Therapeutic Review: alternative treatment for patients who do not respond to Avastin. |
0 complete:
pCPA recommends P/T negotiate individually for choroidal neovascularization indication |
All provinces, YT, and the NIHB |
No |
India |
| Eylea (aflibercept), Bayer |
Moderate Improvement |
Oct. 2014 Wet AMD: LWCC, drug plan cost should provide cost savings relative to treatment with Lucentis.
May 2015 Macular edema, diabetic: LWCC, cost savings relative to Lucentis.
May 2015 Macular edema secondary to CRVO: LWCC, cost savings relative to Lucentis.
May 2016 Anti-VEGFs for Retinal Conditions Therapeutic Review: alternative treatment for patients who do not respond to Avastin.
July 2016 Macular edema secondary to BRVO: LWCC, cost savings relative to Lucentis. |
2 complete:
(1) Wet AMD and other retinal conditions
(2) Macular edema secondary to branch retinal vein occlusion |
All provinces (except MB), YT, and the NIHB |
No |
No |
| Avastin (bevacizumab), Hoffmann-La Roche |
None |
May 2016 Anti-VEGFs for Retinal Conditions Therapeutic Review: preferred initial anti-VEGF therapy. |
0 complete |
Reimbursed off label in BC, AB, MB, NB, NS, YT, and the NIHB |
Yes |
US, EU |
| *AMD: age-related macular degeneration; anti-VEGF: anti-vascular endothelial growth factor; BRVO: branch retinal vein occlusion; CRVO: central retinal vein occlusion; LWCC: list with criteria or conditions; RVO: retinal vein occlusion. |
2. International Market Overview
Anti-VEGFs for retinal conditions are a $700 million market in Canada, marked by strong sales growth over the last decade. These drugs now account for a substantial share of Canadian pharmaceutical sales, well above the OECD median. Canadian per capita spending and consumption rates for anti-VEGFs are also among the highest in the OECD.
By 2017, the combined sales for Lucentis and Eylea accounted for 2.8% of the total Canadian pharmaceutical market, reaching $692 million, a growth of nearly $100 million (16.7%) over the previous year. Since 2008, cumulative sales for these drugs have exceeded $3.6 billion in Canada.
In the absence of a competitor, Lucentis demonstrated a solid sales growth for the first six years until the launch of Eylea in 2013. Over the next few years, sales of Eylea grew rapidly, gradually drawing a large portion of the market share away from Lucentis. By 2017, Eylea became the dominant product, capturing 56% of the sales for the class. Figure 2.1 reports these trends, showing the sales revenue for Lucentis decreasing as Eylea broadens its market share, while the combined sales for both drugs continue to increase.
Figure 2.1 Trends in Canadian sales* for Lucentis and Eylea, 2008–2017
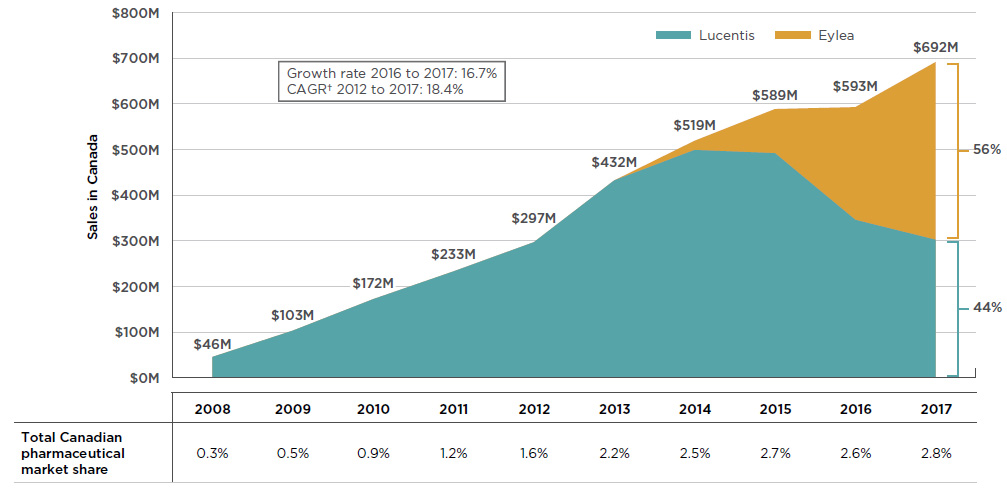
Figure description
This is an area graph depicting the annual Canadian sales for Lucentis and Eylea from 2008 to 2017 in millions of dollars. Combined totals are given for each year and respective market shares are indicated for 2017. Growth rate from 2016 to 2017 (16.7%) and compound annual growth rate from 2012 to 2017 (18.4%) are also given.
blank
| Sales in Canada ($) |
Share of market in 2017 |
|
2008 |
2009 |
2010 |
2011 |
2012 |
2013 |
2014 |
2015 |
2016 |
2017 |
| Lucentis |
45,688,804 |
103,285,039 |
172,188,917 |
233,003,497 |
296,926,797 |
432,195,845 |
498,917,530 |
491,856,651 |
345,836,080 |
302,285,322 |
44% |
| Eylea |
0 |
0 |
0 |
0 |
0 |
27,841 |
20,220,421 |
966,993,60 |
246,932,022 |
389,357,956 |
56% |
| Grand total (million dollars) |
46 |
103 |
172 |
233 |
297 |
432 |
519 |
589 |
593 |
692 |
|
A table below the figure lists the combined total Canadian pharmaceutical market share represented by Lucentis and Eylea for each year.
blank
|
2008 |
2009 |
2010 |
2011 |
2012 |
2013 |
2014 |
2015 |
2016 |
2017 |
| Total Canadian pharmaceutical market share |
0.30% |
0.50% |
0.90% |
1.20% |
1.60% |
2.20% |
2.50% |
2.70% |
2.60% |
2.80% |
*At manufacturer price levels.
†Compound annual growth rate.
Data source: IQVIA MIDAS™ Database, prescription retail and hospital markets, 2008 to 2017. All rights reserved.
The success of anti-VEGFs for retinal conditions in Canada has been matched and even exceeded in other industrialized markets. The 2.8% market share of anti-VEGFs in Canada places it seventh among the OECD members in 2017, well above the median of 0.7% (see Figure 2.2). Of the PMPRB7 countries, Canada ranked behind the UK (5.1%), Switzerland (4.3%), and France (3.2%), but ahead of Germany (2.5%), Italy (0.9%), the US (0.4%), and Sweden (0.2%).
Paralleling its uptake in Canada, Eylea also captured a significant market share from Lucentis in international markets. By 2017, Eylea was the dominant drug in 6 of the 10 countries with the highest combined shares of Lucentis and Eylea.
Figure 2.2 also provides the market share for Avastin across OECD countries. Although it is not approved for retinal indications by the US Food and Drug Administration or the European Medicines Agency, it has been approved in recent years for off-label retinal use in FranceFootnote 8 and ItalyFootnote 9. While the low market share of Lucentis and Eylea in some other countries may be due to the off-label use of Avastin, definitive conclusions cannot be drawn as the available data does not distinguish between its oncology use and its use for retinal conditions.
Although a higher comparative market share may point towards a higher rate of consumption, higher prices, or a combination of both factors, it is also affected by the relative sales of the rest of the pharmaceutical market.
Figure 2.2 Combined market shares of total pharmaceutical sales* for Lucentis and Eylea versus Avastin, OECD countries, 2017
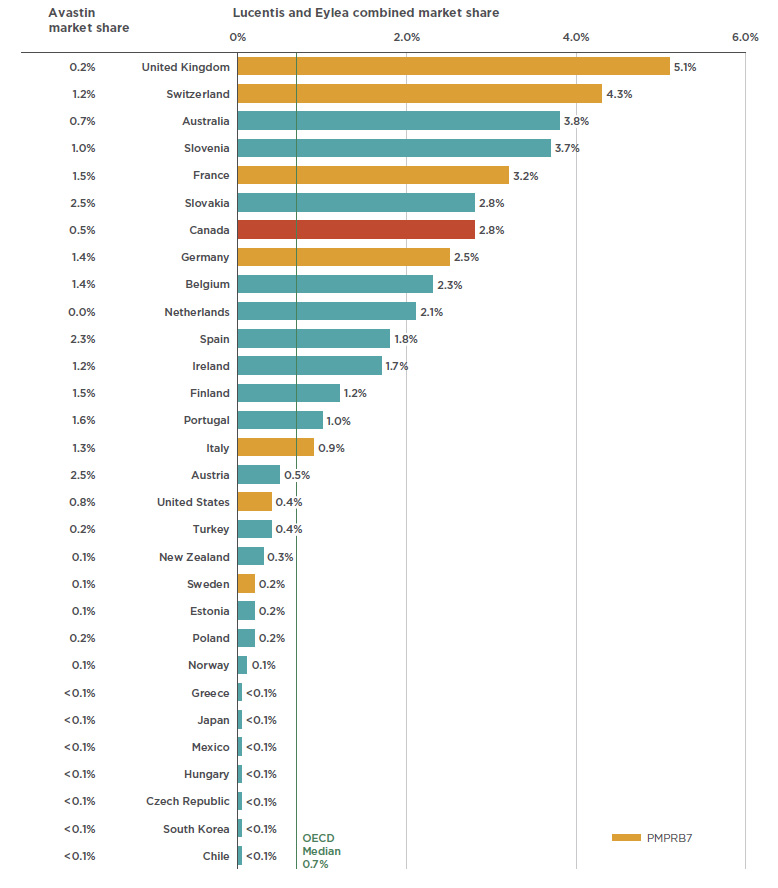
Figure description
This bar graph gives the combined market share for Lucentis and Eylea on the right and the Avastin market share on the left. Shares are given as a percentage of the market in each of the countries in the Organisation for Economic Co-operation and Development. The median share for Lucentis and Eylea among the Organisation for Economic Co-operation and Development is 0.7%.
blank
| Country |
Avastin market share |
Lucentis and Eylea combined market share |
| U.K. |
0.2% |
5.1% |
| Switzerland |
1.2% |
4.3% |
| Australia |
0.7% |
3.8% |
| Slovenia |
1.0% |
3.7% |
| France |
1.5% |
3.2% |
| Slovakia |
2.5% |
2.8% |
| Canada |
0.5% |
2.8% |
| Germany |
1.4% |
2.5% |
| Belgium |
1.4% |
2.3% |
| Netherlands |
0.0% |
2.1% |
| Spain |
2.3% |
1.8% |
| Ireland |
1.2% |
1.7% |
| Finland |
1.5% |
1.2% |
| Portugal |
1.6% |
1.0% |
| Italy |
1.3% |
0.9% |
| Austria |
2.5% |
0.5% |
| U.S. |
0.8% |
0.4% |
| Turkey |
0.2% |
0.4% |
| New Zealand |
0.1% |
0.3% |
| Sweden |
0.1% |
0.2% |
| Estonia |
0.1% |
0.2% |
| Poland |
0.2% |
0.2% |
| Norway |
0.1% |
0.1% |
| Greece |
<0.1% |
<0.1% |
| Japan |
<0.1% |
<0.1% |
| Mexico |
<0.1% |
<0.1% |
| Hungary |
<0.1% |
<0.1% |
| Czech Republic |
<0.1% |
<0.1% |
| South Korea |
<0.1% |
<0.1% |
| Chile |
<0.1% |
<0.1% |
*At manufacturer price levels.
Data source: IQVIA MIDAS™ Database, prescription retail and hospital markets, 2017. All rights reserved.
When the relative size of the population is considered, Canadian sales and use of Lucentis and Eylea rank near the top of the OECD, second only to Switzerland and well above the OECD median results. Figure 2.3 gives (a) the sales per capita converted to Canadian dollars, and (b) the foreign-to-Canadian per capita drug consumption in 2017. The latter measure was determined by converting the quantity of drugs sold in a country into annual maintenance treatment doses per patient reported on a per capita basis. The results are presented as an index, with the consumption rate in Canada set equal to one, and the rates in other countries determined relative to this measure. The annual maintenance treatment doses are based on the PMPRB HDAP reviews.
While the results suggest that Canada has one of the highest rates of use and sales of Lucentis and Eylea, this report makes no assessment as to whether these levels are too high or too low. The variation among countries may be influenced by many factors including differences in the prevalence of retinal conditions, in the demographic and disease profiles of the populations, and in the reimbursement policies of each country. Moreover, the results may also reflect the uptake of biologics as opposed to other treatment options, as well as the affordability of these drugs. Such considerations are outside the scope of this analysis.
Figure 2.3 Combined per capita sales and use of Lucentis and Eylea, OECD countries, 2017
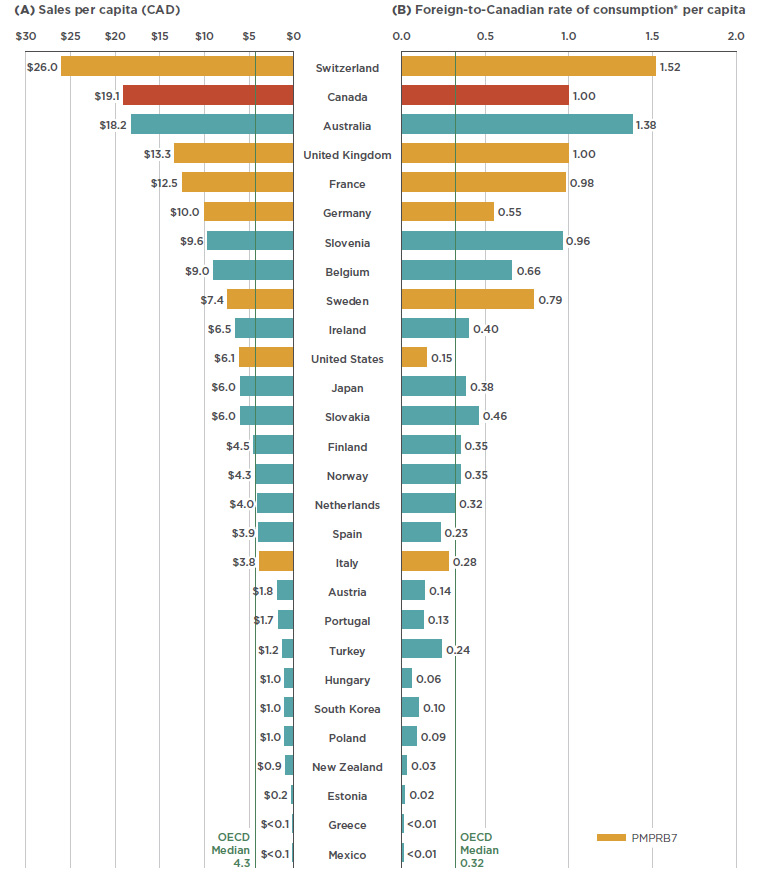
Figure description
This butterfly bar graph provides the per capita sales for Lucentis and Eylea in Canadian dollars and per capita foreign-to-Canadian rates of consumption for each country in the Organisation for Economic Co-operation and Development. Medians for the Organisation for Economic Co-operation and Development are also indicated.
blank
| Country |
Sales per capita (CAD) |
Foreign-to-Canadian rate of consumption* per capita |
| Switzerland |
26.0 |
1.52 |
| Canada |
19.1 |
1.00 |
| Australia |
18.2 |
1.38 |
| U.K. |
13.3 |
1.00 |
| France |
12.5 |
0.98 |
| Germany |
10.0 |
0.55 |
| Slovenia |
9.6 |
0.96 |
| Belgium |
9.0 |
0.66 |
| Sweden |
7.4 |
0.79 |
| Ireland |
6.5 |
0.40 |
| U.S. |
6.1 |
0.15 |
| Japan |
6.0 |
0.38 |
| Slovakia |
6.0 |
0.46 |
| Finland |
4.5 |
0.35 |
| Norway |
4.3 |
0.35 |
| Netherlands |
4.0 |
0.32 |
| Spain |
3.9 |
0.23 |
| Italy |
3.8 |
0.28 |
| Austria |
1.8 |
0.14 |
| Portugal |
1.7 |
0.13 |
| Turkey |
1.2 |
0.24 |
| Hungary |
1.0 |
0.06 |
| South Korea |
1.0 |
0.10 |
| Poland |
1.0 |
0.09 |
| New Zealand |
0.9 |
0.03 |
| Estonia |
0.2 |
0.02 |
| Greece |
<0.1 |
<0.01 |
| Mexico |
<0.1 |
<0.01 |
| Organisation for Economic Co-operation and Development median |
4.3 |
0.32 |
*Based on the PMPRB Human Drug Advisory Panel (HDAP) annual maintenance treatment dose per patient.
Data source: IQVIA MIDAS™ Database, prescription retail and hospital markets, 2017. All rights reserved.
3. Canadian Market Overview: Payer Markets
In Canada, anti-VEGFs for retinal conditions are predominantly reimbursed by public drug plans. Their relatively high treatment cost combined with a sizable patient population make this therapeutic area a major cost driver for these plans. At a fraction of the estimated treatment cost of the other two drugs, the off-label use of Avastin is reimbursed by several of the jurisdictions. Sales of anti-VEGFs for retinal conditions are concentrated, with Ontario and Quebec accounting for most of the use.
The market share of anti-VEGF drugs is significantly higher for public payers given the prevalence of AMD and other age-related retinal diseases among the senior population. As shown in Figure 3.1, Lucentis and Eylea together made up over 6% of the drug costs for public plans with reported dataFootnote 15 in 2017 (mainly due to a share of over 8% in Ontario), compared to less than 1% in private plans.
At a national level, public plans were the first payer of prescription costs for 82% of the retail sales of anti-VEGFs in 2017, while private payers accounted for 12%, and 6% was paid out-of-pocket. Public plans paid over 99% of the prescription costs for these drugs in 2017, which is higher than the average of 86% observed for all drugs reimbursed by the NPDUIS public plans in 2016/17Footnote 16.
Figure 3.1 Combined market shares by drug cost, Lucentis and Eylea, 2017
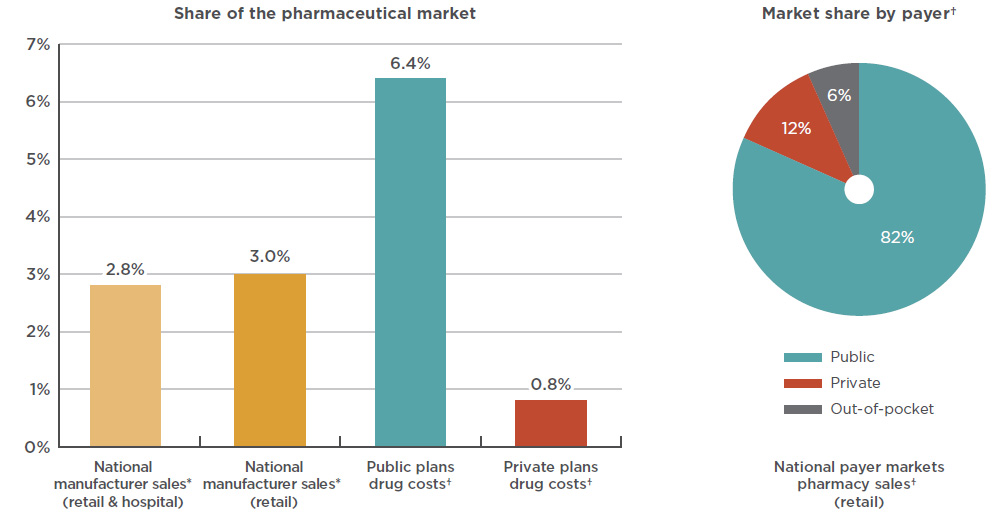
Figure description
This bar graph depicts the Lucentis and Eylea combined share of the Canadian pharmaceutical market in 2017, as a percentage of national sales as well as public and private plan drug costs. National manufacturer sales are determined as manufacturer price levels. Drug costs for the plans include markups but exclude dispensing costs.
blank
| Payer |
Share of Canadian market |
National
(retail and hospital) |
2.8% |
National
(retail only) |
3.0% |
| Public plans |
6.4% |
| Private plans |
0.8% |
An accompanying pie chart gives the market share by payer for retail pharmacy sales in the national payer markets. Drug costs include markups but exclude dispensing costs.
blank
|
Public |
Private |
Out-of-pocket |
| National market share |
82% |
12% |
6% |
* At manufacturer price levels.
† Drug costs include markups but exclude dispensing costs.
Data sources: National: IQVIA MIDAS™ Database, manufacturer price levels, prescription markets, 2017. All rights reserved.
Public plans: National Prescription Drug Utilization Information System Database, Canadian Institute for Health Information, 2017.
Plans included: Alberta, Saskatchewan, Ontario, New Brunswick, Prince Edward Island, Newfoundland and Labrador, Yukon, and the Non-Insured Health Benefits Program.
Private plans: IQVIA Private Pay Direct Drug Plan Database, 2017.
National payer markets: IQVIA Payer Insight Database, 2017.
While Lucentis and Eylea make up a noticeable share of the national drug market, sales are concentrated in just two provinces. As per Figure 3.2, Ontario dominated the market with 65% of national sales in 2017, followed by Quebec with 22%. By comparison, Ontario made up just 40% of sales for all drugs. This suggests that the utilization rate for anti-VEGFs for retinal conditions was relatively high in Ontario compared to other provinces. The market shares may also be under-reported for some provinces that reimburse anti-VEGFs for retinal conditions through special eye care programs (such as British Columbia, Alberta, Manitoba, and Nova Scotia), as well as provinces where the use of Avastin may be more pronounced.
Figure 3.2 Market shares by province, 2017
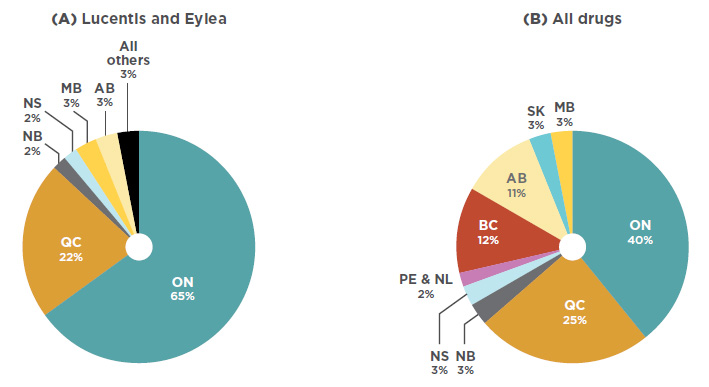
Figure description
This is a pie chart depicting the market share for Lucentis and Eylea in each province.
blank
|
Lucentis and Eylea |
| Alberta |
3% |
| Ontario |
65% |
| Quebec |
22% |
| New Brunswick |
2% |
| All others |
3% |
A second pie chart shows the provincial market shares for all drugs.
blank
| |
All drugs |
| British Columbia |
12% |
| Alberta |
11% |
| Saskatchewan |
3% |
| Manitoba |
3% |
| Ontario |
40% |
| Quebec |
25% |
| New Brunswick |
3% |
| Nova Scotia |
3% |
Prince Edward Island and
Newfoundland and Labrador |
2% |
Data source: IQVIA Canadian Drug Store and Hospital Purchases Audit (CDH), 2017.
In terms of brand-name drug costs in the public drug plans with available data, the anti-VEGF drugs for retinal conditions therapeutic class is second only to the tumor necrosis factor alpha (anti-TNFs) inhibitors class, which include many of the medicines that were analyzed in the first edition of the Market Intelligence Report series. The trend in cost growth for anti-VEGFs in public plans is similar to the national level, with a double-digit compound annual rate of growth (21.8%) over the past five years and a marked contribution (10.9%) to the growth in total brand-name drug costs in these plans since 2012. As reported in the PMPRB CompassRx report, these anti-VEGF drugs have been top drivers of recent year-over-year increases in public drug plan costsFootnote 15.
The importance in terms of cost for the anti-VEGF drugs for retinal conditions is due to a combination of a relatively high average treatment cost and a relatively large number of active beneficiaries utilizing the drugs. While not all top therapeutic areas are the same, as some have a smaller number of users at a higher treatment cost and others have a larger number of users with a lower treatment cost, both the anti-VEGFs and the anti-TNFs fall outside of the observed trends, having both sizable beneficiary populations and substantial average treatment costs. Figure 3.3 depicts the relationship between the number of beneficiaries and their average treatment cost for the top 10 therapeutic classes in terms of brand-name drug costs in public plans. Given the size of the population being treated with these drugs, the average treatment costs of both the anti-VEGFs and anti-TNFs are approximately double the amount that would fit the overall trend line. While these results do not reflect the discounts obtained through product listing agreements, rebates can also be expected in the other top therapeutic classes.
Figure 3.3 Top therapeutic classes* by drug cost, NPDUIS public drug plans, 2017
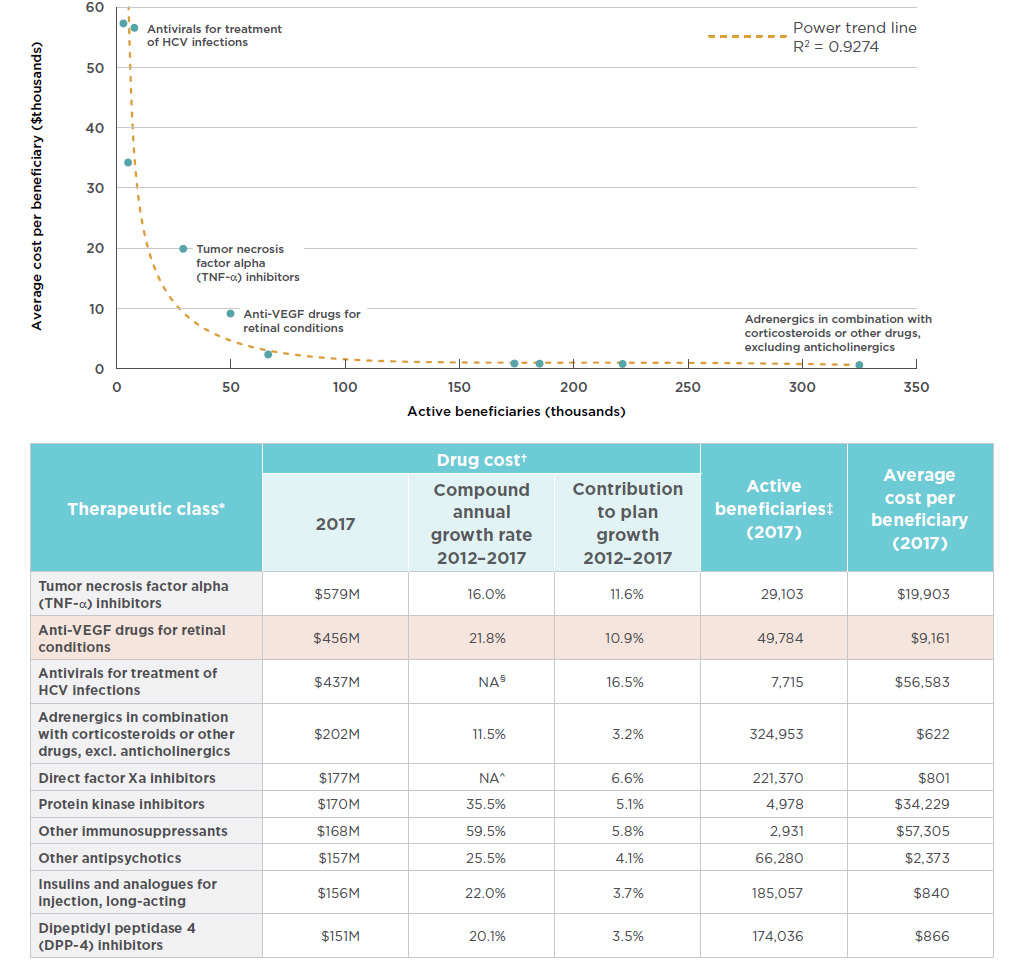
Figure description
This
area graph describes the top ten therapeutic classes in terms of brand-name drug costs in public plans. Each class is plotted by the number of active
beneficiaries and average cost per beneficiary, or treatment cost. A power trend line illustrates this relationship at R2= 0.9274.
blank
| Therapeutic class* |
Drug cost† |
Active beneficiaries‡ (2017) |
Average cost per beneficiary (2017) |
| 2017 (millions) |
Compound annual growth rate 2012 – 2017 |
Contribution to plan growth 2012 – 2017 |
| Tumor necrosis factor alpha (TNF-α) inhibitors |
$579 |
16.0% |
11.6% |
29,103 |
$19,903 |
| Anti-VEGF drugs for retinal conditions |
$456 |
21.8% |
10.9% |
49,784 |
$9,161 |
| Antivirals for treatment of HCV infections |
$437 |
NA§ |
16.5% |
7,715 |
$56,583 |
| Adrenergics in combination with corticosteroids or other drugs, excl. anticholinergics |
$202 |
11.5% |
3.2% |
324,953 |
$622 |
| Direct factor Xa inhibitors |
$177 |
NA^ |
6.6% |
221,370 |
$801 |
| Protein kinase inhibitors |
$170 |
35.5% |
5.1% |
4,978 |
$34,229 |
| Other immunosuppressants |
$168 |
59.5% |
5.8% |
2,931 |
$57,305 |
| Other antipsychotics |
$157 |
25.5% |
4.1% |
66,280 |
$2,373 |
| Insulins and analogues for injection, long-acting |
$156 |
22.0% |
3.7% |
185,057 |
$840 |
| Dipeptidyl peptidase 4 (DPP-4) inhibitors |
$151 |
20.1% |
3.5% |
174,036 |
$866 |
* World Health Organization Anatomical Therapeutic Chemical (WHO ATC) classification system at 4th level, capturing all drugs and related costs, irrespective of the indication. The anti-VEGF drugs for retinal conditions class (Lucentis and Eylea) is used as a proxy for the WHO ATC class Antineovascularisation
agents, which also includes verteporfin, which had minimal drug costs in Canada – less than $10,000 in 2017.
† Drug costs for brand products only. Includes markups and excludes dispensing costs.
‡ Unique count of beneficiaries within each therapeutic class. Beneficiaries with claims for multiple products within a class are counted only once.
§ Not applicable due to the emergence of the direct-acting antivirals starting with 2013.
^ Not applicable due to emergence of new direct factor Xa inhibitors starting with 2012.
Data source: NPDUIS Database, Canadian Institute for Health Information. Plans include: Alberta, Saskatchewan, Ontario, New Brunswick, Prince Edward Island, Newfoundland and Labrador, Yukon, and the NIHB.
The average cost per beneficiary for Lucentis was $8,524 in public plans and $8,507 in private plans in 2017, as shown in Figure 3.4. The costs for Eylea showed a slight disparity, with an average of $8,328 in public plans and $8,653 in private plans.
Also included in Figure 3.4 are estimated annual treatment costs based on the dosage regimen used in CADTH’s 2016 anti-VEGF therapeutic review, which includes Avastin dosing for wet AMD. With an estimated treatment cost of $400, Avastin costs a fraction of Lucentis or Eylea. Note that the results for public and private plans include data for all applicable retinal indications, while the results for the 12-month dosage regimen are based only on the wet AMD indication.
Figure 3.4 Average annual treatment cost per beneficiary, anti-VEGFs for retinal conditions, by public and private payers and CADTH dosage regimens, 2017
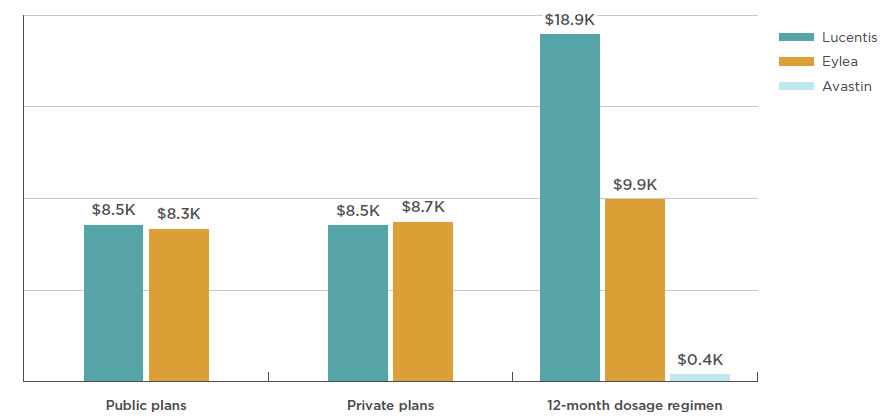
Figure description
This bar graph shows the average annual treatment cost for Lucentis, Eylea, and Avastin for public and private plans. Twelve-month dosage regimen costs from the Canadian Agency for Drugs and Technologies in Health (CADTH) are also given for each drug.
blank
|
Eylea |
Lucentis |
Avastin |
| Public plans |
$7,905 |
$8,082 |
|
| Private plans |
$8,653 |
$8,507 |
|
| 12-month dosage regimen |
$9,926 |
$18,900 |
$400 |
Note: Public and private data includes markups and excludes dispensing costs.
Data source: Public plans: National Prescription Drug Utilization Information System Database, Canadian Institute for Health Information, 2017. Plans included:
Alberta, Saskatchewan, Ontario, New Brunswick, Prince Edward Island, Newfoundland and Labrador, Yukon, and the Non-Insured Health Benefits Program.
Private plans: IQVIA Private Pay Direct Drug Plan Database, 2017.
12-month dosage regimen: Dosage regimen for wet AMD from CADTH anti-VEGF Therapeutic Review (2016): Eylea dosed every 2 months after
3 monthly injections; Lucentis and Avastin dosed monthly. Assumed 15 doses obtained per 100 mg vial of Avastin. List prices from December 2017
Association québécoise des pharmaciens propriétaires (AQPP).
4. International Price Comparison
Among the PMPRB comparator countries, Canadian price levels for anti-VEGFs for retinal conditions are second-highest to the US and substantially higher than the OECD median. These price discrepancies have large cost implications, especially for the public drug plans, which are the primary payers in Canada.
This section reports the average foreign-to-Canadian price ratios for anti-VEGFs for retinal conditions. For each ratio, the average price level in Canada is set to one and the corresponding foreign prices are determined to be either higher than (above) or lower than (below) this levelFootnote ii.
Canadian prices for Lucentis and Eylea are higher than those in all PMPBR7 comparator countries except the US. The PMPRB7 median price for Lucentis, set by Italy, was 37% lower than the Canadian price, while the OECD median was 39% lower. The price differential for Eylea was still substantial, though somewhat less than for Lucentis; the median PMPRB7 price for Eylea, set by the UK, was 15% lower than the Canadian price, while the OECD median was 26% lower. There was a slightly smaller gap between the Canadian price for Avastin and the median PMPRB7 and OECD prices, which were 14% and 20% lower, respectively. Figure 4.1 gives the bilateral foreign-to-Canadian price ratios for Lucentis, Eylea, and Avastin for the PMPRB7, as well as the OECD median.
Note that these results are based on manufacturer list prices and do not reflect managed entry agreements in Canada or the PMPRB7 countries. The use of these agreements is widespread internationally, and significant discounts off list prices are commonplace, according to a confidential survey of public health authorities in Canada, the US, Germany, England, and other developed countriesFootnote 16. The use of these agreements, referred to as product listing agreements in Canada, likely results in rebated prices for Lucentis, Eylea, and Avastin that are lower than the list prices analyzed in Figure 4.1. Thus, the price differentials and the cost implications presented here may be overestimated or underestimated depending on the actual rebated prices in Canada and foreign markets.
Figure 4.1 Foreign-to-Canadian price* ratios, anti-VEGFs for retinal conditions, Q4-2017
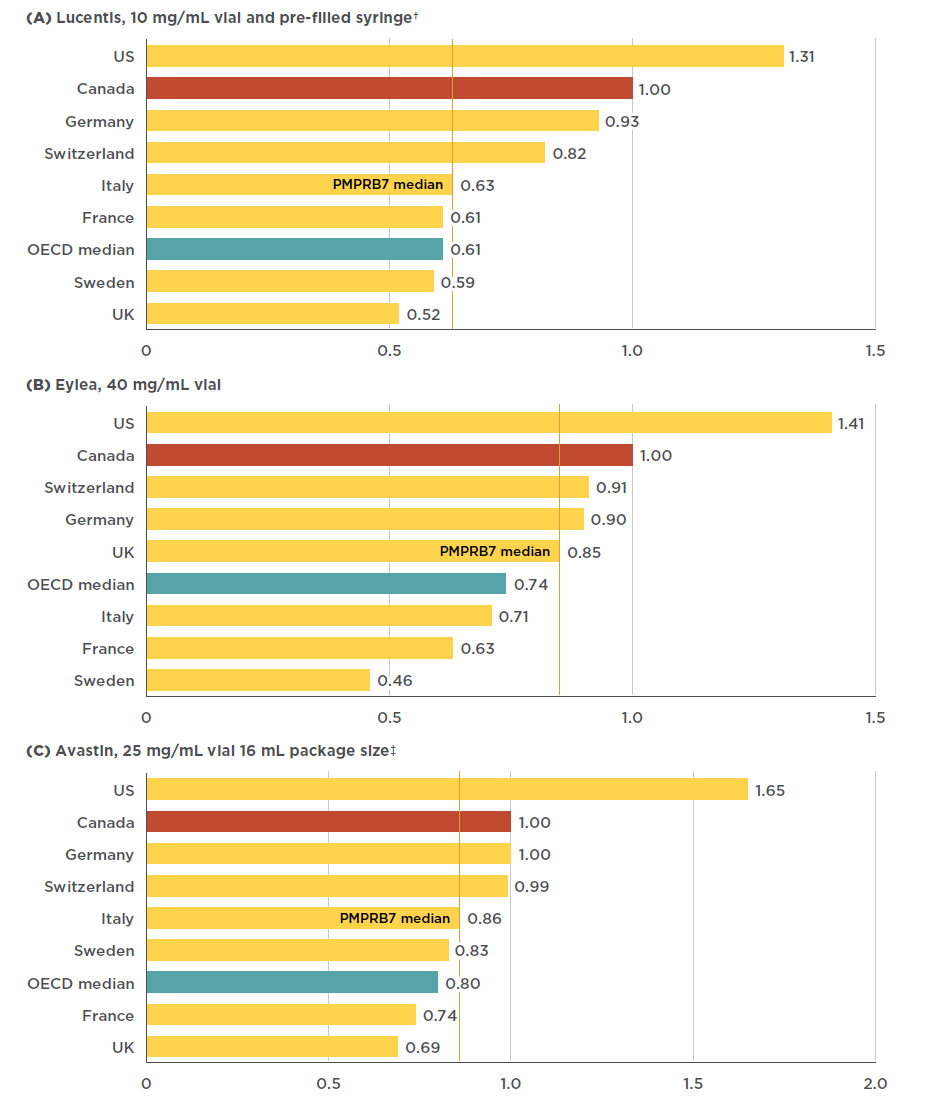
Figure description
This figure consists of three bar graphs, for Lucentis, Eylea, and Avastin, respectively, with foreign-to-Canadian price ratios for Canada and each of the PMPRB7 countries. A PMPRB7 median is given, as well as a median for all countries in the Organisation for Economic Co-operation and Development (OECD).
a) Lucentis 10mg/mL vial and pre-filled syringe†
| Country |
Lucentis price ratio |
| U.S. |
1.31 |
| Canada |
1.00 |
| Germany |
0.93 |
| Switzerland |
0.82 |
| PMPRB7 median |
0.63 |
| Italy |
0.63 |
| France |
0.61 |
| OECD median |
0.61 |
| Sweden |
0.59 |
| U.K. |
0.52 |
b) Eylea 40 mg/mL vial
| Country |
Eylea price ratio |
| U.S. |
1.41 |
| Canada |
1.00 |
| Switzerland |
0.91 |
| Germany |
0.90 |
| PMPRB7 median |
0.85 |
| U.K. |
0.85 |
| OECD median |
0.74 |
| Italy |
0.71 |
| France |
0.63 |
| Sweden |
0.46 |
c) Avastin 25 mg/mL, 16 mL package size‡
| Country |
Avastin price ratio |
| U.S. |
1.65 |
| Canada |
1.00 |
| Germany |
1.00 |
| Switzerland |
0.99 |
| Italy |
0.86 |
| PMPRB7 median |
0.86 |
| Sweden |
0.83 |
| OECD median |
0.80 |
| France |
0.74 |
| U.K. |
0.69 |
*At manufacturer price levels.
†The pre-filled syringe, launched in 2014, is the highest-selling form in Canada. Aggregated vial and syringe results are presented as there are similar prices for both forms.
‡Top-selling Avastin pack size.
Data source: IQVIA MIDAS™ Database, prescription retail and hospital markets, 2017. All rights reserved.
An analysis of international pricing trends since the Canadian launch of anti-VEGFs for retinal conditions shows that, at least for the first entrant in the class, there has not always been as pronounced a gap between Canadian and foreign list prices. Initially the Canadian price of Lucentis was relatively well aligned with the PMPRB7 comparator countries, but since 2007 a gap has developed, as the price in most other markets has declined while the Canadian price has slightly increased (1.5% from 2007 to 2017). France had the largest decrease in the list price of Lucentis (-43% including exchange rate fluctuations), resulting in a relative price change from 6% higher than Canadian levels in 2007 to 40% lower in 2017.
While Eylea has only been available since 2013, the trends are clear; since its launch in Canada, all PMPRB7 countries with the exception of the US have had lower relative prices. In Sweden in particular, the average price decreased substantially from 23% lower than in Canada in 2008 to 49% lower in 2017.
In the case of Avastin, foreign prices were generally up to 20% below Canadian levels in 2006, while by 2017, the range had widened to up to 30% below. Figure 4.2 gives the annual foreign-to-Canadian price ratios for Lucentis, Eylea, and Avastin from the year of launch in Canada to 2017.
Figure 4.2 Trends in annual foreign-to-Canadian price ratios, anti-VEGFs for retinal conditions, from year of introduction in Canada to 2017
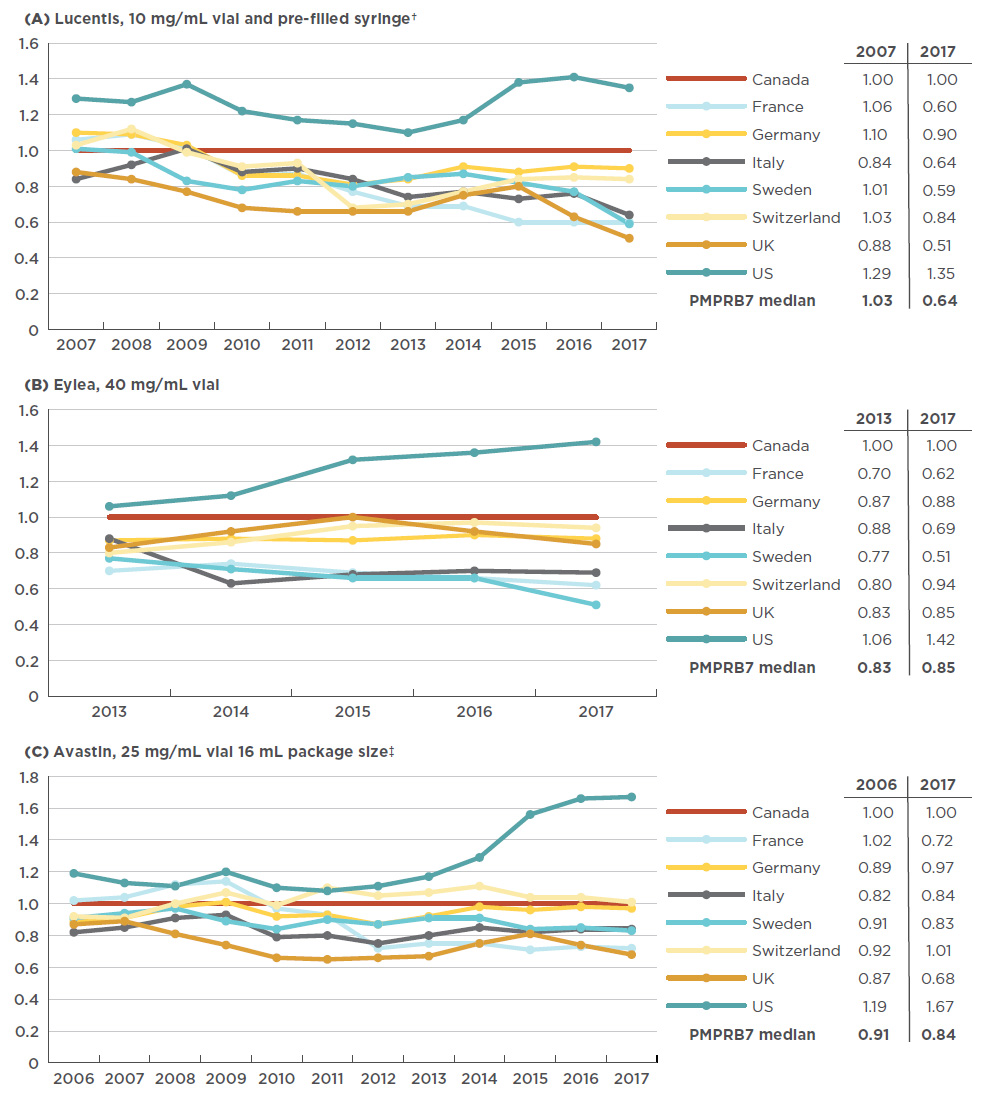
Figure description
These three line graphs depict the trend in annual foreign-to-Canadian price ratios for Lucentis, Eylea, and Avastin, respectively. Ratios are given for each year from year of introduction to 2017 for each of the PMPRB7 countries, with the Canadian price set as 1.00. A table accompanying each graph lists the PMPRB7 median ratios for the year of introduction and for 2017.
a) Lucentis 10 mg/mL vial and pre-filled syringe†
|
2007 |
2008 |
2009 |
2010 |
2011 |
2012 |
2013 |
2014 |
2015 |
2016 |
2017 |
| Canada |
1.00 |
1.00 |
1.00 |
1.00 |
1.00 |
1.00 |
1.00 |
1.00 |
1.00 |
1.00 |
1.00 |
| France |
1.06 |
1.09 |
1.02 |
0.86 |
0.87 |
0.77 |
0.69 |
0.69 |
0.60 |
0.60 |
0.60 |
| Germany |
1.10 |
1.09 |
1.03 |
0.86 |
0.86 |
0.81 |
0.84 |
0.91 |
0.88 |
0.91 |
0.90 |
| Italy |
0.84 |
0.92 |
1.01 |
0.88 |
0.90 |
0.84 |
0.74 |
0.77 |
0.73 |
0.76 |
0.64 |
| Sweden |
1.01 |
0.99 |
0.83 |
0.78 |
0.83 |
0.80 |
0.85 |
0.87 |
0.82 |
0.77 |
0.59 |
| Switzerland |
1.03 |
1.12 |
0.99 |
0.91 |
0.93 |
0.68 |
0.70 |
0.77 |
0.84 |
0.85 |
0.84 |
| UK |
0.88 |
0.84 |
0.77 |
0.68 |
0.66 |
0.66 |
0.66 |
0.75 |
0.80 |
0.63 |
0.51 |
| US |
1.29 |
1.27 |
1.37 |
1.22 |
1.17 |
1.15 |
1.10 |
1.17 |
1.38 |
1.41 |
1.35 |
| PMPRB7 median |
1.03 |
- |
- |
- |
- |
- |
- |
- |
- |
- |
0.64 |
b) Eylea 40 mg/mL vial
|
2013 |
2014 |
2015 |
2016 |
2017 |
| Canada |
1.00 |
1.00 |
1.00 |
1.00 |
1.00 |
| France |
0.70 |
0.74 |
0.69 |
0.66 |
0.62 |
| Germany |
0.87 |
0.88 |
0.87 |
0.90 |
0.88 |
| Italy |
0.88 |
0.63 |
0.68 |
0.70 |
0.69 |
| Sweden |
0.77 |
0.71 |
0.66 |
0.66 |
0.51 |
| Switzerland |
0.80 |
0.86 |
0.95 |
0.97 |
0.94 |
| UK |
0.83 |
0.92 |
1.00 |
0.92 |
0.85 |
| US |
1.06 |
1.12 |
1.32 |
1.36 |
1.42 |
| PMPRB7 median |
0.83 |
- |
- |
- |
0.85 |
c) Avastin 25 mg/mL vial, 16 mL package size‡
|
2006 |
2007 |
2008 |
2009 |
2010 |
2011 |
2012 |
2013 |
2014 |
2015 |
2016 |
2017 |
| Canada |
1.00 |
1.00 |
1.00 |
1.00 |
1.00 |
1.00 |
1.00 |
1.00 |
1.00 |
1.00 |
1.00 |
1.00 |
| France |
1.02 |
1.04 |
1.12 |
1.14 |
0.97 |
0.93 |
0.72 |
0.75 |
0.75 |
0.71 |
0.73 |
0.72 |
| Germany |
0.89 |
0.91 |
0.98 |
1.01 |
0.92 |
0.93 |
0.87 |
0.92 |
0.98 |
0.96 |
0.98 |
0.97 |
| Italy |
0.82 |
0.85 |
0.91 |
0.93 |
0.79 |
0.80 |
0.75 |
0.80 |
0.85 |
0.82 |
0.84 |
0.84 |
| Sweden |
0.91 |
0.94 |
0.97 |
0.89 |
0.84 |
0.90 |
0.87 |
0.91 |
0.91 |
0.84 |
0.85 |
0.83 |
| Switzerland |
0.92 |
0.91 |
1.00 |
1.07 |
0.99 |
1.10 |
1.05 |
1.07 |
1.11 |
1.04 |
1.04 |
1.01 |
| UK |
0.87 |
0.89 |
0.81 |
0.74 |
0.66 |
0.65 |
0.66 |
0.67 |
0.75 |
0.81 |
0.74 |
0.68 |
| US |
1.19 |
1.13 |
1.11 |
1.20 |
1.10 |
1.08 |
1.11 |
1.17 |
1.29 |
1.56 |
1.66 |
1.67 |
| PMPRB7 median |
0.91 |
- |
- |
- |
- |
- |
- |
- |
- |
-- |
|
0.84 |
*At manufacturer price levels.
†Pre-filled syringe, launched in 2014, is highest-selling form in Canada. Aggregated vial and syringe results are presented for Lucentis due to generally flat pricing between forms and data availability back to 2008.
‡Top-selling Avastin pack size.
Data source: IQVIA MIDAS™ Database, prescription retail and hospital markets, 2006-2017. All rights reserved.
Considering the relatively high domestic use of Lucentis and Eylea, the higher list prices paid in Canada compared to most of the PMPRB7 countries may bear significant cost implications for Canadian payers. Table 4.1 presents these implications at both the national level and for the public drug plans with available dataFootnote iii. Implications are estimated based on manufacturer list prices using the median PMPRB7-to-Canadian price ratio in the fourth quarter of 2017 and may be overestimated or underestimated depending on the extent to which confidential prices and rebates in Canada compare to foreign markets.
In 2017, total Canadian sales for Lucentis amounted to $302.3 million. The 37% differential between the Canadian price and median PMPRB7 list price translates into $110.4 million in drug sales, or 0.45% of the entire Canadian pharmaceutical market for the year. For public drug plans with available data, the implications at reimbursed prices are $75.0 million, or 1.04% of the total drug costs for these plans.
In the case of Eylea, the gap between the Canadian and the median PMPRB7 price has smaller cost implications. Given the $389.4 million in Canadian sales for Eylea in 2017, the 15% foreign-to-Canadian price difference translates to $57.9 million, or 0.24% of the entire Canadian pharmaceutical market. For public drug plans with available data, the differential works out to $37.3 million in public drug costs, or 0.52% of total drug costs for these plans.
Combined, the cost implications of paying higher list prices for Lucentis and Eylea in Canada compared to the PMPBR7 median are substantial, totaling $168M in 2017, or 0.69% of the total Canadian market.
Table 4.1 Estimated cost implications to Canadian payers of lower median PMPRB7 Q4-2017 prices for
Lucentis and Eylea
| |
|
Total Canadian
market, 2017*
(all payers) |
Public plan cost implications†, 2017 |
| AB |
SK |
ON |
NB |
PE |
NL |
YT |
NIHB |
Total public |
| Lucentis |
Drug cost |
$302.3M |
$11.1M |
$2.2M |
$183.0M |
$4.3M |
$0.1M |
$2.1M |
<$0.1M |
$2.5M |
$205.4M |
Estimated cost implication at median PMPRB7 price level
(share of total drug cost) |
$110.4M
(0.45%) |
$4.1M
(0.53%) |
$0.8M
(0.21%) |
$66.8M
(1.30%) |
$1.6M
(0.76%) |
$0.1M
(0.16%) |
$0.8M
(0.65%) |
<$0.1M
(0.07%) |
$0.9M
(0.19%) |
$75.0M
(1.04%) |
| Eylea |
Drug cost |
$389.4M |
$0.7M |
$3.5M |
$240.6M |
$3.8M |
$0.6M |
$0.4M |
<$0.1M |
$1.1M |
$250.7M |
Estimated cost implication at median PMPRB7 price level
(share of total drug cost) |
$57.9M
(0.24%) |
$0.1M
(0.01%) |
$0.5M
(0.14%) |
$35.8M
(0.69%) |
$0.6M
(0.28%) |
$0.1M
(0.24%) |
$0.1M
(0.05%) |
<$0.1M
(0.04%) |
$0.2M
(0.03%) |
$37.3M
(0.52%) |
| Total implications for Lucentis and Eylea |
$168.3M (0.69% of Cdn mkt) |
$112.3M
(1.56% of public plans) |
Note: National and public plan costs are based on the 2017 calendar year, and the median foreign-to-Canadian price ratios are based on the fourth quarter of the 2017 calendar year.
*At manufacturer price levels. Discounts from managed entry agreements are not included.
†Includes markups and excludes dispensing costs. Discounts from managed entry agreements are not included.
Only public plans with available data were included in the analysis. BC: Lucentis – no data was available, Eylea – was not listed; MB: Lucentis – no data was available, Eylea – was not listed; NS: Lucentis – no data was available, Eylea – was not listed.
Data sources:
National: IQVIA MIDAS™ Database, prescription markets, 2017. All rights reserved.
Public plans: National Prescription Drug Utilization Information System Database, Canadian Institute for Health Information, 2017. Plans included: Alberta, Saskatchewan, Ontario, New Brunswick, Prince Edward Island, Newfoundland and Labrador, Yukon, and the NIHB.