The cost of new oral anti-diabetic drugs in Canada and internationally
PDF - 2.29 MB
Diabetes is one of the leading causes of death in CanadaFootnote 1 and other developed countriesFootnote 2. The growing incidence, prevalence and progressive nature of the diseaseFootnote 3 have encouraged the development of new drugs to provide additional treatment options for diabetic patients. Non-insulin treatments, used as first line therapies for patients suffering from type 2 diabetes, currently capture more than half the sales in the anti-diabetic market. Over the past decade, two important classes have entered this market: dipeptidyl peptidase-4 inhibitors (DPP-4), and sodium-glucose cotransporter-2 inhibitors (SGLT-2). This analysis provides insight into the sales, uptake and prices of these classes of drugs in Canada and internationally.
These findings will form the basis of a more comprehensive study on DPP-4 and SGLT-2 drugs to be published as part of the PMPRB Market Intelligence Report series. This series provides detailed information on specific therapeutic market segments of importance to Canadians to inform policy discussions and aid in evidence-based decision making.
All DPP-4 and SGLT-2 drugs currently on the market in Canada and PMPRB comparator countries were considered for this analysis. International comparisons focus on the seven countries the PMPRB considers when reviewing the prices of patented drugs (PMPRB7): France, Germany, Italy, Sweden, Switzerland, the United Kingdom, and the United States, as well as other countries in the Organisation for Economic Co-operation and Development (OECD).
1. DPP-4 and SGLT-2 drugs are a $800 million market in Canada, dominating the sales of non-insulins
The anti-diabetic non-insulin drug market has rapidly evolved and grown over the past decade. In Canada, the rate of growth in sales underwent a remarkable increase from 1% in 2009 to over 20% in 2015 and 2016, slowing only slightly to 16% in 2017.
This growth has primarily been driven by the DPP-4 and SGLT-2 classes. Together they captured almost three quarters of the total non-insulin market sales in 2017 (54% for DPP-4s and 18% for SGLT-2s). This strong growth resulted in a 3.2% overall share of the total pharmaceutical market in Canada, higher than the average for the PBPRB7 (2.2%) and OECD (2.7%) countries. In Canada, Janumet and Januvia are top sellers within the DPP-4 class. Together they comprise 73% of market share. The top-selling SGLT-2 drug is Invokana, with a 44% share of this class.
Non-insulin drug sales in Canada by drug class, 2008 to 2017
Click on image for larger view
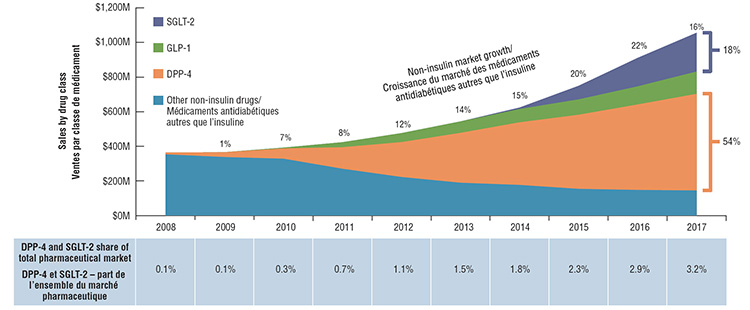
Figure description
This graph depicts the growth in sales of SGLT-2s, GLP1s, DPP-4s, and other non-insulin drugs in Canada from 2008 to 2017. The rate of growth in sales for all drugs increased from 1% in 2009 to over 20% in 2015 and 2016, slowing only slightly to 16% in 2017.
The growth has primarily been driven by the DPP-4 and SGLT-2 classes. Together they captured almost three quarters of the total non-insulin market sales in 2017 (54% for DPP-4s and 18% for SGLT-2s).
2. Per capita sales for DPP-4 and SGLT-2 drugs in Canada is second only to the US
Per capita sales for the combined DPP-4 and SGLT-2 markets in Canada is second highest among the OECD countries, primarily due to the high sales of DPP-4s. In Switzerland and Germany, per capita sales are only half of that observed in Canada, while the remaining PMPRB7 countries spend even less for these two drug classes. Higher per capita sales levels are indicative of higher utilization, higher prices or a combination of both factors. The impact of these factors on the Canadian and international markets for DPP-4s and SGLT-2s is explored in the related findings presented in this poster.
DPP-4 and SGLT-2 sales per capita, OECD countries, 2017
Click on image for larger view
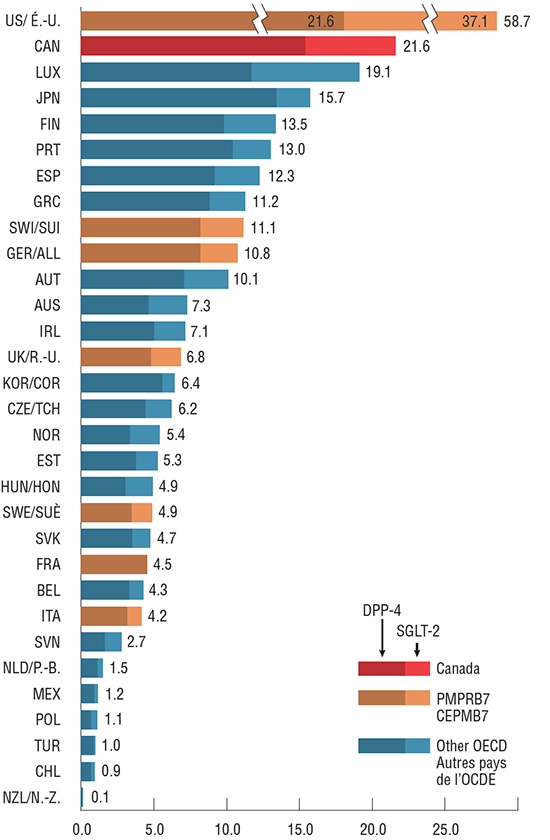
Figure description
This bar graph depicts the per capita sales in Canadian dollars for the DPP-4 and SGLT-2 markets in 2017. Each bar gives the DPP-4 and SGLT-2 per capita sales for each of the countries in the Organisation for Economic Co-operation and Development, along with the combined sales of both groups of drugs.
blank
|
SGLT-2 sales per capita in Canadian dollars |
DPP-4 sales per capita in Canadian dollars |
SGLT-2 & DPP-4 combined sales per capita in Canadian dollars |
| Australia |
2.7 |
4.6 |
7.3 |
| Austria |
3.1 |
7.0 |
10.1 |
| Belgium |
1.0 |
3.3 |
4.3 |
| Canada |
6.2 |
15.4 |
21.6 |
| Chile |
0.3 |
0.7 |
0.9 |
| Czech Republic |
1.8 |
4.4 |
6.2 |
| Estonia |
1.5 |
3.7 |
5.3 |
| Finland |
3.5 |
9.8 |
13.3 |
| France |
|
4.5 |
4.5 |
| Germany |
2.6 |
8.2 |
10.8 |
| Greece |
2.4 |
8.8 |
11.2 |
| Hungary |
1.9 |
3.0 |
4.9 |
| Ireland |
2.1 |
5.0 |
7.1 |
| Italy |
1.0 |
3.1 |
4.2 |
| Japan |
2.3 |
13.4 |
15.7 |
| Korea |
0.9 |
5.6 |
6.4 |
| Luxembourg |
7.4 |
11.7 |
19.1 |
| Mexico |
0.3 |
0.9 |
1.2 |
| Netherlands |
0.4 |
1.1 |
1.5 |
| New Zealand |
0.1 |
0.1 |
0.1 |
| Norway |
2.1 |
3.3 |
5.4 |
| Poland |
0.4 |
0.7 |
1.1 |
| Portugal |
2.6 |
10.4 |
13.0 |
| Slovakia |
1.3 |
3.5 |
4.7 |
| Slovenia |
1.1 |
1.6 |
2.7 |
| Spain |
3.1 |
9.1 |
12.3 |
| Sweden |
1.4 |
3.5 |
4.9 |
| Switzerland |
2.9 |
8.2 |
11.1 |
| Turkey |
0.2 |
0.8 |
1.0 |
| United States |
21.6 |
37.1 |
58.7 |
| United Kingdom |
2.0 |
4.8 |
6.8 |
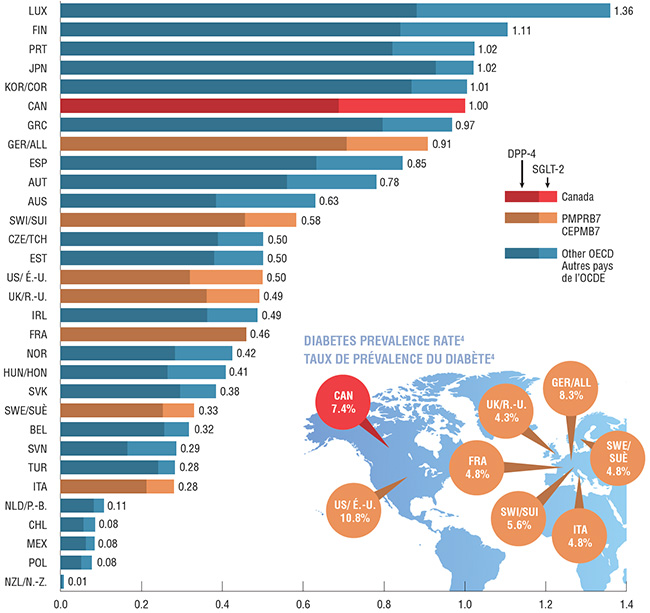
3. Canada consumes more DPP-4 and SGLT-2 drugs per capita than its PMPRB7 comparators
Canada has the sixth highest consumption rate of DPP-4 and SGLT-2 drugs in the OECD. Moreover, it ranks the highest among the PMPRB7 countries, followed by Germany whose consumption is 10% lower. The consumption rate for most other PMPRB7 countries, including the US, is only half or less of the Canadian rate.
Consumption rates are determined by converting the physical quantity of drugs sold in any given market into annual treatment doses per patient. The findings are presented as an index, where the consumption rate in Canada is set to 1 and the rate in other countries is reported relative to this value.
The comparative prevalence rateFootnote 4 for type 1 and type 2 diabetes in Canada is relatively high (7.4%), ranking 9th among the OECD and 3rd in the PMPRB7 countries. Although disease prevalence can have an influence on the consumption rate, other factors such as the choice of drug treatment, prescribing practices and patient adherence may play an important role. These factors were not analyzed in this study.
DPP-4 and SGLT-2 consumption per capita based on DDD* indexed to Canada, OECD countries, 2017
Click on image for larger view
*Defined Daily Dose (DDD) based on the World Health Organization’s DDD assignment.
Figure description
This bar graph depicts the DPP-4 and SGLT-2 consumption per capita by defined daily doses in Canada and the Organisation for Economic Co-operation and Development countries. The findings are presented as an index, where the consumption rate in Canada is set to 1 and the rate in other countries is reported relative to this value. Each bar gives the DPP-4 and SGLT-2 consumption per capita, along with the combined sales of both groups of drugs.
The world map shown next to the bar graph portrays the comparative prevalence rate of type 1 and type 2 diabetes in Canada and in the seven PMPRB comparator countries.
Consumption:
| Country |
DPP-4 consumption per capita |
SGLT-2 consumption per capita |
Combined DPP-4 and SGLT-2 consumption per capita |
| Luxembourg |
0.9 |
0.5 |
1.4 |
| Finland |
0.8 |
0.3 |
1.1 |
| Portugal |
0.8 |
0.2 |
1.0 |
| Japan |
0.9 |
0.1 |
1.0 |
| Korea |
0.9 |
0.1 |
1.0 |
| Canada |
0.7 |
0.3 |
1.0 |
| Greece |
0.8 |
0.2 |
1.0 |
| Germany |
0.7 |
0.2 |
0.9 |
| Spain |
0.6 |
0.2 |
0.8 |
| Austria |
0.6 |
0.2 |
0.8 |
| Australia |
0.4 |
0.2 |
0.6 |
| Switzerland |
0.5 |
0.1 |
0.6 |
| Czech Republic |
0.4 |
0.1 |
0.5 |
| Estonia |
0.4 |
0.1 |
0.5 |
| United States |
0.3 |
0.2 |
0.5 |
| United Kingdom |
0.4 |
0.1 |
0.5 |
| Ireland |
0.4 |
0.1 |
0.5 |
| France |
0.5 |
0.0 |
0.5 |
| Norway |
0.3 |
0.2 |
0.4 |
| Hungary |
0.3 |
0.1 |
0.4 |
| Slovakia |
0.3 |
0.1 |
0.4 |
| Sweden |
0.3 |
0.1 |
0.3 |
| Belgium |
0.3 |
0.1 |
0.3 |
| Slovenia |
0.2 |
0.1 |
0.3 |
| Turkey |
0.2 |
0.0 |
0.3 |
| Italy |
0.2 |
0.1 |
0.3 |
| Netherlands |
0.1 |
0.0 |
0.1 |
| Chile |
0.1 |
0.0 |
0.1 |
| Mexico |
0.1 |
0.0 |
0.1 |
| Poland |
0.1 |
0.0 |
0.1 |
| New Zealand |
0.0 |
0.0 |
0.0 |
Prevalence rate for diabetes
| Country |
Prevalence |
| United States |
10.8% |
| Germany |
8.3% |
| Canada |
7.4% |
| Switzerland |
5.6% |
| Sweden |
4.8% |
| Italy |
4.8% |
| France |
4.8% |
| United Kingdom |
4.3% |
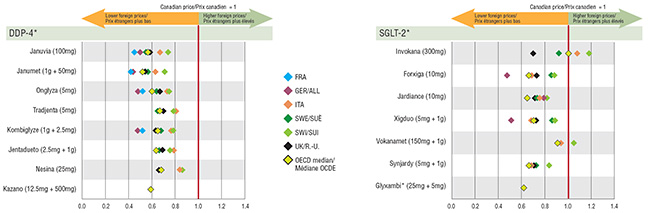
4. Most DPP-4 and SGLT-2 drug prices are higher in Canada than in other countries
The prices for all DPP-4 drugs analyzed were significantly lower internationally, with median OECD levels ranging from 32% to 46% less than prices in Canada. Of the PMPRB7 countries, Germany and France had the lowest prices, with the top-selling drugs, Januvia and Janumet, at approximately 50% of Canadian levels or less. The international prices for the SGLT-2s showed slightly more variation in the price differentials, although the majority were higher in Canada. Germany again had some of the lowest levels, with two drugs, Forxiga and Xigduo, at approximately half of the Canadian price, similar to the DPP-4 ratios.
The only exception to this was the US, whose prices were very high: approximately 5x greater than Canadian prices for DPP-4s and 6x greater for SGLT-2s.
Foreign-to-Canadian price ratios for DPP-4 and SGLT-2 drugs, Q4-2017
Click on image for larger view
*Highest-selling strengths.
Note: US values are exceptionally high and were not included due to the scale of the graph.
Figure description
4. This graph consists of two charts that depict the foreign-to-Canadian price ratios for select DPP-4 and SGLT-2 drugs in the PMPRB7 countries along with the Organisation for Economic Co-operation and Development median drug price ratio. The United States whose values were exceptionally high were not included due to the scale of the chart.
DPP-4 Drugs
| |
France |
Germany |
Italy |
Sweden |
Switzerland |
United Kingdom |
United States |
OECD Median |
| Januvia |
0.45 |
0.50 |
0.67 |
0.55 |
0.74 |
0.58 |
4.94 |
0.57 |
| Janumet |
0.42 |
0.44 |
0.63 |
0.55 |
0.71 |
0.55 |
4.46 |
0.54 |
| Onglyza |
0.52 |
0.48 |
0.73 |
0.64 |
0.75 |
0.64 |
5.72 |
0.62 |
| Tradjenta |
- |
- |
0.80 |
0.65 |
0.79 |
0.70 |
5.57 |
0.67 |
| Kombiglyze |
0.52 |
0.48 |
0.77 |
0.68 |
0.78 |
0.64 |
5.83 |
0.65 |
| Jentadueto |
- |
- |
0.77 |
0.67 |
0.76 |
0.67 |
5.59 |
0.66 |
| Nesina |
- |
- |
0.85 |
- |
0.85 |
0.66 |
6.80 |
0.68 |
| Kazano |
- |
- |
- |
- |
- |
- |
6.41 |
0.59 |
SGLT-2 Drugs
| |
France |
Germany |
Italy |
Sweden |
Switzerland |
United Kingdom |
United States |
OECD Median |
| Invokana |
- |
- |
1.08 |
0.92 |
1.18 |
0.70 |
6.02 |
1.01 |
| Forxiga |
- |
0.48 |
0.69 |
0.86 |
0.88 |
0.73 |
6.36 |
0.67 |
| Jardiance |
- |
0.79 |
0.75 |
0.73 |
0.82 |
0.72 |
6.07 |
0.65 |
| Xigduo |
- |
0.51 |
0.68 |
0.86 |
0.88 |
0.72 |
6.27 |
0.68 |
| Vokanamet |
- |
- |
0.94 |
- |
1.05 |
- |
5.33 |
0.91 |
| Synjardy |
- |
- |
0.69 |
0.71 |
0.84 |
0.70 |
5.99 |
0.68 |
| Glyxambi |
- |
- |
- |
- |
- |
- |
4.34 |
0.62 |
5. Higher prices for DPP-4 and SGLT-2 drugs in Canada have important cost implications for payers
The price differentials between Canadian and foreign markets translate into substantial cost implications for Canada. If Canadian prices for DPP-4s and SGLT-2s were aligned with PMPRB7 median price levels for the fourth quarter (Q4) of 2017, the national Canadian sales for DPP-4s would have been up to $219.8M (39%) lower in 2017, while sales for SGLT-2s would have been $26.9M (12%) less. Similarly, the cost implications for public plans would have been $96.7M for DPP-4s and $2.9M for SGLT-2s for the 2016/17 fiscal year. The amounts vary widely across the public drug plans given the differences in plan sizes. However, in relative terms, the implications are substantial, up to 1.8% of the total drug cost, as calculated for Ontario public drug plan.
Cost implications of higher Canadian prices for select DPP-4s and SGLT-2s using the Q4-2017 PMPRB7 median price
| |
National market (all payers), 2017 |
Canadian public drug plans, 2016/2017 |
| BC |
AB |
SK |
MB |
ON |
NB |
NS |
PE |
NL |
YK |
NIHB |
Total
|
| DPP-4 |
Total drug cost |
$558.1M |
$9.3M |
$12.9M |
$4.3M |
$2.0M |
$204.6M |
$3.2M |
$1.1M |
<$0.1M |
$0.2M |
<$0.1M |
$11.4M |
$249.0M |
| Cost implications |
$219.8M |
$2.4M |
$4.9M |
$1.6M |
$0.7M |
$80.7M |
$1.2M |
$0.4M |
<$0.1M |
$0.1M |
<$0.1M |
$4.6M |
$96.7M |
| SGLT-2 |
Total drug cost |
$224.4M |
– |
$2.5M |
$0.9M |
$0.5M |
$40.5M |
$0.4M |
<$0.1M |
<$0.1M |
<$0.1M |
– |
$2.8M |
$47.7M |
| Cost implications |
$26.9M |
– |
$0.2M |
<$0.1M |
<$0.1M |
$2.5M |
<$0.1M |
<$0.1M |
– |
<$0.1M |
– |
$0.1M |
$2.9M |
| Total estimated cost implications |
$246.7M |
$2.4M |
$5.1M |
$1.7M |
$0.8M |
$83.2M |
$1.3M |
$0.4M |
<$0.1M |
$0.1M |
<$0.1M |
$4.7M |
$99.6M |
| Share of total market |
1.01% |
0.22% |
0.70% |
0.50% |
0.23% |
1.81% |
0.67% |
0.26% |
0.03% |
0.05% |
0.03% |
1.04% |
1.24% |
Limitations: Canadian and international sales and list prices available in the IQVIA MIDAS™ database are estimated manufacturer factory-gate list prices and do not reflect off-invoice price rebates and allowances, managed entry agreements, or patient access schemes.
Sources: Availability, uptake and pricing information in this analysis were determined based on the IQVIA MIDAS™ database (all rights reserved); public drug plans costs were obtained from NPDUIS, Canadian Institute for Health Information.
Disclaimer: Although based in part on data provided under license by the QuintilesIMS MIDAS™ Database, the statements, findings, conclusions, views and opinions expressed in this report are exclusively those of the PMPRB and are not attributable to QuintilesIMS.
NPDUIS is a research initiative that operates independently of the regulatory activities of the PMPRB.