A Review of Public and Private Coverage of iJODR/pCODR Reviewed Drugs
PDF - 308 kb
The issue of a national pharmacare program has been debated in Canada for decades, and recently discussions about major reforms have resurfaced, with a wide range of opinions proposed by various stakeholders. To inform the dialogue related to the potential composition of a Canadian national formulary, the PMPRB has conducted an analysis into the current drug coverage, commonalities and differences across public drug plans in Canada.
The analysis focuses on a selection of 64 relatively new cancer drugs (active substances) evaluated by the interim Joint Oncology Drug Review (iJODR) and the pan-Canadian Oncology Drug Review (pCODR) through the national health technology assessment process from 2007 to June 2015.
In Canada, there are several public funding options for cancer drugs through hospital drug budgets, the provincial drug plans and/or the provincial cancer agencies. The analysis reports on the number and percentage of these drugs that are listed in province-specific public plans or programs for each of the pCODR participating provinces, as well as the public programs in Quebec and Canadian private drug plans, as of December 31, 2015. Weighted listing rates, based on Canadian national retail and hospital sales in 2015, were used to determine the relative importance of the drugs listed.
Key Findings
1. Listing rates of cancer drugs in public formularies are relatively high, with some provincial variations
On average, Canadian public drug programs listed 73% of the 64 selected cancer drugs, accounting for 92% of the retail and hospital sales for the iJODR and pCODR reviewed drugs in Canada in 2015. Of the selected drugs, 59 (or 92%) were listed in at least one program, accounting for 99% of the Canadian sales.
Saskatchewan had the highest percentage of formulary listings at 86%, accounting for 98% of the select cancer drug sales. Ontario, British Columbia and Alberta had a slightly lower rate of 81%. The cancer drugs listed in these provinces represented the large majority of national sales. The private drug plan aggregate data suggests that 75% of the select cancer drugs were available in one or more plans in Canada.
Listing rates for iJODR and pCODR reviewed drugs in public formularies and availability in private drug plans, 2015
Click on image for larger view
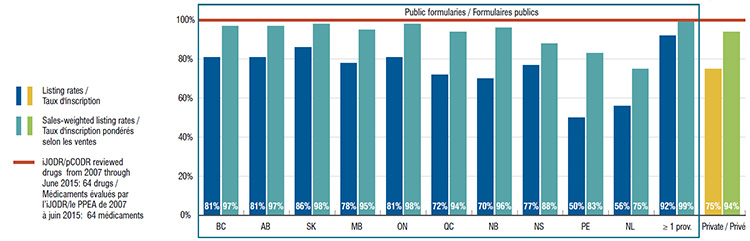
Figure description
This bar graph depicts the percentage of the 64 selected drugs that were listed in the formulary of (1) the public drug programs for each province; (2) the programs for at least one province; and (3) in Canadian private plans at the end of December 2015. The listing rates and sales-weighted rates are given for each plan or group of plans.
blank
|
Listing rates |
Sales-weighted listing rates |
| British Columbia |
81% |
97% |
| Alberta |
81% |
97% |
| Saskatchewan |
86% |
98% |
| Manitoba |
78% |
95% |
| Ontario |
81% |
98% |
| Quebec |
72% |
94% |
| New Brunswick |
70% |
96% |
| Nova Scotia |
77% |
88% |
| Prince Edward Island |
50% |
83% |
| Newfoundland and Labrador |
56% |
75% |
| At least one province |
92% |
99% |
| Private plans |
75% |
94% |
2. The top-selling cancer drugs are available in the majority of Canadian public drug programs
The majority (73%) of the select cancer drugs were listed in 6 or more of the 10 provinces, representing 95% of the total national sales in 2015.
Of the select drugs, 19 (30%) were available in all public programs during the study period. These drugs accounted for 55% of the total national sales for cancer drugs. A small proportion of the drugs (8%) were not approved for coverage under any of the public formularies. These drugs accounted for a small share (1.5%) of the total national sales, and for half of them, the pan-Canadian Pharmaceutical Alliance (pCPA) process resulted in a decision not to negotiate.
Cancer drugs listed in public formularies, by magnitude of listing, 2015
Click on image for larger view
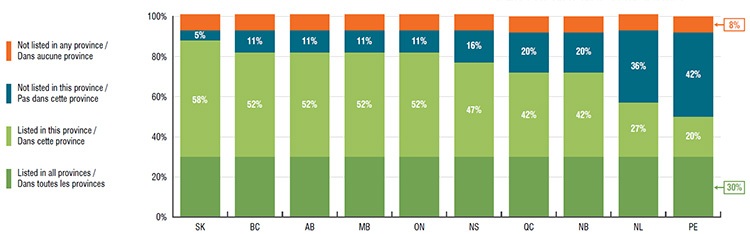
Figure description
This bar graph gives the percentage of the 64 select cancer drugs that are listed in all provinces (30%), not listed in any of the provinces (8%) and that percentage listed and not listed in each individual province.
blank
| Province |
Listed in this province |
Not listed in this province |
| Saskatchewan |
58% |
5% |
| British Columbia |
52% |
11% |
| Alberta |
52% |
11% |
| Manitoba |
52% |
11% |
| Ontario |
52% |
11% |
| Nova Scotia |
47% |
16% |
| Quebec |
42% |
20% |
| New Brunswick |
42% |
20% |
| Newfoundland and Labrador |
27% |
36% |
| Prince Edward Island |
20% |
42% |
3. The interprovincial formulary agreement for the selected drugs is relatively high
The degree of listing alignment between all public drug programs was calculated based on 45 bilateral public drug program combinations. The results indicate high rates of coverage agreement among the public drug programs, with a range of 63% to 91% for unweighted rates. Adjusting for the sales weight, the average agreement rates were 68% to 100%.
Unweighted and sales-weighted and interprovincial coverage agreement rates of iJODR and pCODR reviewed drugs, 2015
| Agreement rates |
Average |
Median |
Maximum |
Minimum |
Standard deviation |
| Unweighted |
78% |
80% |
91% |
63% |
9% |
| Weighted |
89% |
89% |
100% |
68% |
9% |
4. Western Canada has better drug coverage alignment than other Canadian regions
The listing decision agreement rates between the provincial drug programs in Western Canada were higher than in any other region. For 59 drugs listed in the Western Provinces, the average rate of interprovincial coverage agreement was 88%, higher than the Canadian average (78%), while with expenditure weighting, the rate was 97%. The average rates of agreement weighted by sales were also high in Central Canada, but relatively lower in Atlantic Canada.
Interprovincial coverage agreement rates by region, 2015
Click on image for larger view
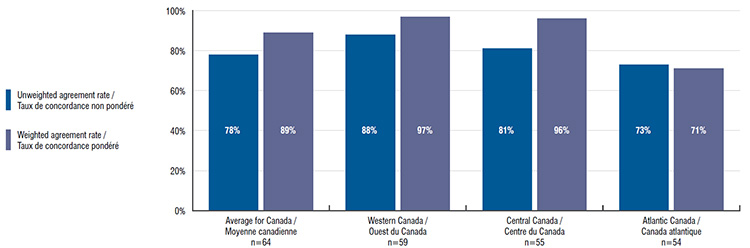
Figure description
This bar graph depicts the rate of agreement in coverage within the major regions in Canada for the selected drugs. The average and weighted average are given for each region along with the number of drugs used in the calculation.
blank
| Description |
Number of drugs |
Unweighted agreement rate |
Weighted agreement rate |
| Average for Canada |
64 |
78% |
89% |
| Western Canada |
59 |
88% |
97% |
| Central Canada |
55 |
81% |
96% |
| Atlantic Canada |
54 |
73% |
71% |
Limitations: Variation in drug coverage across public plans may be impacted by differences in the plan designs, demographics and the disease profiles of the eligible beneficiary populations.
Data sources:
- National Prescription Drug Utilization Information System (NPDUIS) Database, Canadian Institute for Health Information (CIHI)
- IMS Brogan IMAM Database
- IMS Brogan Payer Insights
- IMS Brogan Private Drug Plan Database
- MIDAS™ Database, Manufacturer Ex-factory Sales in Retail and Hospital, IMS AG. All Rights Reserved.
- Other publicly available data sources including Common Drug Review website
Disclaimer: Although based in part on data provided by the Canadian Institute for Health Information (CIHI) and under license from the IMS AG’s MIDAS™ Database, IMS Brogan’s IMAM Database, IMS Brogan’s Payer Insights, and IMS Brogan’s Private Drug Plan Database, the statements, findings, conclusions, views and opinions expressed in this report are exclusively those of the PMPRB and are not attributable to CIHI, IMS AG or IMS Brogan.
NPDUIS is a research initiative that operates independently of the regulatory activities of the PMPRB.