Generic Drugs in Canada, 2015
PDF - 348 kb
Canadian generic prices have been relatively high historically compared to international levels. Through the implementation of generic pricing policies, the provinces have reduced the price of generic drugs for all Canadians, realizing important cost savings. While these policies have narrowed the gap in generic prices between Canadian and international markets, prices in other countries continue to be lower.
Generics360 is a Patented Medicine Prices Review Board (PMPRB) publication series that monitors and reports on the latest developments in generic drug pricing and markets in Canada, and compares them with those of other industrialized countries. This analysis highlights recent trends in Canadian generic pricing as of the last quarter of 2015, with a focus on commonly used drugs.
International comparisons focus on the seven countries the PMPRB considers in reviewing the prices of patented drugs (PMPRB7): France, Germany, Italy, Sweden, Switzerland, the United Kingdom (UK) and the United States (US). Some of the analyses also include other countries in the Organisation for Economic Co-operation and Development (OECD).
Key Findings
1. The period from 2010 to 2015 was marked by significant declines in domestic generic price levels
Canadian generic prices fell by an average of 48%, exceeding the generic price reductions in all other foreign markets analyzed. The largest declines (65%) were realized for the 18 commonly used generic drugs whose prices were reduced to 18% of their equivalent brand-name products through the pan-Canadian Pharmaceutical Alliance (pCPA).
Relative to their brand-name counterparts, average generic prices in Canada declined from 63% to 35% over this time period.
Price indices for generic drugs, Canada and the PMPRB7, Q4-2007 to Q4-2015
Click on image for larger view
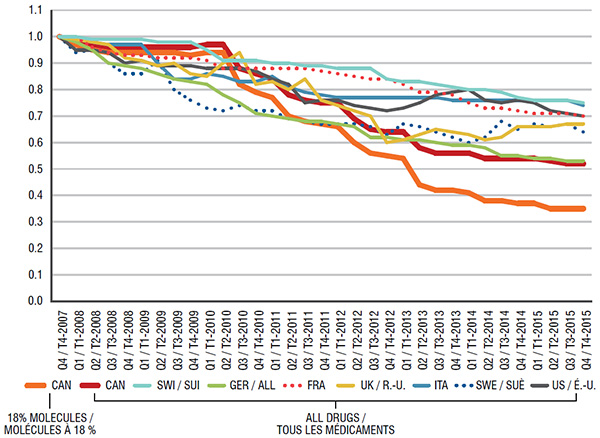
Figure description
This line graph depicts the trend in the quarterly price indices for generic drugs in Canada and the seven PMPRB comparator countries (France, Germany, Italy, Sweden, Switzerland, the United Kingdom, and the United States) from the fourth quarter of 2007 to the fourth quarter of 2015. The trend for each country is represented by a separate line, with each starting at a normalized value of one. There are two lines for Canadian generic drugs: one for all generic products and one for the 18 commonly used generic drugs whose prices were reduced to 18% of their equivalent brand-name products through the pan-Canadian Pharmaceutical Alliance. All of the price indices dropped over this time period.
blank
| Country |
Fourth quarter of 2007 |
Fourth quarter of 2015 |
| Canada: 18% molecules |
1.00 |
0.35 |
| Canada |
1.00 |
0.52 |
| Switzerland |
1.00 |
0.75 |
| Germany |
1.00 |
0.53 |
| France |
1.00 |
0.70 |
| United Kingdom |
1.00 |
0.67 |
| Italy |
1.00 |
0.74 |
| Sweden |
1.00 |
0.64 |
| United States |
1.00 |
0.70 |
2. The declines in domestic generic price levels markedly reduced the gap in prices between Canadian and foreign markets
The difference between generic prices in Canada and the PMPRB7 countries gradually decreased from 40% in 2010 to 9% in 2015, based on the mean values, and from 49% in 2010 to 27% in 2015, based on the median values. Generic prices in foreign markets also declined over the period of the analysis, and were for the most part offset by the weakening of the Canadian dollar.
Average multilateral foreign*-to-Canadian generic price ratios, Q4-2010 versus Q4-2015
Click on image for larger view
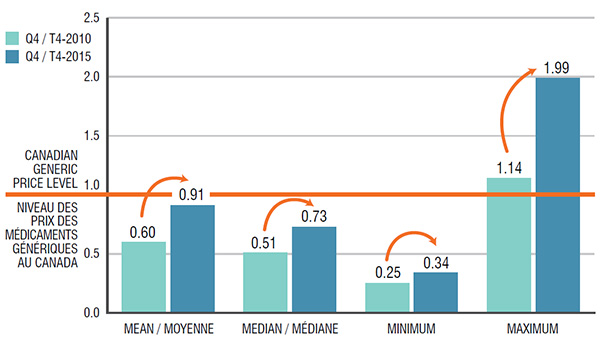
Figure description
This bar graph compares the mean, median, minimum and maximum foreign-to-Canadian generic price ratios in the fourth quarter of 2010 to those in the fourth quarter of 2015. Foreign prices reflect the prices in the seven PMPRB comparator countries (France, Germany, Italy, Sweden, Switzerland, the United Kingdom, and the United States). The Canadian generic price level is set to equal one.
blank
| |
Mean |
Median |
Minimum |
Maximum |
| Fourth quarter of 2010 |
0.60 |
0.51 |
0.25 |
1.14 |
| Fourth quarter of 2015 |
0.91 |
0.73 |
0.34 |
1.99 |
3. Canadian generic prices are higher than those in many PMPRB7 and other OECD countries
Amongst the PMPRB7 countries, Canadian generic prices are the third highest after Switzerland and the United States. Only a few other OECD countries have price levels higher than in Canada, while many pay approximately half as much.
Average bilateral foreign*-to-Canadian generic price ratios, OECD countries, Q4-2015
Click on image for larger view
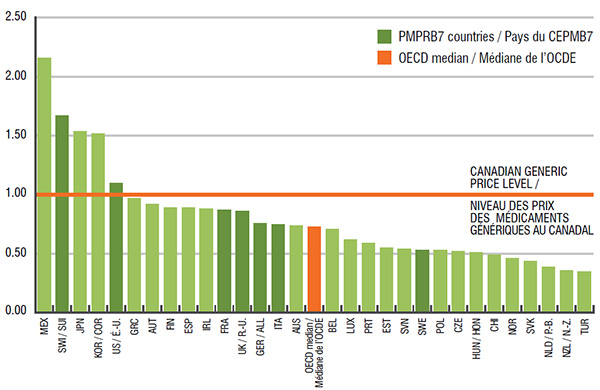
Figure description
This bar graph shows the average bilateral foreign-to-Canadian generic price ratios for the Organisation for Economic Co-operation and Development countries in the fourth quarter of 2015. The Canadian price level in the table is equal to one. Values less than one represent lower foreign prices and those above one represent higher foreign prices.
blank
| Country |
Foreign-to-Canadian generic price ratio |
| Mexico |
2.16 |
| Switzerland* |
1.67 |
| Japan |
1.54 |
| Korea |
1.52 |
| United States* |
1.10 |
| Greece |
0.97 |
| Austria |
0.92 |
| Finland |
0.89 |
| Spain |
0.89 |
| Ireland |
0.88 |
| France* |
0.87 |
| United Kingdom* |
0.86 |
| Germany* |
0.76 |
| Italy* |
0.75 |
| Australia |
0.74 |
| OECD median |
0.72 |
| Belgium |
0.71 |
| Luxembourg |
0.62 |
| Portugal |
0.59 |
| Estonia |
0.55 |
| Slovenia |
0.54 |
| Sweden* |
0.53 |
| Poland |
0.53 |
| Czech Republic |
0.52 |
| Hungary |
0.51 |
| Chile |
0.49 |
| Norway |
0.46 |
| Slovakia |
0.44 |
| Netherlands |
0.39 |
| New Zealand |
0.36 |
| Turkey |
0.35 |
* PMPRB7 countries
4. The generic pricing policies implemented by the pCPA resulted in a closer alignment between Canadian and foreign price levels for commonly used generic drugs
A drug-level analysis suggests that Canadian prices of many of the 18 commonly used generic drugs subject to pCPA policies are either at level or below the prices in the PMPRB7 countries. The table displays the drugs subject to the pCPA 18% rule for which foreign prices are, on average, below Canadian levels. Note that the results do not reflect the latest efforts by the pCPA Generics Initiative, which is launching a bridging period effective April 1, 2017, further reducing the prices of some of these generics to 15% of their equivalent brand-name products. The molecules subject to this policy are highlighted in the table.
The results indicate that while the minimum foreign prices are significantly below Canadian levels for many top-selling drugs, the mean and median foreign prices are markedly lower than in Canada for only a few commonly used generic drugs such as simvastatin, amlodipine and atorvastatin.
The table also lists other top-selling generic drugs with lower mean and median foreign prices.
Multilateral foreign*-to-Canadian price ratios, top-selling generic drugs, Q4-2015
Click on image for larger view
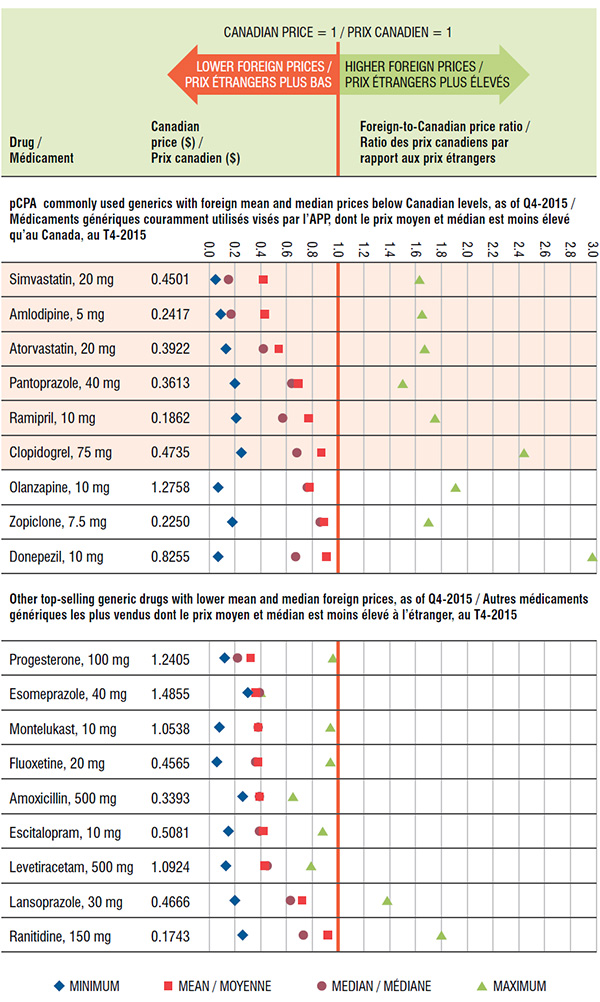
Figure description
This table depicts the multilateral foreign-to-Canadian price ratios for the top-selling generic drugs in the fourth quarter of 2015. The Canadian price level in the table is equal to one. Values less than one represent lower foreign prices and those above one represent higher foreign prices. Foreign prices reflect the prices in the seven PMPRB comparator countries (France, Germany, Italy, Sweden, Switzerland, the United Kingdom, and the United States).
The first part of the table lists the pan-Canadian Pharmaceutical Alliance commonly used generics with foreign mean and median prices below Canadain levels as of the fourth quarter of 2015. The first six drugs will be reduced again in price in April 2017.
blank
| Drug |
Canadian price |
Minimum |
Mean |
Median |
Maximum |
| Simvastatin, 20 mg |
0.4501 |
0.05 |
0.42 |
0.15 |
1.63 |
| Amlodipine, 5 mg |
0.2417 |
0.09 |
0.43 |
0.17 |
1.65 |
| Atorvastatin, 20 mg |
0.3922 |
0.13 |
0.54 |
0.42 |
1.67 |
| Pantoprazole, 40 mg |
0.3613 |
0.20 |
0.69 |
0.64 |
1.50 |
| Ramipril, 10 mg |
0.1862 |
0.21 |
0.77 |
0.57 |
1.75 |
| Clopidogrel, 75 mg |
0.4735 |
0.25 |
0.87 |
0.68 |
2.44 |
| Olanzapine, 10 mg |
1.2758 |
0.07 |
0.78 |
0.76 |
1.91 |
| Zopiclone, 7.5 mg |
0.2250 |
0.18 |
0.89 |
0.86 |
1.70 |
| Donepezil, 10 mg |
0.8255 |
0.07 |
0.91 |
0.67 |
2.97 |
The second part of the table lists other top-selling generic drugs with lower mean and median prices as of the fourth quarter of 2015.
blank
| Drug |
Canadian price |
Minimum |
Mean |
Median |
Maximum |
| Progesterone, 100 mg |
1.2405 |
0.12 |
0.32 |
0.22 |
0.96 |
| Esomeprazole, 40 mg |
1.4855 |
0.30 |
0.36 |
0.39 |
0.40 |
| Montelukast, 10 mg |
1.0538 |
0.08 |
0.38 |
0.38 |
0.94 |
| Fluoxetine, 20 mg |
0.4565 |
0.06 |
0.38 |
0.36 |
0.94 |
| Amoxicillin, 500 mg |
0.3393 |
0.26 |
0.39 |
0.39 |
0.65 |
| Escitalopram, 10 mg |
0.5081 |
0.15 |
0.42 |
0.39 |
0.88 |
| Levetiracetam, 500 mg |
1.0924 |
0.13 |
0.43 |
0.45 |
0.79 |
| Lansoprazole, 30 mg |
0.4666 |
0.20 |
0.72 |
0.63 |
1.38 |
| Ranitidine, 150 mg |
0.1743 |
0.26 |
0.92 |
0.73 |
1.80 |
5. The gap between foreign and Canadian prices was wider for molecules with higher sales
Generic price differences were more pronounced for drugs with estimated annual Canadian sales of more than $10 million, with foreign mean international prices 17% lower than in Canada. These markets accounted for a large proportion of generic sales.
Average multilateral foreign*-to-Canadian generic price ratios by market size, Q4-2015
Click on image for larger view
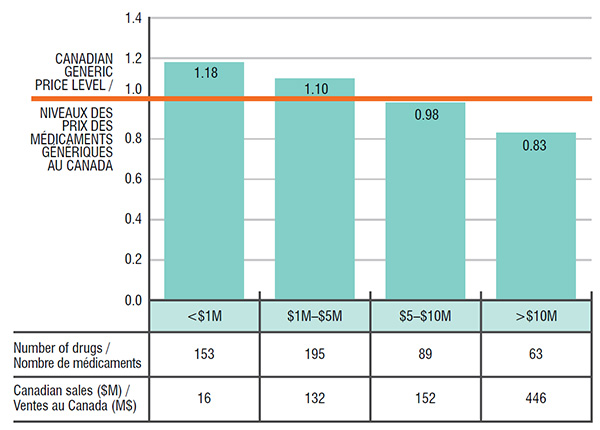
Figure description
This bar graph gives the average multilateral foreign-to-Canadian generic price ratios broken out by market size in the fourth quarter of 2015. The four market sizes are less than one million dollars; one to five million dollars; five to ten million dollars and more than ten million dollars. Foreign prices reflect the prices in the seven PMPRB comparator countries (France, Germany, Italy, Sweden, Switzerland, the United Kingdom, and the United States).
blank
|
Less than one million dollars |
One to five million dollars |
Five to ten million dollars |
More than ten million dollars |
| Foreign-to-Canadian price ratios |
1.18 |
1.10 |
0.98 |
0.83 |
| Number of drugs |
153 |
195 |
89 |
63 |
| Canadian sales in millions of dollars |
16 |
132 |
152 |
446 |
* France, Germany, Italy, Sweden, Switzerland, the United Kingdom and the United States.
Source: MIDAS™ Database, Manufacturer Ex-factory Sales, IMS AG. All Rights Reserved.
Disclaimer: Although based in part on data provided under license by the IMS AG’s MIDAS™ Database, the statements, findings, conclusions, views and opinions expressed in this report are exclusively those of the PMPRB and are not attributable to IMS AG.
NPDUIS is a research initiative that operates independently of the regulatory activities of the PMPRB.