PMPRB Annual Public Drug Plan Expenditure Report 2012/13
ISSN 2369-0518
Executive Summary
The amount spent on prescription drugs in Canada represents a significant component of the overall health care costs. After sustained double-digit rates of growth in prescription drug expenditures a decade ago, the annual rate has gradually declined, reaching 1.2% in 2012 (CIHI 2014).
To aid in understanding the recent trends in prescription drug spending and anticipate the direction of future spending levels, the NPDUIS CompassRx report provides a comprehensive cost driver analysis of prescription drug expenditures for a number of select Canadian public drug plans. The analysis points towards the most important cost pressures, measures their impact on expenditure levels, and delves into the factors determining trends in costs, pricing and utilization in public plans. The report also monitors major developments in the Canadian environment related to drug approval, review, pricing and reimbursement. The 2012/13 NPDUIS CompassRx is the first edition of this annual publication and provides a baseline for future Public Drug Plan Expenditure reports.
Changes in prescription drug expenditures are driven by a number of opposing “push” and “pull” effects. An increase in the beneficiary population, the use of drugs, and the use of more expensive drugs puts an upward pressure on expenditures, resulting in a push effect; while generic substitutions and price reductions exert a downward pull effect. In any given year and market segment, the weight of each of these effects may vary, and as a result, the rates of change in prescription drug expenditures evolve over time and vary across public drug plans.
The analysis in this report employs a cost driver model to disaggregate and quantify the impact of each of the major drivers of change for the two main components of prescription drug expenditures: drug costs and dispensing fees. Four broad categories of effects are considered: demographic, volume, price and drug-mix effects.
The main data source for this report is the National Prescription Drug Utilization Information System Database, Canadian Institute for Health Information (CIHI). The results are presented for a select number of public drug plans with available data: Alberta, Saskatchewan, Manitoba, Ontario, New Brunswick, Nova Scotia and Prince Edward Island and Health Canada’s Non-Insured Health Benefits drug plan. The study focuses on the cost levels and drivers in the 2012/13 fiscal year and provides a retrospective look at trends since 2008/09.
Identifying the major drivers of change and the effect they have on prescription drug expenditures allows policy makers and researchers to understand the current trends and anticipate future cost pressures and expenditure levels.
Key findings
Overview of Expenditures for 2012/13
Prescription drug expenditures in the select public drug plans totaled $7.7 billion in 2012/13 and were composed of the following components: drug costs (74.4%), pharmacy dispensing fees (21.4%) and markups (4.2%).
The select public drug plans paid 82.0% of the overall prescription drug expenditure level, with the remaining share being paid by the drug plan beneficiaries either out-of-pocket or through a third-party private insurer.
Drug Cost Component
The rates of change in the drug cost component of prescription drug expenditures in public drug plans have been steadily declining in recent years, with the overall cost levels decreasing in 2012/13 by 0.8% compared to 2011/12.
The low net rate of change was driven by opposing “push” (increasing) effects and “pull” (decreasing) effects which nearly off-set each other.
- The demographic, volume, and drug-mix effects had an important “push” effect, and in the absence of generic savings, they would have increased drug cost levels by 8.5% in 2012/13.
- The generic price change and substitution effects had an important “pull” effect, and in the absence of other cost pressures, they would have decreased drug cost levels by 9.2% in 2012/13.
Drug cost drivers 2012/13
Note: Values may not add to totals due to rounding and the cross effect.
Data source: National Prescription Drug Utilization Information System Database, Canadian Institute for Health Information.
Figure description
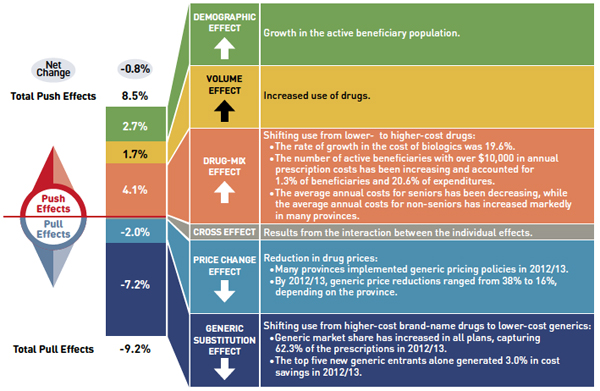
This diagram illustrates drug cost drivers for 2012/13, breaking them out into push (increasing) and pull (decreasing) effects. It shows the totals for the select public drug plans in Canada.
The overall net change in drug costs from 2011/12 to 2012/13 was -0.8%.
The total push effect was 8.5% and included the following key effects:
- The drug-mix effect (4.1%) due to shifting use from lower- to higher-cost drugs:
- The rate of growth in the cost of biologics was 19.6%.
- The number of active beneficiaries with over $10,000 in annual prescription costs has been increasing and accounted for 1.3% of beneficiaries and 20.6% of expenditures.
- The average annual costs for seniors have been decreasing, while the average annual costs for non-seniors have increased markedly in many provinces.
- The volume effect (1.7%) due to the increased use of drugs.
- The demographic effect (2.7%) due to the growth in the active beneficiary population.
The total pull effect was -9.2% and included the following key effects:
- The generic substitution effect (-7.2%) due to shifting use from higher-cost brand-name drugs to lower-cost generics:
- Generic market share has increased in all plans, capturing 62.3% of the prescriptions in 2012/13.
- The top five new generic entrants alone generated 3.0% in cost savings in 2012/13.
- The price change effect (-2.0%) due to a reduction in drug prices:
- Many provinces implemented generic pricing policies in 2012/13.
- By 2012/13, generic price reductions ranged from 38% to 16%, depending on the province.
A cross effect resulted from the interaction between the individual effects. No value is given for the cross effect.
Dispensing Fee Component
Dispensing fee expenditures have been increasing in recent years in most plans, with the overall fee levels growing in 2012/13 by 5.8% compared to 2011/12.
- The rate of change in dispensing fees was generally driven by increases in the size and age of the active beneficiary population, by a growth in the use of drugs and in dispensing fee levels, as well as a trend toward shorter prescription sizes in some provinces.
Dispensing fee drivers 2012/13
Note: Values may not add to totals due to rounding and the cross effect.
Data source: National Prescription Drug Utilization Information System Database, Canadian Institute for Health Information.
Figure description
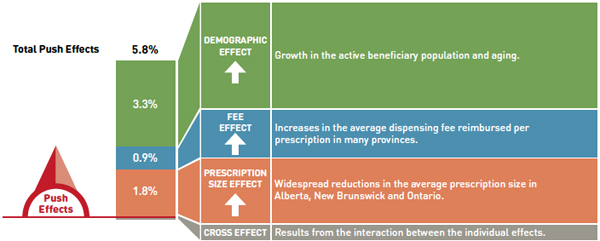
This diagram illustrates dispensing fee drivers for 2012/13. It shows the totals for the select public drug plans in Canada.
The total push (increasing) effect from 2011/12 to 2012/13 was 5.8% and included the following key effects:
- The demographic effect (3.3%) driven by the growth in the active beneficiary population and aging.
- The fee effect (0.9%) driven by increases in the average dispensing fee reimbursed per prescription in many provinces.
- The prescription size effect (1.8%) driven by widespread reductions in the average prescription size in Alberta, New Brunswick and Ontario.
A cross effect resulted from the interaction between the individual effects. No value is given for the cross effect.
Note that overall key findings mask important variations at jurisdictional level, which are detailed in the report.
Canadian Pricing and Reimbursement Environment 2012/13
- Important generic pricing policies were implemented in 2012/13:
- A number of provinces lowered the price of generic drugs to 35% (British Columbia, Alberta, Saskatchewan, New Brunswick, Nova Scotia and Prince Edward Island) and 40% of the reference brand (Newfoundland and Labrador).
- Generic drug reforms in Ontario that reduced generic prices to 25% of the brand-name price for the public plan were extended to private drug plans and out-of-pocket markets.
- The PMPRB reviewed 82 new drug products in 2012:
- One was a breakthrough drug, three demonstrated a substantial improvement and six were classified as having a moderate improvement. The remaining 72 drugs were classified as having slight or no improvement.
- The Common Drug Review provided recommendations for 33 drugs in 2012/13:
- List: 2; list in a similar manner to other drugs in its class: 2; list with criteria/condition: 11; list with clinical criteria and/or conditions: 3; do not list at the submitted price: 2; and do not list: 13.
Canadian Institute for Health Information (CIHI). 2014. National Health Expenditure Trends, 1975 to 2014. Ottawa, ON, page 137. Available from: http://www.cihi.ca/web/resource/en/nhex_2014_report_en.pdf (Accessed March 2015)
Acknowledgements
This report was prepared by the Patented Medicine Prices Review Board (PMPRB) as part of the National Prescription Drug Utilization Information System (NPDUIS).
The PMPRB would like to acknowledge the contributions of:
- The members of the NPDUIS Advisory Committee, for their expert oversight and guidance in the preparation of this report.
- The PMPRB NPDUIS staff for their contribution to the analytical content of the report:
- Tanya Potashnik – Director, Policy and Economic Analysis
- Elena Lungu – Manager, NPDUIS
- Greg McComb – Senior Economic Analyst
- Gary Warwick – Senior Economic Analyst
- Orlando Manti – Senior Economist
- Ai Chau – SAS Analyst
- The PMPRB scientific and editing groups
Disclaimer
NPDUIS is a research initiative that operates independently of the regulatory activities of the Board of the PMPRB. The statements and opinions expressed in this NPDUIS report do not represent the position of the PMPRB with respect to any regulatory matter.
Parts of this material are based on data and information provided by the Canadian Institute for Health Information. However, the analyses, conclusions and/or statements expressed herein are not those of the Canadian Institute for Health Information.
- Executive Summary
- Introduction
- Methods
- Limitations
- 1 Canadian Pricing and Reimbursement Environment, 2012/13
- 2 Overview of Prescription Drug Expenditures and Utilization, 2012/13
- 3 Trends in Prescription Drug Expenditures, 2008/09 to 2012/13
- 4 The Drivers of Drug Costs, 2011/12 to 2012/13
- 5 The Drivers of Dispensing Fee Expenditures, 2011/12 to 2012/13
- References
- Appendix A – Public Drug Plan Design
- Appendix B – Pricing Policies for Generic Drugs in Provincial Drug Plans
- Appendix C – Markup Policies in Public Drug Plans, 2012/13
- Appendix D – Dispensing Fee Policies in Public Drug Plans, 2012/13
- Appendix E – Top 100 Patented Drugs by Drug Cost, NPDUIS Select Public Drug Plans, 2012/13
- Appendix F – Top 100 Non-Patented Single Source Drugs by Drug Cost, NPDUIS Select Public Drug Plans, 2012/13
- Appendix G –Top 100 Multi-Source Generic Drugs by Drug Cost, NPDUIS Select Public Drug Plans, 2012/13
- Appendix H –Top 100 Manufacturers by Drug Cost, NPDUIS Select Public Drug Plans, 2012/13
- Appendix I – Glossary
Introduction
The amount spent on prescription drugs in Canada represents a significant component of the overall health care costs. After sustained double-digit rates of growth in prescription drug expenditures a decade ago, the annual rate has gradually declined, reaching 1.2% in 2012.Footnote 1
To aid in understanding recent trends in prescription drug spending and anticipate the direction of future spending levels, the NPDUIS CompassRx report provides a comprehensive cost driver analysis of prescription drug expenditures for a number of select Canadian public drug plans. The report highlights the most significant cost pressures, measures their impact on expenditure levels and delves into the factors determining trends in costs, pricing and utilization in public plans. The report also monitors major developments in the drug approval, review, pricing and reimbursement environment in Canada. The 2012/13 NPDUIS CompassRx is the first edition of this annual publication and provides a baseline for future Public Drug Plan Expenditure reports.
The recent low rates of growth in prescription drug expenditures are the net result of a number of “push” and “pull” effects on costs. Factors such as an increase in the beneficiary population, the increased use of drugs, and the use of more expensive drugs, to name a few, are putting an upward pressure (“push”) on expenditures. At the same time, expenditure levels are pulled downward by factors such as generic substitution and price reductions.
The analysis in this report disaggregates and quantifies the impact of each of the principal contributing factors. Four broad categories of effects are considered: demographic effects, volume effects, price effects and drug-mix effects. Important sub-effect are also analyzed.
In any given year and market segment, the weight of the opposing “push” and “pull” effects may vary, depending on market trends, reimbursement decisions, changing treatments practices etc. These rates of change in prescription drug expenditures evolve over time and vary across public drug plans.
Identifying the major drivers of change and the effect they have on prescription drug expenditures will allow policy makers and researchers to understand the current trends and anticipate future cost pressures and expenditure levels.
This report is divided into five sections: Section 1 monitors recent pricing and reimbursement developments. Section 2 provides an overview of the prescription drug expenditure and utilization levels for 2012/13 for the select Canadian public drug plans. Section 3 reports on five-year trends (2008/09 to 2012/13) in prescription drug expenditures. Sections 4 and 5 provide a cost driver analysis of the factors that drive drug and dispensing fee expenditures, respectively.
Methods
The main data source for this report is the National Prescription Drug Utilization Information System (NPDUIS) Database, developed by the Canadian Institute for Health Information (CIHI). This database houses pan-Canadian information on public drug programs, including anonymous claims-level data collected from the plans participating in the NPDUIS initiative.
Results are presented for the following select public drug plans: Alberta, Saskatchewan, Manitoba, Ontario, New Brunswick, Nova Scotia, Prince Edward Island and Health Canada’s Non-Insured Health Benefits (NIHB) drug plan. Totals include data from all of the plans listed above. While British Columbia and Newfoundland and Labrador participate in the NPDUIS initiative, data for these provinces was not available at the time of the study. A detailed description of the plans available in the NPDUIS database is available in a Plan Information Document produced by CIHI.Footnote 2
The study analyzes data from 2008/09 to 2012/13, with a focus on the rates of change in prescription drug expenditures from 2011/12 to 2012/13. The drug costs, pharmacy markups and dispensing fees reported in this study are the amounts accepted toward reimbursement by the public plans. See the glossary in Appendix I for definitions of other variables in the report.
The results reported for Saskatchewan and Manitoba include the accepted prescription drug expenditures for individuals who are eligible for coverage but have not submitted an application and, therefore, do not have a defined deductible.Footnote 3 For the NIHB, claims that were coordinated with provincial public drug plans are excluded from the analysis to ensure consistency in the annual data reporting.
The results reported for New Brunswick include the number of active beneficiaries enrolled in the Medavie Blue Cross Seniors’ Prescription Drug Program and their related drug expenditures, which are offset by monthly premiums.
The analysis of the drivers of drug expenditures and dispensing fees follows the methodological approach detailed in the PMPRB report The Drivers of Prescription Drug Expenditures: A Methodological Report, 2013.Footnote 4
Analyses of the average prescription size, as well as generic pricing, are limited to oral solid formulations. This is to avoid data reporting inconsistencies that may exist in the day supply and unit reporting of non-oral formulations.
Population data is derived from the Non-Insured Health Benefits Annual Report and Statistics Canada census data for 2006 and 2011.
Limitations
The results presented in this report are intended for individual reviews of each public plan. Comparative analyses across plans are limited due to the differences among the plan designs, demographics and the disease profiles of the eligible beneficiary populations.
For example, Saskatchewan and Manitoba have universal income-based drug programs that provide broad-based coverage for the general population. Other public drug plans offer programs with differing design structures for seniors, income assistance recipients and various patient groups.
The Non-Insured Health Benefits plan provides universal coverage to First Nations and Inuit recipients across Canada. This population has specific demographic and health profiles that differ from those reimbursed by other public plans.
The NPDUIS Database includes sub-plan data specific to particular jurisdictions. This further limits the comparability of results across plans. For instance, some sub-plans that are available in most provinces are not captured in the data for Alberta, Nova Scotia and Prince Edward Island. Appendix A provides a comprehensive summary of the sub-plans available in the NPDUIS Database, along with the beneficiary eligibility criteria.
The totals for the "select public drug plans", which include all the plans analyzed in this report, are heavily weighted toward Ontario due to its size.
The prescription drug expenditure data for the select public drug plans represents only one segment of the overall pharmaceutical market, and hence, the findings in this report should not be extrapolated to the overall Canadian marketplace. The total prescription drug expenditure reported for the select public plans was $7.7 billion in the fiscal year 2012/13. By comparison, this represents 64.2% of the $12.0 billion spent on prescription drugs in the public sector and 27.3% of the $28.3 billion in total Canadian prescription drug spending in the 2012 calendar year.Footnote 1
This edition of the CompassRx monitors developments in the pricing and reimbursement environment and reports on the data up to and including the 2012/13 fiscal year. Since then important developments have taken place in the Canadian environment which are not captured in this report. The current CompassRx provides a baseline as of 2012/13. Future editions of the report will monitor developments and report on public drug plan data for subsequent fiscal years.
Note that the drug costs reported are the amounts accepted toward reimbursement by the public plans and are not reflective of any off-invoice price rebates or confidential product listing agreements.
1 Canadian Pricing and Reimbursement Environment, 2012/13
This section provides a high-level overview of provincial and federal developments that may have had an impact on public drug plan expenditure and utilization in 2012/13.
Public Drug Plans: Initiatives and Policy Updates
The information in this section was obtained from publicly available sources, including CIHI’s NPDUIS Plan Information DocumentFootnote 2 and IMS Brogan’s Provincial Reimbursement Advisor.Footnote 5
Generic and Brand-name Drug Prices
Most provinces implemented generic pricing policies in 2012/13. Six provinces (British Columbia, Alberta, Saskatchewan, New Brunswick, Nova Scotia and Prince Edward Island) lowered the prices of generic drugs to 35% of the equivalent brand-name prices, while Newfoundlanad and Labrador reduced this ratio to 40%. In April 2012, generic drug reforms implemented in the Ontario public plan were extended to private drug plans and out-of-pocket markets. These reforms reduced generic prices to a maximum of 25% of the reference brand-name prices for most drugs.
Since 2012/13, subsequent generic pricing policies have been introduced either individually by provinces or through the coordinated approach to price setting led by the Council of the Federation’s Health Care Innovation Working Group (HCIWG).Footnote 6 The impact of the policies introduced after 2012/13 is not reflected in the data presented in this report. Appendix B provides a summary of generic pricing policies implemented since 2010.
The Council of the Federation through the pan-Canadian Pharmaceutical Alliance (pCPA) conducts joint provincial/territorial negotiations for brand-name drugs to achieve a greater value for Canadian publicly funded drug programs. As a result, a total of 43 product listing agreements (PLAs) for brand-name drugs were completed by July 2013 (10 drugs) and July 2014 (33 drugs). PLA prices are not reflected in the drug costs captured by the NPDUIS Database.
Dispensing Fees
Several provinces increased their dispensing fees in 2012/13, some differentiating between rural and non-rural pharmacies. Saskatchewan increased the maximum dispensing fee from $9.85 to $10.24, while Ontario raised dispensing fees for non-rural pharmacies from $8.20 to $8.40, and set the range for rural pharmacies at $9.45 to $12.61. Nova Scotia increased dispensing fees from $10.73 to $10.90.The dispensing fee for non-interchangeable drugs and extemporaneous preparations was increased in New Brunswick on June 1, 2012, including providing an additional $2 dispensing fee to qualifying rural pharmacies.
Public drug plans may also reimburse fees for professional pharmacy services other than the dispensing of medications. However, these fees are not reflected in the data reported in this study.
Plan Design Changes
Ontario established a Narcotics Monitoring System, which was activated on April 16, 2012, and began to collect dispensing data from all Ontario pharmacies for all monitored drugs dispensed to people in Ontario.
Saskatchewan increased the maximum co-payment for both the Seniors’ and Children’s drug plans from $15 to $20.
Manitoba increased the annual deductible range from between 2.73% and 6.17% of household income to between 2.81% and 6.36%. The Pediatric Insulin Pump Program was launched on April 12, 2012. On April 19, 2012, Manitoba Health announced the Home Cancer Drug Program for Manitobans who are diagnosed with cancer. The program allows these patients to access eligible outpatient oral cancer and specific supportive drugs at no cost.
A methadone program was implemented in Prince Edward Island on November 20, 2012, to provide coverage for the cost of Metadol for clients who were registered through the provincial Methadone Maintenance Program.
Approval, Review and Assessment of Drugs and Prices in Canada
At a national level, three institutions approve drugs, review their prices or conduct health technology assessments:
- Health Canada grants the authority to market a drug in Canada once it has met the regulatory requirements for safety, efficacy and quality, and issues a Notice of Compliance (NOC).
- The Patented Medicine Prices Review Board (PMPRB) reviews the prices of patented drugs sold in Canada and ensures that they are not excessive. It also reports on pharmaceutical trends for all medicines and research and development spending by patentees.
- The Canadian Agency for Drugs and Technologies in Health (CADTH) Common Drug Review (CDR) reviews the clinical effectiveness and cost-effectiveness of drugs marketed in Canada and provides formulary listing recommendations to Canada’s publicly funded drug plans (excluding that of Quebec).
Health Canada
In 2012/13, Health Canada issued 965 Notices of Compliance (NOCs)Footnote 7 – see Table 1.1.
Table 1.1 Health Canada Notices of Compliance issued in 2012/13
| Pharmaceutical / biologic status |
Number of NOCs |
| Prescription pharmaceutical |
912 |
| Biologic |
53 |
| Total |
965
|
Table 1.1
| Brand name, generic or supplement status |
Number of NOCs |
| Brand name |
190 |
| Generic |
479 |
| Supplements to existing drugs* |
296 |
| Total |
965 |
*NOCs were issued for reasons such as a change to the drug’s name, a new indication or strength, a new manufacturing site or a new process to manufacturer a drug.
Patented Medicine Prices Review Board
In 2012, the PMPRB reviewed 82 new drug products and classified each based on its level of therapeutic improvement (see Table 1.2)
Table 1.2 Patented Medicine Prices Review Board, drugs reviewed in 2012 by level of therapeutic improvement
| Level of therapeutic improvement |
Number of drugs |
| Breakthrough |
1 |
| Substantial improvement |
3 |
| Moderate improvement |
6 |
| Slight / no improvement |
72 |
| Total |
82 |
As part of its reporting mandate, the PMPRB produces the Patented Medicines Price Index (PMPI) to monitor trends in prices of patented drug products. The PMPI measures the average year-over-year change in the ex-factory prices of patented drug products sold in Canada. In 2012, the PMPI, on average, increased slightly by 0.6%, while the Consumer Price Index (CPI), a measure of inflation, increased by 1.5%.Footnote 8
The PMPRB Annual Report compares the prices of Canadian patented drug products to the median price of a basket of seven comparator countries: France, Italy, Germany, Sweden, Switzerland, United Kingdom and the United States. Canadian prices were 7% below the median of this basket in 2012.Footnote 8
Canadian Agency for Drugs and Technologies in Health
In 2012/13, the CADTH Common Drug Review (CDR) made recommendations for 33 drugs – see Table 1.3 for the results.Footnote 9
CADTH implemented revised CDEC recommendation options on November 21, 2012 which included the creation of the “do not list at the submitted price” category and greater usage of conditions related to price in the “list with clinical criteria and/or conditions” category.
Table 1.3 Common Drug Review listing recommendations, 2012/13
| Recommendation |
Number of drugs |
| List* |
2 |
| List in a similar manner to other drugs in class |
2 |
| List with criteria/condition |
11 |
| List with clinical criteria and/or conditions* |
3 |
| Do not list at submitted price* |
2 |
| Do not list* |
13 |
| Total |
33 |
*Recommendation options retained or introduced by the revised CDEC recommendation options on November 21, 2012.
2 Overview of Prescription Drug Expenditures and Utilization, 2012/13
This section provides an overview of prescription drug expenditures and utilization for the select public drug plans in fiscal year 2012/13. The expenditures reported here include the drug costs, dispensing fees, and pharmacy markups, where applicable. Note that these expenditures include both the plan-paid and beneficiary-paid portions, such as co-payments and deductibles. They represent the amounts accepted by the public drug plans toward the deductible or for the reimbursement of their beneficiaries. The glossary in Appendix I defines these expenditure components, and Appendix A summarizes the individual plan designs. A Plan Information Document produced by the Canadian Institute for Health Information (CIHI) provides a detailed description of the plans available in the NPDUIS Database.Footnote 2
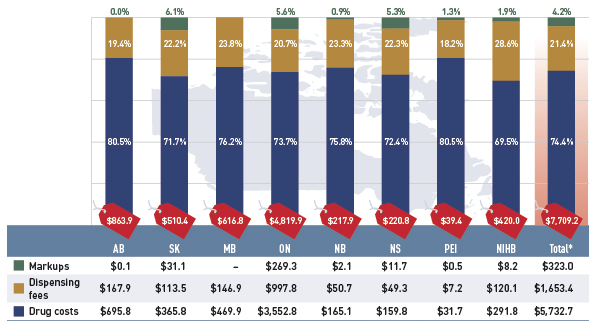
Figure 2.1 reports the prescription drug expenditures levels for 2012/13, along with the three components of expenditure: drug costs, dispensing fees and pharmacy markups.
Figure 2.1 Prescription drug expenditures in select public drug plans, 2012/13 ($million, % share)
*Total results for the select public drug plans reported in this figure.
Note: Values may not add to totals due to rounding.
A wholesale upcharge amount may be captured either in the drug cost or the markup component, depending on the reimbursement policies specific to each drug plan (see Appendix C). This limits the comparability of the relative size of these two components across plans.
Data source: National Prescription Drug Utilization Information System Database, Canadian Institute for Health Information.
Figure description
This bar graph describes prescription drug expenditures for 2012/13 in select public drug plans in Canada, and breaks out the three components: drug cost, dispensing fees and markups.
Table
|
Alberta |
Saskatchewan |
Manitoba |
Ontario |
New Brunswick |
Nova Scotia |
Prince Edward Island |
Non-Insured Health Benefits |
Total select plans |
| Total prescription drug expenditures ($million) |
$863.9 |
$510.4 |
$616.8 |
$4,819.9 |
$217.9 |
$220.8 |
$39.4 |
$420.0 |
$7,709.2 |
| Markups ($million, % share) |
$0.1(0.0%) |
$31.1 (6.1%) |
- (0.0%) |
$269.3 (5.6%) |
$2.1 (0.9%) |
$11.7 (5.3%) |
$0.5 (1.3%) |
$8.2 (1.9%) |
$323.0 (4.2%) |
| Dispensing fees ($million, % share) |
$167.9 (19.4%) |
$113.5 (22.2%) |
$146.9 (23.8%) |
$997.8 (20.7%) |
$50.7 (23.3%) |
$49.3 (22.3%) |
$7.2 (18.2%) |
$120.1 (28.6%) |
$1,653.4 (21.4%) |
| Drug costs ($million, % share) |
$695.8 (80.5%) |
$365.8 (71.7%) |
$469.9 (76.2%) |
$3,552.8 (73.7%) |
$165.1 (75.8%) |
$159.8 (72.4%) |
$31.7 (80.5%) |
$291.8 (69.5%) |
$5,732.7 (74.4%) |
The total prescription expenditure for the drug plans was $7,709.2 million, nearly three quarters of which (74.4%) was represented by the drug cost component. Dispensing fees made up 21.4%, and pharmacy markups represented 4.2%.
Prescription drug expenditure levels differ widely among the plans. This is mainly due to variations in the size of the beneficiary populations, but also reflects the demographic and disease profiles of the populations, as well as differences in plan designs. The relative size of the three expenditure components also varies across the plans, reflecting policy differences in the reimbursed drug costs, pharmacy markups and dispensing fees, as well as the unit amount dispensed per prescription and the choice of drugs.
Appendices C and D summarize the policies governing markups and dispensing fees, respectively, for public drug plans in 2012/13.
A portion of the prescription drug expenditures reported in Figure 2.1 is reimbursed by the public plans, while the rest is paid by the beneficiaries either out-of-pocket or through a third-party private insurer. Figure 2.2 reports the public plan-paid share.
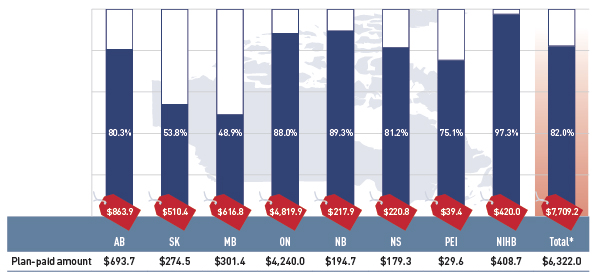
Figure 2.2 Plan-paid share of prescription drug expenditures for select public drug plans, 2012/13 ($million, % share)
*Total results for the select public drug plans reported in this figure.
Data source: National Prescription Drug Utilization Information System Database, Canadian Institute for Health Information.
Figure description
This bar graph describes the plan-paid share of prescription drug expenditures for 2012/13 in select public drug plans in Canada ($million, % share): Alberta: $693.7 (80.3%); Saskatchewan: $274.5 (53.8%); Manitoba: $301.4 (48.9%); Ontario: $4240.0 (88.0%); New Brunswick: $194.7 (89.3%); Nova Scotia: $179.3 (81.2%); Prince Edward Island: $29.6 (75.1%); Non-Insured Health Benefits: $408.7 (97.3%); Total select plans: $6322.0 (82.0%).
The graph also shows total prescription drug expenditures for select plans ($million): Alberta: $863.9; Saskatchewan: $510.4; Manitoba: $616.8; Ontario: $4,819.9; New Brunswick: $217.9; Nova Scotia: $220.8; Prince Edward Island: $39.4; Non-Insured Health Benefits: $420.0; Total select plans: $7,709.2
The results suggest that the public drug plans paid 82.0% of the overall prescription drug expenditure level for their beneficiaries, which included the drug costs, dispensing fees and pharmacy markups.
Jurisdictional variations are mainly due to differences in plan design and the specific government–patient cost-sharing structures (Appendix A). These differences limit the comparability of the jurisdictional results.
For instance, public drug plans in Saskatchewan and Manitoba provide income-based coverage for the general population, and the expenditure levels are accepted amounts for individuals who are eligible for coverage but have not submitted an application and, therefore, do not have a defined deductible.Footnote 3
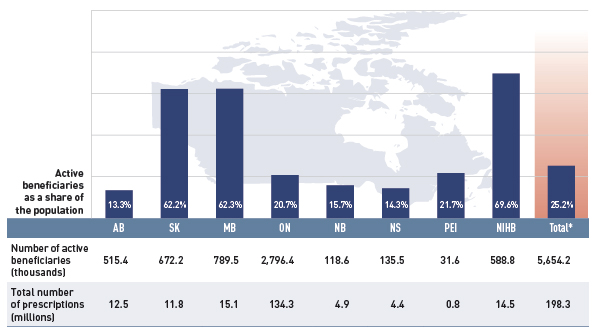
Figure 2.3 gives the number of active beneficiaries as an absolute number and as a share of the total population for each jurisdiction for 2012/13.Footnote 10, Footnote 11 It also reports the number of prescriptions that were accepted for reimbursement.
Figure 2.3 Number of active beneficiaries and associated number of prescriptions in select public drug plans, 2012/13
*Total results for the select public drug plans reported in this figure.
Data sources: National Prescription Drug Utilization Information System Database, Canadian Institute for Health Information;
Statistics Canada, CANSIM Table 051-0001; Non-Insured Health Benefits Program Annual Report, 2011/12.
Figure description
This bar graph describes the number of active beneficiaries, their share of the population, and the associated number of prescriptions for 2012/13 in select public drug plans in Canada.
Table
|
Alberta |
Saskatchewan |
Manitoba |
Ontario |
New Brunswick |
Nova Scotia |
Prince Edward Island |
Non-Insured Health Benefits |
Total select plans |
| Number of active beneficiaries (thousands); share of population (%) |
515.4 (13.3%) |
672.2 (62.2%) |
789.5 (62.3%) |
2,796.4 (20.7%) |
118.6 (15.7%) |
135.5 (14.3%) |
31.6 (21.7%) |
588.8 (69.6%) |
5,654.2 (25.2%) |
| Total number of prescriptions (millions) |
12.5 |
11.8 |
15.1 |
134.3 |
4.9 |
4.4 |
0.8 |
14.5 |
198.3 |
Nearly 5.7 million active beneficiaries had 198.3 million prescriptions accepted towards a deductible or paid for (in full or in part) by the public drug plans. These beneficiaries accounted for a quarter (25.2%) of the total provincial and NIHB client populations.
The variations in the active beneficiary share of the population are related to plan design, with income-based plans in Saskatchewan (62.2%) and Manitoba (62.3%) providing drug coverage for the general population. Other plans that focused their coverage on seniors, income assistance recipients and various patient groups, had a smaller representation of active beneficiaries in the population, ranging from 13.3% to 21.7%. Nevertheless, these provinces also pay a higher share of the prescription cost for their active beneficiaries (Figure 2.2).
The NIHB had the highest participation rate (69.6%), as it provided universal coverage to its clients.
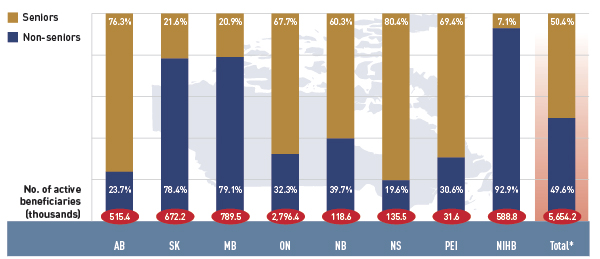
Figure 2.4 reports the shares of non-senior and senior beneficiaries in 2012/13. Overall across the plans there was an almost equal split between non-seniors and seniors, 49.6% and 50.4%, respectively.
Figure 2.4 Shares of non-senior and senior active beneficiaries in select public drug plans, 2012/13
*Total results for the select public drug plans reported in this figure.
Data source: National Prescription Drug Utilization Information System Database, Canadian Institute for Health Information.
Figure description
This bar graph describes the shares of senior and non-senior active beneficiaries for 2012/13 in select public drug plans in Canada.
Table
|
Alberta |
Saskatchewan |
Manitoba |
Ontario |
New Brunswick |
Nova Scotia |
Prince Edward Island |
Non-Insured Health Benefits |
Total select plans |
| Number of active beneficiaries (thousands) |
515.4 |
672.2 |
789.6 |
2,796.4 |
118.6 |
135.5 |
31.6 |
588.8 |
5,654.2 |
| Seniors |
76.3% |
21.6% |
20.9% |
67.7% |
60.3% |
80.4% |
69.4% |
7.1% |
50.4% |
| Non-seniors |
23.7% |
78.4% |
79.1% |
32.3% |
39.7% |
19.6% |
30.6% |
92.9% |
49.6% |
However, there were wide variations in distribution at the jurisdictional level, mainly related to plan design. As discussed, Saskatchewan and Manitoba have income-based plans, and hence, a relatively high non-senior representation (78.4% and 79.1%, respectively).
In other plans, the share of non-senior beneficiaries ranged from 19.6% to 39.7%. In the NIHB, non-seniors accounted for 92.9%, reflecting its unique demographic profile.
Alberta, Nova Scotia and Prince Edward Island do not submit data to NPDUIS for all their sub-plans, so their non-senior shares may be under-represented.
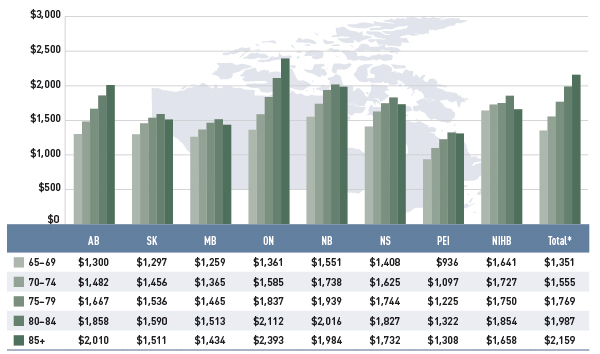
Figure 2.5 reports the annual average prescription drug cost per senior beneficiary in 2012/13, stratified by five-year age bands. Limiting the data to seniors allows for a greater comparability across plans.
Figure 2.5 Average annual prescription drug cost per senior beneficiary, by five-year age bands, select public drug plans, 2012/13
*Total results for the select public drug plans reported in this figure.
Data source: National Prescription Drug Utilization Information System Database, Canadian Institute for Health Information.
Figure description
This bar graph describes the average annual prescription drug cost per senior beneficiary by five-year age bands for 2012/13 in select public drug plans in Canada.
Table
|
Alberta |
Saskatchewan |
Manitoba |
Ontario |
New Brunswick |
Nova Scotia |
Prince Edward Island |
Non-Insured Health Benefits |
Total select plans |
| 65-69 |
$1,300 |
$1,297 |
$1,259 |
$1,361 |
$1,551 |
$1,408 |
$936 |
$1,641 |
$1,351 |
| 70-74 |
$1,482 |
$1,456 |
$1,365 |
$1,585 |
$1,738 |
$1,625 |
$1,097 |
$1,727 |
$1,555 |
| 75-79 |
$1,667 |
$1,536 |
$1,465 |
$1,837 |
$1,939 |
$1,744 |
$1,225 |
$1,750 |
$1,769 |
| 80-84 |
$1,858 |
$1,590 |
$1,513 |
$2,112 |
$2,016 |
$1,827 |
$1,322 |
$1,854 |
$1,987 |
| 85+ |
$2,010 |
$1,511 |
$1,434 |
$2,393 |
$1,984 |
$1,732 |
$1,308 |
$1,658 |
$2,159 |
With a few exceptions, the results show that the annual drug cost for seniors was higher in older age groups. The average drug cost for all plans increased from $1,351 for beneficiaries between 65 and 69 years old to $2,159 for those over 85, as comorbidity and chronic conditions generally increase with age.
There is some jurisdictional variation in the annual drug costs for these age groupings. Reasons for this may include differences in plan design, the disease profile of the population, drug coverage or prescribing patterns.
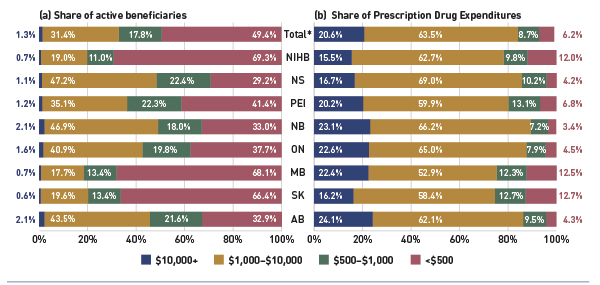
Figure 2.6 shows the distribution of active beneficiaries in the select drug plans in 2012/13 based on their annual prescription cost levels: <$500, $500–$1,000, $1,000–$10,000 and $10,000+. The share of active beneficiaries in each of these groups is presented in Figure 2.6a, with the corresponding share of prescription drug expenditures provided in Figure 2.6b.
Figure 2.6 Share of active beneficiaries and prescription drug expenditures, by annual individual prescription drug cost levels, select public drug plans, 2012/13
*Total results for the select public drug plans reported in this figure.
Note: Values may not add to totals due to rounding.
Data source: National Prescription Drug Utilization Information System Database, Canadian Institute for Health Information.
Figure description
This figure shows two complementary bar graphs side-by-side. The left graph shows the shares of active beneficiaries in 2012/13 by annual prescription drug cost levels in select public drug plans in Canada:
Table
|
$10,000+ |
$1,000–$10,000 |
$500–$1,000 |
<$500 |
| Alberta |
2.1% |
43.5% |
21.6% |
32.9% |
| Saskatchewan |
0.6% |
19.6% |
13.4% |
66.4% |
| Manitoba |
0.7% |
17.7% |
13.4% |
68.1% |
| Ontario |
1.6% |
40.9% |
19.8% |
37.7% |
| New Brunswick |
2.1% |
46.9% |
18.0% |
33.0% |
| Prince Edward Island |
1.2% |
35.1% |
22.3% |
41.4% |
| Nova Scotia |
1.1% |
47.2% |
22.4% |
29.2% |
| Non-Insured Health Benefits |
0.7% |
19.0% |
11.0% |
69.3% |
| Total select plans |
1.3% |
31.4% |
17.8% |
49.4% |
The results show that high-cost beneficiaries with $10,000 or more in annual prescription costs represented a small proportion of the active beneficiaries, ranging from 0.6% to 2.1% depending on the plan. However, they accounted for a disproportionate share of expenditures, ranging from 15.5% to 24.1% across the public drug plans. These high-cost beneficiaries are more likely to have chronic conditions, comorbiditiesFootnote 12 or require treatment with expensive therapies such as biologics.
Conversely, those with annual treatment costs under $1,000 represented the majority of active beneficiaries in most plans, ranging from 51.0% 81.5%. These beneficiaries accounted for a relatively low share of prescription drug expenditures, ranging from 10.6% to 25.4% of the total for 2012/13.
3 Trends in Prescription Drug Expenditures, 2008/09 to 2012/13
A review of the recent trends in prescription drug expenditure and its components (Figures 3.1 to 3.3) suggests that not only have the rates of change in drug costs diminished in recent years, but they actually have negative values for most of the select public drug plans in 2012/13.
The beneficiary-level analysis (Figures 3.4 and 3.5) indicates that this trend was supported by a reduction in the average costs for the senior population. However, the analysis also reveals increases in the average costs for non-seniors and a growth in the high-cost claimant population.
Due to the lack of available data, a limited number of years are reported for Ontario (2010/11 to 2012/13) and the NIHB (2011/12 to 2012/13). The prescription drug expenditures reported include the drug costs, dispensing fees and pharmacy markups, where applicable.
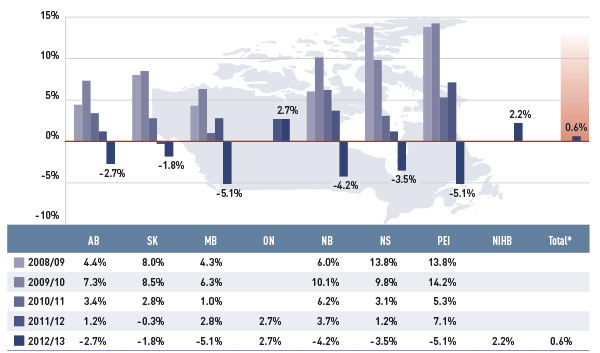
Figure 3.1 reports the annual rates of change in prescription drug expenditures from fiscal years 2008/09 to 2012/13. Growth has slowed considerably in recent years, with low positive or negative rates of change in most public plans.
Figure 3.1 Annual rates of change in prescription drug expenditures, select public drug plans, 2008/09 to 2012/13
*Total results for the select public drug plans reported in this figure.
Data source: National Prescription Drug Utilization Information System Database, Canadian Institute for Health Information.
Figure description
This bar graph shows the trend in annual rates of change in prescription drug expenditures from 2008/09 to 2012/13 for select public drug plans in Canada.
Table
|
Alberta |
Saskatchewan |
Manitoba |
Ontario |
New Brunswick |
Nova Scotia |
Prince Edward Island |
Non-Insured Health Benefits |
Total select plans |
| 2008/09 |
4.4% |
8.0% |
4.3% |
– |
6.0% |
13.8% |
13.8% |
– |
– |
| 2009/10 |
7.3% |
8.5% |
6.3% |
– |
10.1% |
9.8% |
14.2% |
– |
– |
| 2010/11 |
3.4% |
2.8% |
1.0% |
– |
6.2% |
3.1% |
5.3% |
– |
– |
| 2011/12 |
1.2% |
-0.3% |
2.8% |
2.7% |
3.7% |
1.2% |
7.1% |
– |
– |
| 2012/13 |
-2.7% |
-1.8% |
-5.1% |
2.7% |
-4.2% |
-3.5% |
-5.1% |
2.2% |
0.6% |
In 2012/13, the rates of change averaged 0.6% for the select public drug plans. For most plans (except Ontario and NIHB), these rates have dipped into negative values, ranging from –5.1% in Manitoba and Prince Edward Island to –1.8% in Saskatchewan. Ontario and NIHB’s rate of growth were a modest 2.7% and 2.2%, respectively.
A number of factors drive the change in prescription drug expenditures, such as demographic, volume, price and drug-mix effects. These are discussed in detail in Sections 4 and 5, with a focus on the rates of change from 2011/12 to 2012/13.
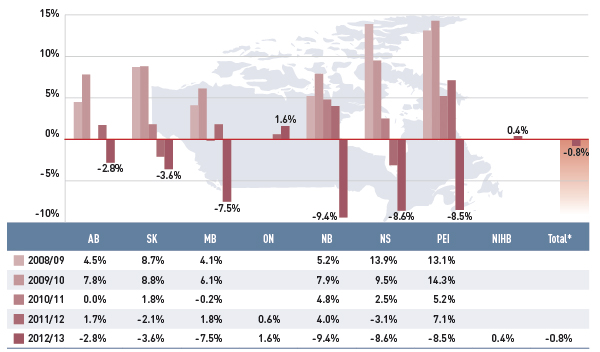
Figure 3.2 reports the annual rates of change in drug cost, which is the largest component of prescription expenditure (74.4% in 2012/13, see Figure 2.1).
Figure 3.2 Annual rates of change in drug costs, select public drug plans, 2008/09 to 2012/13
*Total results for the select public drug plans reported in this figure.
Data source: National Prescription Drug Utilization Information System Database, Canadian Institute for Health Information.
Figure description
This bar graph shows the trend in annual rates of change in drug costs from 2008/09 to 2012/13 for select public drug plans in Canada.
Table
|
Alberta |
Saskatchewan |
Manitoba |
Ontario |
New Brunswick |
Nova Scotia |
Prince Edward Island |
Non-Insured Health Benefits |
Total select plans |
| 2008/09 |
4.5% |
8.7% |
4.1% |
– |
5.2% |
13.9% |
13.1% |
– |
– |
| 2009/10 |
7.8% |
8.8% |
6.1% |
– |
7.9% |
9.5% |
14.3% |
– |
– |
| 2010/11 |
0.0% |
1.8% |
0.2% |
– |
4.8% |
2.5% |
5.2% |
– |
– |
| 2011/12 |
1.7% |
-2.1% |
1.8% |
0.6% |
4.0% |
-3.1% |
7.1% |
– |
– |
| 2012/13 |
-2.8% |
-3.6% |
-7.5% |
1.6% |
-9.4% |
-8.6% |
-8.5% |
0.4% |
-0.8% |
While the overall drug cost dropped by only 0.8% in 2012/13, some plans saw significant reductions over the past years. For instance, the rate of change in Nova Scotia and Prince Edward Island dropped from 13.9% and 13.1%, respectively, in 2008/09 to –8.6% and –8.5% in 2012/13. New Brunswick had the greatest decrease in drug cost in 2012/13, with a 9.4% reduction. Drug cost also fell markedly in Manitoba (–7.5%), followed by the other two western provinces, Saskatchewan at –3.6% and Alberta at –2.8%.
Ontario and NIHB’s rate of change in drug cost in 2012/13 were a modest 1.6% and 0.4%, respectively.
While these rates of change have provided a much needed break for drug plan budgets from the higher rates of growth in prior years, the results are driven by ample opposing “push” (positive) effects and “pull” (negative) effects which nearly off-set each other. Section 4 provides a detailed analysis of the factors that drove drug costs from 2011/12 to 2012/13.
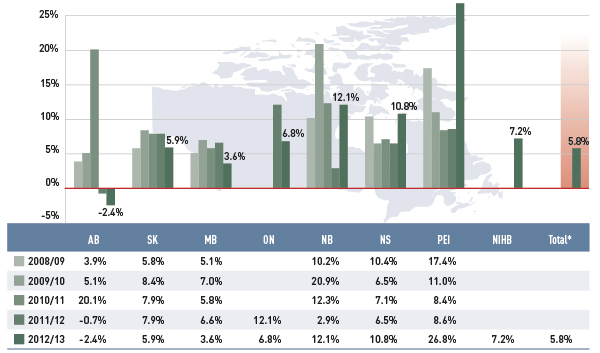
Figure 3.3 reports the annual rates of change in the dispensing fee component of the prescription cost. These rates tell a different story than that of the overall prescription cost reported in Figure 3.1.
Figure 3.3 Annual rates of change in dispensing fee expenditures, select public drug plans, 2008/09 to 2012/13
*Total results for the select public drug plans reported in this figure.
Data source: National Prescription Drug Utilization Information System Database, Canadian Institute for Health Information.
Figure description
This bar graph shows the trend in annual rates of change in dispensing fee expenditures from 2008/09 to 2012/13 for select public drug plans in Canada.
Table
|
Alberta |
Saskatchewan |
Manitoba |
Ontario |
New Brunswick |
Nova Scotia |
Prince Edward Island |
Non-Insured Health Benefits |
Total select plans |
| 2008/09 |
3.9% |
5.8% |
5.1% |
– |
10.2% |
10.4% |
17.4% |
– |
– |
| 2009/10 |
5.1% |
8.4% |
7.0% |
– |
20.9% |
6.5% |
11.0% |
– |
– |
| 2010/11 |
20.1% |
7.9% |
5.8% |
– |
12.3% |
7.1% |
8.4% |
– |
– |
| 2011/12 |
-0.7% |
7.9% |
6.6% |
12.1% |
2.9% |
6.5% |
8.6% |
– |
– |
| 2012/13 |
-2.4% |
5.9% |
3.6% |
6.8% |
12.1% |
10.8% |
26.8% |
7.2% |
5.8% |
Unlike drug costs, dispensing fee expenditures grew in recent years in most public drug plans. In 2012/13, the average total rate of change was 5.8%. The rates were highest in the eastern provinces, ranging from 26.8% in Prince Edward Island to 12.1% and 10.8% in New Brunswick and Nova Scotia, respectively.
Manitoba, Saskatchewan and Ontario had more moderate rates of growth in dispensing fee expenditures, ranging from 3.6% to 6.8%. Alberta was the only province with negative rates of change during the last two fiscal years (–2.4% in 2012/13 and –0.7% in 2011/12). This followed an increase of 20.1% in 2010.
Jurisdictional variations are driven by changes in the dispensing fees or the volume of prescriptions reimbursed by each plan. The results do not reflect fees for professional pharmacy services other than the dispensing of medications.
Section 5 provides a detailed analysis of the factors that impacted dispensing fee expenditures from 2011/12 to 2012/13.
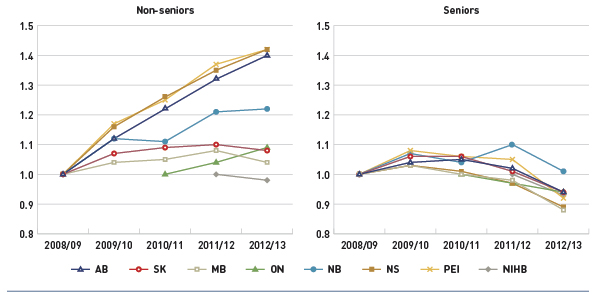
Figure 3.4 reports on trends in the average annual prescription cost per active beneficiary for non-seniors and seniors from 2008/09 to 2012/13. An index was used to equate the average annual cost in each plan and for each patient group for the base year 2008/09 to the value of 1. The values for the subsequent years were then calculated relative to the base year.
Figure 3.4 Index of the average annual prescription cost per beneficiary, non-seniors and seniors, select public drug plans, 2008/09 to 2012/13
Data source: National Prescription Drug Utilization Information System Database, Canadian Institute for Health Information.
Figure description
This figure shows two complementary line graphs side-by-side. Using an index, the left graph describes the change over 5 years of the annual prescription cost per beneficiary for non-seniors, in select Canadian public drug plans:
Table
|
2008/09 |
2009/10 |
2010/11 |
2011/12 |
2012/13 |
| Alberta |
1.00 |
1.12 |
1.22 |
1.32 |
1.40 |
| Saskatchewan |
1.00 |
1.07 |
1.09 |
1.10 |
1.08 |
| Manitoba |
1.00 |
1.04 |
1.05 |
1.08 |
1.04 |
| Ontario |
– |
– |
1.00 |
1.04 |
1.09 |
| New Brunswick |
1.00 |
1.12 |
1.11 |
1.21 |
1.22 |
| Nova Scotia |
1.00 |
1.16 |
1.26 |
1.35 |
1.42 |
| Prince Edward Island |
1.00 |
1.17 |
1.25 |
1.37 |
1.42 |
| Non-Insured Health Benefits |
– |
– |
– |
1.00 |
0.98 |
The right graph shows the same index for seniors:
Table
|
2008/09 |
2009/10 |
2010/11 |
2011/12 |
2012/13 |
| Alberta |
1.00 |
1.04 |
1.05 |
1.02 |
0.94 |
| Saskatchewan |
1.00 |
1.06 |
1.06 |
1.01 |
0.94 |
| Manitoba |
1.00 |
1.03 |
1.00 |
0.98 |
0.88 |
| Ontario |
– |
– |
1.00 |
0.97 |
0.94 |
| New Brunswick |
1.00 |
1.07 |
1.04 |
1.10 |
1.01 |
| Nova Scotia |
1.00 |
1.03 |
1.01 |
0.97 |
0.89 |
| Prince Edward Island |
1.00 |
1.08 |
1.06 |
1.05 |
0.92 |
| Non-Insured Health Benefits |
– |
– |
– |
1.00 |
0.95 |
Due to a lack of available data, the index for Ontario starts with 2010/11 and the NIHB starts with 2011/12.
Note that the average prescription cost level varied across plans, as reported in Figure 2.5 for the senior population.
The results indicate that the annual cost of drug treatment for senior beneficiaries has been declining, mainly due to their high utilization rates of drugs that benefited from generic launches and generic pricing policies.
In contrast, the cost to treat non-senior patients rose rapidly for several public drug plans. This may be due to the increased use of high-cost drugs, such as biologics, and the introduction of new sub-plans in several jurisdictions that expanded drug coverage to non-seniors (e.g., Nova Scotia’s Family Pharmacare Program, launched in March 2008). The plans in Saskatchewan, Manitoba and the NIHB, which provide coverage to a general population, had a decline in the average annual prescription cost for non-seniors.
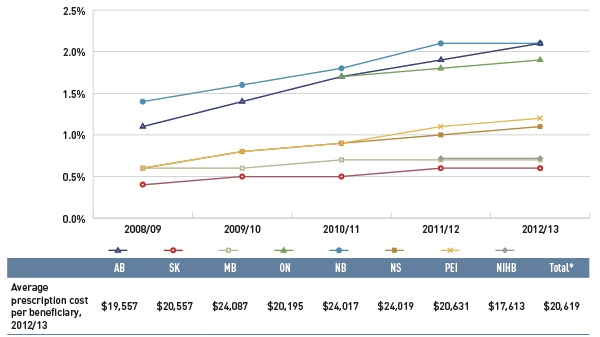
Figure 3.5 reports on trends in the share of high-cost beneficiaries, whose annual prescription drug cost exceeded $10,000. The results indicate that although the proportion of these patients was relatively small (≤2.1%, see Figure 2.6), it has been on the rise in all public drug plans from 2008/09 to 2012/13.
Figure 3.5 Share of patients with $10,000+ in annual prescription drug costs, select public drug plans, 2008/09 to 2012/13
*Total results for the select public drug plans reported in this figure.
Data source: National Prescription Drug Utilization Information System Database, Canadian Institute for Health Information.
Figure description
This figure gives the share of patients with more than $10,000 in annual prescription drug costs in Canadian public drug plans from 2008/09 to 2012/13. An associated table lists the average prescription costs per beneficiary in 2012/13 for all of the plans.
The share of patients is as follows:
Table
|
Alberta |
Saskatchewan |
Manitoba |
Ontario |
New Brunswick |
Nova Scotia |
Prince Edward Island |
Non-Insured Health Benefits |
Total select plans |
| 2008/09 |
1.1% |
0.4% |
0.6% |
– |
1.4% |
0.6% |
0.6% |
– |
– |
| 2009/10 |
1.4% |
0.5% |
0.6% |
– |
1.6% |
0.8% |
0.8% |
– |
– |
| 2010/11 |
1.7% |
0.5% |
0.7% |
1.7% |
1.8% |
0.9% |
0.9% |
– |
– |
| 2011/12 |
1.9% |
0.6% |
0.7% |
1.8% |
2.1% |
1.0% |
1.1% |
0.7% |
1.5% |
| 2012/13 |
2.1% |
0.6% |
0.7% |
1.9% |
2.1% |
1.1% |
1.2% |
0.7% |
1.6% |
The average prescription cost per beneficiary in 2012/13 was Alberta: $19,557; Saskatchewan: $20,557; Manitoba: 24,087; Ontario: $20,195; New Brunswick: $24,017; Nova Scotia: $24,019; Prince Edward Island: $20,631; Non-Insured Health Benefits: $17,613; total select plans: $20,619.
In 2012/13, the average annual prescription cost per beneficiary for this group ranged from $17,613 in the NIHB to just over $24,000 in Manitoba, New Brunswick and Nova Scotia.
4 The Drivers of Drug Costs, 2011/12 to 2012/13
Changes in drug cost are driven by a number of opposing “push” and “pull” effects. The increase in the beneficiary population, the use of drugs, and the use of more expensive drugs put an upward pressure on costs, resulting in a push effect; while generic substitutions and price reductions exerted a downward pull effect. The net effect of these opposing forces yields the overall rate of change.
In any given year and market segment, the weight of each of these effects may vary, and as a result, the rates of change in drug cost evolve over time and vary across public drug plans.
This section of the NPDUIS CompassRx report provides a comprehensive cost driver analysis that points toward the most important cost pressures, measures their impact on drug cost levels and delves into the factors determining trends in costs, pricing and utilization in public plans.
This edition of the report focuses on the rates of change in drug expenditures for the select drug plans over the fiscal years 2011/12 to 2012/13. Four broad categories of effects are analyzed along with their corresponding sub-effects:
Price Effects
- Price change effect – changes in the prices of both brand-name and generic drugs
- Generic substitution effect – shifts from brand-name to generic drugs
Demographic Effects
- Population effect – changes in the number of active beneficiaries
- Aging effect – shifts in the distribution of the population across age groups
- Gender effect – shifts in the distribution of the population by gender
Volume Effects
- Prescription volume effect – changes in the number of prescriptions dispensed to patients
- Prescription size effect – changes in the average number of units of a drug dispensed per prescription
- Strength-form effect – shifts in the use of various strengths or forms of an ingredient
Drug-Mix Effects
- Existing drug effect – shifts in the use of drugs available in both 2011/12 and 2012/13
- Entering drug effect – shifts in use of drugs that entered the market in 2012/13
- Exiting drug effect – shifts in the use of drugs that exited the market in 2012/13
Each of these effects was determined by assuming that all the other effects remained constant over the periods analyzed. The results provide an answer to the following question:
How much would public plan drug cost have changed between 2011/12 and 2012/13 if only one factor (e.g., the price of drugs) changed while all the others remained the same?
In reality, multiple factors change simultaneously, creating a residual or a cross effect, which is also reported to account for the total change.
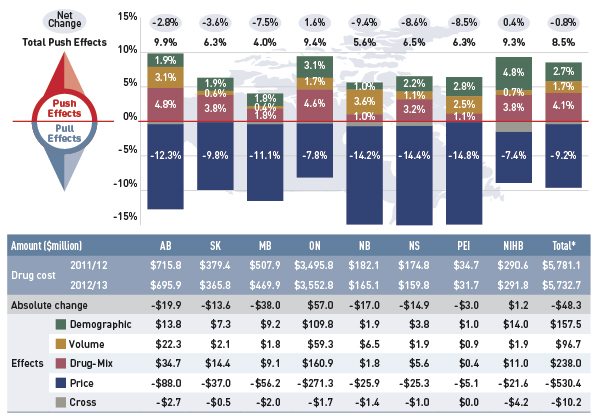
Figure 4.1 reports the rate of change in drug cost for the select public drug plans over the fiscal years 2011/12 to 2012/13 disaggregated into the four broad categories of effects. The bar graph and the associated table show the impacts of each effect as a percent and absolute change in drug cost, respectively.
Figure 4.1 Rates of change in drug cost by demographic, volume, price and drug-mix effects, select public drug plans, 2011/12 to 2012/13
*Total results for the select public drug plans reported in this figure.
Note: Values may not add to totals due to rounding.
Data source: National Prescription Drug Utilization Information System Database, Canadian Institute for Health Information.
Figure description
This figure and table describe the factors that impacted the rates of change in drug cost in select public drug plans in Canada from 2011/12 to 2012/13.
This table shows the % change for each factor:
Table
|
Alberta |
Saskatchewan |
Manitoba |
Ontario |
New Brunswick |
Nova Scotia |
Prince Edward Island |
Non-Insured Health Benefits |
Total select plans |
| Net Change |
-2.8% |
-3.6% |
-7.5% |
1.6% |
-9.4% |
-8.6% |
-8.5% |
0.4% |
-0.8% |
| Total Push Effects |
9.9% |
6.3% |
4.0% |
9.4% |
5.6% |
6.5% |
6.3% |
9.3% |
8.5% |
| Demographic Effect |
1.9% |
1.9% |
1.8% |
3.1% |
1.0% |
2.2% |
2.8% |
4.8% |
2.7% |
| Volume Effect |
3.1% |
0.6% |
0.4% |
1.7% |
3.6% |
1.1% |
2.5% |
0.7% |
1.7% |
| Drug-Mix Effect |
4.8% |
3.8% |
1.8% |
4.6% |
1.0% |
3.2% |
1.1% |
3.8% |
4.1% |
| Price Effects |
-12.3% |
-9.8% |
-11.1% |
-7.8% |
-14.2% |
-14.4% |
-14.8% |
-7.4% |
-9.2% |
This table shows similar changes in the dollar amounts ($millions):
Table
|
Alberta |
Saskatchewan |
Manitoba |
Ontario |
New Brunswick |
Nova Scotia |
Prince Edward Island |
Non-Insured Health Benefits |
Total select plans |
| Drug Cost 2011/12 |
$715.8 |
$379.4 |
$507.9 |
$3,495.8 |
$182.1 |
$174.8 |
$34.7 |
$290.6 |
$5,781.1 |
| Drug Cost 2012/13 |
$695.9 |
$365.8 |
$469.9 |
$3,552.8 |
$165.1 |
$159.8 |
$31.7 |
$291.8 |
$5,732.7 |
| Absolute Change |
-$19.9 |
-$13.6 |
-$38.0 |
$57.0 |
-$17.0 |
-$14.9 |
-$3.0 |
$1.2 |
-$48.3 |
| Demographic Effect |
$13.8 |
$7.3 |
$9.2 |
$109.8 |
$1.9 |
$3.8 |
$1.0 |
$14.0 |
$157.5 |
| Volume Effect |
$22.3 |
$2.1 |
$1.8 |
$59.3 |
$6.5 |
$1.9 |
$0.9 |
$1.9 |
$96.7 |
| Drug-Mix Effect |
$34.7 |
$14.4 |
$9.1 |
$160.9 |
$1.8 |
$5.6 |
$0.4 |
$11.0 |
$238.0 |
| Price Effect |
-$88.0 |
-$37.0 |
-$56.2 |
-$271.3 |
-$25.9 |
-$25.3 |
-$5.1 |
-$21.6 |
-$530.4 |
| Cross Effect |
-$2.7 |
-0.5 |
-$2.0 |
-$1.7 |
-$1.4 |
-$1.0 |
$0.0 |
-$4.2 |
-$10.2 |
The overall rate of change across all plans was –0.8% (or –$48.3 million in absolute terms). The low rates of net change in public plans were driven by ample opposing “push” (increasing) effects and “pull” (decreasing) effects which nearly off-set each other.
Price effects had the greatest “pull” on drug cost levels, with the implementation of generic price reductions and generic substitutions resulting in significant savings to the public plans. If all other factors had remained unchanged, the reduction in drug prices along with the shift from higher-cost brand-name products to lower-cost generic products would have reduced the drug costs in 2012/13 by an average of 9.2% ($530.4 million).
Conversely, demographic, volume, and drug-mix effects had a large “push” effect, increasing drug cost levels. This push effect offset most or all of the cost savings resulting from generic substitution and price reduction. Without the influence of price effects, the combined effect of increases in the active beneficiary populations, in the volume of drugs used and in the use of more expensive drugs would have raised the drug cost levels in 2012/13 by an average of 8.5% ($492.2 million).
Individually, the demographic, volume and drug-mix effects pushed the drug cost levels upwards in 2012/13 by 2.7% ($157.5 million), 1.7% ($96.7 million) and 4.1% ($238.0 million), respectively. The combined cross effect of the individual effects was -0.2% (-$10.2 million).
In the following sections, each of the broad categories of effects is examined in more detail.
4.1 Price Effects
The general category of price effects can be further broken down to capture the precise impact of the price change and generic substitution effects. These effects had a marked pull effect on drug cost levels in 2012/13, resulting in significant cost savings to the public drug plans.
Price Change Effect
This effect captures the impact of changes in drug prices and is determined at the strength, form and brand-name or generic level. It can have either a positive (increasing) or negative (decreasing) impact on drug costs if brand prices increase or generic prices decrease, respectively. For instance, the recent generic price reforms that resulted in lower prices would translate into a negative price change effect on drug costs. In this analysis, drug prices are measured as the average unit cost accepted for reimbursement.
Generic Substitution Effect
This effect captures the impact of shifts in utilization from higher-cost brand-name products to lower-cost generic products and has a negative (decreasing) impact on drug costs.
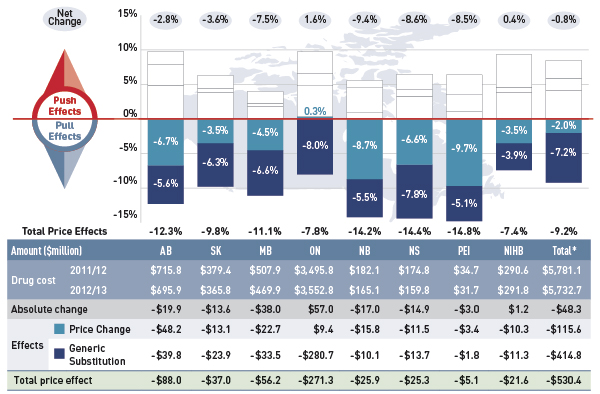
Figure 4.1.1 reports the rate of change in drug cost from 2011/12 to 2012/13 focussing on the two price effects: price change and generic substitution. The bar graph and accompanying table show the year-over-year impacts of each effect as a relative and absolute change in drug cost.
Figure 4.1.1 Rates of change in drug costs due to price effects, select public drug plans, 2011/12 to 2012/13
*Total results for the select public drug plans reported in this figure.
Note: Values may not add to totals due to rounding.
Data source: National Prescription Drug Utilization Information System Database, Canadian Institute for Health Information.
Figure description
This figure describes the factors that impacted the rates of change in drug cost due to price effects in select public drug plans in Canada from 2011/12 to 2012/13. It is composed of a bar graph with a table underneath. The bar graph shows the percent change from 2011/12 to 2012/13 for each public drug plan. The results are as follows:
Table
|
Alberta |
Saskatchewan |
Manitoba |
Ontario |
New Brunswick |
Nova Scotia |
Prince Edward Island |
Non-Insured Health Benefits |
Total select plans |
| Net change |
-2.8% |
-3.6% |
-7.5% |
1.6% |
-9.4% |
-8.6% |
-8.5% |
0.4% |
-0.8% |
| Total price effects |
-12.3% |
-9.8% |
-11.1% |
-7.8% |
-14.2% |
-14.4% |
-14.8% |
-7.4% |
-9.2% |
| Price change effect |
-6.7% |
-3.5% |
-4.5% |
0.3% |
-8.7% |
-6.6% |
-9.7% |
-3.5% |
-2.0% |
| Generic substitution effect |
-5.6% |
-6.3% |
-6.6% |
-8.0% |
-5.5% |
-7.8% |
-5.1% |
-3.9% |
-7.2% |
The table below the bar graph gives the corresponding changes in millions of dollars.
Table
|
Alberta |
Saskatchewan |
Manitoba |
Ontario |
New Brunswick |
Nova Scotia |
Prince Edward Island |
Non-Insured Health Benefits |
Total select plans |
| Drug cost 2011/12 |
$715.8 |
$379.4 |
$507.9 |
$3,495.8 |
$182.1 |
$174.8 |
$34.7 |
$290.6 |
$5,781.1 |
| Drug cost 2012/13 |
$695.9 |
$365.8 |
$469.9 |
$3,552.8 |
$165.1 |
$159.8 |
$31.7 |
$291.8 |
$5,732.7 |
| Absolute change |
-$19.9 |
-$13.6 |
-$38.0 |
$57.0 |
-$17.0 |
-$14.9 |
-$3.0 |
$1.2 |
-$48.3 |
| Price change effect |
-$48.2 |
-$13.1 |
-$22.7 |
$9.4 |
-$15.8 |
-$11.5 |
-$3.4 |
-$10.3 |
-$115.6 |
| Generic substitution effect |
-$39.8 |
-$23.9 |
-$33.5 |
-$280.7 |
-$10.1 |
-$13.7 |
-$1.8 |
-$11.3 |
-$414.8 |
| Total price effect |
-$88.0 |
-$37.0 |
-$56.2 |
-$271.3 |
-$25.9 |
-$25.3 |
-$5.1 |
-$21.6 |
-$530.4 |
The 2.0% decline in overall drug cost levels in 2012/13 was largely a result of generic price reforms (Appendix B). Variations in the impact of the price change effect across plans are due to differences in the timing of the generic reforms and the magnitude of price reductions, as well as the utilization rates for generic drugs.
Most plans reduced the price of generic drugs to 35% of the equivalent brand-name in 2012/13, which resulted in a pull-down effect on costs ranging from 3.5% to 9.7%.
Ontario had already implemented generic price reforms in 2010, reducing the generic price levels to 25% of the reference brand-name level. The savings generated by these earlier reductions were realized by 2011/12. With virtually constant generic price levels in 2012/13, the price change effect for Ontario was a positive 0.3%.
Generic substitution or the shift in use from brand-name drugs to less expensive generic drugs resulted in an average 7.2% reduction in drug costs across the select public plans in 2012/13. This is a result of the trend commonly referred to as the ‘patent cliff’, in which a number of top-selling brand-name drugs have reached the end of their patent life and are subject to generic competition for the first time.
The impact of this effect is more comparable across plans, as generic substitutes became available to all jurisdictions at approximately the same time. The small jurisdictional variations may be due to the specific disease profiles and demographic profiles of the eligible populations as well as the utilization rates of the newly genericized drugs.
The additional figures in this section provide supporting statistics on price indices, the generic share of prescriptions and drug costs, and generic savings for the select public plans.
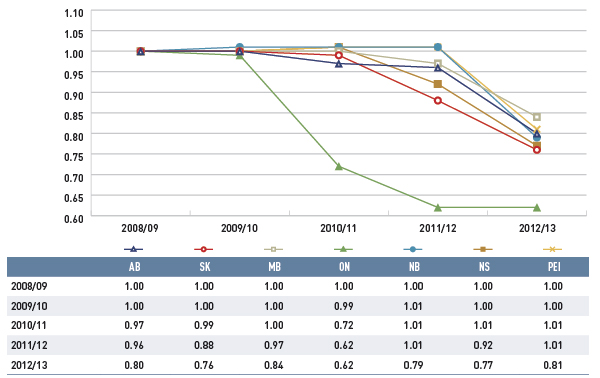
Figure 4.1.2 reports the trend in the average unit cost for generic drugs from 2008/09 to 2012/13 as an index.
Figure 4.1.2 Average unit cost index for generic drugs, select public drug plans, 2008/09 to 2012/13
Note: The average unit cost reimbursed was used to calculate the index. The analysis was limited to oral solid formulations.
Data source: National Prescription Drug Utilization Information System Database, Canadian Institute for Health Information; PMPRB DIN-level database.
Figure description
This line graph describes the change over five years (from 2008/09 to 2012/13) in the average unit cost for generic drugs in select Canadian public drug plans. The results are shown as an index. There was a rapid decline in drug prices for Ontario starting in 2010/11, and a more gradual decline starting in 2012/13 for other plans.
Table
|
2008/09 |
2009/10 |
2010/11 |
2011/12 |
2012/13 |
| Alberta |
1.00 |
1.00 |
0.97 |
0.96 |
0.80 |
| Saskatchewan |
1.00 |
1.00 |
0.99 |
0.88 |
0.76 |
| Manitoba |
1.00 |
1.00 |
1.00 |
0.97 |
0.84 |
| Ontario |
1.00 |
0.99 |
0.72 |
0.62 |
0.62 |
| New Brunswick |
1.00 |
1.01 |
1.01 |
1.01 |
0.79 |
| Nova Scotia |
1.00 |
1.00 |
1.01 |
0.92 |
0.77 |
| Prince Edward Island |
1.00 |
1.00 |
1.01 |
1.01 |
0.81 |
The price change effect is for the most part the result of a reduction in the average unit cost reimbursed for generics drugs, as the prices of brand-name drugs have been relatively stable over the past five years.
The index is calculated using the cost-weighted average of the average unit cost changes at the individual drug level. This approach is similar to the one used by Statistics Canada to calculate the Consumer Price Index. This analysis was restricted to oral solid formulations to ensure unit reporting consistency.
The results show a rapid decline in generic drug prices for Ontario starting in 2010/11, and a more gradual decline in 2012/13 for the other plans. These changes reflect the timing of the introduction of the generic price reforms (see Appendix B). The average generic price reductions ranged in recent years from 38% to 16%, depending on the province.
Note that NIHB data was not available for this time frame.
Figure 4.1.3 reports on trends in the generic share of total prescriptions and drug costs from 2008/09 to 2012/13.
Figure 4.1.3 Generic drug share of prescriptions and drug cost, select public drug plans, 2008/09 to 2012/13
*Total results for the select public drug plans reported in this figure.
Data source: National Prescription Drug Utilization Information System Database, Canadian Institute for Health Information.
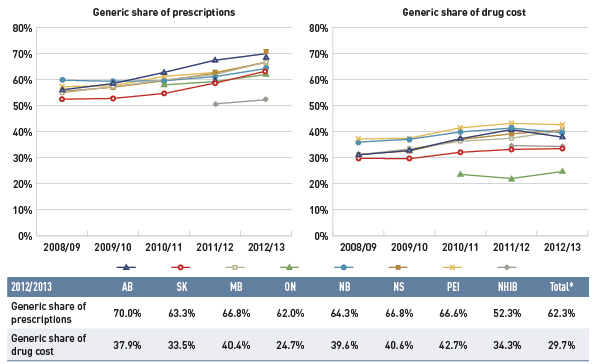
Figure description
This figure shows two complementary line graphs side-by-side.
The left graph shows the generic share of prescriptions from 2008/09 to 2012/13 for select public drug plans in Canada. The results show a marked increase for all public drug plans from around 55% in 2008/09 to 65% in 2012/13.
The right graph shows the generic share of drug costs for the same period and plans. This graph also shows an increasing trend, although less pronounced because generic price reductions occurred at the same time.
A table below the figure shows the generic shares of prescriptions and drug costs for 2012/13 (%).
Table
|
Alberta |
Saskatchewan |
Manitoba |
Ontario |
New Brunswick |
Nova Scotia |
Prince Edward Island |
Non-Insured Health Benefits |
Total select plans |
| Generic share of prescriptions |
70.0% |
63.3% |
66.8% |
62.0% |
64.3% |
66.8% |
66.6% |
52.3% |
62.3% |
| Generic share of drug cost |
37.9% |
33.5% |
40.4% |
24.7% |
39.6% |
40.6% |
42.7% |
34.3% |
29.7% |
The large negative effect of generic substitution on drug costs is the result of the increased market capture of generic drugs.
The results show a marked increase in the generic share of prescriptions across the public drug plans: from 52.5%–59.8% in 2008/09, and from 62.0% (ON) to 70.0% (AB) in 2012/13. The generic share of the market in 2012/13 was lowest in the NIHB, at 52.3%.
The shift in the generic share of drug costs was less pronounced because the generic price reductions occurred at the same time in all jurisdictions.
The generic share of drug costs in 2012/13 ranged from 33.5% to 42.7% across the plans, except in Ontario where it was 24.7%. This was mainly due to the relatively low generic prices available in Ontario at that time, as well as the lower utilization rates for generics compared to the other plans.
Differences in generic market shares across Canada are driven by many factors, including, but not limited to, the disease profile of the population, prescribing practises, coverage of brand products and generic price levels.
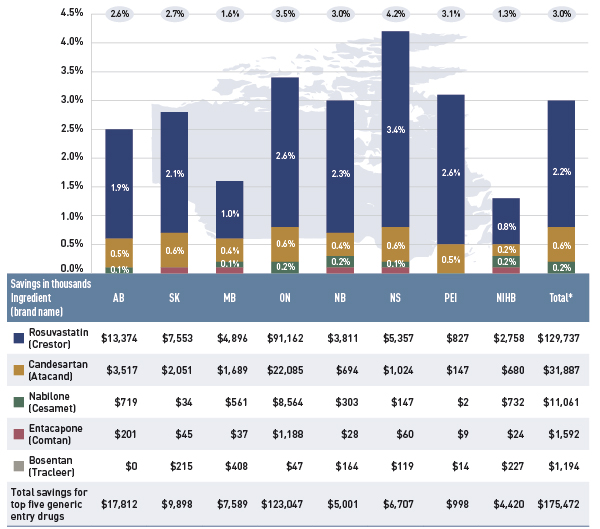
Figure 4.1.4 identifies the top five newly genericized drugs in 2012/13 and reports on their savings in the select public plans. Generic savings were calculated by subtracting the 2012/13 actual drug cost for the five generics from an estimate of the cost of the corresponding brand products, if their market exclusivity was retained. Savings are reported in absolute terms (thousands) and as a percentage of the total drug expenditure for 2012/13.
Figure 4.1.4 Savings for top five generic entry drugs 2012/13, select public drug plans (% of total drug expenditure, $thousand)
*Total results for the select public drug plans reported in this figure.
Note: Values may not add to totals due to rounding.
Data source: National Prescription Drug Utilization Information System Database, Canadian Institute for Health Information.
Figure description
This figure composed of a bar graph and an associated table provides estimates of the savings from the top generic entrants in 2012/13 for select public drug plans in Canada.
The bar graph shows the percent savings for each public plan.
Table
|
Alberta |
Saskatchewan |
Manitoba |
Ontario |
New Brunswick |
Nova Scotia |
Prince Edward Island |
Non-Insured Health Benefits |
Total select plans |
| Rosvustatin (Crestor) |
1.9% |
2.1% |
1.0% |
2.6% |
2.3% |
3.4% |
2.6% |
0.8% |
2.2% |
| Candesartan (Atacand) |
0.5% |
0.6% |
0.4% |
0.6% |
0.4% |
0.6% |
0.5% |
0.2% |
0.6% |
| Nabilone (Cesamet) |
0.1% |
0.0% |
0.1% |
0.2% |
0.2% |
0.1% |
0.0% |
0.2% |
0.2% |
| Entacapone (Comtan) |
0.0% |
0.0% |
0.0% |
0.0% |
0.0% |
0.0% |
0.0% |
0.0% |
0.0% |
| Bosentan (Tracleer) |
0.0% |
0.1% |
0.1% |
0.0% |
0.1% |
0.1% |
0.0% |
0.1% |
0.0% |
| Total savings for top five generic entry drugs |
2.6% |
2.7% |
1.6% |
3.5% |
3.0% |
4.2% |
3.1% |
1.3% |
3.0% |
The table below shows the monitory savings in thousands of dollars.
Table
|
Alberta |
Saskatchewan |
Manitoba |
Ontario |
New Brunswick |
Nova Scotia |
Prince Edward Island |
Non-Insured Health Benefits |
Total select plans |
| Rosvustatin (Crestor) |
$13,374 |
$7,553 |
$4,896 |
$91,162 |
$3,811 |
$5,357 |
$827 |
$2,758 |
$129,737 |
| Candesartan (Atacand) |
$3,517 |
$2,051 |
$1,689 |
$22,085 |
$694 |
$1,024 |
$147 |
$680 |
$31,887 |
| Nabilone (Cesamet) |
$719 |
$34 |
$561 |
$8,564 |
$303 |
$147 |
$2 |
$732 |
$11,061 |
| Entacapone (Comtan) |
$201 |
$45 |
$37 |
$1,188 |
$28 |
$60 |
$9 |
$24 |
$1,592 |
| Bosentan (Tracleer) |
$0 |
$215 |
$408 |
$47 |
$164 |
$119 |
$14 |
$227 |
$1,194 |
| Total savings for top five generic entry drugs |
$17,812 |
$9,898 |
$7,589 |
$123,047 |
$5,001 |
$6,707 |
$998 |
$4,420 |
$175,472 |
The results suggest that the plans saved an estimated $175.5 million or 3.0% of the total drug expenditure in 2012/13 as a result of the generic entry of the five top generic drugs. Most of the savings resulted from the generic entry of the lipid modifying agent rosuvastatin (Crestor), estimated at $129.7 million or 2.2% of the total drug expenditure. Generic entry of the antihypertensive drug candesartan (Atacand) saved the plans an estimated $31.9 million (0.6%), while the generic entry of the antiemetic nabilone (Cesamet) resulted in savings of approximately $11.1 million (0.2%) in 2012/13.
Differences in savings across the public drug plans were the result of the timing of generic entry or formulary listing, the level of generic price discount and the utilization rate for the drug in the active beneficiary population. (See Appendix G for a list of the 100 top-selling multi-source generic drugs).
4.2 Demographic Effects
The demographic effects are composed of the following individual effects:
Population Effect
- This effect captures the extent to which a change in the active beneficiary population contributes to a change in drug costs. Note that in the public drug plan population this effect may also capture an aging component, as people become eligible for coverage when they become seniors.
Aging Effect
- This effect captures the impact of changes in the distribution of the population by age groups. An older population is generally associated with increased drug use and cost (Figure 2.5). Therefore, population shifts toward an older or a younger population may slightly increase or decrease drug expenditures, respectively.
Gender Effect
- This effect captures the impact of changes in the gender split in the population. Unless major changes occur, this effect is expected to be minimal.
Figure 4.2.1 reports the rate of change in drug cost for the select public drug plans from 2011/12 to 2012/13 focussing on the three demographic effects: population, aging and gender. The bar graph and the associated table below show the year-over-year impacts of each effect as a relative and absolute change in drug cost.
Figure 4.2.1 Rates of change in drug costs due to demographic effects, select public drug plans, 2011/12 to 2012/13
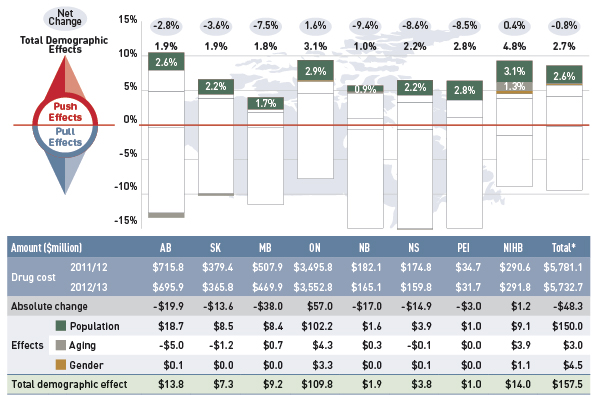
*Total results for the select public drug plans reported in this figure.
Note: Values may not add to totals due to rounding.
Data source: National Prescription Drug Utilization Information System Database, Canadian Institute for Health Information.
Figure description
This figure describes the factors that impacted the rates of change in drug cost due to demographic effects in select public drug plans in Canada from 2011/12 to 2012/13. It is composed of a bar graph with a table underneath. The bar graph shows the percent change from 2011/12 to 2012/13 for each public drug plan. The results are as follows:
Table
|
Alberta |
Saskatchewan |
Manitoba |
Ontario |
New Brunswick |
Nova Scotia |
Prince Edward Island |
Non-Insured Health Benefits |
Total select plans |
| Net change |
-2.8% |
-3.6% |
-7.5% |
1.6% |
-9.4% |
-8.6% |
-8.5% |
0.4% |
-0.8% |
| Total demographic effects |
1.9% |
1.9% |
1.8% |
3.1% |
1.0% |
2.2% |
2.8% |
4.8% |
2.7% |
| Population effect |
2.6% |
2.2% |
1.7% |
2.9% |
0.9% |
2.2% |
2.8% |
3.1% |
2.6% |
| Aging effect |
-0.7% |
-0.3% |
0.1% |
0.1% |
0.2% |
-0.1% |
0.0% |
1.3% |
0.1% |
| Gender effect |
0.0% |
0.0% |
0.0% |
0.1% |
0.0% |
0.0% |
0.0% |
0.4% |
0.1% |
The table below the bar graph gives the corresponding changes in millions of dollars.
Table
|
Alberta |
Saskatchewan |
Manitoba |
Ontario |
New Brunswick |
Nova Scotia |
Prince Edward Island |
Non-Insured Health Benefits |
Total select plans |
| Drug cost 2011/12 |
$715.8 |
$379.4 |
$507.9 |
$3,495.8 |
$182.1 |
$174.8 |
$34.7 |
$290.6 |
$5,781.1 |
| Drug cost 2012/13 |
$695.9 |
$365.8 |
$469.9 |
$3,552.8 |
$165.1 |
$159.8 |
$31.7 |
$291.8 |
$5,732.7 |
| Absolute change |
-$19.9 |
-$13.6 |
-$38.0 |
$57.0 |
-$17.0 |
-$14.9 |
-$3.0 |
$1.2 |
-$48.3 |
| Population effect |
$18.7 |
$8.5 |
$8.4 |
$102.2 |
$1.6 |
$3.9 |
$1.0 |
$9.1 |
$150.0 |
| Aging effect |
-$5.0 |
-$1.2 |
$0.7 |
$4.3 |
$0.3 |
-$0.1 |
$0.0 |
$3.9 |
$3.0 |
| Gender effect |
$0.1 |
$0.0 |
$0.0 |
$3.3 |
$0.0 |
$0.1 |
$0.0 |
$1.1 |
$4.5 |
| Total demographic effect |
$13.8 |
$7.3 |
$9.2 |
$109.8 |
$1.9 |
$3.8 |
$1.0 |
$14.0 |
$157.5 |
The increase in the size of the active beneficiary populations pushed the drug plan cost upwards by an estimated $150.0 million or 2.6%. This can be directly correlated to the increase in the active beneficiary population reported in Figure 4.2.2.
The aging and the gender effects had a negligible impact on the change in drug cost. Generally, the aging effect is expected to have a long-term impact on drug cost, and this is further discussed in Figure 4.2.3.
The results in this analysis report the aging of the active beneficiary in public drug plans, which is different than aging of the Canadian population. As the Canadian population ages, the number of people eligible for senior coverage (+65) grows, and this increases the size of the beneficiary population in public plans. This latter trend is captured in the population effect reported in Figure 4.2.1.
The next two figures provide supporting statistical information on growth and aging in the beneficiary populations.
Figure 4.2.2 shows the rate of growth in the number of active beneficiaries from 2011/12 to 2012/13 (bar graph), while the associated table reports the total number of active beneficiaries for each fiscal year.
Figure 4.2.2 Rates of change in the active beneficiary populations, select public drug plans, 2011/12 to 2012/13
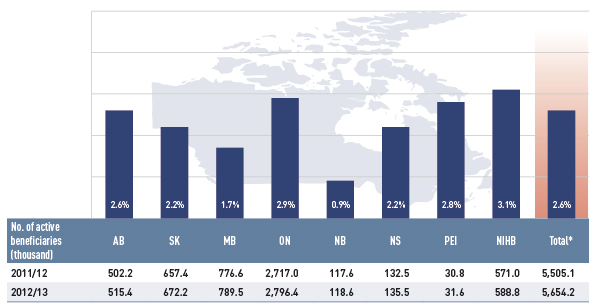
*Total results for the select public drug plans reported in this figure.
Data source: National Prescription Drug Utilization Information System Database, Canadian Institute for Health Information.
Figure description
This bar graph gives the rate of change in the beneficiary population for select public drug plans in Canada in 2012/13, along with the total number of active beneficiaries (thousands) from 2011/12 to 2012/13: Alberta: 2.6% (502.2 to 515.4); Saskatchewan: 2.2% (657.4 to 672.2); Manitoba: 1.7% (776.6 to 789.5); Ontario: 2.9% (2,717.0 to 2,796.4); New Brunswick: 0.9% (117.6 to 118.6); Nova Scotia: 2.2% (132.5 to 135.5); Prince Edward Island: 2.8% (30.8 to 31.6); Non-Insured Health Benefits: 3.1% (571.0 to 588.8); total for all plans: 2.6% (5,505.1 to 5,654.2).
Across plans, the active beneficiary populations grew at an average rate of 2.6%, ranging from 0.9% to 3.1%.
This increase may be the result of growth in the overall population of a jurisdiction, the aging of the population (increasing the number of seniors eligible for coverage) and/or plan design changes that expand coverage to new population or patient groups.
Figure 4.2.3 reports the average age of the active beneficiary populations in the select public drug plans from 2005/06 to 2012/13, along with the average age of the Canadian population in 2006 and 2011, as reported by Statistics Canada.Footnote 13
Figure 4.2.3 Average age of active beneficiary populations, select public drug plans and Canada, 2005/06 to 2012/13
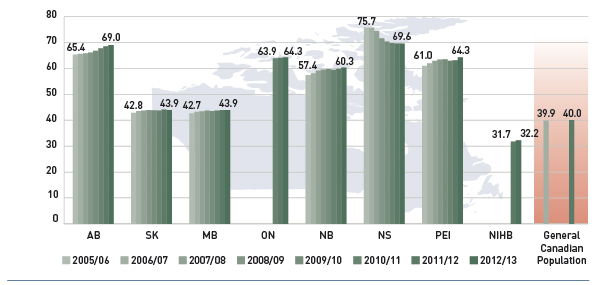
Data sources: National Prescription Drug Utilization Information System Database, Canadian Institute for Health Information; data for general Canadian population from Statistics Canada census data for 2006 and 2011.
Figure description
This bar graph describes the average age of beneficiary populations from 2005/06 to 2012/13 for select public drug plans in Canada. The average age increased gradually over five years for all plans except Nova Scotia. Data for Ontario was only available starting in 2010/11 and the Non-Insured Health Benefits began in 2011/12.
- Alberta - 2005/06: 65.4; 2012/13: 69.0
- Saskatchewan - 2005/06: 42.8; 2012/13: 43.9
- Manitoba - 2005/06: 42.7; 2012/13: 43.9
- Ontario - 2010/11: 63.9; 2012/13: 64.3
- New Brunswick - 2005/06: 57.4; 2012/13: 60.3
- Nova Scotia - 2005/06: 75.7; 2012/13: 69.6
- Prince Edward Island - 2005/06: 61.0; 2012/13: 64.3
- Non-Insured Health Benefits - 2011/12: 31.7; 2012/13: 32.2
- General Canadian population - 2006: 39.9; 2011: 40.0
The average age of drug plan beneficiaries increased gradually from 2006/07 to 2012/13 in all but one jurisdiction. The exception was Nova Scotia, which experienced a reduction in the average age when drug coverage was expanded to include a younger population with the introduction of the Family Pharmacare Program.
Public drug plans reimbursed beneficiaries that were predominantly older than the Canadian population. The average Canadian was 40.0 years old in 2012, while the average age of active beneficiaries ranged from 60.3 to 69.6 for senior-based drug plans.
The average age of beneficiaries in universal programs (Saskatchewan and Manitoba) was closer to the Canadian average, while NIHB beneficiaries were younger due to the unique demographic profile of its client population.
In the coming decades, the aging Canadian population is expected to gradually increase pressure on drug expenditures. Statistics Canada forecasts that the proportion of Canada’s population that is 65 and older will increase from 15.7% in 2014 to between 24% and 28% in 2063.Footnote 14 A previously published PMPRB NPDUIS study discusses this ‘baby-boomer effect,’ and its impact on drug expenditure.Footnote 15
4.3 Volume Effects
Volume effects include the prescription volume effect, the prescription size effect and the strength–form effect. In 2012/13, the combined volume effects had a slight push effect on drug cost levels.
The volume effects are controlled by assuming the number and the age–gender profile of the active beneficiary populations remain constant from 2011/12 to 2012/13. Thus, these effects are purely the result of increased exposure to drugs for a standardized active beneficiary group.
Prescription Volume Effect
- This effect captures the impact of changes in the number of prescriptions dispensed to a standardized group of active beneficiaries (age, gender and size) over the two time periods analyzed. There are many factors that influence this effect, including the use of multiple drugs, the presence of comorbidities and the persistency of treatment, among other things.
Prescription Size Effect
- This effect captures the impact of changes in the average number of units dispensed per prescription for a given drug. An increase in this measure drives an increase in drug cost, unless it is offset by a reduction in the number of prescriptions (i.e., prescription volume effect).
Strength–Form Effect
- This effect captures the impact of shifts in the use of different strengths or formulations of an ingredient. Drugs are typically available in a variety of strength–form combinations for which the cost per unit can vary substantially. Higher strength drugs are typically more expensive, and an increase in their use could contribute positively to drug cost change.
Figure 4.3.1 reports the rate of change in drug cost for the select public drug plans from 2011/12 to 2012/13 focussing on the three volume effects: prescription volume, prescription size and the strength–form effect. The bar graph and associated table show the year-over-year impacts of each effect as a relative and absolute change in drug costs.
Figure 4.3.1 Rates of change in drug costs due to volume effects, select public drug plans, 2011/12 to 2012/13
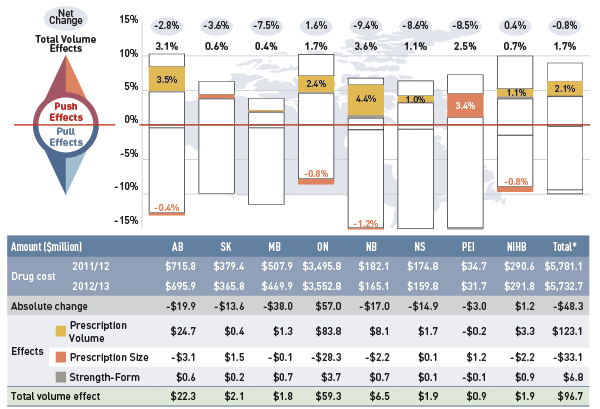
*Total results for the select public drug plans reported in this figure.
Note: Values may not add to totals due to rounding.
Data source: National Prescription Drug Utilization Information System Database, Canadian Institute for Health Information.
Figure description
This figure describes the factors that impacted the rates of change in drug cost due to the volume effects in select public drug plans in Canada from 2011/12 to 2012/13. It is composed of a bar graph with a table underneath. The bar graph shows the percent change from 2011/12 to 2012/13 for each public drug plan. The results are as follows:
Table
|
Alberta |
Saskatchewan |
Manitoba |
Ontario |
New Brunswick |
Nova Scotia |
Prince Edward Island |
Non-Insured Health Benefits |
Total select plans |
| Net change |
-2.8% |
-3.6% |
-7.5% |
1.6% |
-9.4% |
-8.6% |
-8.5% |
0.4% |
-0.8% |
| Total volume effects |
3.1% |
0.6% |
0.4% |
1.7% |
3.6% |
1.1% |
2.5% |
0.7% |
1.7% |
| Prescription volume effect |
3.5% |
0.1% |
0.2% |
2.4% |
4.4% |
1.0% |
-0.5% |
1.1% |
2.1% |
| Prescription size effect |
-0.4% |
0.4% |
0.0% |
-0.8% |
-1.2% |
0.0% |
3.4% |
-0.8% |
-0.6% |
| Strength/form effect |
0.1% |
0.1% |
0.1% |
0.1% |
0.4% |
0.0% |
-0.4% |
0.3% |
0.1% |
The table below the bar graph gives the corresponding changes in millions of dollars.
Table
|
Alberta |
Saskatchewan |
Manitoba |
Ontario |
New Brunswick |
Nova Scotia |
Prince Edward Island |
Non-Insured Health Benefits |
Total select plans |
| Drug cost 2011/12 |
$715.8 |
$379.4 |
$507.9 |
$3,495.8 |
$182.1 |
$174.8 |
$34.7 |
$290.6 |
$5,781.1 |
| Drug cost 2012/13 |
$695.9 |
$365.8 |
$469.9 |
$3,552.8 |
$165.1 |
$159.8 |
$31.7 |
$291.8 |
$5,732.7 |
| Absolute change |
-$19.9 |
-$13.6 |
-$38.0 |
$57.0 |
-$17.0 |
-$14.9 |
-$3.0 |
$1.2 |
-$48.3 |
| Prescription volume effect |
$24.7 |
$0.4 |
$1.3 |
$83.8 |
$8.1 |
$1.7 |
-$0.2 |
$3.3 |
$123.1 |
| Prescription size effect |
-$3.1 |
$1.5 |
-$0.1 |
-$28.3 |
-$2.2 |
$0.1 |
$1.2 |
-$2.2 |
-$33.1 |
| Strength/form effect |
$0.6 |
$0.2 |
$0.7 |
$3.7 |
$0.7 |
$0.1 |
-$0.1 |
$0.9 |
$6.8 |
| Total volume effect |
$22.3 |
$2.1 |
$1.8 |
$59.3 |
$6.5 |
$1.9 |
$0.9 |
$1.9 |
$96.7 |
While the volume sub-effects varied considerably, with some plans having positive effects while others had negative ones, generally the impacts were minimal, with a few notable exceptions.
Prescription volume was an important cost driver in Alberta, Ontario and New Brunswick, pushing the drug cost upward by 3.5%, 2.4% and 4.4%, respectively. At the same time, prescription size had a small pull-down effect in the same plans (–0.4%, –0.8% and –1.2%, respectively). These results indicate that while the size of prescriptions in Alberta, Ontario and New Brunswick are decreasing, the volume of use is increasing.
The strength–form effect had a minimal impact on drug cost change across plans.
Figures 4.3.2 and 4.3.3 provide supporting information on the average number of prescriptions per active beneficiary and trends in prescription size. For additional information on prescription size, see Section 5, Figures 5.3.a, 5.3b and 5.3c.
The prescription volume effect reported in Figure 4.3.1 reflects changes in the average number of prescriptions dispensed per active beneficiary. Figure 4.3.2 reports this measure for 2011/12 and 2012/13, along with the percent change over the two years.
Figure 4.3.2 Average number of prescriptions per active beneficiary, select public drug plans, 2011/12 to 2012/13
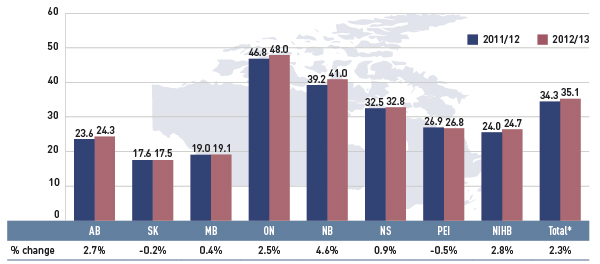
*Total results for the select public drug plans reported in this figure.
Data source: National Prescription Drug Utilization Information System Database, Canadian Institute for Health Information.
Figure description
The bar graph gives the average number of prescriptions per beneficiary for select public drug plans in Canada in 2011/12 and 2012/13: Alberta - 2011/12: 23.6, 2012/13: 24.3; Saskatchewan - 2011/12: 17.6, 2012/13: 17.5; Manitoba - 2011/12: 19.0, 2012/13: 19.1; Ontario - 2011/12: 46.8, 2012/13: 48.0; New Brunswick - 2011/12: 39.2, 2012/13: 41.0; Nova Scotia - 2011/12: 32.5, 2012/13: 32.8; Prince Edward Island - 2011/12: 26.9, 2012/13: 26.8; Non-Insured Health Benefits - 2011/12: 24.0, 2012/13: 24.7; Total select plans - 2011/12: 34.3, 2012/13: 35.1.
As with the results for the prescription volume effect, there has been a marked increase in the average number of prescriptions dispensed per beneficiary in Alberta, Ontario and New Brunswick (2.7%, 2.5% and 4.6%, respectively). The NIHB also had an increase in the number of prescriptions per beneficiary of 2.8%.
Note that this rate of increase differs from that reported for the prescription volume effect because it includes demographic changes, such as aging and shifts in gender distribution.
Across the public drug plans, differences in the average number of prescriptions per active beneficiary are due to the demographic and therapeutic profile of the beneficiaries, as well as prescribing and dispensing practices.
Figure 4.3.3 shows the trend in the average prescription size in terms of physical units from 2008/09 to 2012/13. Note that the data reported is restricted to oral solid formulations.
Figure 4.3.3 Average number of physical units per prescription, select public drug plans, oral solids, 2008/09 to 2012/13
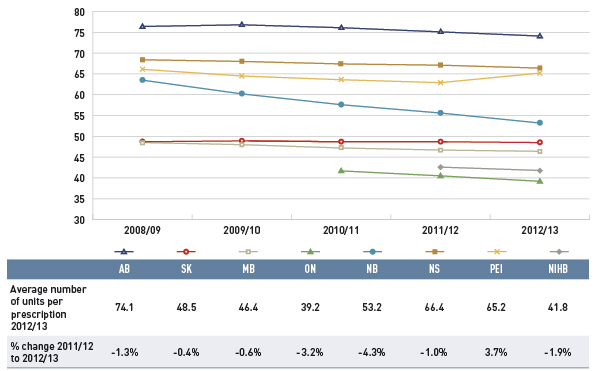
Data source: National Prescription Drug Utilization Information System Database, Canadian Institute for Health Information.
Figure description
This line graph shows the average number of units per prescription from 2008/09 to 2012/13 for select public drug plans in Canada. The analysis is limited to oral solids. The results show that average prescription size has been either stable, or trending downward (Alberta, Ontario and New Brunswick) over five years.
Table
|
Alberta |
Saskatchewan |
Manitoba |
Ontario |
New Brunswick |
Nova Scotia |
Prince Edward Island |
Non-Insured Health Benefits |
| Average number of units per prescription 2012/13 |
74.1 |
48.5 |
46.4 |
39.2 |
53.2 |
66.4 |
65.2 |
41.8 |
| Percent change 2011/12 to 2012/13 |
-1.3% |
-0.4% |
-0.6% |
-3.2% |
-4.3% |
-1.0% |
3.7% |
-1.9% |
The prescription size effect measures the impact of changes in the average quantity of drugs dispensed per prescription.
The results suggest that the average prescription size has been either stable or trending slightly downward.
Similarly to the findings for the cost driver model, there was a marked reduction in the prescription size in Alberta, Ontario and New Brunswick (–1.3%, –3.2% and –4.3%, respectively) in 2012/13.
Note that the rate of decrease in the average number of units per prescription differs from that reported for the prescription size effect as the first includes demographic changes, such as aging and any shifts in gender distribution.
Prescription size is a two-way effect: it has the opposite impact on dispensing fee expenditures, with shorter prescriptions increasing the number of fees, and thus, pushing the cost of dispensing fees upward. This topic is covered further in Section 5.
4.4 Drug-Mix Effects
Drug-mix effects are composed of the following individual sub-effects:
Existing Drug Effect
- This effect captures the impact of shifts in market shares between ingredients that are available in both time periods analyzed (i.e., fiscal years 2011/12 and 2012/13). This driver may reflect changing treatments patterns, physician prescribing practices and/or the prevalence of diseases in the population. The impact of switching between drugs and shifting market shares among therapeutic classes and subclasses is captured by this effect.
Entering Drug Effect
- This effect captures the impact of shifts in utilization towards drugs that entered the market in the second time period (2012/13). With new drugs constantly being launched, this is an important cost driver. Less expensive new drugs offer savings (pull effect) and more expensive new drugs result in cost increases (push effect). This driver measures the net effect of these two opposing forces.
Exiting Drug Effect
- This effect captures the impact of shifts in utilization away from drugs that exit the market in the second time period (2012/13). Its impact will be minimal unless high-use or expensive drugs are withdrawn.
Figure 4.4.1 reports the rate of change in drug cost for the select public drug plans from 2011/12 to 2012/13 focussing on the three drug–mix effects: existing drug, entering drug and exiting drug effects. The bar graph and the associated table show the year-over-year impacts of each effect as a relative and absolute change in drug cost.
Figure 4.4.1 Rates of change in drug costs due to drug-mix effects, select public drug plans, 2011/12 to 2012/13
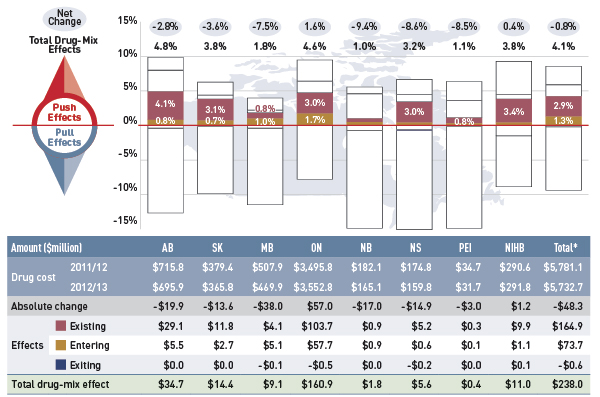
*Total results for the select public drug plans reported in this figure.
Note: Values may not add to totals due to rounding.
Data source: National Prescription Drug Utilization Information System Database, Canadian Institute for Health Information.
Figure description
This figure describes the factors that impacted the rates of change in drug cost due to drug-mix effects in select public drug plans in Canada from 2011/12 to 2012/13. It is composed of a bar graph with a table underneath. The bar graph shows the percent change from 2011/12 to 2012/13 for each public drug plan. The results are as follows:
Table
|
Alberta |
Saskatchewan |
Manitoba |
Ontario |
New Brunswick |
Nova Scotia |
Prince Edward Island |
Non-Insured Health Benefits |
Total select plans |
| Net change |
-2.8% |
-3.6% |
-7.5% |
1.6% |
-9.4% |
-8.6% |
-8.5% |
0.4% |
-0.8% |
| Total drug-mix effects |
4.8% |
3.8% |
1.8% |
4.6% |
1.0% |
3.2% |
1.1% |
3.8% |
4.1% |
| Existing effect |
4.1% |
3.2% |
0.8% |
3.0% |
0.5% |
3.0% |
0.8% |
3.4% |
2.9% |
| Entering effect |
0.8% |
0.7% |
1.0% |
1.7% |
0.5% |
0.4% |
0.3% |
0.2% |
1.3% |
| Exiting effect |
0.0% |
0.0% |
0.0% |
-0.1% |
0.0% |
-0.1% |
0.0% |
0.0% |
-0.1% |
The table below the bar graph gives the corresponding changes in millions of dollars.
Table
|
Alberta |
Saskatchewan |
Manitoba |
Ontario |
New Brunswick |
Nova Scotia |
Prince Edward Island |
Non-Insured Health Benefits |
Total select plans |
| Drug cost 2011/12 |
$715.8 |
$379.4 |
$507.9 |
$3,495.8 |
$182.1 |
$174.8 |
$34.7 |
$290.6 |
$5,781.1 |
| Drug cost 2012/13 |
$695.9 |
$365.8 |
$469.9 |
$3,552.8 |
$165.1 |
$159.8 |
$31.7 |
$291.8 |
$5,732.7 |
| Absolute change |
-$19.9 |
-$13.6 |
-$38.0 |
$57.0 |
-$17.0 |
-$14.9 |
-$3.0 |
$1.2 |
-$48.3 |
| Existing effect |
$29.1 |
$11.8 |
$4.1 |
$103.7 |
$0.9 |
$5.2 |
$0.3 |
$9.9 |
$164.9 |
| Entering effect |
$5.5 |
$2.7 |
$5.1 |
$57.7 |
$0.9 |
$0.6 |
$0.1 |
$1.1 |
$73.7 |
| Exiting effect |
$0.0 |
$0.0 |
-$0.1 |
-$0.5 |
$0.0 |
-$0.2 |
$0.0 |
$0.1 |
-$0.6 |
| Total drug-mix effect |
$34.7 |
$14.4 |
$9.1 |
$160.9 |
$1.8 |
$5.6 |
$0.4 |
$11.0 |
$238.0 |
The results indicate that growth in expenditures for existing drugs had a large push effect on drug cost in Alberta (4.1%), Saskatchewan (3.1%), Ontario (3.0%), Nova Scotia (3.0%) and the NIHB (3.4%). The existing drug effect averaged 2.9% across the plans, which translated into an increase of $164.9 million in drug costs in 2012/13.
The entering drugs had a 1.3% ($73.7 million) effect on drug cost for the select plans. The exiting drug effect was negligible.
Figures 4.4.2 and 4.2.3 provide information on high-impact drugs and therapeutic classes that explain these results.
Figure 4.4.2 further decomposes the 4.1% growth in drug cost attributable to the new and existing drug effect into the top ten and bottom five drugs that impacted this driver. The drugs reported have a relatively high average cost per prescription and important increases (top ten) or reductions (bottom five) in use in 2012/13, as measured by the number of prescriptions.
Figure 4.4.2 Top ten and bottom five drugs contributing to new and existing drug effect, all select public drug plans, 2012/13
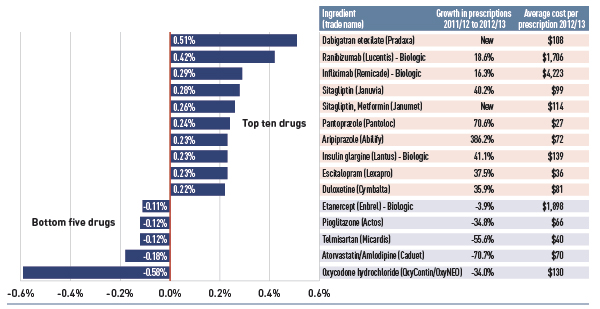
Note: Select public drug plans include Alberta, Saskatchewan, Manitoba, Ontario, New Brunswick, Nova Scotia, Prince Edward Island and the Non-Insured Health Benefit plan.
Data source: National Prescription Drug Utilization Information System Database, Canadian Institute for Health Information.
Figure description
This bar graph shows the top ten and bottom five drugs contributing to the new and existing drug effect from 2011/12 to 2012/13 in select public drug plans in Canada. The largest pressure on drug cost in 2012/13 was by the new antithrombotic Pradaxa, which pushed costs up by 0.51%, while high-cost biologics Lucentis, Remicade and Lantus pushed costs up.
Table
| Ingredient (trade name) |
Contribution to new and existing drug effect |
Growth in prescriptions from 2011/12 to 2012/13 |
Average cost per prescription for 2012/13 |
| Dabigatran etexilate (Pradaxa) |
0.51% |
New |
$108 |
| Ranibizumab (Lucentis)-Biologic |
0.42% |
18.6% |
$1,706 |
| Infliximab (Remicade)-Biologic |
0.29% |
16.3% |
$4,223 |
| Sitagliptin (Januvia) |
0.28% |
40.2% |
$99 |
| Sitagliptin, Metformin (Janumet) |
0.26% |
New |
$114 |
| Pantoprazole (Pantoloc) |
0.24% |
70.6% |
$27 |
| Aripiprazole (Abilify) |
0.23% |
386.2% |
$72 |
| Insulin glargine (Lantus) - Biologic |
0.23% |
41.1% |
$139 |
| Escitalopram (Lexapro) |
0.23% |
37.5% |
$36 |
| Duloxetine (Cymbalta) |
0.22% |
35.9% |
$81 |
| Etanercept (Enbrel) - Biologic |
-0.11% |
-3.9% |
$1,898 |
| Pioglitazone (Actos) |
-0.12% |
-34.8% |
$66 |
| Telmisartan (Micardis) |
-0.12% |
-55.6% |
$40 |
| Atorvastatin/Amlodipine (Caduet) |
-0.18% |
-70.7% |
$70 |
| Oxycodone hydrochloride (OxyContin/OxyNEO) |
-0.58% |
-34.0% |
$130 |
The largest pressure on drug cost in 2012/13 was driven by the new antithrombotic drug Pradaxa, which pushed costs up by 0.51%. The high-cost biologics Lucentis, Remicade and Lantus pushed drug costs levels up by 0.42%, 0.29% and 0.23%, respectively, as their use increased markedly (18.6%, 16.3% and 41.1%, respectively). Two drugs that treat diabetes, Januvia and Janumet (a recent entrant), also increased the drug cost by 0.28% and 0.26%, respectively.
Among the bottom five drugs, Oxycodone had the most important pull-down effect on drug costs, accounting for a 0.58% reduction in the 2012/13 drug cost level from the previous year. The utilization for the ingredient dropped when public plans delisted Oxycontin and the more tamper-resistant version, OxyNEO, was launched.
Note that this list of high-impact drugs is, to a large extent, reflective of the Ontario results due to the large relative size of this public plan, and its weight in the total results reported for the select plans.
Figure 4.4.3 reports the rates of change in the drug cost for biologics compared to the rates of change in the total drug cost from 2011/12 to 2012/13.
Figure 4.4.3 Rates of change in drug costs for biologic drugs compared with all drugs, all select public drug plans, 2011/12 to 2012/13
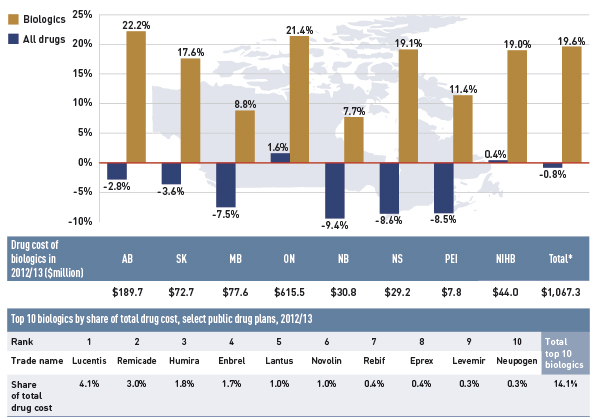
*Total results for the select public drug plans reported in this figure.
Data source: National Prescription Drug Utilization Information System Database, Canadian Institute for Health Information.
Figure description
This bar graph describes the rates of change in biologic drug costs compared with all drugs for 2012/13 in select public drug plans in Canada. There has been a large increase in the cost for biologics compared to the rate of change in overall drug cost (given in parenthesis). Alberta: 22.2% (-2.8%); Saskatchewan: 17.6% (-3.6%); Manitoba: 8.8% (-7.5%); Ontario: 21.4% (1.6%); New Brunswick: 7.7% (-9.4%); Nova Scotia: 19.1% (-8.6%); Prince Edward Island: 11.4% (-8.5%); Non-Insured Health Benefits: 19.0% (0.4%); Total select plans: 19.6% (-0.8%).
There are two tables below the bar graph. The first gives the cost of biologics in 2012/13 in millions of dollars. Alberta: $189.70; Saskatchewan: $72.70; Manitoba: $77.60; Ontario: $615.50; New Brunswick: $30.80; Nova Scotia: $29.20; Prince Edward Island: $7.80; Non-Insured Health Benefits: $44.00; Total select plans: $1,067.30.
The second table gives the top 10 biologics by share of total drug cost for select public drug plans in 2012/13. By rank from 1 to 10, they are as follows: Lucentis: 4.1%; Remicade: 3.0%; Humira: 1.8%; Enbrel: 1.7%; Lantus: 1.0%; Novolin: 1.0%; Rebif: 0.4%; Eprex: 0.4%; Levemir: 0.3%; Neupogen: 0.3%; Total top 10 biologics: 14.1%.
There has been a large increase in the drug cost for biologics (19.6%), contrasting with the low overall negative rate of change in drug cost (–0.8%) in the select public drug plans.
Jurisdictional differences in the rates of growth in biologics may be related to formulary listing decisions, the prevalence of diseases treated by this group of drugs, as well as demographic factors.
Figure 4.4.4 reports the biologic share of total drug cost from 2008/09 to 2012/13.
Figure 4.4.4 Biologic share of total drug cost, select public drug plans, 2008/09 to 2012/13
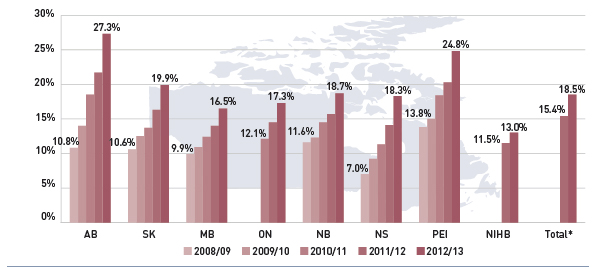
*Total results for the select public drug plans reported in this figure.
Data source: National Prescription Drug Utilization Information System Database, Canadian Institute for Health Information.
Figure description
This bar graph shows the biologic share of total drug cost from 2008/09 to 2012/13 in select Canadian public drug plans. The results indicate that all plans had marked increases in biologic shares, with the largest increases in Alberta: 10.8% in 2008/09 to 27.3% in 2012/13 – and Prince Edward Island increasing from 13.8% to 24.8% over five years. Changes for other public drug plans from 2008/09 to 2012/13 are Saskatchewan: 10.6% to 19.9%; Manitoba: 9.9% to 16.5%; Ontario: 12.1% (2010/11) to 17.3% (2012/13); New Brunswick: 11.6% to 18.7%; Nova Scotia: 7.0% to 18.3%; Non-Insured Health Benefits: 11.5% (2011/12) to 13.0% (2012/13); Total: 15.4% (2011/12) to 18.5% (2012/13).
The relatively high rate of change in the cost of biologics compared to all drugs illustrated in Figure 4.4.3 has resulted in an increased market capture for biologics, which by 2012/13 accounted for 18.5% of total drug costs.
Alberta and Prince Edward Island had the highest levels of biologic-related costs relative to total drug cost in 2012/13 (27.3% and 24.8%, respectively).
Figure 4.4.5 reports the shares of drug expenditure in 2012/13 for the top therapeutic classes as a total for all the plans. Level 1 of the World Health Organization’s Anatomical Therapeutic and Chemical (ATC) classification system is referenced, which refers to the main anatomical group.
Figure 4.4.5 Top 10 level 1 ATC therapeutic classes by share of total drug cost, all select public drug plans, 2012/13
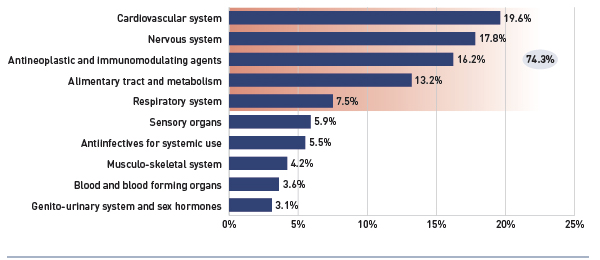
Note: The therapeutic classes reported are the level 1 category of the World Health Organization’s Anatomical Therapeutic and Chemical (ATC) classification system. Select public drug plans include Alberta, Saskatchewan, Manitoba, Ontario, New Brunswick, Nova Scotia, Prince Edward Island and the Non-Insured Health Benefit plan.
Data source: National Prescription Drug Utilization Information System Database, Canadian Institute for Health Information.
Figure description
This bar graph shows the top 10 level one ATC therapeutic classes by share of total drug cost in 2012/13 for select public drug plans in Canada. The results show expenditure was concentrated in a few therapeutic classes, with cardiovascular system (19.6%), nervous system (17.8%), antineoplastic and immunomodulating agents (16.2%); alimentary tract and metabolism (13.2%) and respiratory system (7.5%) drugs accounting for three-quarters (74.3%) of total drug expenditure. The other therapeutic classes and their share of drug cost include: sensory organs (5.9%); antiinfectives for systemic use (5.5%); musculo-skeletal system (4.2%); blood and blood forming organs (3.6%); genito-urinary system and sex hormones (3.1%).
The results show that expenditure was concentrated in a few therapeutic classes, with cardiovascular system (19.6%), nervous system (17.8%), antineoplastic and immunomodulating agents (16.2%), alimentary tract and metabolism (13.2%) and respiratory system (7.5%) drugs accounting for approximately three-quarters (74.3%) of the total drug expenditure in 2012/13.
Some of these classes, such as the cardiovascular and the nervous systems, include drugs that are relatively low-cost but are used by a large number of active beneficiaries whereas the antineoplastic and immunomodulating agents are generally used by a small number of beneficiaries but are often high-cost drugs.
Figure 4.4.6 reports the top ten and bottom five therapeutic sub-classes contributing to the existing drug effect from fiscal year 2011/12 to 2012/13, as a total for all plans. The ATC level 2 is referenced, which refers to the pharmacological/therapeutic subgroup.
Figure 4.4.6 Top ten and bottom five level 2 ATC therapeutic classes contributing to the new and existing drug effect, all select public drug plans, 2012/13
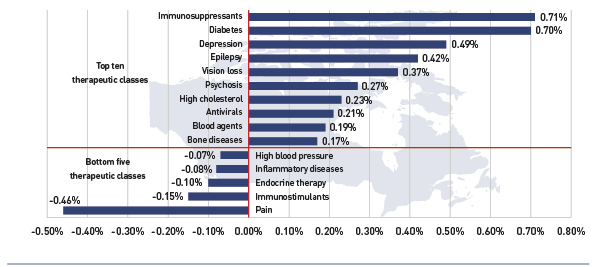
Note: The therapeutic classes reported are the level 2 category of the World Health Organization’s Anatomical Therapeutic and Chemical (ATC) classification system. Select public drug plans include: Alberta, Saskatchewan, Manitoba, Ontario, New Brunswick, Nova Scotia, Prince Edward Island and the Non-Insured Health Benefit plan.
Data source: National Prescription Drug Utilization Information System Database, Canadian Institute for Health Information.
Figure description
This bar graph shows the top ten and bottom five level 2 ATC therapeutic classes contributing to the new and existing drug effect from 2011/12 to 2012/13. The results suggest a significant push effect driven by immunosuppressant drugs, which increased the drug cost in 2012/13 by 0.71%. This class includes many fast-growing biologic drugs.
Top ten therapeutic classes:
- Immunosuppressants: 0.71%
- Diabetes: 0.70%
- Depression: 0.49%
- Epilepsy: 0.42%
- Vision loss: 0.37%
- Psychosis: 0.27%
- High cholesterol: 0.23%
- Antivirals: 0.21%
- Blood agents: 0.19%
- Bone diseases: 0.17%
Bottom five therapeutic classes:
- High blood pressure: -0.07%
- Inflammatory diseases: -0.08%
- Endocrine therapy: -0.10%
- Immunostimulants: -0.15%
- Pain: -0.46%
The results suggest a significant push effect driven by immunosuppressant drugs, which increased the drug cost in 2012/13 by 0.71%. This class includes some of the fast-growing biologic drugs reported in Figure 4.4.2 and 4.4.3.
Diabetes drugs also had a strong push effect on growth (0.70%). This class is also reflects some of the drugs reported in Figure 4.4.2.
A few classes had a downward pull effect on drug cost, most notably the pain drugs, which decreased the drug cost by 0.46%.
5 The Drivers of Dispensing Fee Expenditures, 2011/12 to 2012/13
This section of the NPDUIS CompassRx report provides a comprehensive analysis of the factors that drive dispensing fee expenditures, measures their impact and delves into the factors determining trends in use and fee levels in public drug plans. This edition of the report focuses on the rates of change in dispensing fee expenditures for the select drug plans over the fiscal years 2011/12 to 2012/13. Four effects are analyzed:
Demographic Effect
- Similar to the demographic effects covered in the drivers of drug cost, this effect encompasses changes in the size of the population, as well as the aging and gender profile.
Fee Effect
- This effect captures the impact of changes in the average dispensing fee per prescription.
Prescription Size Effect
- This effect captures the impact of changes in the average number of units of a drug dispensed per prescription. This effect also drives drug cost, but has the opposite effect as discussed in Section 4. A reduction in prescription size has an upward push effect on dispensing fee expenditure, as more prescriptions are required to dispense the same quantity of drugs.
Drug Volume Effect
- This effect captures the impact of changes in the number of units dispensed to patients over the two periods analyzed (2011/12 and 2012/13). An increase in this measure has an upward push effect on dispensing fee expenditure, as more dispensing fees are claimed to dispense an increased quantity of drugs.
Each of these effects was derived by assuming that all the other factors remained constant over the periods analyzed. The results provide an answer to the following question:
How much would the dispensing fee expenditures have changed if only one factor (e.g., average dispensing fee per prescription) changed while the others remained the same?
As with drug costs analyzed in the previous section, multiple factors change simultaneously, creating a residual or a cross effect, which is also reported to account for the total change.
Figure 5.1 reports the rates of change in dispensing fee expenditures for the select public drug plans from fiscal year 2011/12 to 2012/13, and disaggregates the change into four categories: demographic, fee, prescription size and drug volume effects. A cross effect is also reported. The bar graph and associated table below show the year-over-year impacts of each effect as a relative and absolute change in dispensing fee expenditure.
Figure 5.1 Rates of change in dispensing fee expenditures due to demographic, fee, prescription size and drug volume effects, select public drug plans, 2011/12 to 2012/13
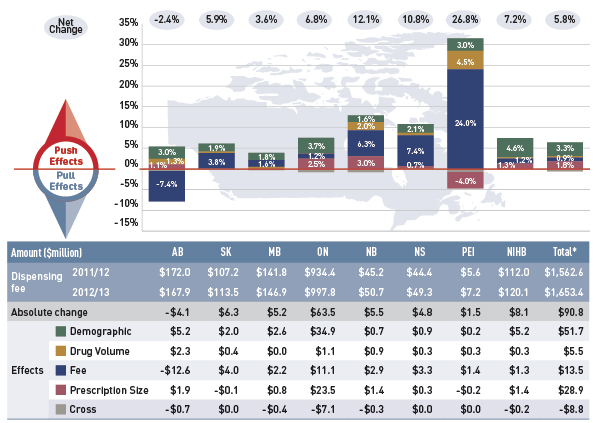
*Total results for the select public drug plans reported in this figure.
Note: Values may not add to totals due to rounding.
Data source: National Prescription Drug Utilization Information System Database, Canadian Institute for Health Information.
Figure description
This graph describes the factors that impacted the rates of change in dispensing fee expenditures in select public drug plans in Canada from 2011/12 to 2012/13. It is composed of a bar graph with a table underneath. The bar graph shows the percent change from 2011/12 to 2012/13 for each public drug plan. The results are as follows:
Push and pull effects
|
Alberta |
Saskatchewan |
Manitoba |
Ontario |
New Brunswick |
Nova Scotia |
Prince Edward Island |
Non-Insured Health Benefits |
Total select plans |
| Net change |
-2.4% |
5.9% |
3.6% |
6.8% |
12.1% |
10.8% |
26.8% |
7.2% |
5.8% |
| Demographic effect |
3.0% |
1.9% |
1.8% |
3.7% |
1.6% |
2.1% |
3.0% |
4.6% |
3.3% |
| Drug volume effect |
1.3% |
0.4% |
0.0% |
0.1% |
2.0% |
0.6% |
4.5% |
0.3% |
0.4% |
| Fee effect |
-7.4% |
3.8% |
1.6% |
1.2% |
6.3% |
7.4% |
24.0% |
1.2% |
0.9% |
| Prescription size effect |
1.1% |
-0.1% |
0.5% |
2.5% |
3.0% |
0.7% |
-4.0% |
1.3% |
1.8% |
The table below the bar graph gives the corresponding changes in millions of dollars.
Table
|
Alberta |
Saskatchewan |
Manitoba |
Ontario |
New Brunswick |
Nova Scotia |
Prince Edward Island |
Non-Insured Health Benefits |
Total select plans |
| Dispensing fee 2011/12 |
$172.0 |
$107.2 |
$141.8 |
$934.4 |
$45.2 |
$44.4 |
$5.6 |
$112.0 |
$1,562.6 |
| Dispensing fee 2012/13 |
$167.9 |
$113.5 |
$146.9 |
$997.8 |
$50.7 |
$49.3 |
$7.2 |
$120.1 |
$1,653.4 |
| Absolute change |
-$4.1 |
$6.3 |
$5.2 |
$63.5 |
$5.5 |
$4.8 |
$1.5 |
$8.1 |
$90.8 |
| Demographic effect |
$5.2 |
$2.0 |
$2.6 |
$34.9 |
$0.7 |
$0.9 |
$0.2 |
$5.2 |
$51.7 |
| Drug volume effect |
$2.3 |
$0.4 |
$0.0 |
$1.1 |
$0.9 |
$0.3 |
$0.3 |
$0.3 |
$5.5 |
| Fee effect |
-$12.6 |
$4.0 |
$2.2 |
$11.1 |
$2.9 |
$3.3 |
$1.4 |
$1.3 |
$13.5 |
| Prescription size effect |
$1.9 |
-$0.1 |
$0.8 |
$23.5 |
$1.4 |
$0.3 |
-$0.2 |
$1.4 |
$28.9 |
| Cross effect |
-$0.7 |
$0.0 |
-$0.4 |
-$7.1 |
-$0.3 |
$0.0 |
$0.0 |
-$0.2 |
-$8.8 |
Overall, the results for most effects varied considerably across the drug plans. Most notably, the fee effect had a pull effect on dispensing fee expenditures in Alberta (-7.4%) and a push effect in Prince Edward Island, Nova Scotia and New Brunswick (24.0%, 7.4% and 6.3%, respectively). These results are directly related to the rates of change in the average dispensing fee per prescription reported in Table 5.1.
Similarly, the prescription size effect had a positive impact in a few public plans, such as New Brunswick (3.0%), Ontario (2.5%) and Alberta (1.1%). These are further analyzed in Figures 5.2 and 5.3a–c. The “pull” effect of prescription size in Prince Edward Island (–4.0%) points toward an increase in the prescription size at a time when the average dispensing fee also increased.
The drug volume effect had a significant positive impact on dispensing fee expenditures in Prince Edward Island (4.5%) and a moderate effect in New Brunswick (2.0%) and Alberta (1.3%). For other plans, the drug volume effect was minimal.
By comparison, the demographic effect was consistently positive across all plans, averaging 3.3% from 2011/12 to 2012/13. This result is reflects both the increases in the active beneficiary population reported in Figure 4.2.2 and the aging of the population.
The additional table and figures in this section provide supporting statistical information on the increase in the average dispensing fee reimbursed per prescription, as well as trends in prescription size.
The fee effect reported in Figure 5.1 is a direct result of the increases in the average dispensing fee per prescription from 2011/12 to 2012/13 reported in Table 5.1. This table also reports the average dispensing fee per prescription for the fiscal years 2008/09 to 2012/13, along with the compound annual rate of change. The results are an average across all prescriptions and encompass a range of dispensing fees reimbursed by the plans.
Table 5.1 Average dispensing fee per prescription, select public drug plan, 2008/09 to 2012/13
| Select Public Drug Plan |
2008/09 |
2009/10 |
2010/11 |
2011/12 |
2012/13 |
Growth rate
2011/12 to
2012/13 |
Compound annual
growth rate
2008/09 to 2012/13 |
| Alberta |
$12.81 |
$13.07 |
$15.22 |
$14.50 |
$13.43 |
-7.4% |
1.2% |
| Saskatchewan |
$8.16 |
$8.54 |
$8.90 |
$9.29 |
$9.64 |
3.8% |
4.3% |
| Manitoba |
$9.06 |
$9.21 |
$9.39 |
$9.58 |
$9.74 |
1.6% |
1.8% |
| Ontario |
– |
– |
$7.00 |
$7.34 |
$7.43 |
1.2% |
– |
| New Brunswick |
$9.36 |
$10.05 |
$10.21 |
$9.83 |
$10.45 |
6.3% |
2.8% |
| Nova Scotia |
$9.88 |
$9.92 |
$10.08 |
$10.32 |
$11.08 |
7.4% |
2.9% |
| Prince Edward Island |
$6.72 |
$6.77 |
$6.84 |
$6.82 |
$8.46 |
24.0% |
5.9% |
| NIHB |
– |
– |
– |
$8.16 |
$8.26 |
1.2% |
– |
Data source: National Prescription Drug Utilization Information System Database, Canadian Institute for Health Information.
The variations in dispensing fee levels across public plans are in accordance with their reimbursement policies (Appendix D) and appear to be correlated with the average size of prescriptions, as reported in Figure 5.2.
For instance, Ontario and the NIHB, which reimbursed some of the lowest dispensing fees in 2012/13 ($7.43 and $8.26, respectively, on average), also had some of the smallest prescription sizes, as measured by the number of average days supplied per prescription for oral solids (27.2 days and 23.6 days, respectively).
On the other hand, Alberta, which had the highest average dispensing fee per prescription in 2012/13 ($13.43), also had the largest prescription size (51.5 days). Note that the average dispensing fee in Alberta has been in decline in recent years, from a high of $15.22 in 2010/11 to $13.43 in 2012/13. Pharmacy markups in this plan are minimal, as reported in Figure 2.1.
Despite the wide variations in the average dispensing fee and prescription size across the plans, the dispensing fee expenditures often represented a comparable portion of the total prescription cost (19.4% in Alberta and 20.7% in Ontario – Figure 2.1).
The variations across plans may also reflect different approaches in pharmacy reimbursement through policies related to drug cost, pharmacy markups and dispensing fees. While the amount reimbursed for dispensing fees and the prescription size have a bearing on dispensing fee expenditures, the levels may also be influenced by the disease profile of the population and the type of drugs predominantly used (e.g., acute versus maintenance treatments).
The prescription size effect reported in Figure 5.1 is influenced by changes in the average number of days supplied per prescription. The trend in day supply per prescription is reported in Figure 5.2 for the fiscal years 2008/09 to 2012/13. The results are an average across all prescriptions for oral solid formulations and encompass all therapy types (acute and maintenance).
Figure 5.2 Average day supply per prescription by select public drug plan, oral solids, 2008/09 to 2012/13
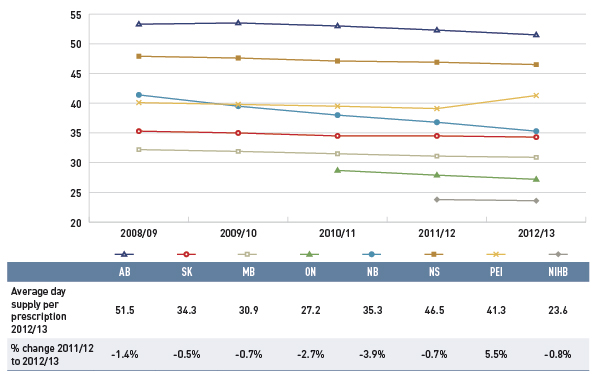
Data source: National Prescription Drug Utilization Information System Database, Canadian Institute for Health Information.
Figure description
This line graph shows the trend in average day supply per prescription from 2008/09 to 2012/13 in select public drug plans in Canada. Average day supply per prescription was either stable or declined slightly over five years. Alberta, Ontario and New Brunswick had the most pronounced reductions in average prescription size.
This figure also includes a table with the average day supply per prescription in 2012/13 and the percent change in day supply from 2011/12 to 2012/13.
Table
|
Alberta |
Saskatchewan |
Manitoba |
Ontario |
New Brunswick |
Nova Scotia |
Prince Edward Island |
Non-Insured Health Benefits |
| Average day supply per prescription for 2012/13 |
51.5 |
34.3 |
30.9 |
27.2 |
35.3 |
46.5 |
41.3 |
23.6 |
| Percent change from 2011/12 to 2012/13 |
-1.4% |
-0.5% |
-0.7% |
-2.7% |
-3.9% |
-0.7% |
5.5% |
-0.8% |
Day supply per prescription and the number of physical units of medication per prescription (Figure 4.3.3) are measures of prescription size. The latter is used in both the drug cost and dispensing fee driver models.
Similarly to the results reported in Figure 4.3.3 on the average number of physical units of medication per prescription, the results on the average day supply per prescription suggest that prescription size was either stable or declined slightly for most public drug plans from 2008/09 to 2012/13.
Alberta, Ontario and New Brunswick had the most pronounced reductions in the average prescription size. This trend acted as a push effect on dispensing fee expenditures, as more frequent prescriptions were required to dispense a given volume of drugs. The following section investigates the changes in the size of prescriptions in these three plans in recent years.
Prescription Size – Case Studies
Figures 5.3a, 5.3b and 5.3c illustrate case studies of changes in the size of prescriptions in three public drug plans: New Brunswick, Ontario and Alberta. These plans have had marked reductions in the average prescription size in 2012/13 (Figure 5.2), which has had a push effect on dispensing fee expenditures of 3.0%, 2.5% and 1.1%, respectively (Figure 5.1).
For these case studies, the top 350 highest utilized ingredients in 2012/13 with oral solid formulations were selected for analysis. The percent change in the average day supply from 2008/09 to 2012/13 was calculated for Alberta and New Brunswick, and the percent change from 2010/11 to 2012/13 was calculated for Ontario (given the data availability).
The results are reported in the form of scatter diagrams depicted at the ingredient level, with the percent change in the average number of day supply per prescription represented on the horizontal axis and the percent share of total number of prescriptions for each drug on the vertical axis.
The figures also provide tables indicating the top 10 drugs in terms of the volume of prescriptions and their corresponding change in prescription size.
The prescription size decreased for a large proportion of ingredients in New Brunswick and Alberta (73% and 63% of the ingredients, respectively). In both public drug plans, ingredients with the greatest market shares in terms of prescriptions had marked declines in prescription length.
While the study period for Ontario was more limited, Figure 5.3c shows that prescription length decreased for most ingredients.
Figure 5.3a New Brunswick: Percent change in prescription size by ingredient, 2008/09 to 2012/13
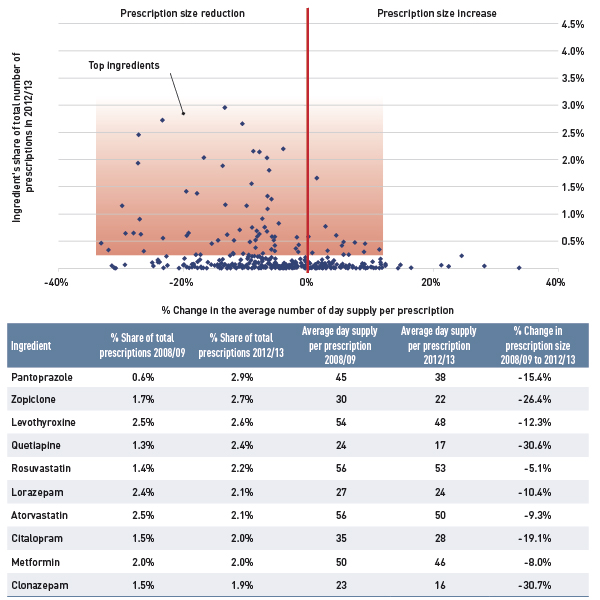
Note: Results are restricted to oral solid formulations (tablets and capsules).
Data source: National Prescription Drug Utilization Information System Database, Canadian Institute for Health Information.
Figure Description
This figure, composed of a scatter graph and an accompanying data table, shows the percent change in prescription size by ingredient for New Brunswick.
The x-axis of the scatter graph plots the percent change in the average number of day supply per prescription from 2008/09 to 2012/13, while the y-axis gives the ingredient’s share of the total number of prescriptions for 2012/13. The results show that prescription size decreased for a large proportion of ingredients (73%) in New Brunswick over the five years; ingredients with the largest market shares had marked declines.
The table gives data for select ingredients.
% Change in the average number of day supply per prescription
| Ingredient |
% Share of total prescriptions 2008/09 |
% Share of total prescriptions 2012/13 |
Average day supply per prescription 2008/09 |
Average day supply per prescription 2012/13 |
% Change in prescription size 2008/09 to 2012/13 |
| Pantoprazole |
0.6% |
2.9% |
45 |
38 |
-15.4% |
| Zopiclone |
1.7% |
2.7% |
30 |
22 |
-26.4% |
| Levothyroxine |
2.5% |
2.6% |
54 |
48 |
-12.3% |
| Quetiapine |
1.3% |
2.4% |
24 |
17 |
-30.6% |
| Rosuvastatin |
1.4% |
2.2% |
56 |
53 |
-5.1% |
| Lorazepam |
2.4% |
2.1% |
27 |
24 |
-10.4% |
| Atorvastatin |
2.5% |
2.1% |
56 |
50 |
-9.3% |
| Citalopram |
1.5% |
2.0% |
35 |
28 |
-19.1% |
| Metformin |
2.0% |
2.0% |
50 |
46 |
-8.0% |
| Clonazepam |
1.5% |
1.9% |
23 |
16 |
-30.7% |
Figure 5.3b Ontario: Percent change in prescription size by ingredient, 2010/11 to 2012/13
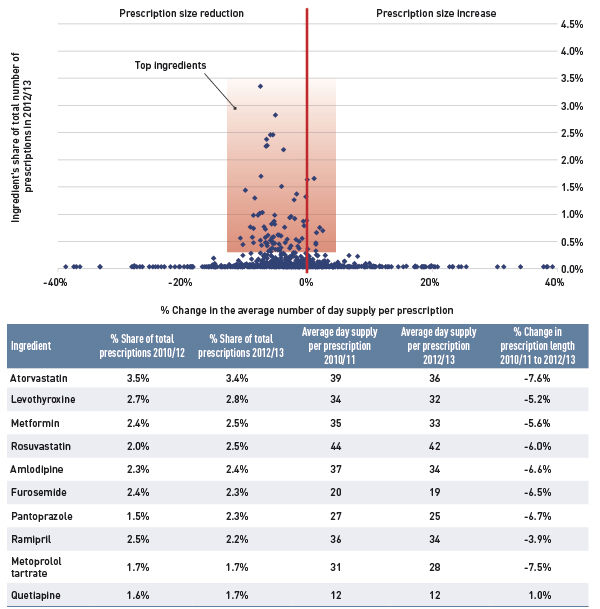
Note: Results are restricted to oral solid formulations (tablets and capsules).
Data source: National Prescription Drug Utilization Information System Database, Canadian Institute for Health Information.
Figure description
This figure, composed of a scatter graph and an accompanying data table, shows the percent change in prescription size by ingredient for Ontario.
The x-axis of the scatter graph plots the percent change in the average number of day supply per prescription from 2010/11 to 2012/13, while the y-axis gives the ingredient’s share of the total number of prescriptions for 2012/13. The results show that prescription size decreased for most ingredients in Ontario over the three years; ingredients with the largest market shares had marked declines.
The table gives data for select ingredients.
% Change in the average number of day supply per prescription
| Ingredient |
% Share of total prescriptions 2010/12 |
% Share of total prescriptions 2012/13 |
Average day supply per prescription 2010/11 |
Average day supply per prescription 2012/13 |
% Change in prescription length 2010/11 to 2012/13 |
| Atorvastatin |
3.5% |
3.4% |
39 |
36 |
-7.6% |
| Levothyroxine |
2.7% |
2.8% |
34 |
32 |
-5.2% |
| Metformin |
2.4% |
2.5% |
35 |
33 |
-5.6% |
| Rosuvastatin |
2.0% |
2.5% |
44 |
42 |
-6.0% |
| Amlodipine |
2.3% |
2.4% |
37 |
34 |
-6.6% |
| Furosemide |
2.4% |
2.3% |
20 |
19 |
-6.5% |
| Pantoprazole |
1.5% |
2.3% |
27 |
25 |
-6.7% |
| Ramipril |
2.5% |
2.2% |
36 |
34 |
-3.9% |
| Metoprolol tartrate |
1.7% |
1.7% |
31 |
28 |
-7.5% |
| Quetiapine |
1.6% |
1.7% |
12 |
12 |
1.0% |
Figure 5.3c Alberta: Percent change in prescription size by ingredient, 2008/09 to 2012/13
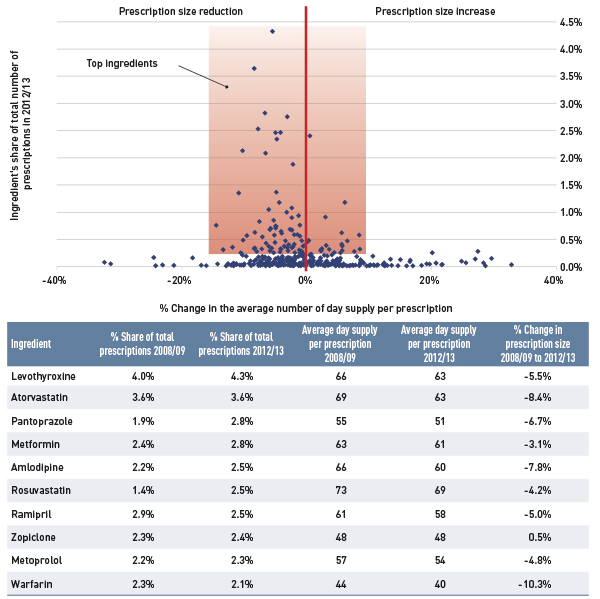
Note: Results are restricted to oral solid formulations (tablets and capsules).
Data source: National Prescription Drug Utilization Information System Database, Canadian Institute for Health Information.
Figure description
This figure, composed of a scatter graph and an accompanying data table, shows the percent change in prescription size by ingredient for Alberta.
The x-axis of the scatter graph plots the percent change in the average number of day supply per prescription from 2008/09 to 2012/13, while the y-axis gives the ingredient’s share of the total number of prescriptions for 2012/13. The results show that prescription size decreased for a large proportion of ingredients (63%) in Alberta over the five years; ingredients with the largest market shares had marked declines.
The table gives data for select ingredients.
% Change in the average number of day supply per prescription
| Ingredient |
% Share of total prescriptions 2008/09 |
% Share of total prescriptions 2012/13 |
Average day supply per prescription 2008/09 |
Average day supply per prescription 2012/13 |
% Change in prescription size 2008/09 to 2012/13 |
| Levothyroxine |
4.0% |
4.3% |
66 |
63 |
-5.5% |
| Atorvastatin |
3.6% |
3.6% |
69 |
63 |
-8.4% |
| Pantoprazole |
1.9% |
2.8% |
55 |
51 |
-6.7% |
| Metformin |
2.4% |
2.8% |
63 |
61 |
-3.1% |
| Amlodipine |
2.2% |
2.5% |
66 |
60 |
-7.8% |
| Rosuvastatin |
1.4% |
2.5% |
73 |
69 |
-4.2% |
| Ramipril |
2.9% |
2.5% |
61 |
58 |
-5.0% |
| Zopiclone |
2.3% |
2.4% |
48 |
48 |
0.5% |
| Metoprolol |
2.2% |
2.3% |
57 |
54 |
-4.8% |
| Warfarin |
2.3% |
2.1% |
44 |
40 |
-10.3% |
Appendix A: Public Drug Plan Design
Table A1 provides a summary of the plan designs in 2012/13 for the public drug plans participating in the NPDUIS initiative as detailed in a Plan Information Document produced by the CIHI.Footnote 2
Table A1: Public drug plan designs, 2012/13
British Columbia
Plans/Eligibility
British Columbia has a universal program with a variety of beneficiary groups and sub-plans: the Fair PharmaCare plan provides regular assistance to residents born in 1940 or later, with enhanced assistance provided to residents who are part of a family with at least one spouse born in 1939 or earlier; permanent residents of licenced residential care facilities; recipients of income assistance and children and youth in care; individuals with cystic fibrosis who are registered with a provincial cystic fibrosis clinic; severely handicapped children 18 years and under; psychiatric medication for individuals registered by a Mental Health Services Centre; medication management services provided by pharmacies such as publicly funded vaccinations and review of a patient’s medication; palliative care at home; patients enrolled at BC Centre for Excellence in HIV/AIDS; and a smoking cessation program.
Cost Sharing
British Columbia had income-based annual deductibles for its Fair PharmaCare and enhanced Fair PharmaCare assistance programs (see tables below). There were no deductibles for other plans/programs. After deductibles had been met, there were co-payments of 30% of the prescription drug cost for the Fair PharmaCare program and 25% for the enhanced program.
Fair PharmaCare
| Net family income |
Approximate deductible
(% of net income) |
| <$15,000 |
0% |
| $15,000–$30,000 |
2% |
| >$30,000 |
3% |
Fair PharmaCare – Enhanced Assistance
| Net family income |
Approximate deductible
(% of net income) |
| <$33,000 |
0% |
| $33,000–$50,000 |
1% |
| >$50,000 |
2% |
Alberta
Plans/Eligibility
Alberta has a Seniors Drug Program that covers seniors 65 and older and eligible dependants, and widows and dependants; Palliative Coverage for residents treated at home; and Non-Group Coverage for residents younger than 65. Claims dispensed to residents of long-term facilities, through Income Support, the Alberta Adult Health Benefit, the Assured Income for Severely Handicapped, the Alberta Child Health Benefit Child Intervention Services and Family Supports for Children with Disabilities programs are not submitted to NPDUIS. There are several other programs, including the Outpatient Cancer Drug Program and Specialized High Cost Drug Program (includes funding for transplant drugs and HIV/AIDS drugs, as well as several other drug costs).
Cost Sharing
Alberta set co-payments at 30% of the prescription to a maximum of $25 for seniors, widows, palliative care and non-group beneficiaries. Premiums for non-group beneficiaries were $118.00/month for families and $63.50/month for singles. Subsidized premiums for non-group beneficiaries were offered based on income as follows: $82.60/month for families and $44.45/month for singles. Palliative care had a maximum copayment of $1,000.
Saskatchewan
Plans/Eligibility
Saskatchewan has a universal program with several plans and beneficiary groups (with the exception of those eligible under another agency, primarily federal programs). The universal program is the Special Support Program, which assists those whose benefit drug costs are high in relation to their income. Other beneficiary groups and plans include a Seniors’ Drug Plan for those who qualify based on income; seniors receiving the Guaranteed Income Supplement or the Saskatchewan Income Plan supplement; a Children’s Drug Program for children 14 or younger; Supplementary Health and Family Health Benefits for which eligibility is established through Social Services; a Saskatchewan Aids to Independent Living for paraplegics; cystic fibrosis and renal disease programs; Palliative Care; Emergency Assistance as a one-time assistance until the beneficiary can apply for Special Support. Beneficiaries who qualify under more than one program receive the better benefit as calculated by the system at the time of dispensing. Claims for Formulary and Exception Drug Status drugs are were submitted to NPDUIS, while drugs covered under special programs such as the Saskatchewan Cancer Agency were not submitted to NPDUIS.
Cost Sharing
Saskatchewan had standard income-based annual deductibles for three plans/programs: Guaranteed Income Supplement (GIS): beneficiaries living in the community paid a semi-annual deductible of $200, while those living in special care homes paid $100 semi-annually. Saskatchewan Income Plan (SIP) and Family Health Benefits (FHB) beneficiaries paid a semi-annual deductible of $100.
Special Support Program: A family threshold (deductible) and a consumer co-payment were based on income information provided on the application form, income tax documentation and drug plan records. The threshold was based on 3.4% of the total family income (adjusted for the number of dependents), and the co-payment was calculated using total family income and actual benefit drug costs.
Co-payments were also made for the following plans/programs, including: the Seniors Drug Plan: up to $20 per prescription; FHB, SIP and GIS plans: after the deductible was met, 35% co-payment for prescriptions applied with certain conditions, for example, for FHB beneficiaries, the co-payment did not apply to children under 18, and for SIP and GIS recipients, the co-payment may have applied for income-tested coverage.
Manitoba
Plans/Eligibility
Manitoba Pharmacare covers all provincial residents who are eligible for benefits under The Prescription Drugs Cost Assistance Act, and includes residents as defined by The Health Services Insurance Act. To be eligible, the person must be a member of a family that has spent more on specified drugs in a benefit year than the allowed deductible amount. Other sub-plans cover those who receive benefits from the Employment and Income Assistance Program; residents in personal care homes who receive benefits from the Personal Care Home Drug Program; individuals who are terminally ill and wish to remain at home from the Palliative Care Drug Program; and individuals requiring out-patient cancer treatment with eligible oral cancer and specific supportive drugs from the Home Cancer Drug Program. Products available through Part 3 of the Manitoba Drug Formulary were not submitted to NPDUIS and were reported as exceptional status products in NPDUIS claims reports.
Cost Sharing
Manitoba had an annual deductible based on total family income, with a minimum deductible of $100 (see table below).
Deductible Rates for Range of Family Incomes
| Lower limit |
Upper limit |
Deductible |
| – |
≤$15,000 |
2.81% |
| >$15,000 |
≤$21,000 |
3.99% |
| >$21,000 |
≤$22,000 |
4.03% |
| >$22,000 |
≤$23,000 |
4.10% |
| >$23,000 |
≤$24,000 |
4.16% |
| >$24,000 |
≤$25,000 |
4.20% |
| >$25,000 |
≤$26,000 |
4.25% |
| >$26,000 |
≤$27,000 |
4.30% |
| >$27,000 |
≤$28,000 |
4.34% |
| >$28,000 |
≤$29,000 |
4.38% |
| >$29,000 |
≤$40,000 |
4.41% |
| >$40,000 |
≤$42,500 |
4.79% |
| >$42,500 |
≤$45,000 |
4.91% |
| >$45,000 |
≤$47,500 |
5.01% |
| >$47,500 |
≤$75,000 |
5.08% |
| >$75,000 |
– |
6.36% |
Ontario
Plans/Eligibility
The Ontario Drug Benefit (ODB) Program covers Ontario residents that are 65 and older, residents of long-term care homes and homes for special care, recipients of professional home services, recipients of social assistance, and recipients under the Trillium Drug Program, which provides drug benefits for Ontario residents who have high drug costs in relation to their household income. The Special Drugs Program covers expensive outpatient drugs used to treat specific diseases. The New Drug Funding Program covers drug benefits for intravenous cancer drugs, administered to outpatients at hospitals and cancer care facilities.
Cost Sharing
The Ontario Drug Benefit (ODB) Program had a $100 annual deductible for single seniors with an annual net income equal to or greater than $16,018; and senior couples with a combined annual income equal to or greater than $24,175.
Trillium Drug Program applicants paid a quarterly deductible that was based on income.
ODB recipients paid co-payments up to $2 per prescription if they were:
- A senior single person with an annual net income of less than $16,018; a senior couple with a combined annual net income of less than $24,175
- Receiving benefits under the Ontario Works Act or the Ontario Disability Support Program Act
- Receiving professional services under the Home Care Program
- Residents of long-term care facilities and homes for special care
- Eligible under the Trillium Drug Program (once their quarterly deductible is reached)
ODB recipients paid up to $6.11 toward the dispensing fee per prescription once they reached their $100 annual deductible if they were:
- A senior single person with an annual net income equal to or greater than $16,018
- A senior couple with a combined annual net income equal to or greater than $24,175
A co-payment of up to $2.83 was made for each prescription dispensed from an outpatient hospital pharmacy.
New Brunswick
Plans/Eligibility
Seniors program eligible to residents on a Guaranteed Income Supplement or who qualify based on an income test. Other programs/plans include Cystic Fibrosis; Individuals in Licensed Residential Facilities; Social Development clients; Children in the Care of the Minister of Social Development and Special Needs Children; Human Growth Hormone; Multiple Sclerosis; Organ Transplant; HIV/AIDs and Nursing Home Residents.
Cost Sharing
The following plans had a $50 per year deductible: Cystic Fibrosis, Multiple Sclerosis, Organ Transplant, Human Growth Hormone Deficiency and HIV/AIDS.
Co-payments varied across plan/programs as follows:
Co-payment per Prescription for New Brunswick Drug Programs/Plans
| Program/plan |
Co-payment per prescription |
| Seniors Guaranteed Income Supplement |
$9.05 |
| Seniors Non-Guaranteed Income Supplement |
$15.00 |
| Adults in Licensed Residential Facilities |
$4.00 |
| Department of Social Development |
$4 for adults 18 years and older
$2 for children younger than 18 |
| Multiple Sclerosis |
Income tested annually |
| Cystic Fibrosis, Organ Transplant, Human Growth Hormone Deficiency and HIV/AIDS |
20% of prescription to a maximum of $20 |
Nova Scotia
Plans/Eligibility
Family Pharmacare Program provides assistance with prescription drug coverage for residents of Nova Scotia with a valid Nova Scotia health card. Other programs/plans include Drug Assistance for Cancer Patients for families with a gross income no greater than $15,720 that do not have drug coverage under any other program, except Family Pharmacare; Diabetes Assistance Program (this program is closed to new enrollees); Seniors’ Pharmacare Program available for residents who are age 65 or older. Claims dispensed through the Department of Community Services programs for residents on income assistance were not submitted to NPDUIS.
Cost Sharing
For the Seniors’ Pharmacare program, Nova Scotia had a maximum annual premium of $424. There was no premium for single seniors with an income lower than $18,000 or for seniors who are married and have a joint income less than $21,000. Seniors receiving the Guaranteed Income Supplement were also exempt from premiums. Other senior beneficiaries may have had a reduced premium: for singles with an income between $18,000 and $24,000 and those who were married and had a joint income between $21,000 and $28,000.
Nova Scotia’s Family Pharmacare and Diabetes Assistance programs had annual maximum deductibles based on sliding-scale percentages in relation to family size and income. The Nova Scotia Family Pharmacare program also had an annual maximum co-payment based on family size and income.
For co-payments, recipients of the Family Pharmacare and Diabetes Assistance programs paid 20% per prescription (to the maximum for Nova Scotia Family Pharmacare. There was no maximum for the Diabetes Assistance Program). Senior Pharmacare beneficiaries paid 30% of the prescription cost as a co-payment to a maximum of $382 per year.
Prince Edward Island
Plans/Eligibility
Seniors Drug Cost Assistance for persons age 65 or older; High-Cost Drug Program; Diabetes Control Drug Program; Family Health Benefit Program for families with income less than a threshold; Nursing Home Drug Program; Sexually Transmitted Disease Program; Quit Smoking Program; Financial Assistance Drug Program; and a Catastrophic Drug Program (began Oct. 1, 2013) for any permanent resident, with their annual out-of-pocket drug costs for eligible prescription medications capped at an amount not exceeding a set percentage of their household income, referred to as ‘household cap.’ To be eligible for the Catastrophic Drug Program: (i) the applicant must be a permanent resident who is present in the province for 6 months or more per year; (ii) the applicant and eligible household members must file a Prince Edward Island tax return for the previous year for which they are applying to the program to claim benefits; (iii) the applicant much have a valid Prince Edward Island Health Card.
Cost Sharing
Prince Edward Island had co-payments per prescription that varied for each program/plan and some medications.
Co-payment per Prescription for PEI Drug Programs/Plans or Medication
| Program/plan |
Co-payment per prescription |
| Seniors Drug Cost Assistance Plan |
First $8.25 of the medication cost plus the professional fee |
| Family Health Benefit Program |
Professional fee |
| High-Cost Drug Program |
Income-based portion of the drug plus the professional fee |
| Insulin |
$10 per 10 mL or box of 1.5 mL cartridges or $20 per box of 3 mL cartridges |
| Blood glucose test strips |
$11 per prescription to a maximum of 100 strips every 30 days |
| Oral medications and urine testing materials |
$11 per prescription |
| High-cost diabetes medications |
An income-based portion of the drug cost plus the professional fee |
| Quit Smoking Program |
Patients were responsible for all medication costs approved, except for the first $75 per year, which was paid by the program. |
| Home Oxygen Program |
PEI Medicare program paid 50% of the eligible expenses up to $200 per month. |
| Catastrophic Drug Program |
This is an income-based program. Once an applicant’s out-of-pocket eligible drug expenses exceeded the annual household limit, the program covered any further eligible drug expenses in the program year. |
Newfoundland & Labrador
Plans/Eligibility
Newfoundland and Labrador has five drug plans under the Newfoundland and Labrador Prescription Drug Program:
- The 65Plus Plan for residents 65 years or older who receive old age security benefits and the Guaranteed Income Supplement.
- The Foundation Plan covers persons and families in receipt of Income Support benefits through the Department of Advanced Education and Skills, children in care of the Regional Health Authorities or the Department of Child, Youth and Family Services, as the case may be, individuals involved with Community Youth Corrections, persons in receipt of community supports, and persons who are subsidized residents in Long Term Care Homes and Personal Care Homes.
- The Access Plan covers residents with a low income determined by family net income level.
- The Assurance Plan covers residents with the financial burden of eligible high drug costs.
- The Select Needs Plan covers residents who have been diagnosed with cystic fibrosis and residents aged 18 years or younger with growth hormone deficiency.
Cost Sharing
Newfoundland had co-payments per prescription that varied for each program/plan, as follows:
For the Seniors program (65Plus Plan) – the co-payment was up to $6 per prescription.
For the Access Plan, beneficiary co-payments per prescription varied based on income and family status, as follows:
Co-payments per Prescription for the Newfoundland Access Plan
Families with children
| Income |
Co-payment |
| <$30,009 |
20.0% |
| $31,000 |
23.9% |
| $32,000 |
27.7% |
| $33,000 |
31.6% |
| $34,000 |
35.5% |
| $35,000 |
39.4% |
| $36,000 |
43.3% |
| $37,000 |
47.2% |
| $38,000 |
51.1% |
| $39,000 |
55.0% |
| $40,000 |
58.8% |
| $41,000 |
62.7% |
| $42,000 |
66.6% |
| $42,870 |
70.0% |
Couples with no children
| Income |
Co-payment |
| <$21,435 |
20.0% |
| $22,000 |
23.3% |
| $23,000 |
29.1% |
| $24,000 |
35.0% |
| $25,000 |
40.8% |
| $26,000 |
46.6% |
| $27,000 |
52.4% |
| $28,000 |
58.3% |
| $29,000 |
64.1% |
| $30,000 |
69.9% |
| $30,009 |
70.0% |
| – |
– |
| – |
– |
| – |
– |
Single individuals
| Income |
Co-payment |
| <$18,577 |
20.0% |
| $19,000 |
22.5% |
| $20,000 |
28.3% |
| $21,000 |
34.1% |
| $22,000 |
40.0% |
| $23,000 |
45.8% |
| $24,000 |
51.6% |
| $25,000 |
57.5% |
| $26,000 |
63.3% |
| $27,000 |
69.1% |
| $27,151 |
70.0% |
| – |
– |
| – |
– |
| – |
– |
For the Assurance Plan, individuals and families had their annual out-of-pocket drug costs capped as per the following table:
blank
| Annual net income (i.e., line 236 minus line 117 of income tax return) |
Maximum % of net income to spend on drug costs |
| $0–$39,999 |
5% |
| $40,000–$74,999 |
7.5% |
| $75,000–$149,999 |
10% |
NIHB
Plans/Eligibility
The Non-Insured Health Benefits Program provides registered First Nations and recognized Inuit with coverage for a limited range of medically necessary goods and services. To be eligible, an individual must be a resident of Canada and a registered First Nations according to the Indian Act; an Inuk recognized by one of the Inuit Land Claim organizations; or an infant of less than one year of age whose parent is an eligible recipient. Those individuals who are otherwise covered under a separate agreement (e.g., a self-government agreement) are not eligible for coverage.
Cost Sharing
–
Appendix B: Pricing Policies for Generic Drugs in Provincial Drug Plans
Table B1 provides a summary, as of December 31, 2014, of the generic price reduction policies across provinces along with their effective dates.
Table B1. Provincial generic pricing policies, generic price as a percentage of the brand price
| Province |
2010 |
2011 |
2012 |
2013*
April 1, 2013, 18% for six of the most common generic drugs (The Council of the Federation)† |
2014*
April 1, 2014, 18% for ten of the most common generic drugs (The Council of the Federation)† |
| British Columbia |
October 15:
50% existing generics
42% new generics |
July 4: 40% all generics |
April 2: 35% all generics |
April 1: 25% most generics |
April 1: 20% most generics |
| Alberta |
April 1: 56% existing generics
45% new generics |
blank |
July 1: 35% all generics |
May 1: 18% |
April 1:
Lowest available price for existing generics;
tiered pricing for new generics:
70% one generic
50% two generics
25% three generics
18% four or more generics |
| Saskatchewan |
blank |
April 1: 40% new generics
May 1 and June 1:
45% existing generics
April 1 and October 1:
35% generics in former Standing Offer Contract categories |
April 1: 35% |
blank |
blank |
| Manitoba |
Generic drug pricing is subject to utilization management agreements with the manufacturers, which declare that the price of a generic is equal to that of other select provinces. |
| Ontario |
July 20:
25%* public;
50% private & out-of-pocket |
April 1:
25%* public
35% private & out-of-pocket |
April 1:
25%* public, private & out-of-pocket |
blank |
blank |
| Quebec |
Quebec requires that generic manufacturers provide the province the lowest price available in other provinces. |
| New Brunswick |
blank |
blank |
June 1: 40%
December 1: 35% |
June 1: 25% |
blank |
| Nova Scotia |
blank |
July 1: 45% |
January 1: 40%
July 1: 35% |
blank |
November 12: 25%
|
| Prince Edward Island |
blank |
blank |
July 1: 35% |
December 1: 25% |
blank |
| Newfoundland & Labrador |
blank |
blank |
April 1: 45%
October 1: 40% |
April 1: 35%
July 1: 25% |
blank |
Note: Information is up to date as of December 31, 2014. Generic pricing exceptions may exist.
* Generic pricing policies apply to oral solid forms; all others are 35%.
† After April 1, 2013, the general provincial generic pricing policies no longer apply to the drugs subject to the 18% pricing policy as per the Council of the Federation.
Quebec did not participate in the pan-Canadian Generic Value Price Initiative for Generic Drugs, but benefited from it because of the lowest price policy.
Appendix C: Markup Policies in Public Drug Plans, 2012/13
Table C1 provides a summary of markup policies in 2012/13 for the public drug plans participating in the NPDUIS initiative.
Table C1: Public drug plan markup policies, 2012/13
British Columbia
- Most drugs maximum 8%.
- High-cost* drugs maximum 5%.
- Products subject to Actual Acquisition Cost (AAC) pricing maximum 7%.
* High-cost drugs are defined as those for which the expected daily cost of the typical dose is equal to or greater than $40 ($14,600 annual cost).
Alberta
Prices listed in the Alberta Health Drug Benefit List include a wholesaler markup, but only if the drug manufacturer distributes through a wholesaler. In such cases, the drug manufacturer is asked to include a distribution allowance of up to 7.5%. This includes both single-source and interchangeable products.
Saskatchewan
With a few exceptions, the maximum markup allowance calculated on the prescription drug cost was:
blank
| Drug cost |
Markup |
| $0.01–$6.30 |
30% |
| $6.31–$15.80 |
15% |
| $15.81–$200.00 |
10% |
| >$200.01 |
$20 max |
Manitoba
No markup policy.
Ontario
Maximum 8% where permitted.
New Brunswick
No markup on the cost of drug ingredients from April 1 to May 31, 2012. For the remainder of fiscal year 2012/13, a 4% markup to a maximum of $50 was allowed on interchangeable drugs.
Nova Scotia
Manufacturer list price plus 10.5% (maximum $250) including methadone, or the Maximum Reimbursable Price (MRP) or the Pharmacare Reimbursement Price (PRP) plus 6.0% (maximum $250) plus $0.75 transition fee. Exceptions include: ostomy supplies—AAC plus 10.0% (maximum $50) plus a $0.75 transition fee; and compounded extemporaneous products (except methadone and injectables)—AAC plus 2.0% (maximum $50) plus $0.75 transition fee.
Prince Edward Island
Effective October 1, 2012, a maximum 6% markup was allowed for drugs on a Maximum Reimbursable Price (MRP) list; and 10% on the ingredient cost for brand-name drugs for which the prescription cost was $2,702 or less, to a maximum of $250 per prescription, and 9.25% on the ingredient cost for brand-name drugs for which the prescription cost was $2,703 or more.
Newfoundland and Labrador
A markup of 8.5%, which was included in the list price on the benefit list.
NIHB
Pharmacy reimbursement, which may or may not include markup, was determined by the NIHB or negotiated between the NIHB and pharmacists’ associations, and differed by province.
Appendix D: Dispensing Fee Policies in Public Drug Plans, 2012/13
Table D1 provides a summary of dispensing fee reimbursement in 2012/13 for the public drug plans participating in the NPDUIS initiative.Footnote 2
Table D1: Public drug plan dispensing fee reimbursement, 2012/13
British Columbia
In 2012/13, the maximum allowable dispensing fee was $10.00. No dispensing fee was reimbursed for insulins, or needles and syringes for insulin therapy. Other reimbursements included pharmacies providing services to long-term care facilities which received $43.75 per bed serviced. A rural incentive program provided a per claim subsidy ($3.00 to $10.50) to rural pharmacies with monthly claims volumes of less than 1,700. A vaccination administration program reimbursed pharmacies $10 for each publicly funded vaccination administered by an authorized pharmacist.
Alberta
Alberta reimbursed a dispensing fee to pharmacies and an additional inventory allowance. Fees charged varied based on the acquisition cost of the drug. From April 1, 2012, to March 31, 2013, the fees were as follows:
blank
| Acquisition cost |
Dispensing fee |
Additional inventory allowance |
| Up to $74.99 |
$10.22 |
$1.71 |
| $75–$149.99 |
$15.53 |
$2.00 |
| $150 and more |
$20.94 |
$5.03 |
Alberta also reimbursed an additional charge of up to 75 cents per minute in excess of seven minutes for compounded prescriptions. For some categories of drugs, such as insulin and oral contraceptives, the pharmacy reimbursement could not exceed the acquisition cost of the drug product multiplied by 5/3.
Saskatchewan
The maximum dispensing fee was set at $10.25 for 2012/13. Saskatchewan provided an additional reimbursement for trial prescriptions, methadone, compliance packaging and compounding drugs.
Manitoba
In Manitoba, pharmacy service providers were compensated by a market-based professional fee. The dispensing fee or professional fee is an all-inclusive fee that reimburses for the direct and indirect costs associated with dispensing, distribution, and cognitive service functions including patient counseling, and profit. Dispensing fees are regulated under the Prescription Drugs Payment of Benefits Regulation which defines the professional fee as “the amount regularly charged by a pharmacist to persons who are responsible for paying the fee without reimbursement”. The regulation ensures that pharmacy service providers establish a consistent market-based fee for which cash paying customers are provided equivalent services to that of Pharmacare beneficiaries. Other reimbursements included a maximum dispensing fee of $6.95 for the Employment and Income Assistance Program. For personal care homes, pharmacists were reimbursed $37.50 per bed per month in Winnipeg and $38.20 per bed per month for rural areas.
Ontario
Dispensing fees for non-rural pharmacies were $8.40; for rural pharmacies, the fees ranged from $9.45 to $12.61 for 2012/2013. Dispensing fees were set at a maximum of two fees per medication per patient per month; exceptions included patients in long-term care homes, homes for special care and/or drugs on the exemption medication list.
New Brunswick
The amounts paid for dispensing fees changed on June 1, 2012, as follows: $10.40 for each prescription of an interchangeable drug and a variable-rate schedule for the reimbursement of non-interchangeable drugs or extemporaneous preparations, as described in the following table.
blank
| Drug cost |
Dispensing fees for
non-interchangeable
drugs |
Dispensing fees for
extemporaneous
preparation |
| $0–$99.99 |
$10.40 |
$15.60 |
| $100–$199.99 |
$12.90 |
$19.35 |
| $200–$499.99 |
$18.00 |
$20.00 |
| $500–$999.99 |
$23.00 |
$23.00 |
| $1,000–$1,999.99 |
$63.00 |
$63.00 |
| $2,000–$2,999.99 |
$83.00 |
$83.00 |
| $3,000–$3,999.99 |
$103.00 |
$103.00 |
| $4,000–$4,999.99 |
$123.00 |
$123.00 |
| $5,000–$5,999.99 |
$143.00 |
$143.00 |
| Greater than or equal to $6,000 |
$163.00 |
$163.00 |
A rural pharmacy incentive paid an additional $2 for the first 10,000 prescriptions filled in a fiscal year. This incentive applied to pharmacies that were 25 km or more apart.
Nova Scotia
Dispensing fees for drugs or supplies including methadone were reimbursed at $10.90. The exception was compounded extemporaneous products (except methadone and injectables) which were reimbursed at $16.35.
Prince Edward Island
A new Pharmacy Services Agreement was signed that increased the maximum allowable dispensing fee from $8.20 to $11.65, effective October 1, 2012. The maximum allowable extemporaneous fee was 1.5 times the maximum allowable dispensing fee. The government reimbursed the retail pharmacy usual and customary fee charged to customers who are not eligible under the plan up to the maximum allowable dispensing fee, as per the agreement.
Newfoundland and Labrador
The dispensing fee schedule for the Foundation Plan, Access Plan and Assurance Plan from changed on April 16, 2012 to:
blank
| Drug cost |
Dispensing fee |
| $0–$49.99 |
$10.90 |
| $50.00–$249.99 |
$21.95 |
| $250.00 + |
$49.85 |
An extemporaneous preparations fee 1.5 times the dispensing fee was reimbursed for compound products. This applied to compounds that contain three or more ingredients.
The dispensing fee schedule for the 65Plus Plan changed on April 16, 2012 to:
blank
| Drug cost |
Dispensing fee |
| $0–$249.99 |
$10.90 |
| $250.00 + |
$35.59 |
NIHB
Pharmacy reimbursement, which included dispensing fees, was determined by the NIHB, or negotiated between the NIHB and pharmacists’ associations, and differed by province.
Appendix E: Top 100 Patented Drugs by Drug Cost, NPDUIS Select Public Drug Plans, 2012/13 ($million)
Table: Appendix E
| Rank |
Trade name(Ingredient) |
Manufacturer |
Total* |
AB |
SK |
MB |
ON |
NB |
NS |
PEI |
NIHB |
| 1 |
Lucentis (ranibizumab) |
Novartis Pharmaceuticals Canada Inc. |
$234.94 |
$42.62 |
$2.64 |
– |
$185.64 |
$3.55 |
– |
$0.21 |
$0.28 |
| 2 |
Remicade (infliximab) |
Janssen Inc. |
$173.70 |
$39.56 |
$19.36 |
$20.41 |
$74.02 |
$5.59 |
$8.90 |
$2.14 |
$3.73 |
| 3 |
Advair (salmeterol) |
GlaxoSmithKline Inc. |
$134.37 |
$19.28 |
$4.90 |
$10.91 |
$87.22 |
$4.05 |
$3.10 |
$0.27 |
$4.65 |
| 4 |
Spiriva (tiotropium) |
Boehringer Ingelheim |
$89.93 |
$13.43 |
$3.07 |
$1.62 |
$66.21 |
$2.02 |
$2.11 |
$0.21 |
$1.27 |
| 5 |
Aricept (donepezil hydrochloride) |
Pfizer Canada Inc. |
$89.35 |
$7.79 |
$1.45 |
$2.55 |
$72.74 |
$1.80 |
$2.33 |
$0.41 |
$0.29 |
| 6 |
Enbrel (etanercept) |
Immunex Corporation |
$78.71 |
$17.01 |
$7.48 |
$12.87 |
$28.93 |
$2.36 |
$3.14 |
$0.63 |
$6.29 |
| 7 |
Ezetrol (ezetimibe) |
Merck Canada Inc. |
$77.52 |
$6.86 |
$6.36 |
$1.32 |
$57.73 |
$1.78 |
$1.83 |
$0.14 |
$1.50 |
| 8 |
Humira (adalimumab) |
AbbVie Corporation |
$75.80 |
$22.46 |
$10.39 |
$14.48 |
$15.82 |
$2.11 |
$5.42 |
$1.45 |
$3.67 |
| 9 |
Coversyl (perindopril erbumine) |
Servier Canada Inc. |
$64.41 |
$6.65 |
$4.60 |
$3.50 |
$43.13 |
$2.24 |
$1.80 |
$0.28 |
$2.21 |
| 10 |
Januvia (sitagliptin) |
Merck Canada Inc. |
$64.27 |
$0.97 |
$0.93 |
$0.46 |
$58.69 |
$0.30 |
$0.40 |
– |
$2.52 |
| 11 |
Lantus (insulin glargine) |
Sanofi-aventis Canada Inc. |
$59.00 |
$5.29 |
$4.52 |
$1.83 |
$40.87 |
$0.19 |
$0.25 |
$0.00 |
$6.05 |
| 12 |
Oxyneo (oxycodone hydrochloride) |
Purdue Pharma |
$57.20 |
$7.16 |
$1.62 |
$2.90 |
$42.69 |
$0.90 |
$0.25 |
$0.05 |
$1.63 |
| 13 |
Crestor (rosuvastatin) |
AstraZeneca Canada Inc.. |
$57.06 |
$5.01 |
$2.73 |
$7.72 |
$38.66 |
$0.41 |
$0.64 |
$0.13 |
$1.77 |
| 14 |
Cymbalta (duloxetine) |
Eli Lilly Canada Inc. |
$54.33 |
$4.59 |
$0.14 |
$2.09 |
$47.04 |
$0.12 |
$0.15 |
– |
$0.20 |
| 15 |
Revlimid (lenalidomide) |
Celgene Inc. |
$53.06 |
– |
– |
$4.12 |
$44.82 |
$1.88 |
$1.83 |
– |
$0.41 |
| 16 |
Cipralex (escitalopram) |
Lundbeck Canada Inc. |
$50.92 |
$3.95 |
– |
$0.01 |
$45.63 |
– |
$0.02 |
$0.00 |
$1.31 |
| 17 |
Symbicort (budesonide, formoterol fumarate dihydrate) |
AstraZeneca Canada Inc.. |
$49.97 |
$9.56 |
$2.51 |
$4.13 |
$30.71 |
$0.78 |
$0.94 |
$0.11 |
$1.23 |
| 18 |
Celebrex (celecoxib) |
Pfizer Canada Inc. |
$44.28 |
$4.65 |
$3.36 |
$2.82 |
$29.80 |
$1.75 |
$0.39 |
$0.00 |
$1.50 |
| 19 |
Flovent (fluticasone propionate) |
GlaxoSmithKline Inc. |
$43.82 |
$1.64 |
$3.56 |
$3.07 |
$24.83 |
$2.24 |
$1.64 |
$0.33 |
$6.51 |
| 20 |
Gleevec (imatinib) |
Novartis Pharmaceuticals Canada Inc. |
$39.97 |
– |
– |
$4.77 |
$31.35 |
$1.30 |
$1.39 |
$0.32 |
$0.85 |
| 21 |
Tecta (pantoprazole) |
Takeda Canada Inc. |
$36.81 |
$2.63 |
$1.29 |
– |
$24.26 |
$4.79 |
$2.18 |
$0.54 |
$1.10 |
| 22 |
Copaxone (glatiramer acetate) |
Teva Pharmaceutical Industries Ltd |
$31.77 |
$12.89 |
$4.72 |
$3.51 |
$8.17 |
$1.39 |
– |
$0.51 |
$0.59 |
| 23 |
Pradaxa (dabigatran etexilate) |
Boehringer Ingelheim |
$30.98 |
$4.07 |
$0.88 |
$0.39 |
$24.94 |
$0.33 |
$0.30 |
$0.00 |
$0.06 |
| 24 |
Atripla (emtricitabine, tenofovir disoproxil fumarate, efavirenz) |
Bristol-Myers Squibb and Gilead Sciences LLC |
$29.65 |
– |
$1.69 |
$1.18 |
$23.64 |
$0.94 |
– |
– |
$2.20 |
| 25 |
Truvada (tenofovir disoproxil fumarate, emtricitabine) |
Gilead Sciences Canada Inc. |
$28.20 |
– |
$0.97 |
$2.15 |
$21.78 |
$0.82 |
– |
– |
$2.47 |
| 26 |
Risperdal (risperidone) |
Janssen Inc. |
$28.00 |
$0.45 |
$1.49 |
$1.54 |
$19.66 |
$1.97 |
$0.21 |
$0.27 |
$2.42 |
| 27 |
Detrol (tolterodine tartrate) |
Pfizer Canada Inc. |
$27.22 |
$2.38 |
$1.08 |
$1.00 |
$21.27 |
$0.57 |
$0.43 |
$0.03 |
$0.46 |
| 28 |
Seroquel (quetiapine) |
AstraZeneca Canada Inc.. |
$26.24 |
$0.20 |
$2.00 |
$0.96 |
$22.32 |
$0.67 |
$0.02 |
blank |
$0.06 |
| 29 |
Eprex (epoetin alfa) |
Janssen Inc. |
$22.42 |
$1.91 |
$2.33 |
$0.48 |
$15.01 |
$0.95 |
$0.30 |
blank |
$1.45 |
| 30 |
Tiazac (diltiazem hydrochloride) |
Valeant Canada LP/Valeant Canada S.E.C. |
$22.36 |
$3.51 |
$0.64 |
$1.47 |
$15.09 |
$0.60 |
$0.57 |
$0.11 |
$0.37 |
| 31 |
Novorapid (insulin aspart) |
Novo Nordisk Canada Inc. |
$22.08 |
$1.93 |
$0.85 |
$1.98 |
$14.19 |
$0.35 |
$0.59 |
$0.46 |
$1.74 |
| 32 |
Coversyl (perindopril erbumine, indapamide) |
Servier Canada Inc. |
$21.31 |
$2.77 |
$2.61 |
$1.85 |
$11.57 |
$0.94 |
$0.70 |
$0.08 |
$0.80 |
| 33 |
Actonel (risedronate sodium) |
Warner Chilcott Canada Co. |
$21.29 |
$0.08 |
$1.14 |
$0.01 |
$20.00 |
$0.01 |
$0.01 |
$0.00 |
$0.04 |
| 34 |
Kivexa (abacavir) |
ViiV Healthcare ULC |
$20.23 |
– |
$0.55 |
$2.18 |
$15.34 |
$0.44 |
– |
– |
$1.71 |
| 35 |
Levemir (insulin detemir) |
Novo Nordisk Canada Inc. |
$19.69 |
$2.52 |
$1.16 |
$0.00 |
$15.39 |
$0.00 |
$0.07 |
– |
$0.55 |
| 36 |
Avonex (interferon beta-1a) |
Biogen Idec Canada Inc. |
$18.72 |
$3.23 |
$1.37 |
$3.31 |
$7.57 |
$2.44 |
– |
$0.39 |
$0.41 |
| 37 |
Neupogen (filgrastim) |
Amgen Canada Inc. |
$18.53 |
$1.61 |
$0.22 |
$0.81 |
$14.22 |
$0.59 |
– |
$0.24 |
$0.83 |
| 38 |
Lupron (leuprolide acetate) |
AbbVie Corporation |
$18.15 |
$0.09 |
$0.33 |
$0.27 |
$15.76 |
$0.46 |
$0.60 |
$0.12 |
$0.52 |
| 39 |
Abilify (aripiprazole) |
Bristol-Myers Squibb Canada |
$17.34 |
$0.42 |
$0.23 |
$1.12 |
$14.74 |
$0.29 |
$0.08 |
$0.00 |
$0.46 |
| 40 |
Botox (onabotulinumtoxina) |
Allergan Inc. |
$17.22 |
$2.10 |
$0.72 |
$1.16 |
$11.59 |
$0.56 |
$0.51 |
– |
$0.58 |
| 41 |
Invega (paliperidone) |
Janssen Inc. |
$17.21 |
$0.30 |
$0.54 |
$0.01 |
$15.89 |
– |
$0.01 |
– |
$0.46 |
| 42 |
Viread (tenofovir disoproxil fumarate) |
Gilead Sciences Canada Inc. |
$16.65 |
$1.75 |
$0.19 |
$0.95 |
$13.47 |
$0.10 |
$0.05 |
– |
$0.14 |
| 43 |
Janumet (sitagliptin) |
Merck Canada Inc. |
$16.31 |
$0.43 |
$0.22 |
– |
$15.02 |
$0.06 |
$0.05 |
– |
$0.54 |
| 44 |
Reyataz (atazanavir) |
Bristol-Myers Squibb Canada |
$15.15 |
– |
$0.56 |
$1.27 |
$11.06 |
$0.51 |
– |
– |
$1.76 |
| 45 |
Simponi (golimumab) |
Janssen Inc. |
$15.01 |
$3.64 |
$1.45 |
– |
$7.51 |
$0.46 |
$0.65 |
$0.10 |
$1.19 |
| 46 |
Prograf (tacrolimus) |
Astellas Pharma Canada Inc. |
$14.91 |
– |
$1.21 |
$2.11 |
$9.56 |
$0.96 |
– |
– |
$1.07 |
| 47 |
Prezista (darunavir) |
Janssen Inc. |
$14.73 |
– |
$0.46 |
$1.24 |
$11.18 |
$0.46 |
– |
– |
$1.39 |
| 48 |
Sutent (sunitinib) |
Pfizer Canada Inc. |
$13.38 |
– |
– |
$1.23 |
$9.81 |
$0.72 |
$0.87 |
$0.34 |
$0.42 |
| 49 |
Fosavance (alendronic acid) |
Merck Canada Inc. |
$13.16 |
$0.42 |
$0.33 |
– |
$12.26 |
$0.02 |
$0.06 |
$0.00 |
$0.07 |
| 50 |
Wellbutrin (bupropion hydrochloride) |
Valeant Canada LP/Valeant Canada S.E.C. |
$13.14 |
$1.49 |
$1.43 |
$1.84 |
$7.21 |
$0.26 |
$0.20 |
$0.01 |
$0.71 |
| 51 |
Tracleer (bosentan) |
Actelion Pharmaceuticals Ltd |
$12.91 |
– |
$0.34 |
$2.64 |
$9.01 |
$0.17 |
$0.17 |
$0.02 |
$0.57 |
| 52 |
Gd (amlodipine) |
GenMed, a Division Of Pfizer Canada Inc.. |
$11.98 |
$0.01 |
$3.28 |
$2.27 |
$5.75 |
$0.08 |
$0.32 |
– |
$0.27 |
| 53 |
Soliris (eculizumab) |
Alexion Pharma International Sarl |
$11.73 |
$1.61 |
– |
$0.38 |
$9.74 |
– |
– |
– |
blank |
| 54 |
Stelara (ustekinumab) |
Janssen Inc. |
$11.60 |
$2.71 |
$0.68 |
$0.35 |
$6.47 |
$0.22 |
$0.85 |
– |
$0.32 |
| 55 |
Isentress (raltegravir) |
Merck Canada Inc. |
$11.18 |
– |
$0.26 |
$0.50 |
$9.75 |
$0.38 |
– |
– |
$0.29 |
| 56 |
Concerta (methylphenidate hydrochloride) |
Janssen Inc. |
$11.18 |
– |
$3.94 |
$2.53 |
$3.47 |
$0.02 |
$0.03 |
$0.01 |
$1.18 |
| 57 |
Accupril (quinapril) |
Pfizer Canada Inc. |
$11.13 |
$1.29 |
$0.73 |
$0.90 |
$7.40 |
$0.09 |
$0.30 |
$0.04 |
$0.39 |
| 58 |
Temodal (temozolomide) |
Merck Canada Inc. |
$11.10 |
blank |
blank |
$1.58 |
$8.26 |
$0.36 |
$0.67 |
$0.05 |
$0.18 |
| 59 |
Rituxan (rituximab) |
Hoffmann-La Roche Limited |
$10.76 |
$1.54 |
$0.70 |
$1.07 |
$5.55 |
$0.12 |
$0.66 |
$0.05 |
$1.08 |
| 60 |
Novomix (insulin aspart protamine, insulin aspart) |
Novo Nordisk Canada Inc. |
$10.65 |
– |
– |
– |
$10.65 |
– |
– |
– |
$0.00 |
| 61 |
Champix (varenicline) |
Pfizer Canada Inc. |
$10.65 |
$0.74 |
$1.42 |
$1.89 |
$5.30 |
– |
– |
– |
$1.29 |
| 62 |
Betaseron (interferon beta-1b) |
Bayer Inc. |
$10.56 |
$1.84 |
$1.73 |
$1.89 |
$4.38 |
$0.58 |
– |
$0.07 |
$0.07 |
| 63 |
Aranesp (darbepoetin alfa) |
Amgen Canada Inc. |
$10.50 |
$7.38 |
$0.21 |
$0.01 |
$0.36 |
$1.17 |
$0.02 |
– |
$1.34 |
| 64 |
Orencia (abatacept) |
Bristol-Myers Squibb Canada |
$10.19 |
$2.25 |
$1.03 |
$0.74 |
$4.48 |
$0.11 |
$0.56 |
$0.06 |
$0.95 |
| 65 |
Myfortic (mycophenolic acid) |
Novartis Pharmaceuticals Canada Inc. |
$10.18 |
– |
$0.49 |
$0.08 |
$8.95 |
$0.32 |
$0.01 |
– |
$0.34 |
| 66 |
Ran (pantoprazole) |
Ranbaxy Pharmaceuticals Canada Inc.. |
$9.95 |
$3.61 |
$0.34 |
$0.15 |
$5.55 |
$0.11 |
$0.02 |
– |
$0.17 |
| 67 |
Atacand (candesartan cilexetil, hydrochlorothiazide) |
AstraZeneca Canada Inc.. |
$9.76 |
$1.51 |
$1.12 |
$0.73 |
$5.77 |
$0.14 |
$0.24 |
$0.03 |
$0.22 |
| 68 |
Pegasys (ribavirin, peginterferon alfa-2a) |
Hoffmann-La Roche Limited |
$9.40 |
$1.34 |
$0.91 |
$0.38 |
$5.85 |
$0.15 |
$0.12 |
– |
$0.64 |
| 69 |
Prolia (denosumab) |
Amgen Canada Inc. |
$9.28 |
$0.07 |
$0.02 |
$0.13 |
$8.97 |
$0.02 |
$0.06 |
– |
$0.02 |
| 70 |
Mavik (trandolapril) |
Abbott Laboratories, Limited |
$9.13 |
$1.08 |
$0.56 |
$0.68 |
$6.03 |
$0.08 |
$0.38 |
$0.03 |
$0.30 |
| 71 |
Humalog (insulin lispro) |
Eli Lilly Canada Inc. |
$8.85 |
$1.88 |
$1.32 |
$1.68 |
$0.93 |
$0.48 |
$0.35 |
$0.57 |
$1.64 |
| 72 |
Enbrel (etanercept, water) |
Immunex Corporation |
$8.76 |
$2.11 |
$0.44 |
$0.83 |
$3.25 |
$0.19 |
$0.86 |
$0.13 |
$0.93 |
| 73 |
Arimidex (anastrozole) |
AstraZeneca Canada Inc.. |
$8.37 |
– |
– |
$1.05 |
$6.43 |
$0.27 |
$0.32 |
$0.08 |
$0.22 |
| 74 |
Biaxin (clarithromycin) |
Abbott Laboratories, Limited |
$8.27 |
$0.83 |
$0.48 |
$0.75 |
$4.75 |
$0.16 |
$0.11 |
– |
$1.18 |
| 75 |
Novolin (insulin isophane human biosynthetic) |
Novo Nordisk Canada Inc. |
$7.98 |
$1.85 |
$0.79 |
$1.64 |
$0.26 |
$0.54 |
$1.49 |
$0.25 |
$1.15 |
| 76 |
Pulmicort (budesonide) |
AstraZeneca Canada Inc.. |
$7.92 |
$1.17 |
$1.40 |
$0.50 |
$3.54 |
$0.19 |
$0.43 |
$0.10 |
$0.62 |
| 77 |
Victrelis (boceprevir) |
Merck Canada Inc. |
$7.92 |
$0.07 |
$0.14 |
$0.20 |
$7.45 |
– |
$0.02 |
– |
$0.03 |
| 78 |
Diamicron (gliclazide) |
Servier Canada Inc. |
$7.91 |
$0.27 |
$0.38 |
$0.45 |
$6.03 |
$0.06 |
$0.23 |
$0.06 |
$0.42 |
| 79 |
Exjade (deferasirox) |
Novartis Pharmaceuticals Canada Inc. |
$7.90 |
$1.32 |
$0.41 |
$0.11 |
$5.54 |
$0.33 |
$0.14 |
– |
$0.05 |
| 80 |
Xarelto (rivaroxaban) |
Bayer Inc. |
$7.84 |
$0.74 |
$0.46 |
$0.39 |
$5.97 |
$0.11 |
$0.08 |
– |
$0.08 |
| 81 |
Lumigan (bimatoprost) |
Allergan Inc. |
$7.70 |
$1.76 |
$0.59 |
$1.37 |
$2.97 |
$0.23 |
$0.41 |
$0.09 |
$0.28 |
| 82 |
Kaletra (lopinavir, ritonavir) |
AbbVie Corporation |
$7.65 |
– |
$0.24 |
$0.77 |
$5.64 |
$0.09 |
– |
– |
$0.91 |
| 83 |
Vesicare (solifenacin succinate) |
Astellas Pharma Canada Inc. |
$7.64 |
$0.93 |
$0.19 |
$0.33 |
$5.56 |
$0.26 |
$0.21 |
$0.02 |
$0.14 |
| 84 |
Eligard (leuprolide acetate) |
Sanofi-aventis Canada Inc. |
$7.54 |
– |
– |
$0.01 |
$6.79 |
$0.22 |
$0.26 |
$0.13 |
$0.13 |
| 85 |
Omnaris (ciclesonide) |
Takeda Canada Inc. |
$7.28 |
– |
$0.17 |
– |
$7.11 |
– |
– |
– |
blank |
| 86 |
Atrovent (ipratropium bromide) |
Boehringer Ingelheim |
$7.28 |
$0.52 |
$0.48 |
$1.18 |
$2.41 |
$0.88 |
$1.00 |
$0.16 |
$0.64 |
| 87 |
Dovobet (calcipotriol, betamethasone) |
Leo Pharma Inc. |
$7.22 |
$0.73 |
$0.58 |
– |
$5.50 |
– |
– |
– |
$0.41 |
| 88 |
Avelox (moxifloxacin) |
Bayer Inc. |
$7.12 |
$0.81 |
$0.20 |
$0.43 |
$5.15 |
$0.27 |
$0.16 |
$0.01 |
$0.10 |
| 89 |
Myozyme (alglucosidase alfa) |
Genzyme Canada, a division of sanofi-aventis Canada, Inc. |
$7.04 |
– |
– |
$0.74 |
$6.30 |
– |
– |
– |
blank |
| 90 |
Onglyza (saxagliptin) |
AstraZeneca Canada Inc.. |
$6.97 |
$1.11 |
$0.20 |
$0.28 |
$5.31 |
– |
$0.00 |
– |
$0.07 |
| 91 |
Mirena (levonorgestrel) |
Bayer Inc. |
$6.93 |
$0.13 |
$1.05 |
$1.04 |
$1.96 |
$0.17 |
$0.03 |
$0.01 |
$2.54 |
| 92 |
Ran (rabeprazole sodium) |
Ranbaxy Pharmaceuticals Canada Inc.. |
$6.90 |
$0.22 |
$0.41 |
$0.15 |
$5.05 |
$0.17 |
$0.44 |
$0.09 |
$0.36 |
| 93 |
Lipitor (atorvastatin) |
Pfizer Canada Inc. |
$6.83 |
$0.64 |
$0.21 |
$0.06 |
$5.81 |
$0.02 |
$0.01 |
$0.01 |
$0.06 |
| 94 |
Humalog (insulin lispro, insulin lispro protamine suspension) |
Eli Lilly Canada Inc. |
$6.72 |
$0.79 |
– |
$0.50 |
$4.80 |
$0.22 |
$0.00 |
$0.10 |
$0.30 |
| 95 |
Nasonex (mometasone furoate) |
Merck Canada Inc. |
$6.71 |
$0.02 |
$2.60 |
$2.59 |
$0.00 |
$0.05 |
$0.00 |
$0.16 |
$1.30 |
| 96 |
Asacol (mesalazine) |
Warner Chilcott Canada Co. |
$6.60 |
$1.33 |
$1.03 |
$1.19 |
$2.23 |
$0.26 |
$0.22 |
$0.03 |
$0.30 |
| 97 |
Xeloda (capecitabine) |
Hoffmann-La Roche Limited |
$6.52 |
– |
– |
$0.80 |
$4.86 |
$0.20 |
$0.39 |
$0.12 |
$0.16 |
| 98 |
Nexium (esomeprazole) |
AstraZeneca Canada Inc.. |
$6.50 |
– |
$2.96 |
$3.53 |
– |
– |
$0.00 |
– |
$0.00 |
| 99 |
Travatan (travoprost) |
Alcon Canada Inc. |
$6.40 |
$1.06 |
$0.56 |
$0.72 |
$3.22 |
$0.25 |
$0.33 |
$0.07 |
$0.19 |
| 100 |
Actemra (tocilizumab) |
Hoffmann-La Roche Limited |
$6.36 |
$0.60 |
$0.62 |
$0.52 |
$3.93 |
$0.10 |
$0.18 |
– |
$0.41 |
| blank |
blank |
Total |
$2,655.87 |
$317.20 |
$147.99 |
$178.31 |
$1,776.43 |
$67.85 |
$57.06 |
$12.41 |
$98.63 |
| blank |
blank |
Share of all patented drugs |
88% |
90% |
85% |
85% |
89% |
85% |
87% |
92% |
83% |
*Total results for the select public drug plans reported in this table.
Data source: National Prescription Drug Utilization Information System Database, Canadian Institute for Health Information.
Appendix F: Top 100 Non-Patented Single Source Drugs by Drug Cost, NPDUIS Select Public Drug Plans, 2012/13 ($thousand)
Table: Appendix F
| Rank |
Trade name (ingredient) |
Manufacturer |
Total* |
AB |
SK |
MB |
ON |
NB |
NS |
PEI |
NIHB |
| 1 |
Avodart (dutasteride) |
GlaxoSmithKline Inc. |
$31,243 |
$4,636 |
$1,398 |
$1,346 |
$23,105 |
$359 |
$116 |
$14 |
$269 |
| 2 |
Arthrotec (diclofenac sodium, misoprostol) |
Pfizer Canada Inc. |
$25,942 |
$3,754 |
$2,280 |
$2,031 |
$14,314 |
$471 |
$589 |
– |
$2,503 |
| 3 |
Rebif (interferon beta-1a) |
EMD Serono, a division of EMD Inc. Canada |
$23,380 |
$7,371 |
$3,203 |
$2,142 |
$8,087 |
$1,655 |
– |
$434 |
$489 |
| 4 |
Fragmin anti-Xa (dalteparin sodium) |
Pfizer Canada Inc. |
$22,126 |
$2,785 |
$735 |
$2,463 |
$14,321 |
$314 |
$876 |
$0 |
$631 |
| 5 |
Zoladex LA injectiondepot (goserelin) |
AstraZeneca Canada Inc.. |
$21,484 |
$3 |
– |
$113 |
$19,212 |
$581 |
$1,076 |
$226 |
$273 |
| 6 |
Olmetec (olmesartan medoxomil) |
Merck Canada Inc. |
$13,590 |
$1,767 |
$1,597 |
– |
$8,662 |
$577 |
$483 |
$88 |
$416 |
| 7 |
Aggrenox (dipyridamole, acetylsalicylic acid) |
Boehringer Ingelheim |
$8,853 |
$1,051 |
$135 |
$106 |
$7,306 |
$44 |
$66 |
– |
$144 |
| 8 |
Innohep multi-dose vial (tinzaparin sodium) |
LEO Pharma Inc. |
$8,411 |
$2,964 |
$1,073 |
$11 |
$4,064 |
$72 |
$9 |
– |
$218 |
| 9 |
Humulin (insulin isophane) |
Eli Lilly Canada Inc. |
$7,521 |
$944 |
$1,429 |
$927 |
$988 |
$891 |
$836 |
$140 |
$1,365 |
| 10 |
Olestyr (cholestyramine resin) |
Pendopharm a division of Pharmascience Inc. |
$5,093 |
$635 |
$379 |
$268 |
$3,217 |
$174 |
$211 |
$44 |
$166 |
| 11 |
Trelstar (triptorelin) |
Paladin Labs Inc. |
$4,010 |
– |
– |
– |
$3,400 |
$84 |
$407 |
$99 |
$21 |
| 12 |
Elaprase (idursulfase) |
Shire Human Genetic Therapies Inc. |
$3,729 |
– |
– |
– |
$3,729 |
– |
– |
– |
– |
| 13 |
Dexedrine Spansule (dextroamphetamine sulfate) |
Paladin Labs Inc. |
$3,591 |
$617 |
$320 |
$564 |
$1,176 |
$107 |
$121 |
$15 |
$671 |
| 14 |
Tri-Cyclen (norgestimate, norgestimate, norgestimate) |
Janssen Inc. |
$3,382 |
$86 |
$1,105 |
$1,032 |
$534 |
$66 |
$33 |
$10 |
$518 |
| 15 |
pms-Ramipril-HCTZ (ramipril, hydrochlorothiazide) |
Pharmascience Inc. |
$2,764 |
$238 |
$275 |
– |
$1,783 |
$132 |
$203 |
$19 |
$113 |
| 16 |
Bezalip SR (bezafibrate) |
Actavis Group PTC ehf |
$2,585 |
$269 |
$7 |
$443 |
$1,716 |
$15 |
$40 |
– |
$95 |
| 17 |
Dilantin (phenytoin sodium) |
Pfizer Canada Inc. |
$2,499 |
$196 |
$194 |
$246 |
$1,465 |
$78 |
$62 |
$17 |
$241 |
| 18 |
Serevent Diskus (salmeterol) |
GlaxoSmithKline Inc. |
$2,370 |
$249 |
$169 |
$206 |
$1,476 |
$104 |
$31 |
$6 |
$129 |
| 19 |
Fucidin (fusidic acid) |
LEO Pharma Inc. |
$2,333 |
$145 |
$338 |
$133 |
$1,339 |
$106 |
$51 |
$5 |
$215 |
| 20 |
Codeine Contin controlled release (codeine) |
Purdue Pharma |
$2,294 |
blank |
$57 |
$162 |
$1,550 |
$116 |
$76 |
$2 |
$331 |
| 21 |
HP-Pac (lansoprazole, amoxicillin, clarithromycin) |
Takeda Pharmaceuticals America Inc. |
$2,226 |
$203 |
$99 |
$55 |
$1,155 |
$7 |
$47 |
– |
$659 |
| 22 |
Remodulin (treprostinil) |
United Therapeutics Corporation |
$2,114 |
– |
$81 |
$153 |
$1,103 |
$588 |
– |
– |
$188 |
| 23 |
Fluanxol Depot (flupentixol decanoate) |
Lundbeck Canada Inc. |
$2,079 |
$50 |
$170 |
$109 |
$1,514 |
$38 |
$27 |
– |
$170 |
| 24 |
Nitoman (tetrabenazine) |
Valeant Canada LP / Valeant Canada S.E.C. |
$1,985 |
$162 |
$144 |
$258 |
$1,041 |
$149 |
$32 |
$22 |
$178 |
| 25 |
Suboxone (buprenorphine, naloxone (naloxone hydrochloride dihydrate)) |
RB Pharmaceuticals Limited |
$1,901 |
$123 |
$10 |
$46 |
$1,617 |
$29 |
$8 |
$21 |
$47 |
| 26 |
Humatrope (somatropin, diluent) |
Eli Lilly Canada Inc. |
$1,697 |
$227 |
$12 |
$362 |
$917 |
$99 |
$6 |
– |
$75 |
| 27 |
pms-Testosterone (testosterone undecanoate) |
Pharmascience Inc. |
$1,619 |
– |
– |
– |
$1,460 |
$24 |
$73 |
$1 |
$60 |
| 28 |
Cerezyme (imiglucerase) |
Genzyme Canada, a division of Sanofi-aventis Canada Inc. |
$1,605 |
– |
– |
$935 |
– |
– |
– |
– |
$670 |
| 29 |
Prolopa (levodopa, benserazide) |
Hoffmann-La Roche Limited |
$1,478 |
$101 |
$48 |
$78 |
$1,216 |
$3 |
$23 |
blank |
$8 |
| 30 |
Elmiron (pentosan polysulfate sodium) |
Janssen Inc. |
$1,451 |
$302 |
$56 |
$326 |
$269 |
$131 |
$217 |
$14 |
$135 |
| 31 |
Lotriderm (clotrimazole, betamethasone) |
Merck Canada Inc. |
$1,395 |
$443 |
$343 |
$40 |
– |
$125 |
$210 |
blank |
$234 |
| 32 |
Thyrogen (thyrotropin alfa) |
Genzyme Canada, a division of Sanofi-aventis Canada Inc. |
$1,328 |
$251 |
– |
– |
$992 |
– |
$46 |
– |
$38 |
| 33 |
Granisetron (granisetron) |
AA Pharma Inc. |
$1,310 |
$195 |
blank |
blank |
$1,032 |
$22 |
– |
– |
$60 |
| 34 |
Imipramine (imipramine hydrochloride) |
AA Pharma Inc. |
$1,268 |
$162 |
$133 |
$132 |
$689 |
$33 |
$62 |
$14 |
$43 |
| 35 |
Trizivir (abacavir, lamivudine, zidovudine) |
ViiV Healthcare ULC |
$1,198 |
– |
$18 |
– |
$1,068 |
$37 |
– |
– |
$75 |
| 36 |
Lomotil (diphenoxylate hydrochloride, atropine sulfate) |
Pfizer Canada Inc. |
$1,194 |
$285 |
$94 |
$24 |
$725 |
$30 |
$30 |
– |
$6 |
| 37 |
Soriatane (acitretin) |
Actavis Group PTC ehf |
$1,189 |
$92 |
$72 |
$108 |
$727 |
$35 |
$61 |
$5 |
$88 |
| 38 |
Delatestryl (testosterone enanthate) |
Valeant Canada LP / Valeant Canada S.E.C. |
$1,150 |
$258 |
$114 |
$105 |
$578 |
$7 |
$24 |
$2 |
$61 |
| 39 |
Ratio-IPRA SAL UDV (salbutamol, ipratropium bromide) |
Teva Canada Limited |
$1,115 |
$233 |
$409 |
$126 |
$224 |
$1 |
$66 |
$7 |
$48 |
| 40 |
Purinethol (mercaptopurine) |
Teva Canada Limited |
$1,106 |
– |
$42 |
$252 |
$692 |
$28 |
$23 |
$2 |
$68 |
| 41 |
Mestinon USP (pyridostigmine bromide) |
Valeant Canada LP / Valeant Canada S.E.C. |
$1,070 |
$160 |
$99 |
$105 |
$593 |
$26 |
$39 |
$5 |
$45 |
| 42 |
Metadol (methadone hydrochloride) |
Paladin Labs Inc. |
$1,052 |
$371 |
$51 |
$5 |
$235 |
$38 |
$72 |
$222 |
$59 |
| 43 |
Micronor (norethindrone) |
Janssen Inc. |
$1,007 |
$19 |
$275 |
$284 |
$187 |
$16 |
$15 |
$2 |
$209 |
| 44 |
One alpha (alfacalcidol) |
LEO Pharma Inc. |
$1,001 |
$63 |
$50 |
$13 |
$720 |
$44 |
$24 |
$1 |
$86 |
| 45 |
Triquilar (levonorgestrel, levonorgestrel, levonorgestrel) |
Bayer Inc. |
$935 |
$25 |
$277 |
$310 |
$110 |
$15 |
$7 |
$2 |
$189 |
| 46 |
Flolan (epoprostenol) |
GlaxoSmithKline Inc. |
$925 |
– |
$29 |
– |
$729 |
$94 |
blank |
$60 |
$12 |
| 47 |
Suprefact Depot (buserelin) |
Sanofi-aventis Canada Inc. |
$903 |
– |
– |
$7 |
$836 |
$10 |
$45 |
– |
$5 |
| 48 |
Glucagon (glucagon) |
Eli Lilly Canada Inc. |
$879 |
$40 |
$46 |
$62 |
$644 |
$24 |
$20 |
– |
$43 |
| 49 |
Benzaclin Topical (benzoyl peroxide, clindamycin) |
Valeant Canada LP / Valeant Canada S.E.C. |
$797 |
$5 |
$342 |
– |
$450 |
– |
– |
– |
– |
| 50 |
Nplate (romiplostim) |
Amgen Canada Inc. |
$797 |
– |
– |
– |
$797 |
– |
– |
– |
– |
| 51 |
Betoptic S Ophthalmic (betaxolol) |
Alcon Canada Inc. |
$789 |
$87 |
$46 |
$55 |
$515 |
$26 |
$39 |
$8 |
$12 |
| 52 |
Cyclen (norgestimate, ethinyl estradiol) |
Janssen Inc. |
$752 |
$30 |
$304 |
$214 |
$113 |
– |
$9 |
$1 |
$80 |
| 53 |
Pancrease MT (lipase, protease, amylase) |
Janssen Inc. |
$727 |
$264 |
$125 |
$103 |
$91 |
$16 |
$36 |
– |
$93 |
| 54 |
Vepesid (etoposide) |
Bristol-Myers Squibb Canada |
$725 |
– |
– |
$5 |
$675 |
$10 |
$25 |
– |
$10 |
| 55 |
Efudex (fluorouracil) |
Valeant Canada LP / Valeant Canada S.E.C. |
$718 |
$99 |
$59 |
$69 |
$442 |
$26 |
$13 |
$6 |
$4 |
| 56 |
Locacorten Vioform Eardrops (flumethasone pivalate, clioquinol) |
Paladin Labs Inc. |
$698 |
$40 |
$61 |
$66 |
$436 |
$15 |
$17 |
$4 |
$58 |
| 57 |
Clopixol Depot (zuclopenthixol decanoate) |
Lundbeck Canada Inc. |
$688 |
$33 |
$99 |
$22 |
$375 |
$54 |
$4 |
$1 |
$101 |
| 58 |
Desipramine (desipramine) |
AA Pharma Inc. |
$668 |
$69 |
$67 |
$81 |
$371 |
$17 |
$29 |
$5 |
$29 |
| 59 |
Hydroval (hydrocortisone valerate) |
TaroPharma, a division of Taro Pharmaceuticals Inc. |
$654 |
$42 |
$17 |
$12 |
$530 |
$16 |
$8 |
– |
$28 |
| 60 |
Teva-chlorpromazine (chlorpromazine) |
Teva Canada Limited |
$597 |
$23 |
$53 |
$80 |
$327 |
$48 |
$20 |
$6 |
$40 |
| 61 |
Glycopyrrolate Injection USP (glycopyrrolate) |
Sandoz Canada Incorporated |
$564 |
$44 |
– |
$44 |
$268 |
$86 |
$73 |
– |
$48 |
| 62 |
Midodrine (midodrine hydrochloride) |
AA Pharma Inc. |
$559 |
$45 |
$13 |
$54 |
$406 |
$14 |
$9 |
$1 |
$18 |
| 63 |
Apo-Enalapril Maleate/HCTZ (enalapril maleate, hydrochlorothiazide) |
Apotex Incorporated |
$552 |
$140 |
$235 |
$51 |
– |
$25 |
$58 |
– |
$42 |
| 64 |
Mepron (atovaquone) |
GlaxoSmithKline Inc. |
$543 |
$56 |
$4 |
$59 |
$362 |
$11 |
– |
– |
$52 |
| 65 |
Flagystatin Vaginal Ovule (nystatin, metronidazole) |
Sanofi-aventis Canada Inc. |
$491 |
$39 |
– |
$5 |
$357 |
$5 |
$12 |
$1 |
$73 |
| 66 |
ISDN (isosorbide dinitrate) |
AA Pharma Inc. |
$474 |
$14 |
$9 |
$44 |
$364 |
$15 |
$13 |
$5 |
$11 |
| 67 |
Methyldopa (methyldopa) |
AA Pharma Inc. |
$458 |
$36 |
$59 |
$37 |
$264 |
$20 |
$18 |
$2 |
$23 |
| 68 |
Tears Naturale II Drop (hypromellose, dextran) |
Alcon Canada Inc. |
$457 |
– |
– |
$3 |
$308 |
– |
$94 |
– |
$52 |
| 69 |
Duvoid (bethanechol chloride) |
Paladin Labs Inc. |
$456 |
– |
$17 |
$42 |
$317 |
$35 |
$28 |
$3 |
$14 |
| 70 |
Trifluoperazine (trifluoperazine) |
AA Pharma Inc. |
$441 |
$22 |
$42 |
$56 |
$255 |
$23 |
$26 |
$6 |
$10 |
| 71 |
Cyclomen (danazol) |
Sanofi-aventis Canada Inc. |
$435 |
$42 |
$37 |
$24 |
$267 |
$14 |
$19 |
– |
$31 |
| 72 |
Apo-lamivudine-zidovudine (lamivudine, zidovudine) |
Apotex Incorporated |
$434 |
– |
– |
$43 |
$297 |
$48 |
– |
– |
$46 |
| 73 |
Topicort Mild (desoximetasone) |
Valeant Canada LP / Valeant Canada S.E.C. |
$419 |
$132 |
$45 |
$89 |
– |
$27 |
$30 |
$12 |
$85 |
| 74 |
Tapazole (thiamazole) |
Paladin Labs Inc. |
$419 |
$69 |
$85 |
$144 |
$1 |
$9 |
$19 |
$5 |
$87 |
| 75 |
CO exemestane (exemestane) |
Cobalt Pharmaceuticals Company |
$418 |
– |
– |
$22 |
$321 |
$24 |
$39 |
$4 |
$8 |
| 76 |
Zaroxolyn (metolazone) |
Sanofi-aventis Canada Inc. |
$417 |
$75 |
$43 |
$35 |
$231 |
$5 |
$12 |
$1 |
$15 |
| 77 |
Minestrin (norethindrone acetate, ethinyl estradiol) |
Warner Chilcott Canada Co. |
$413 |
$14 |
$144 |
$119 |
$68 |
$8 |
$4 |
$0 |
$56 |
| 78 |
Modafinil (modafinil) |
AA Pharma Inc. |
$401 |
$57 |
$29 |
$116 |
$109 |
$30 |
$2 |
$1 |
$56 |
| 79 |
Fludara (fludarabine phosphate) |
Sanofi-aventis Canada Inc. |
$400 |
– |
– |
blank |
$393 |
blank |
– |
– |
$6 |
| 80 |
Cytomel (liothyronine) |
Pfizer Canada Inc. |
$383 |
$175 |
– |
$150 |
$7 |
$19 |
$13 |
– |
$19 |
| 81 |
Misoprostol (misoprostol) |
AA Pharma Inc. |
$379 |
$27 |
$15 |
$25 |
$234 |
$15 |
$22 |
$15 |
$26 |
| 82 |
Aldara p (imiquimod) |
Valeant Canada LP / Valeant Canada S.E.C.. |
$365 |
$102 |
$31 |
$89 |
$24 |
$53 |
$20 |
$22 |
$22 |
| 83 |
Propyl-Thyracil (propylthiouracil) |
Paladin Labs Inc. |
$360 |
$12 |
$40 |
$37 |
$237 |
$5 |
$6 |
$1 |
$22 |
| 84 |
Dantrium (dantrolene sodium) |
JHP Pharmaceuticals LLC |
$360 |
$22 |
$69 |
$19 |
$198 |
$26 |
$4 |
$2 |
$20 |
| 85 |
Midamor (amiloride hydrochloride) |
AA Pharma Inc. |
$359 |
$47 |
$15 |
$15 |
$258 |
$4 |
$14 |
– |
$6 |
| 86 |
Cyklokapron (tranexamic acid) |
Pfizer Canada Inc. |
$343 |
$79 |
– |
$71 |
$38 |
$21 |
$11 |
– |
$125 |
| 87 |
Klean prep pdr sol (potassium chloride, polyethylene glycol 3350, sodium sulfate) |
Pendopharm, a division of Pharmascience Inc. |
$339 |
– |
– |
– |
$335 |
– |
– |
– |
$4 |
| 88 |
Viskazide (pindolol, hydrochlorothiazide) |
Novartis Pharmaceuticals Canada Inc. |
$328 |
$37 |
$39 |
– |
$213 |
$11 |
$22 |
– |
$6 |
| 89 |
Ratio-Aclavulanate (amoxicillin, clavulanic acid (clavulanate potassium)) |
Teva Canada Limited |
$322 |
$16 |
$4 |
$84 |
$95 |
$10 |
$7 |
$5 |
$101 |
| 90 |
Cuprimine (d-penicillamine) |
Valeant Canada LP / Valeant Canada S.E.C. |
$320 |
$71 |
$9 |
$17 |
$183 |
$4 |
$18 |
$1 |
$17 |
| 91 |
Fluanxol (flupentixol) |
Lundbeck Canada Inc. |
$309 |
$14 |
$20 |
$60 |
$183 |
$17 |
$8 |
$1 |
$7 |
| 92 |
Chlorthalidone (chlorthalidone) |
AA Pharma Inc. |
$301 |
$37 |
$13 |
$14 |
$219 |
$5 |
$2 |
$0 |
$10 |
| 93 |
Dapsone (dapsone) |
Jacobus Pharmaceutical Company, Inc. |
$295 |
$69 |
$58 |
$41 |
$69 |
$13 |
$10 |
– |
$34 |
| 94 |
Differin Top (adapalene) |
Galderma Canada Inc. |
$292 |
– |
$182 |
$14 |
– |
– |
– |
– |
$97 |
| 95 |
Demulen (ethynodiol diacetate, ethinyl estradiol) |
Pfizer Canada Inc. |
$292 |
$10 |
$53 |
$120 |
$64 |
$7 |
$3 |
$2 |
$34 |
| 96 |
Cafergot (ergotamine tartrate, caffeine) |
Novartis Pharmaceuticals Canada Inc. |
$278 |
$33 |
– |
$0 |
$229 |
$3 |
$5 |
– |
$8 |
| 97 |
Stievamycin regular (erythromycin, tretinoin) |
GlaxoSmithKline Inc. |
$276 |
$0 |
– |
$69 |
$135 |
$4 |
$2 |
– |
$66 |
| 98 |
Ratio-Sildenafil R (sildenafil) |
Teva Canada Limited |
$269 |
– |
blank |
– |
$104 |
$82 |
$39 |
– |
$44 |
| 99 |
Taro-Carbamazepine (alpha 1-proteinase inhibitor) |
Taro Pharmaceuticals Inc. |
$268 |
$3 |
– |
$8 |
$215 |
$11 |
$0 |
$0 |
$31 |
| 100 |
Revia (naltrexone hydrochloride) |
Duramed Pharmaceuticals Inc. a subsidiary of Barr Pharmaceuticals Inc. |
$268 |
– |
– |
$48 |
$70 |
$105 |
$6 |
$1 |
$37 |
| blank |
blank |
Total |
$259,443 |
$33,711 |
$19,850 |
$18,658 |
$155,342 |
$8,635 |
$7,334 |
$1,620 |
$14,294 |
| blank |
blank |
Share of all non-patented single-source drugs |
95% |
94% |
94% |
91% |
96% |
94% |
93% |
94% |
87% |
*Total results for the select public drug plans reported in this table.
Data source: National Prescription Drug Utilization Information System Database, Canadian Institute for Health Information.
Appendix G: Top 100 Multi-Source Generic Drugs by Drug Cost, NPDUIS Select Public Drug Plans, 2012/13 ($thousand)
Table: Appendix G
| Rank |
Ingredient |
Total* |
AB |
SK |
MB |
ON |
NB |
NS |
PEI |
NIHB |
| 1 |
Atorvastatin |
$134.79 |
$23.86 |
$8.70 |
$8.73 |
$77.74 |
$3.95 |
$4.81 |
$1.08 |
$5.93 |
| 2 |
Amlodipine |
$69.66 |
$12.56 |
$3.30 |
$4.30 |
$42.10 |
$1.68 |
$2.55 |
$0.74 |
$2.42 |
| 3 |
Rosuvastatin |
$64.83 |
$10.01 |
$5.81 |
$2.67 |
$36.33 |
$3.01 |
$3.90 |
$0.72 |
$2.36 |
| 4 |
Pantoprazole |
$52.24 |
$16.99 |
$2.25 |
$1.75 |
$28.70 |
$0.42 |
$0.10 |
$0.00 |
$2.02 |
| 5 |
Ramipril |
$51.53 |
$8.85 |
$3.76 |
$4.70 |
$26.07 |
$1.99 |
$1.75 |
$0.53 |
$3.88 |
| 6 |
Omeprazole |
$45.59 |
$8.92 |
$2.16 |
$5.26 |
$17.19 |
$3.12 |
$3.16 |
$0.64 |
$5.13 |
| 7 |
Gabapentin |
$40.21 |
$7.23 |
$3.44 |
$6.56 |
$13.22 |
$1.70 |
$1.48 |
$0.38 |
$6.20 |
| 8 |
Metformin hydrochloride |
$39.81 |
$6.96 |
$0.24 |
$5.97 |
$19.50 |
$1.26 |
$1.48 |
$0.53 |
$3.87 |
| 9 |
Rabeprazole sodium |
$38.22 |
$1.61 |
$3.20 |
$2.27 |
$23.97 |
$0.67 |
$2.61 |
$0.30 |
$3.60 |
| 10 |
Olanzapine |
$36.36 |
$2.31 |
$1.25 |
$3.25 |
$22.73 |
$2.86 |
$0.80 |
$0.42 |
$2.75 |
| 11 |
Simvastatin |
$35.32 |
$6.22 |
$2.87 |
$2.91 |
$18.18 |
$1.49 |
$1.93 |
$0.42 |
$1.29 |
| 12 |
Clopidogrel |
$34.55 |
$4.41 |
$2.10 |
$3.70 |
$20.06 |
$1.38 |
$1.62 |
$0.21 |
$1.07 |
| 13 |
Venlafaxine |
$33.04 |
$4.94 |
$4.39 |
$5.33 |
$12.71 |
$1.66 |
$1.10 |
$0.24 |
$2.68 |
| 14 |
Risedronate sodium |
$30.82 |
$2.60 |
$0.40 |
$0.32 |
$26.11 |
$0.42 |
$0.78 |
$0.04 |
$0.15 |
| 15 |
Fentanyl |
$28.03 |
$1.54 |
$1.61 |
$2.52 |
$20.90 |
$0.38 |
$0.36 |
$0.03 |
$0.68 |
| 16 |
Citalopram |
$27.79 |
$3.95 |
$2.91 |
$4.69 |
$10.60 |
$1.67 |
$1.39 |
$0.42 |
$2.17 |
| 17 |
Lansoprazole |
$24.06 |
$7.94 |
$0.46 |
$0.28 |
$14.19 |
$0.39 |
$0.12 |
$0.01 |
$0.67 |
| 18 |
Quetiapine |
$21.96 |
$1.58 |
$1.55 |
$4.09 |
$10.15 |
$1.66 |
$0.60 |
$0.20 |
$2.12 |
| 19 |
Nifedipine |
$20.80 |
$2.19 |
$0.98 |
$2.72 |
$11.29 |
$1.54 |
$0.81 |
$0.13 |
$1.15 |
| 20 |
Diltiazem hydrochloride |
$18.16 |
$2.39 |
$1.19 |
$1.98 |
$9.95 |
$1.08 |
$0.72 |
$0.24 |
$0.60 |
| 21 |
Metoprolol tartrate |
$17.38 |
$2.92 |
$1.32 |
$2.78 |
$7.12 |
$0.82 |
$1.39 |
$0.22 |
$0.81 |
| 22 |
Paroxetine |
$16.78 |
$1.82 |
$1.88 |
$3.50 |
$6.38 |
$0.87 |
$0.73 |
$0.15 |
$1.45 |
| 23 |
Risperidone |
$15.26 |
$0.78 |
$1.38 |
$1.74 |
$8.37 |
$1.19 |
$0.37 |
$0.16 |
$1.27 |
| 24 |
Sertraline |
$14.79 |
$1.71 |
$1.51 |
$2.74 |
$6.37 |
$0.68 |
$0.54 |
$0.12 |
$1.11 |
| 25 |
Valsartan |
$14.59 |
$3.54 |
$1.39 |
$1.16 |
$7.35 |
$0.16 |
$0.48 |
$0.10 |
$0.41 |
| 26 |
Zopiclone |
$13.91 |
$7.29 |
– |
$4.45 |
$0.05 |
$1.52 |
$0.51 |
$0.09 |
$0.00 |
| 27 |
Irbesartan |
$13.83 |
$2.74 |
$0.89 |
$1.68 |
$7.25 |
$0.29 |
$0.43 |
$0.07 |
$0.47 |
| 28 |
Levodopa, carbidopa |
$13.39 |
$1.31 |
$0.73 |
$1.30 |
$9.05 |
$0.29 |
$0.35 |
$0.09 |
$0.27 |
| 29 |
Candesartan cilexetil |
$13.34 |
$2.30 |
$1.15 |
$0.83 |
$7.53 |
$0.47 |
$0.56 |
$0.10 |
$0.39 |
| 30 |
Warfarin sodium |
$13.03 |
$2.46 |
$1.14 |
$1.54 |
$6.28 |
$0.54 |
$0.62 |
$0.16 |
$0.28 |
| 31 |
Fluoxetine |
$12.67 |
$1.81 |
$1.71 |
$2.66 |
$4.41 |
$0.41 |
$0.35 |
$0.11 |
$1.21 |
| 32 |
Alendronic acid |
$12.62 |
$2.89 |
$0.63 |
$1.39 |
$5.93 |
$0.69 |
$0.62 |
$0.08 |
$0.38 |
| 33 |
Ranitidine |
$12.54 |
$0.46 |
$1.56 |
$1.27 |
$6.31 |
$0.54 |
$0.96 |
$0.17 |
$1.29 |
| 34 |
Atenolol |
$11.99 |
$1.35 |
$1.14 |
$0.92 |
$6.78 |
$0.58 |
$0.59 |
$0.21 |
$0.42 |
| 35 |
Acetaminophen, oxycodone hydrochloride |
$11.88 |
$0.60 |
– |
$0.74 |
$9.39 |
$0.10 |
$0.08 |
$0.05 |
$0.90 |
| 36 |
Galantamine |
$11.76 |
$1.26 |
$0.11 |
$0.18 |
$8.95 |
$0.53 |
$0.57 |
$0.13 |
$0.03 |
| 37 |
Pravastatin sodium |
$11.45 |
$2.55 |
$0.88 |
$0.95 |
$5.64 |
$0.47 |
$0.55 |
$0.10 |
$0.32 |
| 38 |
Amoxicillin |
$11.19 |
$0.66 |
$1.76 |
$1.66 |
$4.90 |
$0.17 |
$0.18 |
$0.05 |
$1.82 |
| 39 |
Gliclazide |
$10.17 |
$1.75 |
$0.36 |
$1.16 |
$4.60 |
$0.39 |
$0.74 |
$0.15 |
$1.03 |
| 40 |
Salbutamol |
$10.04 |
$0.56 |
$0.89 |
$1.03 |
$5.35 |
$0.50 |
$0.38 |
$0.09 |
$1.24 |
| 41 |
Pioglitazone |
$10.01 |
$2.59 |
$0.67 |
$0.50 |
$4.77 |
$0.23 |
$0.16 |
$0.00 |
$1.09 |
| 42 |
Ondansetron |
$9.62 |
$3.14 |
– |
$1.15 |
$4.06 |
$0.21 |
$0.21 |
– |
$0.85 |
| 43 |
Tamsulosin hydrochloride |
$9.33 |
$2.74 |
$0.83 |
$0.75 |
$4.01 |
$0.56 |
$0.02 |
$0.15 |
$0.28 |
| 44 |
Morphine sulfate |
$9.10 |
$0.77 |
$0.48 |
$1.11 |
$5.30 |
$0.27 |
$0.17 |
$0.07 |
$0.93 |
| 45 |
Valproic acid |
$8.97 |
$0.44 |
$0.86 |
$1.10 |
$5.14 |
$0.55 |
$0.17 |
$0.10 |
$0.61 |
| 46 |
Losartan potassium |
$8.79 |
$1.17 |
$0.77 |
$0.69 |
$4.91 |
$0.29 |
$0.47 |
$0.11 |
$0.37 |
| 47 |
Cephalexin |
$8.51 |
$0.71 |
$1.31 |
$1.05 |
$3.71 |
$0.16 |
$0.21 |
$0.05 |
$1.30 |
| 48 |
Enalapril maleate |
$8.48 |
$1.15 |
$0.01 |
$1.44 |
$4.15 |
$0.33 |
$0.22 |
$0.07 |
$1.12 |
| 49 |
Valsartan, hydrochlorothiazide |
$8.47 |
$2.22 |
$1.21 |
$0.81 |
$3.64 |
$0.07 |
$0.26 |
$0.04 |
$0.23 |
| 50 |
Methotrexate |
$8.45 |
$1.49 |
$0.54 |
$0.86 |
$4.29 |
$0.19 |
$0.32 |
$0.04 |
$0.71 |
| 51 |
Carvedilol |
$8.03 |
$2.20 |
$0.62 |
$0.61 |
$3.41 |
$0.40 |
$0.43 |
$0.05 |
$0.31 |
| 52 |
Telmisartan |
$7.99 |
$1.13 |
$0.46 |
$0.53 |
$5.00 |
$0.24 |
$0.27 |
$0.15 |
$0.20 |
| 53 |
Topiramate |
$7.85 |
$1.09 |
$1.17 |
$1.38 |
$3.18 |
$0.21 |
$0.07 |
$0.03 |
$0.71 |
| 54 |
Finasteride |
$7.75 |
$1.13 |
$0.46 |
$0.85 |
$4.64 |
$0.20 |
$0.34 |
$0.01 |
$0.13 |
| 55 |
Lisinopril |
$7.62 |
$1.79 |
$0.52 |
$1.36 |
$2.60 |
$0.48 |
$0.36 |
$0.12 |
$0.39 |
| 56 |
Hydromorphone hydrochloride |
$7.12 |
$0.59 |
$0.87 |
$0.53 |
$4.14 |
$0.20 |
$0.37 |
$0.06 |
$0.37 |
| 57 |
Ciprofloxacin |
$6.87 |
$1.44 |
$0.11 |
$1.21 |
$2.97 |
$0.09 |
$0.24 |
$0.00 |
$0.81 |
| 58 |
Furosemide |
$6.85 |
$0.76 |
$0.52 |
$0.66 |
$4.11 |
$0.24 |
$0.29 |
$0.04 |
$0.24 |
| 59 |
Lamotrigine |
$6.66 |
$0.68 |
$1.31 |
$1.52 |
$2.24 |
$0.26 |
$0.16 |
$0.04 |
$0.45 |
| 60 |
Epinephrine |
$6.60 |
$0.55 |
$1.10 |
$1.39 |
$2.06 |
$0.13 |
$0.06 |
$0.00 |
$1.29 |
| 61 |
Fenofibrate |
$6.56 |
$1.82 |
$0.31 |
$1.02 |
$2.32 |
$0.29 |
$0.33 |
$0.06 |
$0.42 |
| 62 |
Bisoprolol fumarate |
$6.51 |
$1.26 |
$0.09 |
$0.18 |
$4.28 |
$0.29 |
$0.22 |
$0.02 |
$0.16 |
| 63 |
Azithromycin |
$6.50 |
$0.58 |
$0.62 |
$1.59 |
$2.60 |
$0.19 |
$0.09 |
$0.00 |
$0.84 |
| 64 |
Irbesartan, hydrochlorothiazide |
$6.49 |
$1.69 |
$0.78 |
$1.23 |
$2.23 |
$0.06 |
$0.26 |
$0.02 |
$0.21 |
| 65 |
Naproxen |
$6.27 |
$0.45 |
$0.62 |
$0.72 |
$2.93 |
$0.16 |
$0.19 |
$0.07 |
$1.12 |
| 66 |
Leflunomide |
$6.23 |
$1.03 |
$0.56 |
$0.41 |
$3.35 |
$0.06 |
$0.12 |
$0.02 |
$0.68 |
| 67 |
Mirtazapine |
$6.06 |
$0.80 |
$0.42 |
$0.89 |
$3.02 |
$0.28 |
$0.26 |
$0.06 |
$0.35 |
| 68 |
Enalapril sodium |
$6.00 |
$1.30 |
$0.69 |
$1.71 |
$1.14 |
$0.21 |
$0.45 |
$0.06 |
$0.43 |
| 69 |
Valacyclovir |
$5.96 |
$1.58 |
$1.34 |
$1.08 |
$0.71 |
$0.15 |
$0.17 |
$0.03 |
$0.91 |
| 70 |
Baclofen |
$5.93 |
$0.58 |
$0.56 |
$0.57 |
$3.19 |
$0.18 |
$0.11 |
$0.03 |
$0.72 |
| 71 |
Diclofenac sodium |
$5.74 |
$1.09 |
$0.71 |
$1.27 |
$1.69 |
$0.09 |
$0.12 |
$0.07 |
$0.70 |
| 72 |
Terazosin |
$5.71 |
$0.54 |
$0.14 |
$0.32 |
$3.79 |
$0.21 |
$0.50 |
$0.02 |
$0.19 |
| 73 |
Clonazepam |
$5.61 |
$0.53 |
$0.23 |
$1.11 |
$2.60 |
$0.40 |
$0.21 |
$0.03 |
$0.50 |
| 74 |
Nabilone |
$5.56 |
$0.55 |
$0.03 |
$0.50 |
$3.60 |
$0.24 |
$0.10 |
– |
$0.55 |
| 75 |
Levetiracetam |
$5.52 |
$0.84 |
$0.95 |
$0.82 |
$1.89 |
$0.19 |
$0.17 |
$0.03 |
$0.63 |
| 76 |
Verapamil hydrochloride |
$5.41 |
$0.91 |
$0.47 |
$0.79 |
$2.39 |
$0.35 |
$0.26 |
$0.08 |
$0.16 |
| 77 |
Clozapine |
$5.14 |
$0.32 |
$0.68 |
$2.25 |
$0.01 |
$0.78 |
$0.00 |
$0.02 |
$1.07 |
| 78 |
Domperidone |
$5.08 |
$0.51 |
$0.30 |
$0.69 |
$2.62 |
$0.24 |
$0.39 |
$0.08 |
$0.24 |
| 79 |
Meloxicam |
$5.01 |
blank |
$0.04 |
$0.11 |
$4.44 |
$0.17 |
$0.11 |
– |
$0.14 |
| 80 |
Trazodone hydrochloride |
$4.93 |
$0.75 |
$0.17 |
$0.95 |
$2.23 |
$0.18 |
$0.26 |
$0.03 |
$0.37 |
| 81 |
Latanoprost |
$4.64 |
$0.55 |
$0.17 |
$0.26 |
$3.14 |
$0.15 |
$0.23 |
$0.04 |
$0.09 |
| 82 |
Losartan potassium, hydrochlorothiazide |
$4.44 |
$0.69 |
$1.00 |
$0.52 |
$1.55 |
$0.13 |
$0.36 |
$0.03 |
$0.15 |
| 83 |
Ursodiol |
$4.28 |
$0.71 |
$0.36 |
$0.41 |
$2.07 |
$0.12 |
$0.12 |
$0.02 |
$0.47 |
| 84 |
Clarithromycin |
$4.24 |
$0.60 |
$0.44 |
$0.82 |
$1.28 |
$0.16 |
$0.11 |
blank |
$0.84 |
| 85 |
Pramipexole dihydrochloride monohydrate |
$4.20 |
$0.69 |
$0.30 |
$0.46 |
$2.24 |
$0.18 |
$0.17 |
$0.02 |
$0.14 |
| 86 |
Amiodarone hydrochloride |
$4.19 |
$0.57 |
$0.32 |
$0.48 |
$2.36 |
$0.17 |
$0.14 |
$0.04 |
$0.11 |
| 87 |
Hydroxychloroquine sulfate |
$4.14 |
$0.61 |
$0.24 |
$0.44 |
$2.15 |
$0.09 |
$0.12 |
$0.03 |
$0.45 |
| 88 |
Glyburide |
$4.10 |
$0.24 |
$0.29 |
$0.61 |
$2.35 |
$0.08 |
$0.10 |
$0.03 |
$0.40 |
| 89 |
Methylphenidate hydrochloride |
$4.07 |
$0.06 |
$0.18 |
$1.14 |
$2.05 |
$0.11 |
$0.05 |
$0.03 |
$0.45 |
| 90 |
Lorazepam |
$4.04 |
$0.19 |
$0.14 |
$0.36 |
$2.74 |
$0.19 |
$0.20 |
$0.02 |
$0.20 |
| 91 |
Fosinopril sodium |
$3.92 |
$0.84 |
$0.21 |
$0.89 |
$1.60 |
$0.02 |
$0.10 |
$0.02 |
$0.24 |
| 92 |
Timolol, dorzolamide (dorzolamide hydrochloride) |
$3.90 |
$0.22 |
$0.12 |
$0.17 |
$3.12 |
$0.08 |
$0.11 |
$0.02 |
$0.06 |
| 93 |
Letrozole |
$3.87 |
blank |
blank |
$0.90 |
$2.36 |
$0.25 |
$0.26 |
$0.02 |
$0.09 |
| 94 |
Clindamycin |
$3.62 |
$0.42 |
$0.56 |
$0.58 |
$1.15 |
$0.08 |
$0.06 |
$0.02 |
$0.75 |
| 95 |
Carbamazepine |
$3.59 |
$0.34 |
$0.32 |
$0.64 |
$1.65 |
$0.15 |
$0.10 |
$0.03 |
$0.36 |
| 96 |
Levonorgestrel, ethinyl estradiol |
$3.38 |
$0.05 |
$0.76 |
$1.08 |
$0.76 |
$0.05 |
$0.02 |
$0.01 |
$0.67 |
| 97 |
Alfuzosin hydrochloride |
$3.36 |
$0.03 |
$0.27 |
$0.37 |
$2.65 |
– |
$0.00 |
– |
$0.03 |
| 98 |
Esomeprazole |
$3.30 |
– |
– |
$3.25 |
– |
– |
$0.05 |
– |
– |
| 99 |
Bicalutamide |
$3.24 |
– |
– |
$0.39 |
$2.41 |
$0.13 |
$0.22 |
$0.04 |
$0.05 |
| 100 |
Rivastigmine |
$3.14 |
$0.35 |
$0.02 |
$0.11 |
$2.50 |
$0.06 |
$0.10 |
$0.00 |
$0.01 |
| blank |
Total |
$1,467.33 |
$229.87 |
$102.21 |
$159.29 |
$759.19 |
$55.78 |
$54.86 |
$11.91 |
$94.20 |
| blank |
Share of all multi-source generic drugs |
89% |
89% |
87% |
87% |
90% |
88% |
88% |
90% |
85% |
*Total results for the select public drug plans reported in this table.
Data source: National Prescription Drug Utilization Information System Database, Canadian Institute for Health Information.
Appendix H: Top 100 Manufacturers by Drug Cost, NPDUIS Select Public Drug Plans, 2012/13 ($million)
Table: Appendix H
| Rank |
Company |
Total* |
AB |
SK |
MB |
ON |
NB |
NS |
PEI |
NIHB |
| 1 |
Apotex Incorporated |
$497.95 |
$66.58 |
$19.31 |
$48.27 |
$298.16 |
$16.79 |
$11.67 |
$3.64 |
$33.53 |
| 2 |
Novartis Pharmaceuticals Canada Inc. |
$357.69 |
$51.64 |
$8.35 |
$10.35 |
$270.99 |
$8.33 |
$3.49 |
$0.75 |
$3.81 |
| 3 |
Teva Canada Limited |
$355.54 |
$39.65 |
$26.35 |
$39.94 |
$193.96 |
$13.14 |
$15.99 |
$2.77 |
$23.75 |
| 4 |
Janssen Inc. |
$323.96 |
$50.72 |
$33.36 |
$31.56 |
$166.28 |
$10.59 |
$12.03 |
$2.58 |
$16.84 |
| 5 |
Pfizer Canada Inc. |
$315.93 |
$30.60 |
$19.31 |
$20.57 |
$218.02 |
$7.26 |
$7.29 |
$1.13 |
$11.75 |
| 6 |
Merck Canada Inc. |
$282.32 |
$21.17 |
$17.58 |
$13.51 |
$208.90 |
$5.29 |
$5.43 |
$0.77 |
$9.68 |
| 7 |
GlaxoSmithKline Inc. |
$237.95 |
$28.93 |
$11.83 |
$18.12 |
$151.69 |
$7.49 |
$5.52 |
$0.79 |
$13.57 |
| 8 |
AstraZeneca Canada Inc.. |
$208.31 |
$20.23 |
$13.58 |
$19.62 |
$141.76 |
$3.33 |
$4.10 |
$0.72 |
$4.99 |
| 9 |
Pharmascience Inc. |
$164.17 |
$21.62 |
$18.01 |
$15.28 |
$76.16 |
$9.93 |
$8.29 |
$1.98 |
$12.89 |
| 10 |
Sandoz Canada Incorporated |
$154.62 |
$30.99 |
$12.78 |
$14.36 |
$73.33 |
$4.60 |
$6.36 |
$1.39 |
$10.83 |
| 11 |
Boehringer Ingelheim |
$150.58 |
$22.03 |
$5.55 |
$4.36 |
$108.47 |
$3.42 |
$3.62 |
$0.43 |
$2.71 |
| 12 |
Mylan Pharmaceuticals Ulc |
$150.10 |
$19.72 |
$7.44 |
$21.29 |
$80.94 |
$5.38 |
$5.33 |
$0.82 |
$9.17 |
| 13 |
Purdue Pharma |
$112.50 |
$11.34 |
$6.39 |
$7.44 |
$77.91 |
$2.70 |
$2.07 |
$0.18 |
$4.46 |
| 14 |
AbbVie Corporation |
$103.79 |
$22.59 |
$11.05 |
$15.73 |
$38.80 |
$2.72 |
$6.02 |
$1.56 |
$5.32 |
| 15 |
Sanofi-aventis Canada Inc. |
$97.01 |
$8.60 |
$6.19 |
$4.57 |
$66.59 |
$0.85 |
$1.16 |
$0.21 |
$8.83 |
| 16 |
Ranbaxy Pharmaceuticals Canada Inc.. |
$96.09 |
$18.13 |
$5.99 |
$16.17 |
$46.43 |
$3.09 |
$2.38 |
$0.66 |
$3.24 |
| 17 |
Servier Canada Inc. |
$93.69 |
$9.71 |
$7.59 |
$5.81 |
$60.77 |
$3.24 |
$2.73 |
$0.42 |
$3.43 |
| 18 |
Eli Lilly Canada Inc. |
$90.90 |
$9.75 |
$4.78 |
$6.59 |
$59.07 |
$2.54 |
$2.14 |
$1.08 |
$4.94 |
| 19 |
Immunex Corporation |
$87.47 |
$19.13 |
$7.92 |
$13.69 |
$32.18 |
$2.55 |
$4.00 |
$0.76 |
$7.22 |
| 20 |
Novo Nordisk Canada Inc. |
$76.06 |
$9.63 |
$4.35 |
$5.19 |
$45.99 |
$1.65 |
$3.48 |
$0.81 |
$4.96 |
| 21 |
Bayer Inc. |
$74.02 |
$7.72 |
$8.71 |
$9.26 |
$38.26 |
$2.72 |
$2.28 |
$0.35 |
$4.73 |
| 22 |
Cobalt Pharmaceuticals Company |
$68.95 |
$8.40 |
$3.08 |
$10.26 |
$39.78 |
$1.53 |
$1.75 |
$0.18 |
$3.97 |
| 23 |
Hoffmann-La Roche Limited |
$63.35 |
$4.76 |
$4.10 |
$6.43 |
$40.12 |
$1.54 |
$2.00 |
$0.28 |
$4.11 |
| 24 |
Sanis Health Inc. |
$61.98 |
$28.33 |
$12.19 |
$0.33 |
– |
$6.11 |
$6.18 |
$1.07 |
$7.76 |
| 25 |
Valeant Canada LP / Valeant Canada S.E.C. |
$61.47 |
$7.46 |
$6.14 |
$6.93 |
$34.35 |
$1.67 |
$1.45 |
$0.23 |
$3.24 |
| 26 |
Bristol-Myers Squibb Canada |
$61.06 |
$4.82 |
$2.22 |
$4.54 |
$42.75 |
$1.53 |
$1.15 |
$0.16 |
$3.89 |
| 27 |
Lundbeck Canada Inc. |
$54.33 |
$4.08 |
$0.32 |
$0.24 |
$47.87 |
$0.13 |
$0.06 |
$0.00 |
$1.62 |
| 28 |
Celgene Inc. |
$53.09 |
– |
– |
$4.12 |
$44.82 |
$1.88 |
$1.83 |
– |
$0.44 |
| 29 |
Takeda Canada Inc. |
$51.09 |
$3.25 |
$1.91 |
$0.51 |
$35.90 |
$5.02 |
$2.41 |
$0.56 |
$1.54 |
| 30 |
Actavis Pharma Company |
$49.12 |
$14.99 |
$2.70 |
$7.17 |
$18.19 |
$0.91 |
$2.10 |
$0.28 |
$2.76 |
| 31 |
AA Pharma Inc. |
$48.78 |
$4.93 |
$3.58 |
$4.61 |
$28.73 |
$1.54 |
$2.08 |
$0.37 |
$2.94 |
| 32 |
Gilead Sciences Canada Inc. |
$47.46 |
$2.13 |
$1.48 |
$3.20 |
$36.95 |
$0.96 |
$0.07 |
– |
$2.67 |
| 33 |
Amgen Canada Inc. |
$43.94 |
$11.08 |
$0.45 |
$0.97 |
$25.13 |
$3.28 |
$0.09 |
$0.24 |
$2.70 |
| 34 |
Abbott Laboratories, Limited |
$41.18 |
$5.85 |
$2.70 |
$4.14 |
$23.43 |
$1.17 |
$1.48 |
$0.20 |
$2.21 |
| 35 |
Warner Chilcott Canada Co. |
$32.85 |
$1.90 |
$2.89 |
$1.52 |
$24.98 |
$0.38 |
$0.39 |
$0.03 |
$0.75 |
| 36 |
Teva Pharmaceutical Industries Ltd. |
$32.28 |
$12.89 |
$4.90 |
$3.51 |
$8.49 |
$1.39 |
– |
$0.51 |
$0.59 |
| 37 |
Astellas Pharma Canada Inc. |
$30.10 |
$0.96 |
$1.52 |
$2.60 |
$21.64 |
$1.46 |
$0.22 |
$0.02 |
$1.67 |
| 38 |
Bristol-Myers Squibb and Gilead Sciences LLC |
$29.65 |
– |
$1.69 |
$1.18 |
$23.64 |
$0.94 |
– |
– |
$2.20 |
| 39 |
Allergan Inc. |
$28.60 |
$4.83 |
$1.68 |
$2.87 |
$15.74 |
$0.98 |
$1.16 |
$0.14 |
$1.21 |
| 40 |
LEO Pharma Inc. |
$26.51 |
$4.35 |
$2.44 |
$0.70 |
$16.66 |
$0.37 |
$0.24 |
$0.03 |
$1.72 |
| 41 |
ViiV Healthcare ULC |
$25.76 |
– |
$0.94 |
$2.62 |
$19.34 |
$0.60 |
– |
– |
$2.27 |
| 42 |
EMD Serono, a division of EMD Inc. Canada |
$24.69 |
$7.38 |
$3.20 |
$2.53 |
$8.81 |
$1.74 |
– |
$0.43 |
$0.59 |
| 43 |
Biogen Idec Canada Inc. |
$23.54 |
$4.22 |
$1.89 |
$3.46 |
$9.34 |
$3.67 |
– |
$0.39 |
$0.58 |
| 44 |
Alcon Canada Inc. |
$22.94 |
$3.01 |
$1.62 |
$2.47 |
$12.65 |
$0.74 |
$1.30 |
$0.16 |
$0.99 |
| 45 |
Taro Pharmaceuticals Inc. |
$21.38 |
$2.40 |
$1.43 |
$1.99 |
$12.61 |
$0.53 |
$0.74 |
$0.18 |
$1.50 |
| 46 |
Paladin Labs Inc. |
$18.06 |
$2.20 |
$1.16 |
$1.63 |
$9.62 |
$0.50 |
$1.04 |
$0.40 |
$1.50 |
| 47 |
Pendopharm, a division of Pharmascience Inc. |
$17.42 |
$1.90 |
$1.55 |
$1.35 |
$10.23 |
$0.61 |
$0.52 |
$0.13 |
$1.13 |
| 48 |
Actelion Pharmaceuticals Ltd. |
$14.45 |
– |
$0.34 |
$2.88 |
$10.04 |
$0.17 |
$0.17 |
$0.02 |
$0.84 |
| 49 |
GenMed, a division of Pfizer Canada Inc. |
$14.04 |
$0.10 |
$3.63 |
$2.34 |
$7.08 |
$0.12 |
$0.37 |
$0.01 |
$0.37 |
| 50 |
Alexion Pharma International Sarl |
$11.73 |
$1.61 |
– |
$0.38 |
$9.74 |
– |
– |
– |
– |
| 51 |
Shire Canada Inc. |
$10.70 |
$0.16 |
$0.69 |
$0.20 |
$9.28 |
$0.07 |
$0.11 |
$0.03 |
$0.16 |
| 52 |
Genzyme Canada, a division of Sanofi-aventis Canada Inc. |
$9.97 |
$0.25 |
– |
$1.68 |
$7.29 |
– |
$0.05 |
– |
$0.71 |
| 53 |
Hospira Healthcare Corporation |
$7.90 |
$1.60 |
$0.38 |
$0.83 |
$3.86 |
$0.20 |
$0.33 |
$0.04 |
$0.67 |
| 54 |
Aptalis Pharma Canada Inc. |
$7.66 |
$1.05 |
$0.52 |
$0.59 |
$4.38 |
$0.36 |
$0.28 |
$0.06 |
$0.43 |
| 55 |
Ferring Inc. |
$6.79 |
$0.62 |
$0.65 |
$0.61 |
$4.22 |
$0.20 |
$0.16 |
$0.02 |
$0.31 |
| 56 |
Shire Human Genetic Therapies Inc. |
$6.79 |
– |
– |
– |
$6.79 |
– |
– |
– |
– |
| 57 |
Mylan Specialty L.P. |
$6.50 |
$0.54 |
$1.08 |
$1.37 |
$2.04 |
$0.13 |
$0.06 |
$0.00 |
$1.28 |
| 58 |
UCB Canada Inc. |
$6.28 |
$0.14 |
$0.16 |
$0.12 |
$5.61 |
$0.03 |
$0.06 |
$0.00 |
$0.15 |
| 59 |
Mint Pharmaceuticals Inc. |
$5.87 |
$2.01 |
$0.45 |
$0.76 |
$1.55 |
$0.21 |
$0.42 |
$0.01 |
$0.46 |
| 60 |
Fournier Pharma Inc. |
$5.26 |
– |
$0.37 |
$1.00 |
$3.64 |
$0.00 |
– |
– |
$0.24 |
| 61 |
Patriot, a division of Janssen Inc. |
$4.98 |
$0.50 |
$0.13 |
$0.05 |
$3.52 |
$0.27 |
$0.42 |
$0.05 |
$0.03 |
| 62 |
Barr Laboratories Inc. |
$4.49 |
$0.05 |
$0.98 |
$1.60 |
$0.97 |
$0.07 |
$0.03 |
$0.01 |
$0.78 |
| 63 |
Ratiopharm Inc., division of Teva Canada Limited |
$4.29 |
$0.56 |
$0.27 |
$0.67 |
$2.08 |
$0.23 |
$0.08 |
$0.03 |
$0.37 |
| 64 |
Duchesnay Inc. |
$3.98 |
$0.12 |
$0.72 |
$0.71 |
$1.25 |
$0.08 |
$0.06 |
$0.01 |
$1.03 |
| 65 |
Takeda Pharmaceuticals America Inc. |
$3.83 |
$0.43 |
$0.26 |
$0.09 |
$2.08 |
$0.11 |
$0.10 |
$0.01 |
$0.76 |
| 66 |
McNeil Consumer Healthcare, division of Johnson & Johnson Inc. |
$3.79 |
$0.17 |
$0.07 |
$0.14 |
$0.20 |
$0.01 |
$0.02 |
$0.01 |
$3.17 |
| 67 |
Actavis Group PTC ehf |
$3.77 |
$0.36 |
$0.08 |
$0.55 |
$2.44 |
$0.05 |
$0.10 |
$0.01 |
$0.18 |
| 68 |
Vertex Pharmaceuticals |
$3.60 |
$1.40 |
$1.26 |
– |
$0.19 |
$0.13 |
$0.17 |
– |
$0.45 |
| 69 |
Taropharma, a division of Taro Pharmaceuticals Inc. |
$3.40 |
$0.19 |
$0.09 |
$0.06 |
$2.84 |
$0.04 |
$0.03 |
$0.02 |
$0.12 |
| 70 |
Euro-Pharm International Canada Inc. |
$3.28 |
$0.00 |
$0.02 |
$0.03 |
$3.05 |
$0.00 |
– |
– |
$0.17 |
| 71 |
Sunovion Pharmaceuticals Canada Inc. |
$3.10 |
$0.24 |
$0.10 |
$0.04 |
$2.57 |
$0.04 |
$0.07 |
– |
$0.04 |
| 72 |
Ethypharm Inc. |
$2.99 |
$0.32 |
$0.05 |
$0.11 |
$1.88 |
$0.07 |
$0.08 |
$0.02 |
$0.46 |
| 73 |
Triton Pharma Inc. |
$2.86 |
$0.16 |
$0.27 |
$0.18 |
$2.12 |
$0.02 |
$0.03 |
$0.00 |
$0.08 |
| 74 |
Accel Pharma Inc. |
$2.66 |
$0.00 |
$0.66 |
$1.73 |
$0.07 |
$0.00 |
$0.00 |
– |
$0.19 |
| 75 |
Jamp Pharma Corporation |
$2.48 |
$0.27 |
$0.29 |
$0.14 |
$1.41 |
$0.04 |
$0.02 |
$0.06 |
$0.23 |
| 76 |
Galderma Canada Inc. |
$2.26 |
$0.13 |
$0.31 |
$0.19 |
$1.13 |
$0.06 |
$0.07 |
$0.02 |
$0.35 |
| 77 |
Dr. Reddy's Laboratories Inc. |
$2.19 |
$0.67 |
$0.23 |
$0.76 |
$0.32 |
$0.02 |
$0.01 |
$0.00 |
$0.16 |
| 78 |
United Therapeutics Corporation |
$2.11 |
– |
$0.08 |
$0.15 |
$1.10 |
$0.59 |
– |
– |
$0.19 |
| 79 |
Accord Healthcare Inc. |
$1.99 |
$0.30 |
$0.00 |
$0.24 |
$1.17 |
$0.11 |
$0.12 |
$0.01 |
$0.04 |
| 80 |
Odan Laboratories Ltd. |
$1.92 |
$0.47 |
$0.19 |
$0.13 |
$0.67 |
$0.15 |
$0.16 |
$0.01 |
$0.13 |
| 81 |
GlaxoSmithKline Consumer Healthcare Inc. |
$1.90 |
$0.08 |
$0.09 |
$0.04 |
$0.91 |
$0.06 |
$0.01 |
$0.01 |
$0.71 |
| 82 |
RB Pharmaceuticals Limited |
$1.90 |
$0.12 |
$0.01 |
$0.05 |
$1.62 |
$0.03 |
$0.01 |
$0.02 |
$0.05 |
| 83 |
Mayne Pharma International Pty Ltd. |
$1.85 |
$0.06 |
$0.18 |
$0.04 |
$1.27 |
$0.03 |
$0.03 |
– |
$0.25 |
| 84 |
Unknown Company |
$1.78 |
– |
– |
$0.00 |
$1.66 |
$0.00 |
$0.00 |
– |
$0.11 |
| 85 |
Merus Labs Luxco S.A R.L. |
$1.71 |
$0.30 |
$0.03 |
$0.00 |
$1.34 |
$0.00 |
$0.02 |
– |
$0.03 |
| 86 |
Grifols Therapeutics Inc. |
$1.70 |
– |
– |
$0.65 |
$1.05 |
– |
– |
– |
– |
| 87 |
Dominion Pharmacal |
$1.44 |
$0.00 |
$0.64 |
– |
$0.19 |
– |
– |
– |
$0.61 |
| 88 |
Novopharm Limited |
$1.38 |
$0.17 |
$0.08 |
$0.11 |
$0.86 |
$0.04 |
$0.04 |
$0.01 |
$0.08 |
| 89 |
Merus Labs International Inc. |
$1.15 |
$0.18 |
$0.11 |
$0.07 |
$0.68 |
$0.03 |
$0.04 |
$0.00 |
$0.05 |
| 90 |
Erfa Canada 2012 Inc. |
$0.95 |
$0.15 |
$0.09 |
$0.11 |
$0.31 |
$0.14 |
$0.07 |
$0.01 |
$0.08 |
| 91 |
Merz Pharmaceuticals GmbH |
$0.86 |
$0.13 |
$0.03 |
$0.13 |
$0.53 |
$0.00 |
$0.02 |
– |
$0.02 |
| 92 |
Omega Laboratories Ltd. |
$0.78 |
$0.17 |
$0.01 |
$0.04 |
$0.46 |
$0.02 |
$0.03 |
– |
$0.05 |
| 93 |
Pro Doc Limitee |
$0.77 |
– |
– |
– |
– |
$0.00 |
– |
– |
$0.77 |
| 94 |
Sigmacon Lifesciences Inc. |
$0.75 |
– |
$0.69 |
– |
– |
– |
– |
– |
$0.06 |
| 95 |
Valeo Pharma Inc. |
$0.74 |
$0.40 |
$0.01 |
$0.01 |
$0.11 |
$0.05 |
$0.05 |
$0.00 |
$0.11 |
| 96 |
Medtech Products Inc. |
$0.64 |
– |
$0.05 |
$0.05 |
$0.26 |
$0.01 |
– |
$0.00 |
$0.28 |
| 97 |
Aurobindo Pharma Limited |
$0.64 |
$0.03 |
$0.03 |
– |
$0.51 |
$0.03 |
$0.01 |
$0.00 |
$0.04 |
| 98 |
Auro Pharma Inc. |
$0.61 |
$0.04 |
$0.05 |
$0.02 |
$0.44 |
$0.01 |
$0.02 |
$0.00 |
$0.03 |
| 99 |
Swedish Orphan Biovitrum AB |
$0.56 |
– |
$0.10 |
$0.06 |
$0.31 |
$0.05 |
$0.04 |
– |
– |
| 100 |
Cytex Pharmaceuticals Inc. |
$0.55 |
$0.07 |
$0.04 |
$0.04 |
$0.33 |
$0.01 |
$0.01 |
$0.00 |
$0.03 |
| blank |
Total |
$5,270.80 |
$682.94 |
$340.76 |
$445.27 |
$3,185.89 |
$162.90 |
$147.63 |
$30.30 |
$275.12 |
*Total results for the select public drug plans reported in this table.
Data source: National Prescription Drug Utilization Information System Database, Canadian Institute for Health Information
Appendix I: Glossary
Active beneficiaryFootnote 3:
An individual with at least one claim accepted by a public drug program, either for reimbursement or applied toward a deductible. In Manitoba and Saskatchewan, claimants are also individuals with accepted claims who are eligible for coverage under a provincial drug program but who have not submitted an application and, therefore, do not have a defined deductible.
Anatomical Therapeutic Chemical (ATC):
A classification system that divides drugs into different groups according to the organ or system on which they act and/or their therapeutic and chemical characteristics. It is maintained by the World Health Organization Collaborating Centre for Drug Statistics Methodology. The ATC system is divided into five different levels. The level 1 and 2 are reported in this study, and reflect the anatomical and therapeutic main groups, respectively.
Co-paymentFootnote 3:
The portion of the claim cost that individuals must pay each time they make a claim. This may be a fixed amount or a percentage of the total claim cost. When calculated as a percentage of the total cost, it is also known as “co-insurance.”
DeductibleFootnote 3:
The amount of total drug spending an individual must pay in a given year (or other defined time period) before any part of his or her drug costs will be paid by the drug program. A deductible may be a fixed amount or a percentage of income (income-based deductible).
Dispensing fee:
A professional fee charged by a pharmacist for the dispensing of a prescription and accepted for reimbursement by a public drug plan.
Drivers of drug expenditure:
The level of drug expenditure is determined by many factors or determinants, such as the size and age of the population, the volume and type of drugs used, the price levels, etc. A change in any factor becomes a driver. For example, the changes in the brand versus generic market shares due to the launch of generic products are expected to drive a decline in the level of prescription drug expenditures. On the other hand, expensive emerging therapies are expected to fuel the upward pressure on costs.
Drug cost:
An amount accepted for reimbursement by a public drug plan that reflects the acquisition cost to the pharmacy for a drug. This may include wholesale markups, but excludes pharmacy markups and dispensing fees.
Drug Identification Number (DIN):
A computer-generated eight digit number assigned by Health Canada to a drug product prior to being marketed in Canada. A DIN uniquely identifies the following product characteristics: manufacturer; product name; active ingredient(s); strength(s) of active ingredient(s); pharmaceutical form; route of administration.
Markup:
An amount accepted for reimbursement by a public drug plan that reflects the difference between the pharmacy retail price and the drug cost. It may also include a wholesale upcharge component, as per the specific markup policies in public plans.
Plan-paid:
An amount that a public drug plan reimburses an active beneficiary towards the prescription drug expenditure. It reflects the government–patient cost sharing structure specific to each plan.
Prescription:
A claimFootnote 3 where the drug program accepts at least a portion of the cost, either toward a deductible or for reimbursement. Claims reimbursed by a public drug plan and that relate to pharmacy professional services other than the dispensing of medications (such as the medication review or administration of vaccines) are not included in the analysis.
Prescription drug expenditures:
The sum of the three components of a prescription: drug costs, pharmacy markups (if applicable) and dispensing fees. These are amounts accepted by a public drug plan towards the deductible or for reimbursement of eligible beneficiaries. Submitted amounts that were not accepted for reimbursement (drug not reimbursed, unit cost above the accepted price, etc.) are not captured in these amounts. The expenditure totals include both the plan-paid and beneficiary-paid amounts, such as co-payments and deductibles.
Prescription size:
The physical quantity of drugs or the number of day supply for which the prescribed drug was dispensed to an eligible beneficiary. The day supply can be used to measure the prescription length.
Public drug plan:
This is a general term used to describe drug plans that are administered by provincial, territorial or federal governments. Examples include the public drug plans analyzed in this report. Public drug plans establish eligibility requirements, cost sharing structures as well as drugs and prices accepted for reimbursement.
Rate of change:
The percent change from one year to another in a drug utilization or expenditure metric. The annual rate of change is calculated over two consecutive years as follows:
[(Value in year 1)/(Value in year 0)] - 1
The compound annual rate of change is calculated over three or more consecutive years as follows:
[(Value in year n)/(Value in year 0)]1/n - 1