Cost Drivers of Public Drug Plans in Canada, 2012/13
The NPDUIS CompassRx is an Annual Public Drug Plan Expenditure Report that analyzes recent trends in prescription drug expenditures in a select number of Canadian public drug plans and provides insight into the drivers of prescription drug expenditures.
Identifying the major drivers of change and measuring their effect on costs allow policy makers and researchers to understand the current trends and anticipate future cost pressures and expenditure levels.
The rates of change in drug cost have been steadily declining in recent years, reaching a low of -0.8% in 2012/13 for a number of select public drug plans, which include Alberta, Saskatchewan, Manitoba, Ontario, New Brunswick, Nova Scotia and Prince Edward Island and Health Canada’s Non-Insured Health Benefits (NIHB) drug plan.
These rates of change are the net result of important and opposing “push” and “pull” effects. On one hand, factors such as the population growth, the increased use of drugs, and the use of more expensive drugs put an upward pressure (“push”) on expenditures. On the other hand, expenditure levels are pulled downward by factors such as generic substitution and price reductions.
The report employs a cost driver model to disaggregate and measure the impact of a number of effects (and sub-effects): demographic, volume, drug-mix and price and generic substitution effects.
Push and pull Effects
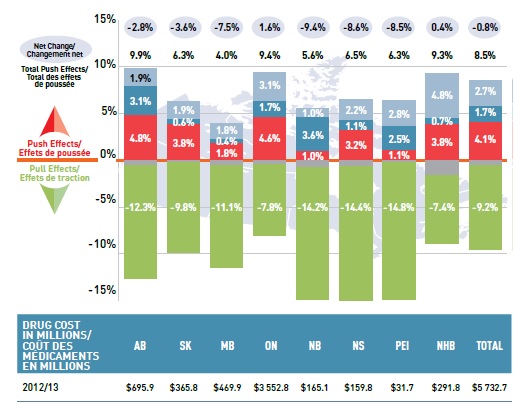
This graph describes the factors that impacted the rates of change in drug cost in select public plans in Canada in 2012/13.
Push and pull Effects
|
AB |
SK |
MB |
ON |
NB |
NS |
PEI |
NIHB |
Total Select
Plans |
| Net Change |
-2.8% |
-3.6% |
-7.5% |
1.6% |
-9.4% |
-8.6% |
-8.5% |
0.4% |
-0.8% |
| Total Push Effects |
9.9% |
6.3% |
4.0% |
9.4% |
5.6% |
6.5% |
6.3% |
9.3% |
8.5% |
| Demographic Effect |
1.9% |
1.9% |
1.8% |
3.1% |
1.0% |
2.2% |
2.8% |
4.8% |
2.7% |
| Volume Effect |
3.1% |
0.6% |
0.4% |
1.7% |
3.6% |
1.1% |
2.5% |
0.7% |
1.7% |
| Drug-Mix Effect |
4.8% |
3.8% |
1.8% |
4.6% |
1.0% |
3.2% |
1.1% |
3.8% |
4.1% |
| Price Effects |
-12.3% |
-9.8% |
-11.1% |
-7.8% |
-14.2% |
-14.4% |
-14.8% |
-7.4% |
-9.2% |
| Drug Cost (M) |
$695.9 |
$365.8 |
$469.9 |
$3,552.8 |
$165.1 |
$159.8 |
$31.7 |
$291.8 |
$5,732.7 |
Demographic Effect Up 2.7%
The demographic effects pushed the drug cost upward by 2.7%, mainly due to increases in the beneficiary population.
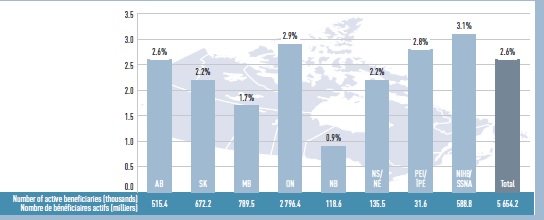
Rate of change in beneficiary population, 2012/13
This graph gives the rate of change in the beneficiary population for select public drug plans in Canada in 2012/13, along with the total number of active beneficiaries (thousands): AB: 2.6% (515.4); SK: 2.2% (672.2); MB: 1.7% (789.5); ON: 2.9% (2,796.4); NB: 0.9% (118.6); NS: 2.2% (135.5); PEI: 2.8% (31.6); NIHB: 3.1% (588.8); total for all plans: 2.6% (5,654.2).
Volume Effect Up 1.7%
The volume effect had a 1.7% impact on drug costs, mainly as a result of the increases in the volume of prescriptions at the beneficiary level in Alberta, Ontario and New Brunswick.
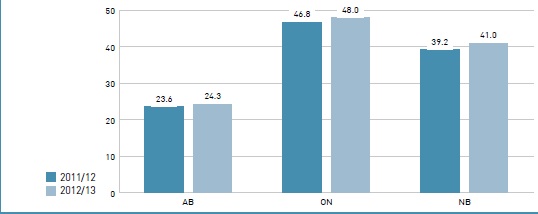
Average number of prescriptions per beneficiary
The bar graph gives the average number of prescriptions per beneficiary for 3 jurisdictions in 2011/12 and 2012/13: AB - 2011/12: 23.6, 2012/13: 24.3; ON - 2011/12: 46.8, 2012/13: 48.0; NB - 2011/12: 39.2, 2012/13: 41.0.
Drug-Mix Effect Up 4.1%
The drug-mix effect had the most notable push effect on drug costs as the utilization shifted from lower- to higher-cost drugs, such as biologics. These drugs had a double-digit rate of growth in 2012/13.
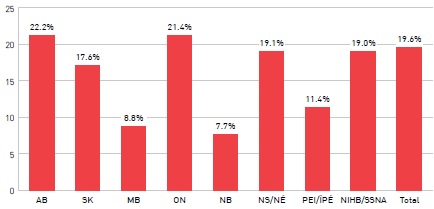
Rate of change in biologic drug costs, 2012-13
This bar graph describes the rates of change in biologic drug costs for 2012/13 in select public drug plans in Canada. AB: 22.2%; SK: 17.6%; MB: 8.8%; ON: 21.4%; NB: 7.7%; NS: 19.1%; PEI: 11.4%; NIHB: 19.0%; Total select plans: 19.6%.
Cross Effect
The cross effect results from the interaction between the individual effects.
Price Effect Down 2.0%
The reduction in drug prices pulled down the drug cost by an average of 2.0% for the select public plans. This was the result of the provincial generic price reductions implemented in 2012/13. The reduction in generic unit cost level is reported in the figure as an index.
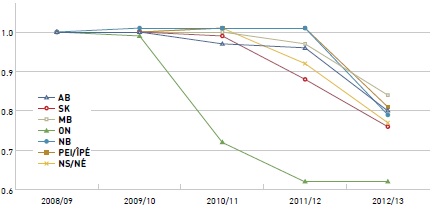
Index in the average unit cost for generic drugs
This graph describes the change over 5 years in the average unit cost for generic drugs in select Canadian public drug plans as an index.
Index in the average unit cost for generic drugs
| blank |
2008/09 |
2009/10 |
2010/11 |
2011/12 |
2012/13 |
| AB |
1.00 |
1.00 |
0.97 |
0.96 |
0.80 |
| SK |
1.00 |
1.00 |
0.99 |
0.88 |
0.76 |
| MB |
1.00 |
1.00 |
1.00 |
0.97 |
0.84 |
| ON |
1.00 |
0.99 |
0.72 |
0.62 |
0.62 |
| NB |
1.00 |
1.01 |
1.01 |
1.01 |
0.79 |
| PEI |
1.00 |
1.00 |
1.01 |
1.01 |
0.81 |
| NS |
1.00 |
1.00 |
1.01 |
0.92 |
0.77 |
Generic Substitution Effect Down 7.2%
The shifting utilization from higher-cost brand-name drugs to lower-cost generics had a 7.2% pull-down effect on drug costs. The figure reports the savings related to the top three new generics in 2012/13 that contributed to this effect.
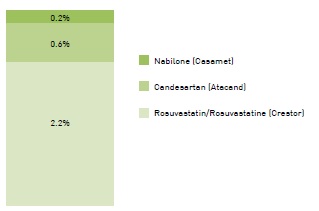
Estimated savings from top generic entrants in 2012/13
This graph gives an estimate of the savings from the top generic entrants in 2012/13: rosuvastatin (Crestor): 2.2%; candesartan (Atacand): 0.6%; nabilone (Casamet): 0.2%.
Methods: The cost driver analysis follows the approach detailed in the PMPRB report titled The Drivers of Prescription Drug Expenditures: A Methodological Report, 2013.
Data Source: The data source is the NPDUIS Canadian Institute for Health Information database.
NPDUIS is a research initiative that operates independently of the regulatory activities of the PMPRB.