Cost Drivers of Private Drug Plans in Canada, 2017
PDF - 755 kb
Private insurers are the second largest payer for prescription drugs in Canada, financing over one-third of all prescribed drug spending. This study identifies and analyzes the evolving pressures driving annual changes in private drug plan expenditures including changes in the beneficiary population (demographic effect); changes in the amount of drugs used (volume effect); shifts between lower- and higher-priced drugs (drug-mix effect); and changes in drug prices as well as shifts from brand-name drugs to generics or biosimilars (price effect). The overall growth in expenditures in any given year is the net result of these opposing “push” and “pull” effects.
Results for this study are based on 2008–2017 data from the IQVIA™ Private médicaments au Canada, 2017 Drug Plan Database, with a focus on the change in drug expenditures from 2016 to 2017. This study complements other PMPRB reporting on private drug plans as well as the findings of the annual PMPRB CompassRx report, which provides a similar analysis of the public drug plan environment.
2017 marked the highest growth in drug costs since 2010
Driven by increasing pressure from higher-cost drugs and reduced generic savings, there has been a marked increase in drug costs in private plans over the last four years. This follows a period of low growth from 2010 to 2013 when upward cost pressures were kept in check by substantial savings from generic substitutions and price reductions. Overall drug costs increased by 6.4% in 2017, which was higher than the 10-year compound annual growth rate (CAGR) of 4.9%.
The use of higher-cost drugs (drug-mix effect) has become an increasingly important cost driver. Its upward pressure on expenditures, which ranged from 2.6% to 3.7% in the first part of the last decade, reached a high of 4.9% in 2017. This overall result does not include the slight downward pressure exerted by the direct-acting antiviral (DAA) drugs for hepatitis C in 2017. DAA drugs, which have had a significant but sometimes opposing impact on the growth of drug costs over the last few years, have been reported separately in this analysis.
Demographic change also contributed to the stronger than average push effect in 2017. This was due to an increase in the number of beneficiaries, as well as more active beneficiaries entering the higher-cost 55+ age bracket, among other factors. The volume effect, which has remained somewhat stable over the past few years, had an almost negligible upward push of 0.1% on drug costs in 2017.
Cost savings from generic and biosimilar substitution, as well as price reductions, have stabilized in recent years. Pulling costs down by only 2.2% in 2017, they were not able to offset the increasing cost pressures of the demographic and drug-mix effects.
Drug cost drivers, 2008 to 2017
Click on image for larger view
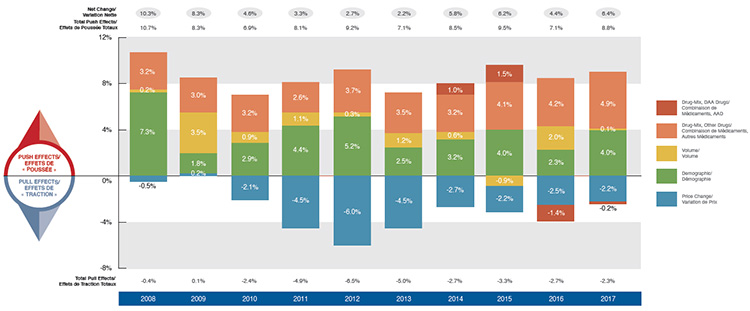
Figure description
This column graph describes the primary factors that impacted the change in the annual drug costs of Canadian private drug plans from 2008 to 2017: demographic, volume, price change, and drug-mix effects. The drug-mix for direct-acting antiviral hepatitis C drugs is reported separately. Total positive push effects, negative pull effects, and net effects are reported for each year.
blank
| Effect |
2008 |
2009 |
2010 |
2011 |
2012 |
2013 |
2014 |
2015 |
2016 |
2017 |
| Drug-Mix, Direct-Acting Antiviral Drugs |
0.0% |
0.0% |
0.0% |
0.0% |
0.0% |
0.0% |
1.0% |
1.5% |
-1.4% |
-0.2% |
| Drug-Mix, Other Drugs |
3.2% |
3.0% |
3.2% |
2.6% |
3.7% |
3.5% |
3.2% |
4.1% |
4.2% |
4.9% |
| Demographic |
7.3% |
1.8% |
2.9% |
4.4% |
5.2% |
2.5% |
3.2% |
4.0% |
2.3% |
4.0% |
| Volume |
0.2% |
3.5% |
0.9% |
1.1% |
0.3% |
1.2% |
0.6% |
-0.9% |
2.0% |
0.1% |
| Price Change |
-0.5% |
0.2% |
-2.1% |
-4.5% |
-6.0% |
-4.5% |
-2.7% |
-2.2% |
-2.5% |
-2.2% |
| Total Push Effects |
10.7% |
8.3% |
6.9% |
8.1% |
9.2% |
7.1% |
8.5% |
9.5% |
7.1% |
8.8% |
| Total Pull Effects |
-0.4% |
0.1% |
-2.4% |
-4.9% |
-6.5% |
-5.0% |
-2.7% |
-3.3% |
-2.7% |
-2.3% |
| Net Change |
10.3% |
8.3% |
4.6% |
3.3% |
2.7% |
2.2% |
5.8% |
6.2% |
4.4% |
6.4% |
High-cost drugs account for most of the drug-mix effect
Ten drugs contributed to over half of the upward 4.9% push from the drug-mix effect in 2017. Most had annual treatment costs exceeding $10,000, including five immunosuppressants, one oncology drug and one drug for the treatment of cystic fibrosis. Other top contributors belonged to the anti-diabetic and psychoanaleptic classes; while these drugs have lower treatment costs, they are used by larger beneficiary populations to treat more common conditions.
Although Epclusa, used in the treatment of hepatitis C, was the top contributor to the drug-mix effect in 2017, pushing costs upward by 0.5%, other DAA drugs pulled costs down to give a net effect of -0.2%. This may reflect the overall market dynamics, such as new drug launches and evolving reimbursement policies, among other factors.
Top drugs contributing to the drug-mix effect, 2017
Click on image for larger view
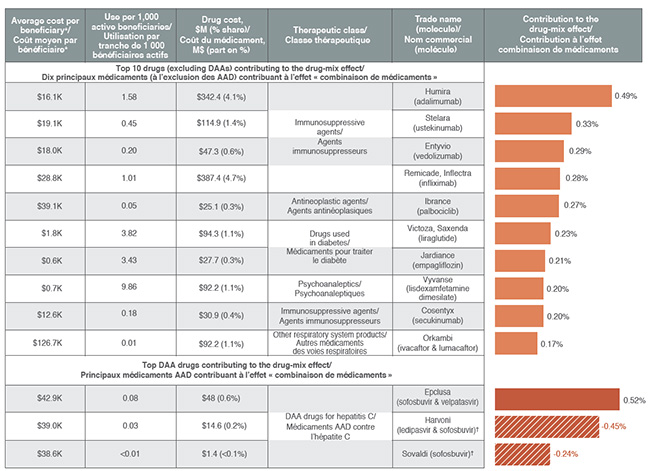
* Total drug cost divided by the number of beneficiaries in a given year, which may include beneficiaries with incomplete treatment costs.
† Incomplete utilization and cost data due to the coordination with publicly reimbursed benefits.
Figure description
blank
| Average cost per beneficiary* |
Use per 1,000 active beneficiaries |
Drug cost, in millions of dollars (% share) |
Therapeutic class |
Trade name (molecule) |
Contribution to the drug-mix effect |
| Top 10 drugs (excluding DAAs) contributing to the drug-mix effect |
| $16.1K |
1.58 |
$342.4 (4.1%) |
Immunosuppressive agents |
Humira (adalimumab) |
0.49 |
| $19.1K |
0.45 |
$114.9 (1.4%) |
Immunosuppressive agents |
Stelara (ustekinumab) |
0.33% |
| $18.0K |
0.20 |
$47.3 (0.6%) |
Immunosuppressive agents |
Entyvio (vedolizumab) |
0.29% |
| $28.8K |
1.01 |
$387.4 (4.7%) |
Immunosuppressive agents |
Remicade, Inflectra (infliximab) |
0.28% |
| $39.1K |
0.05 |
$25.1 (0.3%) |
Antineoplastic agents |
Ibrance (palbociclib) |
0.27% |
| $1.8K |
3.82 |
$94.3 (1.1%) |
Drugs used in diabetes |
Victoza, Saxenda (liraglutide) |
0.23% |
| $0.6K |
3.43 |
$27.7 (0.3%) |
Drugs used in diabetes |
Jardiance (empagliflozin) |
0.21% |
| $0.7K |
9.86 |
$92.2 (1.1%) |
Psychoanaleptics |
Vyvanse (lisdexamfetamine dimesilate) |
0.20% |
| $12.6K |
0.18 |
$30.9 (0.4%) |
Immunosuppressive agents |
Cosentyx (secukinumab) |
0.20% |
| $126.7K |
0.01 |
$92.2 (1.1%) |
Other respiratory system products |
Orkambi (ivacaftor & lumacaftor) |
0.17% |
| Top DAA drugs contributing to the drug-mix effect |
| $42.9K |
0.08 |
$48 (0.6%) |
DAA drugs for hepatitis C |
Epclusa (sofosbuvir & velpatasvir) |
0.52% |
| $39.0K |
0.03 |
$14.6 (0.2%) |
DAA drugs for hepatitis C |
Harvoni (ledipasvir & sofosbuvir)† |
-0.45% |
| $38.6K |
‹0.01 |
$1.4 (‹0.1%) |
DAA drugs for hepatitis C |
Sovaldi (sofosbuvir)† |
-0.24% |
* Total drug cost divided by the number of beneficiaries in a given year, which may include beneficiaries with incomplete treatment costs.
† Incomplete utilization and cost data due to the coordination with publicly reimbursed benefits.
Reimbursing brand drugs at generic prices would increase savings for private plans
The cost-saving effects of generic substitutions (-1.2%) and price reductions (-0.9%) were nearly equal in magnitude in 2017. Although the lower generic pricing achieved through provincial policies benefited private plans, some of the top-selling generic drugs were not subject to the provincial pricing rules (e.g., esomeprazole) and had relatively high prices.
The results also suggest that for top-selling molecules with generic availability, private plans reimburse a sizable portion of brand use at unit costs that are much higher than the generic levels. Important cost savings could be realized through increased generic reimbursement and/or limiting the reimbursement of the brand product to the generic price.
Top-selling generics, 2017
Click on image for larger view
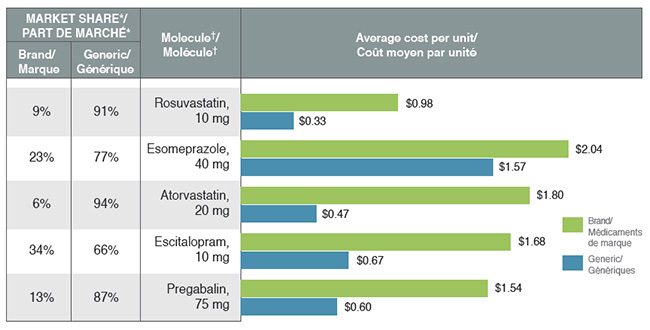
* Based on volume of prescriptions.
† Highest selling strength and form.
Figure description
This bar graph compares the average cost per unit for the five top-selling generics to their corresponding brand-name equivalents. An associated table gives the brand to generic share of prescriptions for each molecule.
blank
| Molecule† |
Brand |
Generic |
Brand versus generic share of prescriptions* |
| Pregabalin, 75 mg |
$1.54 |
$0.60 |
13%; 87% |
| Escitalopram, 10 mg |
$1.68 |
$0.67 |
34%; 66% |
| Atorvastatin, 20 mg |
$1.80 |
$0.47 |
6%; 94% |
| Esomeprazole, 40 mg |
$2.04 |
$1.57 |
23%; 77% |
| Rosuvastatin, 10 mg |
$0.98 |
$0.33 |
9%; 91% |
* Based on volume of prescriptions
† Highest selling strength and form.
Biosimilars may offer future cost savings as the impact of generic price reductions declines
A number of biosimilar products have recently entered the Canadian market including some for top-selling drugs such as Remicade, Enbrel and Lantus. However, their initial uptake has been relatively slow, as these products are not considered interchangeable with the reference biologic and may not be approved for the same indications at introduction.
With the exception of filgrastim, biosimilars captured less than 3% of the volume of prescriptions for their respective molecules in 2017, resulting in minimal cost savings. Price discounts, which also impact the potential cost savings, varied considerably by product, ranging from 25% to 47%.
Biosimilar availability, 2017
| Reference Biologic |
Biosimilar |
| Trade name (molecule) |
Average cost per beneficiary* |
Share of total market |
Trade name |
Market approval date |
Price discount† |
Share of prescriptions |
| Remicade (infliximab) |
$28.8K |
4.7% |
Inflectra |
2014-01-15 |
46.8% |
2.7% |
| Lantus (insulin glargine) |
$0.7K |
0.8% |
Basaglar |
2015-09-01 |
25.0% |
2.3% |
| Neupogen (filgrastim) |
$5.0K |
0.3% |
Grastofil |
2015-12-07 |
25.0% |
21.2% |
| Enbrel (etanercept) |
$13.7K |
1.4% |
Brenzys |
2016-08-31 |
33.7% |
1.7% |
| Erelzi |
2017-04-06 |
37.2% |
<0.1% |
* Total drug cost divided by the number of beneficiaries in a given year, which may include beneficiaries with incomplete treatment costs.
† Based on the Ontario Drug Benefit Formulary.
Note: Values may not add to totals due to rounding and the cross effect.
Method: This study employs a cost driver model to disaggregate and measure the impact of a number of effects. The approach is detailed in the PMPRB report titled The Drivers of Prescription Drug Expenditures: A Methodological Report, 2013.
Source: IQVIA™ Private Pay Direct Drug Plan Database. Capture rate: 85.7%.
Limitation: Sales and unit prices available from the IQVIA™ PDP database do not reflect off-invoice price rebates.
Disclaimer: Although based in part on data provided under license by IQVIA™, the statements, findings, conclusions, views and opinions expressed in this report are exclusively those of the PMPRB and are not attributable to IQVIA™.
NPDUIS is a research initiative that operates independently of the regulatory activities of the PMPRB.