Private Drug Plans in Canada: High-Cost Drugs and Beneficiaries, 2005 to 2015
PDF - 296 kb
The increased availability and use of high-cost drugs has been fueling the recent growth in drug expenditures in Canada, raising concerns over the sustainability of private drug plans. This upcoming PMPRB study provides insight into the impact of high-cost beneficiaries and drugs on private plan expenditures. The results indicate that beneficiaries and drugs costing in excess of $10,000 per year represent a growing market segment with important implications on drug expenditure levels. The analysis uses the IMS Brogan® Private Drug Plan Database for the period from 2005 to 2015.
This is one of three reports in a PMPRB series that analyzes the trends in Canadian private drug plans. This series provides policy makers and other stakeholders with valuable insights into the sources of cost pressures in private drug plans and supports them in predicting future trends and identifying cost-saving opportunities.
Key Findings
A. High-cost beneficiaries
A1. The growing number of high-cost beneficiaries impacts private drug plan costs.
There has been a marked increase in the number of high-cost beneficiaries and related drug costs in recent years. In 2005, an average private drug plan of 100,000 active beneficiaries had about 263 beneficiaries with annual drug costs of $10,000 or more. By 2015,
this number increased to 705, representing a 3.7-fold increase in beneficiaries and 5.1-fold increase in drug costs. In contrast, over a similar period of time, between 2005 and 2014, Canada’s gross domestic product (GDP) grew by 39.2%, while between 2005 and 2013, Canada’s household income per capita grew by 28.6%.‡
Overall, high-cost beneficiaries
accounted for over one-quarter of
private drug plan costs in 2015.
Section A1
Click on image for larger view
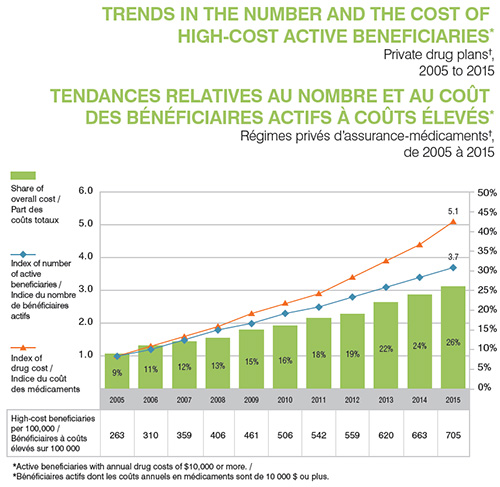
Figure description
This graph depicts the trends in the number and cost of high-cost beneficiaries in private drug plans in Canada from 2005 to 2015. High-cost beneficiaries are defined as active beneficiaries with annual drug costs of $10,000 or more.
On the graph, the share of overall cost is represented by bars and is given for each year. The index for the number of active beneficiaries and the index for drug cost are represented by superimposed lines on the graph. Both indices are set to a value of 1.0 for 2005.
| |
2005 |
2006 |
2007 |
2008 |
2009 |
2010 |
2011 |
2012 |
2013 |
2014 |
2015 |
| Share of overall cost |
9% |
11% |
12% |
13% |
15% |
16% |
18% |
19% |
22% |
24% |
26% |
| Index of number of active beneficiaries |
1.0 |
1.2 |
1.5 |
1.8 |
2.0 |
2.3 |
2.5 |
2.8 |
3.1 |
3.4 |
3.7 |
| Index of drug cost |
1.0 |
1.3 |
1.6 |
1.9 |
2.3 |
2.6 |
2.9 |
3.4 |
3.9 |
4.4 |
5.1 |
The accompanying table gives the number of high-cost beneficiaries per 100,000 active beneficiaries for each year.
| |
2005 |
2006 |
2007 |
2008 |
2009 |
2010 |
2011 |
2012 |
2013 |
2014 |
2015 |
| High-cost beneficiaries per 100,000 |
263 |
310 |
359 |
406 |
461 |
506 |
542 |
559 |
620 |
663 |
705 |
A2. Over the last decade, there has been a marked increase in the number of high-cost beneficiaries, especially those with annual drug costs of over $20,000.
In 2005, an average private drug plan of 100,000 active beneficiaries had only 3 beneficiaries with $50,000 or more in annual drug costs. By 2015, this number had increased to 48, accounting for 5.9% of the total drug plan costs. Over the past decade there has also been a notable increase in the number of active beneficiaries with annual drug costs ranging from $20,000 to $49,999. While these patients accounted for 4.2% of the of total drug plan costs in 2005, by 2015 their share had increased to 13.9%.
Section A2
Click on image for larger view
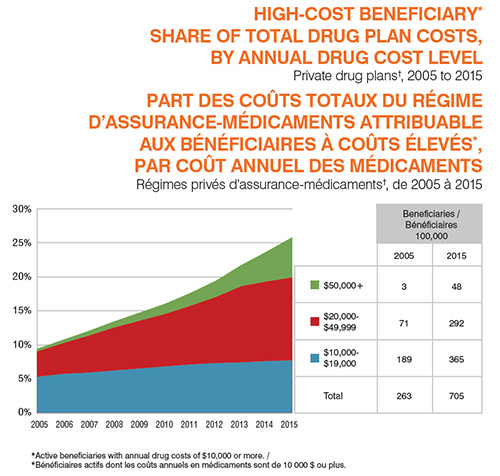
Figure description
This area graph depicts the trend in the annual high-cost beneficiary share of total private drug plan costs from 2005 to 2015. Beneficiaries are grouped according to their annual drug costs: $10,000 to $19,999; $20,000 to $49,999; and $50,000 or more.
| |
2005 |
2006 |
2007 |
2008 |
2009 |
2010 |
2011 |
2012 |
2013 |
2014 |
2015 |
| $10,000 to $19,999 |
5.3% |
5.7% |
5.9% |
6.2% |
6.5% |
6.8% |
7.1% |
7.3% |
7.4% |
7.6% |
7.7% |
| $20,000 to $49,999 |
3.7% |
4.5% |
5.4% |
6.3% |
7.0% |
7.7% |
8.6% |
9.7% |
11.2% |
11.7% |
12.2% |
| $50,000 or more |
0.4% |
0.5% |
0.7% |
0.9% |
1.2% |
1.5% |
1.9% |
2.4% |
3.1% |
4.4% |
5.9% |
The accompanying table gives the number of high-cost beneficiaries per 100,000 active beneficiaries for each of the three groups for 2005 and 2015.
| |
2005 |
2015 |
| $50,000 or more |
3 |
48 |
| $20,000 to $49,999 |
71 |
292 |
| $10,000 to $19,999 |
189 |
365 |
| Total |
263 |
705 |
A3. The patients’ share of the costs for high-cost drugs is substantial, even when they have insurance.
Beneficiary-paid amounts take the form of deductibles, copayments, co-insurances and/or maximums, depending on the plan design. The beneficiary-paid share of private drug plan expenditures has been on the rise in recent years for all patient groups due to cost-containment measures.
The beneficiary-paid amounts vary depending on drug cost levels: lower-cost beneficiaries pay for a higher proportion of their drug costs than higher-cost beneficiaries. For instance, in 2015, beneficiaries with less than $5,000 in drug costs paid 14% of their costs, whereas beneficiaries with over $50,000 paid only 5%. Nevertheless, in absolute amounts, higher-cost beneficiaries pay larger annual average amounts ($4,356) than lower-cost beneficiaries ($64).
Section A3
Click on image for larger view
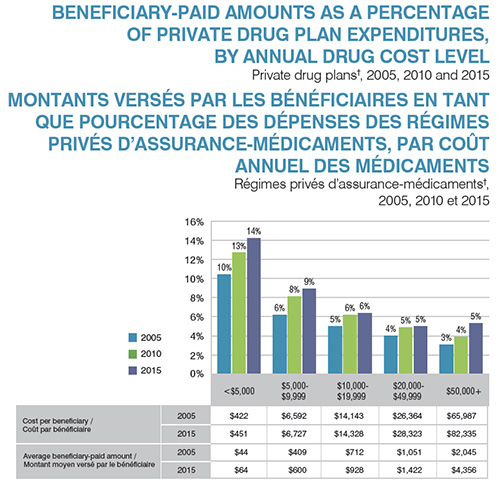
Figure description
This bar graph depicts the beneficiary-paid share of private drug plan expenditures in private drug plans by annual drug cost level for 2005, 2010 and 2015. Five cost levels are considered for each year: less than $5,000; $5,000 to $9,999; $10,000 to $19,999; $20,000 to 49,999; and $50,000 or more.
| |
2005 |
2010 |
2015 |
| Less than $5,000 |
10.4% |
12.7% |
14.2% |
| $5,000 to $9,999 |
6.2% |
8.1% |
8.9% |
| $10,000 to $19,999 |
5.0% |
6.2% |
6.4% |
| $20,000 to $49,999 |
4.0% |
4.9% |
5.0% |
| $50,000 or more |
3.1% |
3.9% |
5.3% |
The table below the graph gives the average cost per beneficiary and beneficiary-paid amount for each of the annual cost levels in 2005 and 2015.
| |
|
Less than $5,000 |
$5,000 to $9,999 |
$10,000 to $19,999 |
$20,000 to $49,999 |
$50,000 or more |
| Cost per beneficiary |
2005 |
$422 |
$6,592 |
$14,143 |
$26,364 |
$65,987 |
| Cost per beneficiary |
2015 |
$451 |
$6,727 |
$14,328 |
$28,323 |
$82,335 |
| Average beneficiary-paid amount |
2005 |
$44 |
$409 |
$712 |
$1,051 |
$2,045 |
| Average beneficiary-paid amount |
2015 |
$64 |
$600 |
$928 |
$1,422 |
$4,356 |
B. High-cost drugs
B1. The growing number of high-cost drugs on the Canadian market had an impact on private drug plan costs.
In 2005, there were 20 drugs on the market with an annual average cost per active beneficiary of $10,000 or more, representing approximately 5% of the total private drug plan costs. By 2015, the number of drugs over this threshold grew by more than five times to 124, representing nearly one-quarter of the private drug plan costs. The cost of high-cost drugs increased 8.2-fold from 2005 to 2015.
Section B1
Click on image for larger view
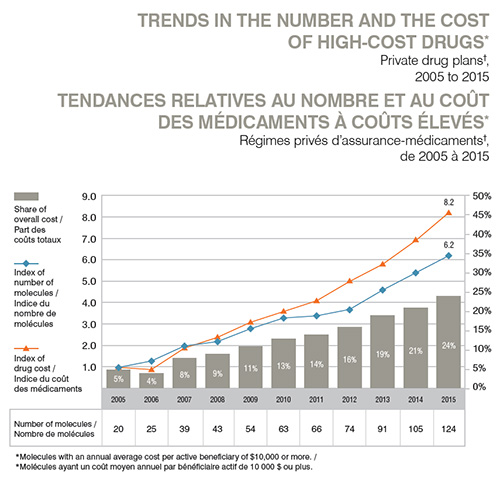
Figure description
This graph depicts the trends in the number and cost of high-cost drugs in private drug plans in Canada from 2005 to 2015. High-cost drugs are defined as molecules with an annual average cost per active beneficiary of $10,000 or more.
On the graph, the share of overall cost is represented by bars and is given for each year. The index for the number of molecules and the index for drug cost are represented by superimposed lines on the graph. Both indices are set to a value of 1.0 for 2005.
| |
2005 |
2006 |
2007 |
2008 |
2009 |
2010 |
2011 |
2012 |
2013 |
2014 |
2015 |
| Share of overall cost |
5% |
4% |
8% |
9% |
11% |
13% |
14% |
16% |
19% |
21% |
24% |
| Index of number of molecules |
1.0 |
1.3 |
2.0 |
2.2 |
2.8 |
3.3 |
3.4 |
3.7 |
4.6 |
5.4 |
6.2 |
| Index of drug cost |
1.0 |
0.9 |
1.9 |
2.4 |
3.1 |
3.6 |
4.1 |
5.0 |
5.8 |
6.9 |
8.2 |
The accompanying table gives the number of molecules for each year.
| |
2005 |
2006 |
2007 |
2008 |
2009 |
2010 |
2011 |
2012 |
2013 |
2014 |
2015 |
| Number of molecules |
20 |
25 |
39 |
43 |
54 |
63 |
66 |
74 |
91 |
105 |
124 |
B2. Over the last decade, there has been an increase in the number of high-cost drugs used in private drug plans.
In 2005, there were only two drugs used in private drug plans that had an average annual drug cost per active beneficiary exceeding $50,000: Cerezyme for the treatment of Gaucher disease, and Prolastin, which is used to treat congenital alpha1-antitrypsin deficiency. By
2015, the number of drugs costing over $50,000 had increased to 20. Nonetheless, these drugs treat rare conditions and only impact a small number of patients.
Section B2
Click on image for larger view
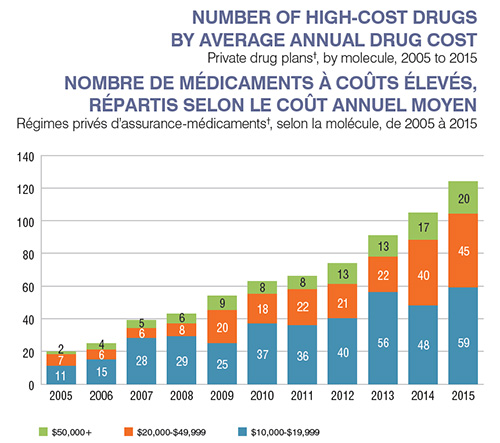
Figure description
This bar graph depicts trend in the annual number of high-cost drugs in private plans from 2005 to 2015 by molecule by three ranges of average annual cost: $10,000 to $19,999; $20,000 to $49,999; and $50,000 or more.
| |
$10,000 to $19,999 |
$20,000 to $49,999 |
$50,000 or more |
| 2005 |
11 |
7 |
2 |
| 2006 |
15 |
6 |
4 |
| 2007 |
28 |
6 |
5 |
| 2008 |
29 |
8 |
6 |
| 2009 |
25 |
20 |
9 |
| 2010 |
37 |
18 |
8 |
| 2011 |
36 |
22 |
8 |
| 2012 |
40 |
21 |
13 |
| 2013 |
56 |
22 |
13 |
| 2014 |
48 |
40 |
17 |
| 2015 |
59 |
45 |
20 |
B3. The 10 top-selling high-cost drugs account for 16% of private drug plan costs.
These top-selling drugs with an annual average cost per active beneficiary of $10,000 or more belong to four therapeutic areas: direct-acting antiviral drugs (J05A), immunostimulants (L03A), immunosuppressants (L04A), and other systemic drugs for obstructive airway diseases (R03D). With the exception of Gilenya and Harvoni, the list is composed of biologic drugs.
Section B3
Click on image for larger view
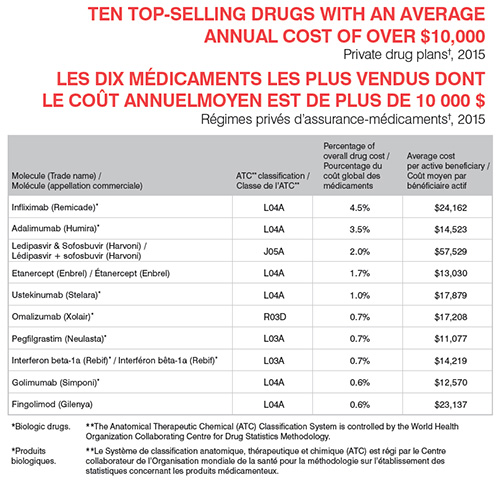
Figure description
Ten top-selling drugs with an average annual cost of over $10,000, Private drug plans†, 2015
| Molecule (Trade Name) |
ATC** Classification |
Percentage of overall drug cost |
Average cost per active beneficiary |
| Infliximab (Remicade)* |
LO4A |
4.5% |
$24,162 |
| Adalimumab (Humira)* |
LO4A |
3.5% |
$14,523 |
| Ledipasvir and Sofosbuvir (Harvoni) |
JO5A |
2.0% |
$57,529 |
| Etanercept (Enbrel) |
LO4A |
1.7% |
$13,030 |
| Ustekinumab (Stelara)* |
LO4A |
1.0% |
$17,879 |
| Omalizumab (Xolair)* |
R03D |
0.7% |
$17,208 |
| Pegfilgrastim (Neulasta)* |
L03A |
0.7% |
$11,077 |
| Interferon beta-1a (Rebif)* |
L03A |
0.7% |
$14,219 |
| Golimumab (Simponi)* |
L04A |
0.6% |
$12,570 |
| Fingolimod (Gilenya) |
L04A |
0.6% |
$23,137 |
*Biologic drugs. **The Anatomical Therapeutic Chemical (ATC) Classification System is controlled by the World Health Organization Collaborating Centre for Drug Statistics Methodology.
Data Sources: † IMS Brogan Private Pay Direct Drug Plan Database. ‡ Statistics Canada, CANSIM, Tables 384-0038 and 384-5000.
Limitation: The average annual cost per active beneficiary at drug level based on private drug plan data may be underestimated, as some beneficiaries
may only use the drug during part of the calendar year analyzed.
Disclaimer: Although based on data provided under license by the IMS Brogan Private Pay Direct Drug Plan Database, the statements, findings, conclusions, views and opinions expressed in this report are exclusively those of the PMPRB and are not attributable to IMS Brogan.
NPDUIS is a research initiative that operates independently of the regulatory activities of the PMPRB.