Cost Pressure of the New Hepatitis C Drugs in Canada
PDF - 310 kb
The pricing, utilization and cost related to the direct-acting antivirals (DAAs) for the treatment of hepatitis C has become a critical issue for public plans, private insurers and patients. This study provides insight into the use, pricing and cost of DAAs in Canada and internationally in 2015, along with a retrospective look at the recent trends.
The international analysis focuses on the PMPRB7 countries: France, Germany, Italy, Sweden, Switzerland, the United Kingdom (UK) and the United States (US). Results for the Canadian market are reported at the national level, as well as for the private and public
market segments.
Key Findings
1. The market shares of direct-acting antivirals for hepatitis C are on the rise in Canada and internationally.
The sales of DAA drugs grew markedly in Canada over the last two years, exceeding $182 million in the second quarter of 2015, and accounting for 3.0% of all pharmaceutical sales. International markets show similar trends. The DAA market share in Canada is slightly below that in Germany and Switzerland, and higher than in France and the UK. Italy has the highest market share for DAAs. Note that the variations in market share are a function of utilization and price, for both the DAA drugs and the entire market.
In some countries, DAA drugs are primarily available through the hospital sector (Italy and France), while in others they are available mainly through the retail sector (Canada Germany, and Sweden) or a combination of both (US, UK and Switzerland). This analysis captures both retail and hospital markets to provide a complete picture of DAA utilization and sales.
Section 1
Click on image for larger view
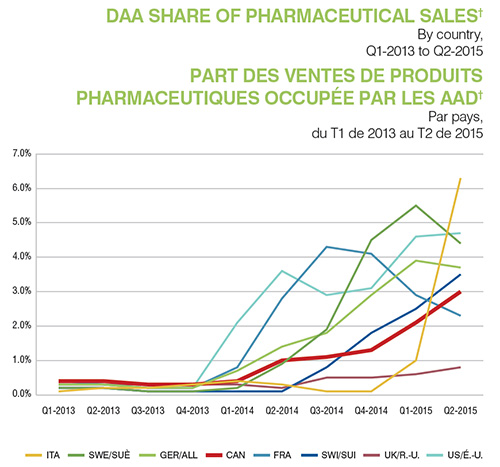
Figure description
This line graph shows the increase in the share of pharmaceutical sales for direct-acting antiviral drugs from the first quarter of 2013 to the second quarter of 2015 for Canada and the seven PMPRB comparator countries. The share of sales for each county is shown as a separate line on the graph. Values are given in the table below.
| |
First quarter of 2013 |
Second quarter of 2013 |
Third quarter of 2013 |
Fourth quarter of 2013 |
First quarter of 2014 |
Second quarter of 2014 |
Third quarter of 2014 |
Fourth quarter of 2014 |
First quarter of 2015 |
Second quarter of 2015 |
| Italy |
0.1% |
0.2% |
0.2% |
0.3% |
0.4% |
0.3% |
0.1% |
0.1% |
1.0% |
6.3% |
| Sweden |
0.2% |
0.2% |
0.1% |
0.1% |
0.2% |
0.9% |
1.9% |
4.5% |
5.5% |
4.4% |
| Germany |
0.3% |
0.3% |
0.2% |
0.2% |
0.7% |
1.4% |
1.8% |
2.9% |
3.9% |
3.7% |
| Canada |
0.4% |
0.4% |
0.3% |
0.3% |
0.4% |
1.0% |
1.1% |
1.3% |
2.1% |
3.0% |
| France |
0.4% |
0.3% |
0.2% |
0.2% |
0.8% |
2.8% |
4.3% |
4.1% |
2.9% |
2.3% |
| Switzerland |
0.2% |
0.2% |
0.1% |
0.1% |
0.1% |
0.1% |
0.8% |
1.8% |
2.5% |
3.5% |
| United Kingdom |
0.3% |
0.3% |
0.3% |
0.3% |
0.3% |
0.2% |
0.5% |
0.5% |
0.6% |
0.8% |
| United States |
0.3% |
0.3% |
0.2% |
0.2% |
2.1% |
3.6% |
2.9% |
3.1% |
4.6% |
4.7% |
2. The use of direct-acting antiviral drugs for hepatitis C in Canada is slightly lower than in foreign markets.
While the use of DAA drugs is trending upward, a snapshot in time for the first half of 2015 suggests that the Canadian exposure rate to this treatment is just below Germany and Switzerland, slightly lower than in Italy and Sweden, and slightly higher than in France. The US and the UK are the two outliers, with exposure rates 3.8-fold higher and 0.2-fold lower than in Canada, respectively.
The exposure rates in this context were calculated by converting the physical quantities of DAA drugs sold in a given country into defined daily doses (DDD)1 and controlling for population differences by expressing the results per 1 million inhabitants.
The Canadian exposure rate thus determined was set equal to 1, and the values for the other countries were determined relative to this benchmark index. The results take the form of the foreign-to-Canadian ratio of exposure to DAAs reported in the figure.
The results for the foreign-to-Canadian ratio of exposure to DAAs suggest that in the first six months of 2015, Harvoni was predominantly used in Canada, Germany, the US and Switzerland. The other countries analyzed show a higher consumption of Sovaldi and Galexos (Olysio). The low use of Harvoni in these countries may be due to delays in funding and/or funding restrictions.
1 DDD: Sovaldi 0.4, Harvoni 0.4, Galexos (Olysio) 0.15, Victrelis 2.4, Incivek 2.25 and Holkira Pak (Viekira, Viekirax) 0.5.
Section 2
Click on image for larger view
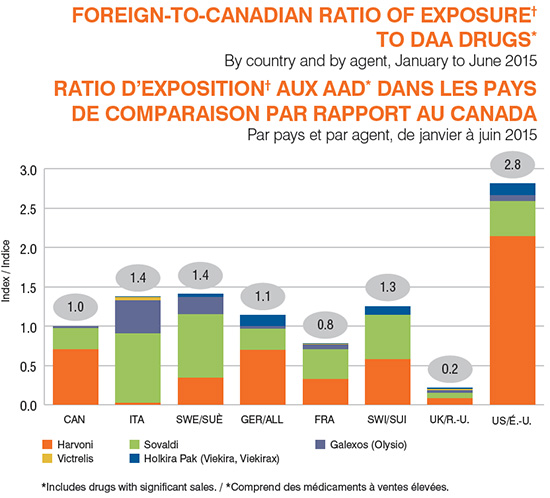
Figure description
This bar graph depicts the foreign-to-Canadian exposure ratios for direct-acting antiviral drugs with significant sales from January to June 2015. The index for Canada is set to one, and each of the seven PMPRB comparator countries is compared to this benchmark. The total height of each bar represents the overall exposure ratio by country, with coloured areas depicting the contribution of individual drugs. Values are given in the table below. Note that small values (less than 0.05) round to 0.0.
| |
Total exposure ratio as an index |
Harvoni |
Sovaldi |
Galexos (Olysio) |
Victrelis |
Holkira Pak (Viekira, Viekirax) |
| Canada |
1.0 |
0.7 |
0.3 |
0.0 |
0.0 |
0.0 |
| Italy |
1.4 |
0.0 |
0.9 |
0.4 |
0.0 |
0.0 |
| Sweden |
1.4 |
0.3 |
0.8 |
0.2 |
‒ |
0.0 |
| Germany |
1.1 |
0.7 |
0.3 |
0.0 |
‒ |
0.1 |
| France |
0.8 |
0.3 |
0.4 |
0.1 |
0.0 |
0.0 |
| Switzerland |
1.2 |
0.6 |
0.6 |
‒ |
‒ |
0.1 |
| United Kingdom |
0.2 |
0.1 |
0.1 |
0.0 |
0.0 |
0.0 |
| United States |
2.8 |
2.1 |
0.4 |
0.1 |
0.0 |
0.2 |
3. Direct-acting antiviral drug prices for hepatitis C in Canada are comparable to those in foreign markets.
Except for prices in the US and Switzerland, DAA drug prices in Canada are similar to those in other countries. Note that the prices do not reflect managed entry agreements (product listing agreements in Canada) and other budget caps that may exist.
For the international price comparison, foreign prices were converted to Canadian dollars based on the January to June 2015 currency exchange rates. Canada’s relative position in terms of price is impacted by fluctuations in the exchange rates over time.
Section 3
Click on image for larger view
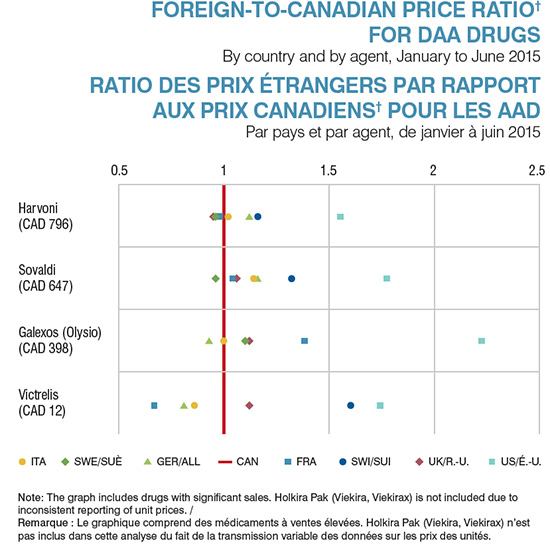
Figure description
This graph plots the foreign-to-Canadian price ratios for individual direct-acting antiviral drugs with significant sales from January to June 2015 for the seven PMPRB comparator countries. The Canadian price is indexed to one for comparison. Canadian prices are given for each drug in Canadian dollars. Note that the Holkira Pak (Viekira, Viekirax) is not included due to inconsistent reporting of unit prices.
| |
Italy |
Sweden |
Germany |
France |
Switzerland |
United Kingdom |
United States |
| Harvoni (CAD 796) |
1.02 |
0.96 |
1.12 |
0.98 |
1.16 |
0.95 |
1.55 |
| Sovaldi (CAD 647) |
1.14 |
0.96 |
1.16 |
1.04 |
1.32 |
1.06 |
1.77 |
| Galexos (Olysio) (CAD 398) |
1.00 |
1.10 |
0.93 |
1.38 |
‒ |
1.12 |
2.22 |
| Victrelis (CAD 12) |
0.86 |
‒ |
0.81 |
0.67 |
1.60 |
1.12 |
1.74 |
4. The market share for direct-acting antiviral drugs for the treatment of hepatitis C is higher in some Canadian public drug plans than in private drug plans.
In 2015, public payers funded an estimated 60% of the national sales of DAA drugs‡. The data available for a few Canadian public plans indicates that DAAs accounted for 3.1%, 4.0% and 4.7% of total drug plan costs in Manitoba, Ontario and Nova Scotia, respectively, while in national private drug plans, they accounted for 2.7%. Harvoni was the main contributor to the high cost share in both public and private market segments.
Provincial variations may be driven by the timing of the listing decisions, plan designs, demographics, and disease prevalence, among other things. The public drug plan in Ontario has the highest rate of use of DAAs, with an average of 104 per 100,000 drug plan
beneficiaries receiving these treatments.
Section 4
Click on image for larger view
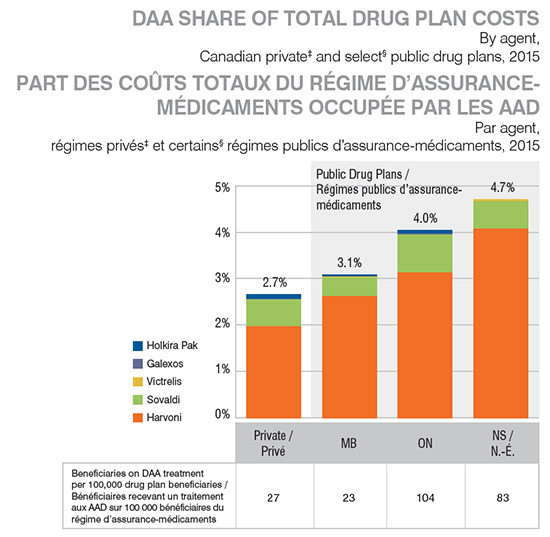
Figure description
This bar graph compares the direct-acting antiviral share of total drug plan costs for private drug plans in Canada and public plans in Manitoba, Ontario and Nova Scotia in 2015. Each bar represents a drug plan. Individual bars are segmented to show the relative contribution of each direct-acting antiviral drug.
| |
Private |
Manitoba |
Ontario |
Nova Scotia |
| Harvoni |
1.97% |
2.62% |
3.12% |
4.07% |
| Sovaldi |
0.58% |
0.41% |
0.82% |
0.60% |
| Victrelis |
0.00% |
0.01% |
0.01% |
0.03% |
| Galexos |
0.01% |
0.00% |
0.02% |
0.00% |
| Holkira Pak |
0.10% |
0.04% |
0.07% |
‒ |
| Beneficiaries on direct-acting antiviral treatment per 100,000 drug plan beneficiaries |
27 |
23 |
104 |
83 |
5. Direct-acting antiviral treatments for hepatitis C may be costly even for patients with private coverage.
Even though private drug plan beneficiaries contribute less toward the cost of new hepatitis drugs (7.4%) compared to their average contribution for all drugs (11.5%), the absolute amounts that they pay can be in the range of thousands of dollars due to high cost of these new treatments. By comparison, public drug plan beneficiaries in provinces with available data (Manitoba, Ontario and Nova Scotia) contribute 0.7%, on average, to the cost of the DAA drugs. Small provincial variations in beneficiary-paid amounts exist in public markets due to plan designs differences.
Beneficiary-paid amounts are in the form of deductible, copayments, co-insurances and/or maximums, depending on the plan design. Note that the beneficiary-paid amounts may be overestimated due to the coordination of benefits with public or other private plans that are not reflected in the data.
Section 5
Click on image for larger view
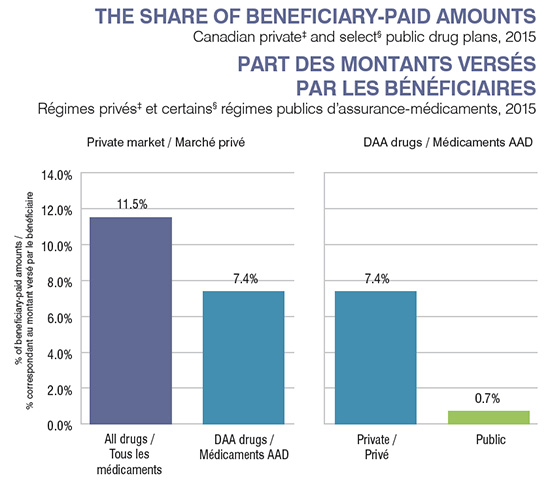
Figure description
These two bar graphs depict the share of beneficiary-paid amounts for Canadian private drug plans and select public drug plans in 2015. The public plan share represents drug plans in Manitoba, Ontario and Nova Scotia.
Private market
The left-hand graph compares the average beneficiary-paid contribution for all drugs in the private market (11.5%) to the share paid for direct-acting antiviral drugs (7.4%).
Direct-acting antiviral drugs
The right-hand graph compares the average beneficiary-paid contribution for direct-acting antiviral drugs in the private market (7.4%) to the share paid in the public plans (0.7%).
6. Privately insured patients using direct-acting antivirals for hepatitis C are predominantly male aged 55 to 64 years.
There are more men (70%) than women (30%) reimbursed for the new hepatitis C treatments in private drug plans in Canada. This might be due to some of the risk factors that are more pronounced in male population. It is also believed that men are more likely to develop
serious liver disease than women. In both gender groups, beneficiaries aged 55-64 are the most affected population.
Section 6
Click on image for larger view
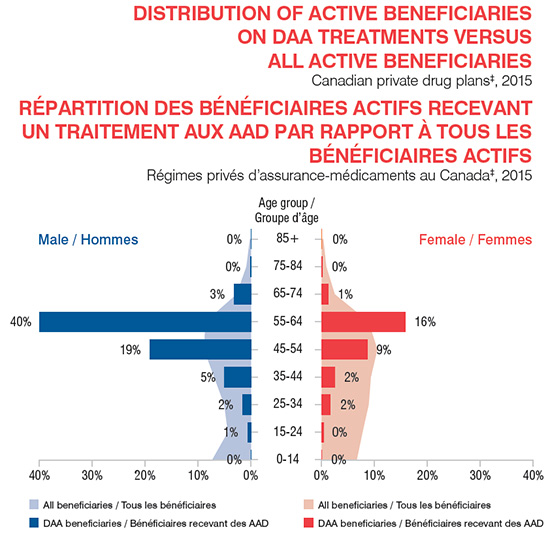
Figure description
This graph depicts the distribution of active beneficiaries taking direct-acting antiviral treatments versus total beneficiaries in Canadian private plans in 2015. The beneficiary population is broken out by gender and age range. A set of bars give the percentage of beneficiaries using direct-acting antiviral drugs for each age grouping and the shaded area behind the bars gives the percentage of all beneficiaries that fall into each particular age range.
| |
0‒14 years |
15‒24 years |
25‒34 years |
35‒44 years |
45‒54 years |
55‒64 years |
65‒74 years |
75‒84 years |
85+ years |
| Female: Percentage of hepatitis C patients |
0.00% |
0.39% |
1.66% |
2.44% |
8.72% |
15.77% |
1.24% |
0.18% |
0.00% |
| Male: Percentage of hepatitis C patients |
0.00% |
0.63% |
1.57% |
5.04% |
19.09% |
39.96% |
3.20% |
0.12% |
0.00% |
| Female: Percentage of all beneficiaries |
6.60% |
7.68% |
8.85% |
9.26% |
10.48% |
8.84% |
2.44% |
0.84% |
0.28% |
| Male: Percentage of all active beneficiaries |
7.30% |
4.35% |
5.02% |
6.93% |
8.84% |
8.59% |
2.68% |
0.84% |
0.19% |
Data Sources: † MIDAS™ Database, Manufacturer Ex-factory Sales in Retail and Hospital, IMS AG. All Rights Reserved.
‡ IMS Brogan Private Drug Plan Database. § NPDUIS Database (Manitoba, Ontario and Nova Scotia). Manitoba data is given for the period from January to November 2015.
Disclaimer: Although based in part on data provided by the Canadian Institute for Health Information (CIHI) and under license from the IMS AG’s MIDAS™ Database and the IMS Brogan Private Pay Direct Drug Plan Database, the statements, findings, conclusions, views and opinions expressed in this report are exclusively those of the PMPRB and are not attributable to CIHI, IMS Brogan or IMS AG.
NPDUIS is a research initiative that operates independently of the regulatory activities of the PMPRB.