RAPPORT ANNUEL 2008
Le mandat du Conseil d´examen du prix des médicaments brevetés est de veiller à ce que les prix auxquels les brevetés vendent leurs médicaments brevetés au Canada ne soient pas excessifs et de faire rapport des tendances des prix de vente de tous les médicaments et des dépenses de R-D des brevetés.
Table des matières
- FAITS SAILLANTS 2008
- MESSAGE DU PRÉSIDENT
- LE CONSEIL D’EXAMEN DU PRIX DES MÉDICAMENTS BREVETÉS : MANDAT ET COMPÉTENCES
- GOUVERNANCE
- EXIGENCES EN MATIÈRE DE RAPPORT
- ENGAGEMENTS DE CONFORMITÉ VOLONTAIRE
- AUDIENCES
- APPELS INTERJETÉS AUPRÈS DE LA COUR FÉDÉRALE
- MODIFICATIONS APPORTÉES AU RÈGLEMENT SUR LES MÉDICAMENTS BREVETÉS
- RÉVISION DES LIGNES DIRECTRICES DU CONSEIL SUR LES PRIX EXCESSIFS
- RAPPORT SUR LES PRINCIPALES TENDANCES, 2008
- Tendances des prix
- COMPARAISON DES PRIX AU CANADA AVEC CEUX PRATIQUÉS DANS LES PAYS DE COMPARAISON
- TENDANCES DE L’INDUSTRIE CANADIEN - NE DE FABRICATION DE MÉDICAMENTS
- ANALYSE DES DÉPENSES DE RECHERCHEDÉVELOPPEMENT
- SYSTÈME NATIONAL D’INFORMATION SUR L’UTILISATION DES MÉDICAMENTS PRESCRITS
- COMMUNICATIONS
- GLOSSAIRE
- ANNEXE 1
- ANNEXE 2
- ANNEXE 3
- ANNEXE 4
FAITS SAILLANTS 2008
MANDAT DE RÉGLEMENTATION
En 2008, nos activités de réglementation se sont faites plus pressantes.
CONFORMITÉ
- 78 nouveaux produits médicamenteux pour usage humain ont fait l’objet d’un rapport au CEPMB. De ce nombre, 19 sont de nouvelles substances actives (commercialisées sous 26 DIN). Soixante-quatorze de ces 78 nouveaux produits médicamenteux ont été soumis à l’examen de prix. Les prix de 14 de ces produits ont été jugés plus élevés que ne l’autorisent les Lignes directrices, justifiant ainsi la tenue d’une enquête.
- Au total, 1 260 produits médicamenteux brevetés pour usage humain étaient en 2008 assujettis à la compétence du CEPMB en matière d’examen de prix.
APPLICATION
- En 2008 jusqu’en avril 2009 inclusivement, le Conseil a approuvé 9 engagements de conformité volontaire
- Le Conseil a clos 4 audiences et émis 5 nouveaux Avis d’audience (dont 1 en 2009). Dans deux autres affaires, le Conseil n’a pas encore rendu sa décision. Actuellement, 8 affaires sont en cours dont une, celle du Nicoderm, depuis 1999.
MANDAT DE RAPPORT TENDANCES DES VENTES
TENDANCES DES VENTES
- La valeur des ventes au Canada de produits médicamenteux brevetés a augmenté de 5,0 % en 2008 et totalisé 13,0 milliards de dollars.
- La part des ventes de produits médicamenteux brevetés déclarées par les brevetés par rapport aux ventes de tous les médicaments brevetés et non brevetés suit la même tendance que celle observée au cours des dernières années. En effet, cette part a diminué en 2008, passant de 66 % qu’elle était en 2007 à 64,9 %.
- Ce sont les produits du groupe antiinfectieux généraux pour usage systémique et les produits antiparasitaires et ceux du groupe agents antinéoplasiques et immunomodulateurs (médicaments utilisés en chimiothérapie) qui ont le plus contribué en 2008 à l’augmentation de la croissance de la valeur des ventes.
TENDANCES DES PRIX DES PRODUITS MÉDICAMENTEUX BREVETÉS
- Variations des prix au Canada – les prix départusine des produits médicamenteux brevetés, mesurés à l’aide de l’Indice des prix des médicaments brevetés (IPMB), ont augmenté de 0,1 % en 2008. Pour la même période, l’indice des prix à la consommation a augmenté de 2,3 %.
- Prix dans les pays de comparaison par rapport aux prix au Canada – les prix au Canada des produits médicamenteux brevetés se situaient en 2008 au troisième rang des prix les plus élevés des sept pays de comparaison.
- Le ratio du prix international médian (PIM) par rapport au prix au Canada est passé de 0,98 (2007) à 0,96 (2008).
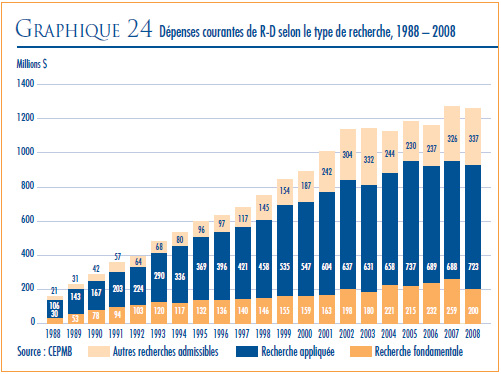
RECHERCHE-DÉVELOPPEMENT
- En 2008, les brevetés ont fait rapport de dépenses de R-D de 1,3 milliard de dollars, ce qui représente une baisse de 1,1 % par rapport à 2007.
- Les brevetés membres de Rx&D sont à la source de 89,4 % des dépenses de R-D déclarées pour 2008. La valeur des dépenses de R-D déclarées par les brevetés non membres de Rx&D a totalisé 0,1 milliard de dollars.
- Le ratio des dépenses de R-D par rapport aux recettes tirées des ventes pour l’ensemble des brevetés a légèrement diminué, passant de 8,3 % qu’il était en 2007 à 8,1 % en 2008, alors que celui des membres de Rx&D s’est maintenu à 8, 9 % qu’il était en 2007. Depuis 2001, ces ratio se situent sous la barre des 10 % pour l’ensemble des brevetés et depuis 2003 pour les brevetés membres de Rx&D.
Le 29 mai 2009
L’honorable Leona Aglukkaq, C.P., députée
Ministre de la Santé
Chambre des communes
Ottawa (Ontario)
K1A 0A6
Madame la ministre,
J’ai le plaisir de vous présenter, conformément aux articles 89 et 100 de la Loi sur les brevets, le Rapport annuel du Conseil d’examen du prix des médicaments brevetés pour l’exercice terminé le 31 décembre 2008. Croyant le tout conforme, je vous prie d’agréer, Madame la ministre, l’assurance de mes sentiments distingués.
Brien G. Benoit, MD
Président
MESSAGE DU PRÉSIDENT
L’année 2008 a marqué le vingtième anniversaire du début des activités du CEPMB. Tout au cours de ces vingt années, nous avons assisté à d’importants changements économiques et sociaux qui ont eu une incidence indéniable sur le régime canadien de soins de santé et sur l’environnement pharmaceutique.
L’année 2008 a également été remplie de rebondissements avec ses différentes priorités et un accroissement de la charge de travail du Conseil et des membres de son personnel. Sans pour autant négliger ses activités de réglementation et de rapport, le Conseil a mené à terme au cours de la dernière année quatre audiences et engagé quatre nouvelles affaires et même une cinquième en 2009. Dans la plupart des cas, les affaires devant le Conseil portent sur les prix ou sur des questions scientifiques touchant les médicaments de marque brevetés, quoique certaines affaires plus récentes ont porté sur la compétence du Conseil, nommément face aux médicaments provenant d’autres pays rendus disponibles sur notre marché en vertu du Programme d’accès spécial de Santé Canada et aux produits médicamenteux génériques brevetés. Les audiences devant le Conseil exigent beaucoup de temps, de ressources, d’engagement et de réflexion, mais en contrepartie elles donnent aux brevetés la possibilité de saisir le Conseil de questions essentielles pour leurs activités commerciales. Dans quelques cas, les décisions du Conseil ont fait l’objet d’une requête en révision judiciaire devant la Cour fédérale, ce qui a permis d’éclairer le Conseil et les brevetés sur l’interprétation de la loi.
Le processus consultatif du Conseil sur la révision de ses Lignes directrices a également engagé son dernier tournant au cours de l’exercice faisant l’objet du présent rapport. Mis en branle en 2005, cet examen avait pour objectif d’assurer l’équité et la transparence des examens de prix ainsi que la prévisibilité de leurs résultats. Les consultations, qui ont aussi profité de la contribution de cinq groupes de travail, ont cherché à déterminer s’il y avait lieu de réviser les Lignes directrices afin qu’elles demeurent utiles, pertinentes et efficaces dans l’environnement pharmaceutique que nous connaissons et, le cas échéant, quels changements devraient être apportés et comment ils devraient l’être. Les mémoires que nous ont fait parvenir les brevetés en suivi à notre document de discussion de janvier 2008 et les rapports des groupes de travail ont inspiré le Conseil dans la préparation de la version révisée des Lignes directrices qui a été soumise en août 2008 à la consultation des intervenants. En mars 2009, après avoir pris connaissance des commentaires exprimés par les intervenants, une nouvelle version des Lignes directrices a été finalisée et soumise à nouveau à l’examen des intervenants qui nous ont fourni des commentaires et des recommandations utiles. Le Conseil publiera en juin 2009 ses nouvelles Lignes directrices qui entreront en vigueur le 1er janvier 2010.
Le Conseil poursuit ses activités de rapport. En effet, il travaille toujours en étroite collaboration avec les provinces et les territoires au niveau des analyses effectuées au titre du Système national d’information sur l’utilisation des médicaments prescrits.
Le Conseil ne ménage aucun effort pour exercer son mandat d’une façon ouverte, efficace et efficiente dans un contexte de bonne gouvernance et de responsabilisation. À cette fin, nous nous proposons de continuer de faire appel à la participation de nos intervenants qui, comme ils l’ont démontré au cours des dernières années, a une valeur inestimable.
Enfin, permettez-moi de remercier tous les membres du personnel pour leur dévouement, leur enthousiasme et leur soutien assidu. Je profite également de l’occasion pour souligner le grand dévouement des membres du Conseil et pour les remercier pour leur bon travail.
Brien G. Benoit, MD
Président
LE CONSEIL D’EXAMEN DU PRIX DES MÉDICAMENTS BREVETÉS : MANDAT ET COMPÉTENCES
Le Conseil d’examen du prix des médicaments brevetés est un organisme indépendant qui détient des pouvoirs quasi judiciaires. Il a été créé par le Parlement en 1987 en vertu de la Loi sur les brevets (Loi). La Ministre de la Santé est responsable de l’application des dispositions pharmaceutiques de la Loi formulées aux articles 79 à 103.
Même s’il fait techniquement partie du portefeuille de la Santé, le CEPMB exerce son mandat en toute indépendance de la ministre de la Santé.1 Le CEPMB fonctionne également d’une façon indépendante des autres organismes, à savoir Santé Canada qui vérifie l’innocuité et l’efficacité des médicaments et les approuve ; les différents régimes publics fédéraux, provinciaux et territoriaux d’assurance-médicaments qui autorisent l’inscription des médicaments sur leurs formulaires de médicaments admissibles à un remboursement et qui déterminent la valeur des remboursements ; et le Programme commun d’examen des médicaments. Ce programme évalue l’efficience des médicaments avant leur inscription sur les formulaires des régimes publics d’assurance-médicaments participants.
MANDAT
Le mandat du CEPMB comporte les deux volets suivants :
RÉGLEMENTATION
Veiller à ce que le prix auxquels les brevetés vendent leurs médicaments brevetés au Canada ne soient pas excessifs.
RAPPORT
Faire rapport des tendances des prix de vente de tous les médicaments ainsi que des dépenses de R-D des brevetés.
COMPÉTENCE
RÉGLEMENTATION
Le CEPMB vérifie les prix auxquels les brevetés vendent leurs produits médicamenteux brevetés – le prix départ-usine – pour usage humain ou pour usage vétérinaire distribués sous ordonnance ou en vente libre aux grossistes, aux hôpitaux, aux pharmacies et autres clients canadiens et veille à ce que ces prix ne soient pas excessifs. Le CEPMB réglemente le prix de chaque produit médicamenteux breveté, plus précisément de chaque concentration de chaque forme posologique de chaque produit médicamenteux breveté offert sur le marché canadien. C’est généralement à ce niveau que Santé Canada attribue le numéro d’identification de drogue (DIN).
La Cour fédérale d’appel a déterminé les conditions où, légalement, un brevet est lié à un médicament. De l’avis de la Cour, il doit exister entre le brevet et le médicament « un lien si tenu soit-il », ce qui suppose une application vaste de la compétence du Conseil. La compétence du Conseil ne s’applique pas qu’aux produits médicamenteux dont le brevet porte sur son ingrédient actif, mais elle s’applique également aux médicaments auxquels un brevet est lié, que ce brevet porte sur un procédé de fabrication, un mode d’administration, une forme posologique, l’indication/utilisation, la préparation ou autre. Les produits médicamenteux brevetés ne sont pas nécessairement non plus des produits de marque. En effet, certains fabricants de produits génériques sont assujettis à la compétence du Conseil du fait qu’ils vendent en vertu d’une licence d’exploitation le même produit que le produit de marque ou, encore, qu’ils sont titulaires d’un brevet visant le procédé de conditionnement ou de traitement de produits génériques.
Le CEPMB n’est pas habilité à réglementer les prix des médicaments non brevetés. Il n’a aucun droit de regard sur les prix de vente au gros et au détail des médicaments brevetés et non brevetés ni sur les honoraires des pharmaciens. La distribution, l’ordonnance et le remboursement des médicaments ne relèvent pas non plus de sa compétence. En vertu du Règlement sur les médicaments brevetés, les brevetés doivent informer le CEPMB de leur intention de vendre un nouveau produit médicamenteux breveté sur le marché canadien. Après leur première vente, les brevetés doivent faire rapport au CEPMB du prix de vente de leur médicament et de la quantité vendue. Par la suite, pour chaque semestre, ils doivent faire rapport des prix et des ventes au Canada des différentes concentrations de leurs médicaments aux fins de la réglementation de leurs prix. Même s’ils ne sont pas tenus de faire approuver au préalable les prix de vente de leurs médicaments, les brevetés doivent respecter à la lettre les dispositions de la Loi pour que les prix de vente au Canada de leurs médicaments brevetés ne soient pas excessifs. Lorsque, à l’issue d’une audience publique, il apparaît que le prix d’un médicament vendu sur un marché canadien est excessif, le Conseil peut rendre une ordonnance qui oblige le breveté à réduire le prix de son médicament et à appliquer les mesures qui lui sont dictées pour rembourser les recettes excessives encaissées.
SANTÉ CANADA VÉRIFIE LA CONFORMITÉ DES NOUVEAUX MÉDICAMENTS À LA LOI SUR LES ALIMENTS ET DROGUES ET À SON RÈGLEMENT D’APPLICATION. L’AUTORISATION OFFICIELLE DE COMMERCIALISER OU DE DISTRIBUER UN MÉDICAMENT AU CANADA EST ACCORDÉE AU MOYEN D’UN AVIS DE CONFORMITÉ. MÊME SANS AVIS DE CONFORMITÉ, UN MÉDICAMENT PEUT ÊTRE TEMPORAIREMENT DISTRIBUÉ SUR UN MARCHÉ CANADIEN, NOMMÉMENT À TITRE DE NOUVELLE DROGUE DE RECHERCHE OU, ENCORE, AU TITRE DU PROGRAMME D’ACCÈS SPÉCIAL DE SANTÉ CANADA.
RAPPORT
Le CEPMB rend annuellement compte de ses activités au Parlement par le truchement du ministre de la Santé. Le rapport annuel, qui porte sur l’année civile terminée, présente également une analyse des tendances des prix de tous les médicaments et fait rapport des dépenses de R-D des brevetés au Canada. Par ailleurs, en vertu de l’article 90 de la Loi, le ministre de la Santé a confié deux responsabilités additionnelles au CEPMB, à savoir le Système national d’information sur l’utilisation des médicaments prescrits (SNIUMP) et les suivi et rapport des tendances des prix des médicaments non brevetés distribués sous ordonnance.
Système national d’information sur l’utilisation des médicaments prescrits (SNIUMP)
Depuis 2001, en vertu d’une entente intervenue entre les ministres fédéral, provinciaux et territoriaux de la Santé, le CEPMB effectue des recherches au titre du Système national d’information sur l’utilisation des médicaments prescrits (SNIUMP). Le SNIUMP a pour fonction de produire des analyses critiques des prix des médicaments distribués sous ordonnance, de l’utilisation faite de ces médicaments et des tendances observées au niveau de leurs coûts et d’en fournir les résultats au régime canadien de soins de santé pour améliorer sa compréhension de la façon dont les médicaments d’ordonnance sont utilisés au Canada et des facteurs d’augmentation des coûts.
Prix des médicaments non brevetés distribués sous ordonnance
En 2005, intervenant aux noms des ministres fédéral, provinciaux et territoriaux de la Santé, le ministre de Santé Canada a chargé le CEPMB d’exercer un suivi des prix des médicaments non brevetés distribués sous ordonnance et de faire rapport des tendances observées. Les ministres de la Santé souhaitaient ainsi constituer une source centralisée de données fiables sur les prix des médicaments non brevetés distribués sous ordonnance. Depuis avril 2008, les études sur les prix des médicaments non brevetés distribués sous ordonnances sont effectuées au titre du SNIUMP.
1Le portefeuille de la Santé contribue de multiples façons à améliorer l’état de santé de la population canadienne. Il est constitué de Santé Canada, de l’Agence de la santé publique du Canada, des Instituts de recerche en santé du Canada, du Conseil de contrôle des renseignements relatifs aux matières dangereuses, de l’Agence canadienne de contrôle de la procréation assistée et du Conseil d’examen du prix des médicaments brevetés.
GOUVERNANCE
Le Conseil est formé d’au plus cinq membres siégeant à temps partiel, dont un président et un vice-président. Les membres du Conseil, y compris le président et le vice-président, sont nommés par le gouverneur en conseil. En vertu de la Loi sur les brevets, le président du Conseil assume également les fonctions de chef de la direction du CEPMB et, à ce titre, est chargé de la gouverne et de la supervision des activités du Conseil.
MEMBRES DU CONSEIL
PRÉSIDENT
Brien G. Benoit, BA, MD, MSc, FRCSC, FACS
Brien G. Benoit a été nommé au Conseil du CEPMB en mai 2005. En octobre 2005, il est devenu vice-président du Conseil et a exercé les responsabilités du président du Conseil jusqu’à sa nomination à la présidence du Conseil en juin 2006.
Le Dr Benoit, un neurochirurgien, est membre du Corps des médecins titulaires actifs de l’Hôpital d’Ottawa ainsi que professeur de neurochirurgie à l’Université d’Ottawa. À ce titre, il participe sur une base régulière à la formation des médecins faisant leur résidence en neurochirurgie. Le Dr Benoit a occupé au cours de sa carrière différents postes administratifs, dont chef du département de neurochirurgie à l’Hôpital Civic d’Ottawa/Hôpital d’Ottawa (1980 à 2003), chef du département de neurochirurgie de l’Hôpital Civic d’Ottawa (2002 et 2003), médecin-patron du département de neurochirurgie de l’Université d’Ottawa (1995 à 2003), titulaire de la chaire en neurochirurgie à l’Université d’Ottawa (1997 à 2003) et chirurgien-chef adjoint au campus Civic de l’Hôpital d’Ottawa (2002 à 2004). Le Dr Benoit a publié de nombreux articles dans des revues spécialisées et a participé à plusieurs essais cliniques multicentriques. Il a reçu en 1991 un premier prix d’excellence en enseignement chirurgical du département de chirurgie de l’Université d’Ottawa et un deuxième en 2000.
En plus d’être Fellow du Collège royal des chirurgiens du Canada (neurochirurgie), le Dr Benoit est membre de plusieurs associations professionnelles, dont l’Association médicale canadienne, l’Association médicale de l’Ontario, le American College of Surgeons, la Société canadienne de neurochirurgie et le Congress of Neurological Surgeons.
VICE-PRÉSIDENTE
Mary Catherine Lindberg, BSP
Mary Catherine Lindberg a été nommée membre et vice-présidente du Conseil d’examen du prix des médicaments brevetés en juin 2006. Mme Lindberg occupe actuellement le poste de directrice exécutive du Ontario Council of Academic Hospitals, un regroupement de 25 hôpitaux universitaires affiliés à une université et à sa faculté de médecine. Avant d’occuper ce poste, Mme Lindberg était sous-ministre adjointe des Services de santé, au Ministère de la Santé et des soins de longue durée de l’Ontario. Elle s’occupait entre autres du Régime d’assurancemaladie de l’Ontario et des Programmes de médicaments.
MEMBERS
Thomas (Tim) Armstrong, BA, LLB, QC, O. Ont.
Tim Armstrong a été nommé membre du Conseil en octobre 2002 et a été reconduit dans ses fonctions en 2007.
M. Armstrong a pratiqué le droit de 1958 à 1974. Il a commencé sa carrière à la division du contentieux des affaires civiles au ministère fédéral de la Justice pour passer ensuite au secteur privé au sein du cabinet Jolliffe, Lewis & Osler et, plus tard, dans le cabinet Armstrong & MacLean spécialisé en droit administratif où il était associé principal. Pendant toutes ces années, il a été appelé à plaider devant différents tribunaux administratifs, différentes cours de la province de l’Ontario, la Cour fédérale et la Cour suprême du Canada.
C’est en 1974 qu’il a choisi de relever de nouveaux défis, cette fois dans la fonction publique de l’Ontario à titre de président du Conseil des relations de travail de l’Ontario (1974-1976), de sousministre du Travail (1976-1986), d’agent général de l’Ontario à Tokyo (1986-1990) et de sousministre de l’Industrie, du commerce et de la technologie (1991-1992). De 1992 à 1995, M. Armstrong a occupé le poste de conseiller du premier ministre de l’Ontario en matière de développement économique. De 1995 à 2002, il a travaillé comme avocat-conseil au sein du cabinet d’avocats McCarthy Tétrault. Au cours des années 1990, M. Armstrong a siégé au conseil d’administration d’Algoma Steel, de deHavilland Aircraft et de Interlink Freight.
Depuis 1996, M. Armstrong est le représentant principal du Canada à la Japan Bank for International Cooperation. Il est également médiateur-arbitre en relations de travail. En 1998 et 1999, M. Armstrong a occupé le poste de facilitateurmédiateur à la Commission de restructuration des services de santé de l’Ontario. En 2002- 2003, il a servi comme médiateur-arbitre pour le gouvernement de l’Ontario en vertu de la City of Toronto Labour Disputes Resolution Act, 2002.
M. Armstrong est actuellement président de l’Institut de radioprotection du Canada. Son récent rapport sur les métiers et l’apprentissage a servi à l’élaboration de la Loi sur la qualification professionnelle et l’apprentissage des gens de métier, 2009, de l’Ontario.
M. Armstrong a été reçu membre de l’Ordre de l’Ontario en 1995 en reconnaissance de sa contribution insigne à la fonction publique de l’Ontario.
Anthony Boardman, BA, PhD
Anthony Boardman siège à notre Conseil depuis janvier 1999. Son mandat a été renouvelé en mars 2005.
M. Boardman est professeur Van Dusen d’administration des affaires au Sauder School of Business de l’Université de la Colombie-Britannique, plus particulièrement au sein de la Division de l’économie des entreprises. Il est diplômé de l’Université Kent de Canterbury (BA, 1970) ainsi que de l’Université Carnegie-Mellon (PhD, 1975). Avant de devenir professeur à l’Université de la Colombie- Britannique, M. Boardman a enseigné à la Wharton School de l’Université de la Pennsylvanie.M. Boardman mène actuellement des recherches sur les partenariats public-privé, sur les analyses coûts-avantages et sur la gestion stratégique.
Il a enseigné la gestion dans différents pays, dont la Finlande, la Chine, l’Australie, et a reçu au cours de sa carrière différents prix soulignant l’excellence de ses activités en enseignement dont le prix Alan Blizzard. Il a travaillé comme expert-conseil pour différents organismes privés et publics, dont Vodafone, Stora Enzo, PricewaterhouseCoopers, le ministère du Trésor de la Nouvelle-Zélande ainsi que pour différents gouvernements du Canada. Entre 1995 et 2001, M. Boardman a siégé au Comité scientifique sur l’initiative de pharmaco - économie de la Colombie-Britannique. Il a été président de la direction de Strategy and Business Economics de l’Université de la Colombie-Britannique au cours de deux mandats. Il siège actuellement sur les conseils éditoriaux du Journal of Comparative Policy Analysis and Strategic Outsourcing: An International Journal.
Au cours de sa carrière, M. Boardman a signé de nombreux articles savants. Il travaille actuellement sur la quatrième édition de son livre Cost-Benefit Analysis: Concepts and Practice.
Anne Warner La Forest, LLB (UNB), LLM (Cantab)
Anne Warner La Forest siège au Conseil depuis mars 2007.
Mme La Forest est professeure de droit à l’Université du Nouveau-Brunswick. De plus, elle siège depuis 2004 à la Commission des valeurs mobilières du Nouveau-Brunswick où elle préside le Comité sur les ressources humaines jusqu’en juin 2008. Elle a été nommée membre principal de la Commission en juillet 2008.
En 1991, après avoir pratiqué le droit pendant plusieurs années dans le cabinet Fraser & Beatty de Toronto, Mme La Forest a joint la faculté de droit de l’Université Dalhousie. De 1996 à 2004, elle a occupé le poste de doyenne de la faculté de droit à l’Université du Nouveau-Brunswick. Membre des barreaux du Nouveau-Brunswick, de la NouvelleÉcosse et de l’Ontario, Mme La Forest a une très vaste expérience en arbitrage et a agi à titre de consultante dans des affaires relatives au droit de la personne, à l’emploi, à la propriété et à l’extradition. Elle a été membre du Tribunal des droits de la personne de la Nouvelle-Écosse ainsi que membre du Conseil de recherche en sciences sociales et en sciences humaines et présidente du Comité d’attribution des bourses de recherche. Mme La Forest a aussi oeuvré comme arbitre dans la province de la Nouvelle-Écosse ainsi que comme Commissaire à la Commission des droits de la personne de la Nouvelle-Écosse. Elle est Fellow de la Cambridge Commonwealth Society et membre du Conseil des gouverneurs de l’Institut national de la magistrature.
Mme La Forest détient un baccalauréat spécialisé en droit international de l’Université de Cambridge, au Royaume-Uni.
Au cours de sa carrière, Mme La Forest a publié des articles, des livres ainsi que des arrêts remarqués. Elle a aussi participé à de nombreuses conférences de droit nationales et internationales, parfois à titre de présidente et d’autres fois à titre de panéliste.
HAUTE DIRECTION DU CEPMB
DIRECTRICE EXÉCUTIVE
La directrice exécutive est responsable de la gouverne générale des activités du CEPMB et des membres de son personnel.
AFFAIRES RÉGLEMENTAIRES ET LIAISON AUPRÈS DES BREVETÉS
La direction Affaires réglementaires et liaison auprès des brevetés fait l’examen des prix des médicaments brevetés vendus au Canada pour s’assurer qu’ils ne sont pas excessifs, encourage les brevetés à se conformer volontairement aux Lignes directrices du Conseil sur les prix excessifs, veille à la bonne application des politiques de conformité et d’application et fait enquête sur les plaintes reçues concernant les prix de certains médicaments brevetés. La Direction facilite également les interactions du CEPMB avec les brevetés.
POLITIQUES ET ANALYSE ÉCONOMIQUE
La direction Politiques et analyse économique formule au besoin des conseils stratégiques concernant les changements qui pourraient être apportés aux Lignes directrices sur les prix excessifs et à d’autres politiques du Conseil. Elle effectue des recherches et des analyses des tendances des prix des médicaments et prépare des rapports sur celles-ci. Enfin, elle effectue les études que lui commande le ministre de la Santé ainsi que des études à l’appui des activités de conformité et d’application.
SERVICES GÉNÉRAUX
La direction des Services généraux offre conseils et services en matière de gestion des ressources humaines, des installations, de la santé et sécurité au travail, de la technologie et de la gestion de l’information. Elle s’occupe également de la planification stratégique et de la planification financière, des vérifications, de l’évaluation et de la liaison auprès des agences centrales fédérales compétentes.
SECRÉTARIAT DU CONSEIL ET COMMUNICATIONS
Le Secrétariat du Conseil planifie et orchestre les communications du CEPMB, les relations avec les médias et le suivi aux demandes de renseignements du grand public. Il gère le processus d’audience du Conseil, dont les dossiers d’instance. Il coordonne les activités du Conseil relatives à l’application de la Loi sur l’accès à l’information et de la Loi sur la protection de la vie privée.
CONSEILLÈRE JURIDIQUE PRINCIPALE
La Conseillère juridique principale fournit des opinions juridiques au CEPMB et dirige l’équipe de la poursuite dans les audiences du Conseil.
CONSEIL D’EXAMEN DU PRIX DES MÉDICAMENTS BREVETÉS

BUDGET
Pour l’exercice 2008-2009, le Conseil a disposé d’un budget de 11,1 millions de dollars et d’un effectif approuvé de 71 équivalents temps plein. Ce budget comprend également une enveloppe pour le Système national d’information sur l’utilisation des médicaments prescrits (SNIUMP).
EN 2007-2008, LA VALEUR DES RECETTES EXCESSIVES REMBOURSÉES PAR LES BREVETÉS SOUS FORME DE PAIEMENTS AU GOUVERNEMENT DU CANADA OU DE REMISES AUX HÔPITAUX/ CLINIQUES A TOTALISÉ 10,5 MILLIONS DE DOLLARS. EN 2008-2009, CES REMBOURSEMENTS ET REMISES ONT TOTALISÉ 27,2 MILLIONS DE DOLLARS. VOUS TROUVEREZ DANS L’ANNEXE 3 LE SOMMAIRE DES ENGAGEMENTS DE CONFORMITÉ VOLONTAIRE ET DES ORDONNANCES DU CONSEIL.
TABLEAU 1 Budget
|
2007 – 2008 |
2008 – 2009 |
2009 – 2010 |
| Budget total du CEPMB |
11,925M |
11,122M |
11,358M |
| Equivalents temps plein |
62 |
71 |
76 |
EXIGENCES EN MATIÈRE DE RAPPORT
En vertu de l’article 82 de la Loi sur les brevets (Loi), les brevetés sont tenus d’informer le CEPMB de leur intention de lancer un médicament sur le marché canadien et de la date à laquelle ils prévoient le faire.
En vertu du Règlement sur les médicaments brevetés (Règlement), les brevetés doivent :
- remplir et soumettre le formulaire Renseignements identifiant le médicament (Formulaire 1) dans les 7 jours qui suivent la réception de l’Avis de conformité ou la date de la première vente du médicament au Canada, soit la première de ces deux éventualités. Le breveté doit également joindre en annexe à son formulaire la monographie de son médicament ou, si l’Avis de conformité n’a pas encore été attribué, les renseignements qui sont normalement présentés dans une monographie
- faire rapport des prix de lancement de leurs produits médicamenteux brevetés et des ventes effectuées le premier jour de commercialisation du produit médicamenteux au Canada (Formulaire 2) dans les 30 jours qui suivent la date de la première vente, et
- tant qu’un brevet est lié au produit médicamenteux, soumettre des données détaillées sur les prix et sur les ventes de chaque médicament breveté (Formulaire 2) et ce, dans les 30 jours qui suivent la fin de chaque semestre, soit au plus tard le 30 juillet et le 30 janvier de chaque année.
- Dans le cas des produits médicamenteux en vente libre et des produits médicamenteux pour usage vétérinaire, remplir et soumettre le formulaire 1 dans les 7 jours qui suivent la réception de l’Avis de conformité ou la date de la première vente du médicament au Canada, soit la première de ces deux éventualités. Pour ces produits, le rapport sur le prix et sur les ventes (Formulaire 2) n’est plus exigé, mais les brevetés doivent quand même conserver leurs données en dossier au cas où le Conseil les exigerait. Les renseignements demandés sur le formulaire 2 doivent être soumis pour toutes les périodes de vente dans les 30 jours qui suivent la date à laquelle le personnel du Conseil lui en fait la demande suite à la réception d’une plainte puis pour les deux années qui suivent la demande. Les rapports sont exigibles dans les 30 jours qui suivent chaque période de rapport.
Le CEPMB passe en revue sur une base régulière les données fournies sur les prix de tous les médicaments brevetés offerts sur le marché canadien afin de s’assurer qu’ils sont conformes à ses Lignes directrices sur les prix excessifs (Lignes directrices). Ces Lignes directrices sont publiées dans le Compendium des politiques, des Lignes directrices et des procédures du CEPMB.2
DÉFAUT DE PRÉSENTER SON RAPPORT SUR LE FORMULAIRE 1
Dans l’exercice du volet réglementation de son mandat (description à la page 2 du présent rapport), le CEPMB s’attend à ce que les brevetés lui soumettent leurs rapports dans les délais impartis et ce, pour tous les produits médicamenteux vendus au Canada auxquels au moins un brevet est lié.
Tout retard de présentation des rapports est source de problème pour le CEPMB en ce sens qu’il retarde l’examen du prix. En 2008, 4 nouveaux produits médicamenteux brevetés (8 DIN) qui étaient brevetés et vendus au Canada avant 2008 ont fait l’objet d’un premier rapport au CEPMB.
Les produits médicamenteux Trileptal, Physioneal (3 DIN), ratio-paroxetine (3 DIN) et ratio-fluticasone étaient brevetés et offerts sur le marché canadien avant même de faire l’objet d’un rapport au CEPMB aux fins de l’examen du prix. Ces médicaments sont respectivement vendus au Canada par Novartis Pharma Canada Inc., Baxter Corporation et ratiopharm.
TABLE 2 Défaut de présenter son rapport
| Breveté actuel |
Nom de marque |
Nom générique |
Année où le médicament est devenu assujetti à la compétence du CEPMB |
| Novartis Pharma Canada Inc. |
Trileptal 60 mg/mL |
oxcarbazepine |
2006 |
| Baxter Corporation |
Physioneal |
glucose |
2007 |
| 13.6 mg/mL, |
|
|
| 22.7 mg/mL, |
|
|
| 38.6 mg/mL |
|
|
| ratiopharm |
ratio-paroxetine |
chlorydrate |
2003 |
| 10 mg, 20 mg, |
de paroxétine |
|
| 30 mg tablet |
|
|
|
ratio-fluticasone |
propinate |
2007 |
| 50 mcg/dose |
de fluticasone |
|
DÉFAUT DE PRÉSENTER SON RAPPORT SUR LE FORMULAIRE 2
C’est aux brevetés qu’il incombe de s’assurer qu’ils soumettent au CEPMB tous les renseignements exigés dans les délais mentionnés dans le Règlement.
Même si, dans la plupart des cas, les brevetés finissent par se conformer et soumettre leurs rapports, un certain nombre de ceux-ci négligent de présenter leurs rapports complets dans les délais impartis dans le Règlement.
Pour les semestres de rapport de janvier à juin et de juillet à décembre 2008, le Conseil n’a toutefois pas eu à rendre d’ordonnances pour défaut de présenter son rapport.
De plus amples renseignements sur les différentes exigences en matière de rapport sont offerts dans la Loi, le Règlement, les Lignes directrices sur les prix excessifs et le Guide du breveté. Ces documents sont affichés dans le site Web du CEPMB sous « Loi, Règlement et Lignes directrices ».
LIGNES DIRECTRICES SUR LES PRIX EXCESSIFS
Les Lignes directrices sur les prix excessifs tiennent compte des facteurs de détermination des prix mentionnés dans l’article 85 de la Loi. Elles ont été formulées par le Conseil en consultation avec différents intervenants, dont les ministres de la Santé des provinces et des territoires, des associations de consommateurs et des représentants du secteur pharmaceutique. D’une façon générale, les Lignes directrices prévoient ce qui suit :
- les prix de la plupart des nouveaux médicaments brevetés sont assujettis à un plafond de manière à ce que le coût de revient de la nouvelle thérapie ne soit pas supérieur au coût de la thérapie jusque-là utilisée au Canada pour traiter la même maladie ou condition
- les prix des médicaments brevetés constituant une découverte ou une amélioration importante ne peuvent dépasser la médiane des prix pratiqués dans les sept pays industrialisés nommés dans le Règlement, à savoir la France, l’Allemagne, l’Italie, la Suède, la Suisse, le Royaume-Uni et les États-Unis
- les taux d’augmentation des prix des médicaments brevetés existants ne peuvent être plus élevés que les taux d’augmentation de l’Indice des prix à la consommation (méthodologie de l’IPC)
- le prix d’un médicament breveté au Canada ne peut en aucun temps dépasser le prix le plus élevé auquel il est vendu dans les pays de comparaison nommés dans le Règlement.
Le personnel du Conseil fait l’examen des prix de touts les produits médicamenteux brevetés vendus sur le marché canadien. S’il estime que le prix d’un médicament breveté semble plus élevé que le prix autorisé par les Lignes directrices du Conseil et que les circonstances le justifient, le personnel du Conseil ouvre une enquête pour déterminer si ce prix est ou non excessif. L’annexe 1, à la page 50, fournit de plus amples explications sur les critères qui justifient la tenue d’une enquête. Une enquête peut mener aux résultats suivants :
- sa fermeture lorsque le prix est reconnu conforme aux Lignes directrices
- un engagement de conformité volontaire en vertu duquel le breveté s’engage à réduire le prix de son produit médicamenteux et à appliquer d’autres mesures ordonnées par le Conseil pour se conformer aux Lignes directrices, dont une réduction du prix et (ou) la réduction du prix d’un autre produit médicamenteux du breveté ou le remboursement des recettes excessives encaissées, ou
- une audience publique pour déterminer si le prix du produit médicamenteux est ou non excessif ainsi que l’ordonnance qu’il y a lieu d’imposer.
Par souci de transparence, le CEPMB publie dans son site Web la liste des Nouveaux médicaments ayant fait l’objet d’un rapport au CEPMB. Cette liste, qui est mise à jour tous les mois, fait état du statut de l’examen de chaque nouveau médicament breveté au moyen des mentions « sous examen », « Conforme aux Lignes directrices », «Sous enquête », « Engagement de conformité volontaire » ou « Avis d’audience ».
GROUPE CONSULTATIF SUR LES MÉDICAMENTS POUR USAGE HUMAIN
Le Conseil a créé le Groupe consultatif sur les médicaments pour usage humain (GCMUH) pour qu’il lui soumette ses recommandations concernant le classement des nouveaux médicaments ainsi que concernant la sélection des médicaments qui se prêtent à la comparaison selon la catégorie thérapeutique avec le médicament sous examen.
Le GCMUH effectue l’évaluation scientifique des médicaments brevetés et formule des conseils scientifiques crédibles, indépendants et éclairés quant à l’élaboration et l’application des Lignes directrices du CEPMB relatives à l’examen scientifique. L’approche du Groupe se fonde sur l’expérience clinique et ses recommandations reflètent les connaissances médicales et scientifiques ainsi que la pratique clinique.
Le GCMUH est constitué de trois membres :
- Dr Jean Gray MD, FRCPC, Professeure émérite en enseignement de la médecine, en médecine et en pharmacologie à l’Université Dalhousie
- Dr Mitchell Levine MD, MSc, FRCPC, FISPE, Professeur, Département de l’épidémiologie clinique et de la biostatistique à l’Université McMaster et directeur du Centre d’évaluation des médicaments du St. Joseph’s Healthcare Hamilton, et
- Dr Adil Virani, BSc (Phm), Pharm.D., FCSHP, directeur des services pharmaceutiques à la Fraser Health Authority et chargé de cours à la faculté des sciences pharmaceutiques de l’Université de la Colombie-Britannique.
NOUVEAUX PRODUITS MÉDICAMENTEUX BREVETÉS LANCÉS SUR LE MARCHÉ CANADIEN EN 2008
Au total, 78 nouveaux produits médicamenteux brevetés (aussi appelés DIN) pour usage humain ont été lancés sur le marché canadien en 2008. Certains de ces médicaments représentent une ou plusieurs concentrations d’une nouvelle substance active (NSA) et d’autres, de nouvelles présentations de médicaments existants.
Aux fins de l’examen du prix, tout médicament breveté lancé ou vendu sur le marché canadien avant l’attribution de son premier brevet entre le 1er décembre 2007 et le 30 novembre 2008 est réputé avoir été breveté en 2008.3
Le graphique 1 présente le nombre de nouveaux médicaments brevetés pour usage humain lancés sur le marché canadien entre 1989 et 2008.
Vingt-deux (28 %) des 78 nouveaux DIN brevetés ont été commercialisés au Canada avant d’avoir obtenu un premier brevet canadien qui les aurait automatiquement assujettis à la compétence du CEPMB. Ces DIN sont identifiés par les lettres « PBA » (pour « premier brevet accordé ») dans l’annexe 2, à la page 51 du présent rapport. Le tableau 3 présente le nombre de produits médicamenteux brevetés classés selon l’année de leur première vente sur le marché canadien. Pour ces produits le délai écoulé entre la date de la première vente et celle de l’obtention d’un premier brevet varie entre plusieurs mois et cinq années. Un de ces produits (le Fucidin, un antibiotique vendu par LEO Pharma Inc.) était vendu sur le marché canadien avant 1987, année de la création du CEPMB.

TABLEAU 3 Nouveaux produits médicamenteux brevetés pour usage humain en 2008 selon l’année de leur première ven
| Année de la première vente |
Nbre de DIN |
| 2008 |
58 |
| 2007 |
8 |
| 2006 |
8 |
| 2005 |
|
| 2004 |
1 |
| 2003 |
2 |
| 1980 |
1 |
| Total |
78 |
NOUVELLES SUBSTANCES ACTIVES LANCÉES SUR LE MARCHÉ CANADIEN EN 2008
Une nouvelle substance active (NSA) peut être associée à plusieurs DIN lorsqu’elle est distribuée sous plusieurs concentrations ou sous plusieurs formes posologiques. Les 19 NSA lancées sur le marché canadien en 2008 ont été commercialisées sous 26 DIN. Comme on peut le voir dans le graphique 2 et dans le tableau 4, à la page 11, 4 des 19 NSA brevetées devenues assujetties à la compétence du CEPMB en 2008 étaient offertes sur le marché canadien avant 2008.

TABLEAU 4 Nouvelles substances actives pour usage humain, 2008
Nouveaux médicaments brevetés pour usage humain, 2008 – Nouvelles substances actives
| Nom de marque |
Nom chimique |
Breveté |
Nbre de DIN |
Utilisation thérapeutique |
| Catena |
idébénone |
Santhera Pharmaceuticals (Canada) Inc. |
1 |
Traitement symptomatique des patients
atteints de l’Ataxie de Friedreich |
| Cymbalta |
chlorhydrate de duloxétine |
Eli Lilly Canada Inc. |
2 |
Antidépresseur/analgésique |
| Eraxis |
anidulafungin |
Pfizer Canada Inc. |
1 |
Antifongique |
| Frova |
succinate de frovatriptan |
Teva Neuroscience |
1 |
Migraine |
| Januvia |
phosphate de sitagliptine monohydraté |
Merck Frosst Canada Ltd. |
1 |
Diabète |
| Natrecor |
nesiritide |
Janssen-Ortho Inc. |
1 |
Épisodes aigus d’insuffisance cardiaque |
| Nevanac |
népafénac |
Alcon Canada Inc. |
1 |
Traitement de la douleur et de l’inflammation
associées à une opération de la cataracte |
| Nimotuzumab |
nimotuzumab |
YM Biosciences Inc. |
1 |
Cancer |
| Pradax |
dabigatran etexilate |
Boehringer Ingelheim (Canada) Ltd. |
2 |
Prévention de la thromboembolie veineuse |
| Relistor |
bromure de méthylnaltrexone |
Wyeth Pharmaceuticals |
1 |
Traitement de la constipation causée par
les opioïdes |
| Revlimid |
lénalidomide |
Celgene |
2 |
Anémie |
| Torisel |
temsirolimus |
Wyeth Pharmaceuticals |
1 |
Traitement du carcinome rénal |
| Volibris |
ambrisentan |
GlaxoSmithKline Inc. |
2 |
Traitement de l’hypertension artérielle
pulmonaire |
| Xarelto |
rivaroxaban |
Bayer Inc. |
1 |
Prévention des événements thromboemboliques
veineux |
| Zeldox |
chlorydrate de ziprasidone |
Pfizer Canada Inc. |
4 |
Antipsychotique |
|
| Nouvelles substances actives vendues au Canada avant 2008 |
| Nom de marque |
Nom chimique |
Breveté |
Nbre de DIN |
Utilisation thérapeutique |
| Intelence |
etravirine |
Janssen-Ortho Inc. |
1 |
VIH |
| Lucentis |
ranibizumab |
Novartis Pharma Canada Inc. |
1 |
Traitement de la forme néovasculaire
(humide) de la dégénérescence maculaire
liée à l’âge |
| Myozyme |
alfa d’alglucosidase |
Genzyme Canada Inc. |
1 |
Traitement de la maladie de Pompe |
| Zevalin |
Ibritumomab tiuxétan |
Bayer Inc. |
1 |
Traitement des patients atteints d’un
lymphome non hodgkinien |
Le graphique 3, à la page 12, ventile pour la période 2001 à 2008 les NSA pour usage humain brevetées selon la catégorie dans laquelle elles ont été classées aux fins de l’examen du prix.4
Lorsque l’examen du prix d’une nouvelle substance active est terminé et que son prix a été jugé conforme aux Lignes directrices, le CEPMB affiche dans son site Web le rapport sommaire de son examen.

EXAMEN DU PRIX DES NOUVEAUX PRODUITS MÉDICAMENTEUX BREVETÉS POUR USAGE HUMAIN EN 2008
La liste des 78 nouveaux produits médicamenteux brevetés, incluant le statut de l’examen de leur prix au moment de la rédaction du présent rapport, est présentée dans l’annexe 2, à la page 51. Des 78 nouveaux DIN brevetés :
- 74 avaient été soumis à un examen du prix en date du 31 mars 2009. De ce nombre :
– les prix de 60 DIN ont été jugés conformes aux Lignes directrices
– les prix de 14 DIN semblaient plus élevés que ne l’autorisent les Lignes directrices et ont justifié une enquête. De plus amples explications sur les critères qui justifient la tenue d’une enquête sont offerts à l’annexe 1, à la page 50.
- enfin, les prix des 4 autres DIN étaient encore sous examen.
SUIVI : NOUVEAUX PRODUITS MÉDICAMENTEUX BREVETÉS DONT IL A ÉTÉ FAIT ÉTAT DANS DES RAPPORTS ANNUELS ANTÉRIEURS
Le tableau 5 présente une mise à jour du statut des nouveaux produits médicaments brevetés (DIN) dont il a été fait état dans des rapports annuels antérieurs.
TABLEAU 5 Statut de l’examen des nouveaux produits médicamenteux brevetés ayant fait l’objet d’un rapport au CEPMB en 2002, 2003, 2004, 2005, 2006 et 2007
|
2002 |
2003 |
2004 |
2005 |
2006 |
2007 |
Nouveaux médicaments brevetés
(DIN) mentionnés dans un
rapport annuel |
94 |
70 |
94 |
66 |
99 |
64 |
| Défaut de présenter un rapport |
4 |
4 |
2 |
1 |
7 |
2 |
| Nbre de DIN pour l’année |
98 |
74 |
96 |
67 |
106 |
66 |
| Sous examen |
0 |
3 |
0 |
0 |
1 |
1 |
| Conformes aux Lignes directrices |
91 |
66 |
78 |
59 |
90 |
56 |
| Sous enquête |
0 |
0 |
0 |
0 |
12 |
7 |
Engagements de conformité
volontaire |
3 (Starlix)
1 (Busulfex)
1 (Tamiflu) |
1 (Dukoral) |
2 (Paxil CR)
1 (Hextend)
2 (Eloxatin)
1 (Forteo) |
1 (Nuvaring)
1 (Vaniqa) |
1 (Denavir)
1 (Lantus)
|
2 (AndroGel) |
| Avis d’audience |
– |
– |
1 (Penlac)
1 (Neulasta) |
– |
– |
– |
Avis d’audience/Engagement
de conformité volontaire |
1 (Fasturec) |
1 (Evra)
3 (Concerta) |
3 (Risperdal
Consta) |
5 (Strattera)
1 (Concerta) |
– |
– |
| Audience conclue |
1 (Dovobet) |
– |
1 (Copaxone)
6 (Adderall XR)
|
– |
– |
– |
| Auprès de la Cour fédérale |
– |
– |
– |
– |
1 (Thalomid) |
– |
EXAMEN DES PRIX DES PRODUITS MÉDICAMENTEUX BREVETÉS EXISTANTS POUR USAGE HUMAIN, EN 2008
Aux fins du présent rapport, les médicaments existants (DIN) désignent tous les médicaments brevetés vendus sur le marché canadien et rapportés au CEPMB avant le 1er décembre 2008. Au moment de la rédaction du présent rapport, 1 182 DIN existants étaient offerts sur le marché canadien :
- les prix de 1 032 DIN existants (87,3 %) ont été jugés conformes aux Lignes directrices
- les prix de 111 DIN existants faisaient l’objet d’une enquête.
– de ce nombre, 19 enquêtes sont attribuables au prix de lancement du médicament :
12 en 2006
7 enquêtes ont été engagées en 2007
– 92 enquêtes sont attribuables aux augmentations annuelles des prix :
36 enquêtes ont été engagées en 2008
26 enquêtes ont été engagées en 2007
19 enquêtes ont été engagées en 2006
10 enquêtes ont été engagées en 2005
1 enquête a été engagée en 2003
- 9 DIN existants – Nicoderm (3 DIN), Penlac, Quadracel, Pentacel, Apo-Salvent exempt de CFC, ratio-Salbutamol HFA et Neulasta font l’objet d’une audience en vertu de l’article 83 de la Loi (voir la section « Audiences », à la page 17)
- 16 DIN – Copaxone, Strattera (5 DIN), Adderall XR (6 DIN) et Concerta (4 DIN) faisaient l’objet d’une audience qui a été close suite à un engagement de conformité volontaire ou à une ordonnance du Conseil
- 14 DIN existants étaient encore sous examen.
Le tableau 6 donne un aperçu du statut d’examen en 2008 des produits médicamenteux brevetés pour usage humain nouveaux et existants.
TABLEAU 6 Produits médicaments brevetés (DIN) pour usage humain vendus au Canada
en 2008 – Statut de l’examen du prix en date du 31 mars 2008
|
Nouveaux médicaments lancés
sur le marché canadien en 2008 |
Médicaments
existants |
Total |
| Total |
78 |
1,182 |
1,260 |
| Conformes aux Lignes directrices |
60 |
1,032 |
1,092 |
| Sous examen |
4 |
14 |
18 |
| Sous enquête |
14 |
111 |
125 |
| Avis d’audience |
0 |
9 |
9 |
| Audiences conclues |
|
16 |
16 |
MISE À JOUR : PRODUITS MÉDICAMENTEUX EXISTANTS DONT IL A ÉTÉ FAIT MENTION DANS LE RAPPORT ANNUEL 2007
Dans son rapport annuel de l’an dernier, le Conseil mentionnait que les prix de 20 des 1 114 produits médicamenteux brevetés pour usage humain vendus au Canada en 2007 étaient sous examen au moment d’aller sous presse. Il est ressorti de ces examens que les prix de 7 de ces 20 médicaments étaient conformes aux Lignes directrices et que les prix de 4 autres semblaient supérieurs aux prix autorisés et justifiaient la tenue d’une enquête. Par ailleurs, les prix de 8 autres DIN sont encore sous examen. Enfin, la Cour fédérale a statué que 1 DIN n’était pas assujetti à la compétence du CEPMB.
Le CEPMB mentionnait également dans son rapport annuel de 2007 que 97 DIN étaient sous enquête. Trente-trois de ces enquêtes étaient closes au moment de la rédaction du présent rapport : les prix de 26 de ces DIN ont été jugés conformes aux Lignes directrices et 4 DIN (Denavir, Vepesid, Suprax et Eligard) ont fait l’objet d’un engagement de conformité volontaire (voir la rubrique « Engagements de conformité volontaire » à la page 15). Enfin, des Avis d’audience ont été émis pour 3 DIN (Apo-Salvent exempt de CFC, ratio-Salbutamol HFA et Neulasta (voir la rubrique « Avis d’audience » à la page 17). Les prix de 64 autres DIN sont encore aujourd’hui sous enquête. Il était aussi mentionné dans le rapport annuel de 2007 que 22 DIN étaient visés par un Avis d’audience et, au moment d’aller sous presse, 4 audiences (16 DIN) avaient été conclues : Copaxone, Concerta (4 DIN), Adderall XR (6 DIN) et Strattera (5 DIN). Quant aux 4 audiences engagées pour les 6 autres DIN, elles poursuivent leur cours.
PCEM / CEPMB
Le Programme commun d’évaluation des médicaments (PCEM), un processus uniformisé d’évaluation des nouveaux médicaments, fournit aux régimes d’assurance-médicaments fédéral, provinciaux et territoriaux participants des recommandations quant à l’opportunité d’ajouter certains médicaments à leurs formulaires respectifs de médicaments admissibles à un remboursement. De toutes les provinces et de tous les territoires, seul le Québec ne participe pas à ce programme. Le PCEM fait l’examen des nouveaux médicaments et recommande les médicaments qui devraient être admissibles à un remboursement par les régimes publics d’assurance-médicaments. Au moment de prendre des décisions concernant l’inscription de médicaments sur les formulaires de médicaments admissibles à un remboursement, les différents régimes publics d’assurance-médicaments évaluent la recommandation du Comité consultatif canadien d’expertise sur les médicaments (CCCEM) dans le contexte de leur mandat, de leurs priorités et de leur budget. De plus amples renseignements sur le PCEM et sur le CCCEM sont offerts dans le site Web de l’Agence canadienne des médicaments et des technologies de la santé (ACMTS) (http://www.cadth.ca).
Le tableau 7 présente pour 2008 les recommandations formulées concernant les médicaments soumis à l’examen du PCEM et le statut des prix examinés par le CEPMB. Le PCEM fait l’examen du prix du médicament après l’obtention de son Avis de conformité de Santé Canada. Le CEPMB fait pour sa part l’examen du prix de tous les médicaments brevetés offerts sur le marché canadien. Un produit médicamenteux peut être vendu avant d’être breveté ou ne pas être breveté et, dans un tel cas, le médicament n’est pas assujetti à la compétence du CEPMB.
TABLEAU 7 Statut des examens
| Recommandation du PCEM en 2008 |
Statut du médicament |
Utilisation thérapeutique |
| acamprosate calcium |
Campral |
Recommandation positive** |
Non assujetti à la compétence du CEPMB |
Traitement contre la dépendance à l’alcool |
| adalimumab |
Humira |
Recommandation positive** |
Conforme aux Lignes directrices |
Polyarthrite rhumatoïde |
| aliskiren |
Rasilez |
Recommandation négative |
Conforme aux Lignes directrices |
Hypertension |
| ambrisentan |
Volibris |
Recommandation positive** |
Conforme aux Lignes directrices |
Hypertension artérielle pulmonaire |
| aprepitant |
Emend |
Recommandation positive** |
Conforme aux Lignes directrices |
Prévention des nausées et des vomissements associés à une chimiothérapie anticancéreuse |
| buprenorphine/naloxene |
Suboxone |
Recommandation positive** |
Non assujetti à la compétence du CEPMB |
Traitement de la dépendance envers les opiacés (narcotiques) |
| carbidopa/levodopa/entacapone |
Stalevo |
Recommandation positive*** |
Conforme aux Lignes directrices |
Maladie de Parkinson |
| ciclésonide |
Omnaris |
Recommandation négative |
Conforme aux Lignes directrices |
Allergies |
| daptomycine |
Cubicin |
Recommandation négative |
Conforme aux Lignes directrices |
Antibiotique |
| Chlorhydrate de duloxétine |
Cymbalta |
Recommandation positive** |
Conforme aux Lignes directrices |
Antidépresseur/analgésique |
| efavirenz/emtricitabine/tenofovir disoproxil fumarate |
Atripla |
Recommandation positive** |
Conforme aux Lignes directrices |
VIH |
| étravirine |
Intelence |
Recommandation positive** |
Conforme aux Lignes directrices |
VIH |
| Carbonate de lanthane hydraté |
Fosrenol |
Recommandation négative |
Conforme aux Lignes directrices |
Contrôle de l’hyperphosphorémie |
| palipéridone |
Invega |
Recommandation négative |
Conforme aux Lignes directrices |
Schizophrénie |
| posaconazole |
Spriafil*** |
Recommandation négative |
Conforme aux Lignes directrices |
Antifongique |
| raltegravir |
Isentress |
Recommandation positive** |
Conforme aux Lignes directrices |
VIH |
| ranibizumab |
Lucentis |
Recommandation positive** |
Conforme aux Lignes directrices |
Traitement de la forme néovasculaire (humide)
de la dégénérescence maculaire liée à l’âge |
| rivaroxaban |
Xarelto |
Recommandation positive** |
Sous enquête |
Prévention des accidents thromboemboliques
veineux |
| rivastigmine |
Exelon |
Recommandation négative |
Conforme aux Lignes directrices |
Maladie d’Alzheimer |
| phosphate de sitagliptine |
Januvia |
Recommandation négative |
Conforme aux Lignes directrices |
Diabète |
| sodium de sitaxsentan |
Thelin |
Recommandation négative |
Conforme aux Lignes directrices |
Hypertension pulmonaire |
| chlorhydrate de tramadol |
Tridural |
Recommandation négative |
Sous enquête |
Analgésique |
| chlorhydrate de tramadol |
Raliva |
Recommandation négative |
Non assujetti à la compétence du CEPMB |
Analgésique |
| chlorhydrate de ziprasidone |
Zeldox |
Recommandation positive** |
Conforme aux Lignes directrices |
Antipsychotique |
| acide zolédronique |
Aclasta |
Recommandation négative |
Conforme aux Lignes directrices |
Maladie de Paget |
* Inscrire sous réserve de critères/conditions
** Inscrire au même titre que d’autres produits médicamenteux
*** Maintenant appelé Posanol
Sources : CEPMB et ACMTS |
PRODUITS MÉDICAMENTEUX BREVETÉS EN VENTE LIBRE ET PRODUITS MÉDICAMENTEUX BREVETÉS POUR USAGE VÉTÉRINAIRE
Les modifications apportées au Règlement ont été enregistrées le 6 mars 2008 et publiées dans la Partie II de la Gazette du Canada du 19 mars 2008. Depuis, le personnel du Conseil ne fait l’examen des prix des produits médicamenteux brevetés en vente libre et des médicaments brevetés pour usage vétérinaire que suite à la réception d’une plainte. De plus amples renseignements sur ce processus sont offerts dans le site Web du CEPMB. Le Conseil n’a reçu en 2008 aucune plainte concernant les prix de ces deux types de produits médicamenteux brevetés.
MISE À JOUR : PRODUITS MÉDICAMENTEUX BREVETÉS POUR USAGE VÉTÉRINAIRE DONT IL A ÉTÉ QUESTION DANS LE RAPPORT ANNUEL 2007
Dans son rapport annuel 2007, le Conseil mentionnait que les prix de huit produits médicamenteux brevetés pour usage vétérinaire étaient sous examen et ils l’étaient encore au moment de la rédaction du présent rapport. Après l’examen du prix et lorsque le prix est jugé conforme aux Lignes directrices, les résultats du rapport sommaire de l’examen sont affichés dans le site Web du CEPMB.
ENGAGEMENTS DE CONFORMITÉ VOLONTAIRE
L’ENGAGEMENT DE CONFORMITÉ VOLONTAIRE EST UN ENGAGEMENT ÉCRIT DU BREVETÉ DE RENDRE LE PRIX DE SON PRODUIT MÉDICAMENTEUX BREVETÉ CONFORME AUX LIGNES DIRECTRICES SUR LES PRIX EXCESSIFS.
Les brevetés peuvent soumettre un engagement de conformité volontaire même si, après enquête, le personnel du Conseil est arrivé à la conclusion que le prix au Canada du produit médicamenteux breveté est plus élevé que le prix autorisé en vertu des Lignes directrices.
2 Vous trouverez le Compendium des politiques, des Lignes directrices et des prodécures (le Compendium) dans notre site Web sous « Loi, Règlement et Lignes directrices » ou en communiquant avec le CEPMB à son numéro d’interurbains sans frais : 1-877-861-2350.
3 En raison des dates de présentation des rapports établies par le Règlement sur les médicaments brevetés et de la méthode de calcul des prix de référence, les médicaments lancés sur le marché canadien ou brevetés en décembre d’une année sont comptabilisés dans les nouveaux médicaments de l’année suivante.
4 Pour de plus amples renseignements sur la categorisation des produits medicamenteux, consulter le Compendium des politiques, des Lignes directrices, et des procedures.
L’ENGAGEMENT DE CONFORMITÉ VOLONTAIRE EST UN ENGAGEMENT ÉCRIT DU BREVETÉ DE RENDRE LE PRIX DE SON PRODUIT MÉDICAMENTEUX BREVETÉ CONFORME AUX LIGNES DIRECTRICES SUR LES PRIX EXCESSIFS.
Les brevetés peuvent soumettre un engagement de conformité volontaire même si, après enquête, le personnel du Conseil est arrivé à la conclusion que le prix au Canada du produit médicamenteux breveté est plus élevé que le prix autorisé en vertu des Lignes directrices.
PUBLICATION DES ENGAGEMENTS DE CONFORMITÉ VOLONTAIRE
Le Conseil publie les engagements de conformité volontaire approuvés par le président du Conseil. Ce document devient public dès que le breveté est informé de l’acception de son engagement. Les engagements de conformité volontaire sont affichés dans le site Web du CEPMB. Ils font également l’objet d’un article dans La Nouvelle et, bien sûr, dans le Rapport annuel.
L’acceptation d’un engagement par le président du Conseil se veut une alternative aux procédures quasi judiciaires qui sont engagées suite à la publication d’un Avis d’audience.
Le breveté peut soumettre un engagement de conformité volontaire après l’émission d’un Avis d’audience, mais à ce point l’engagement doit recevoir l’aval du panel d’audience.
Entre janvier 2008 et la mise sous presse du présent rapport, neuf engagements de conformité volontaire ont été acceptés pour les produits médicamenteux brevetés nommés ci-après, dont deux après l’émission d’un Avis d’audience :
AndroGel, Solvay Pharma Inc.
– Juin 2008
Concerta5, Janssen-Ortho Inc.
– Avril 2009
Denavir, Barrier Therapeutics Canada Inc.
– Mai 2008
Eligard, sanofi-aventis Canada Inc.
– Avril 2009
Lantus, sanofi-aventis Canada Inc.
– Mars 2008
Strattera5, Eli Lilly Canada Inc.
– Février 2009
Suprax, sanofi-aventis Canada Inc.
– Mars 2009
Vaniqa, Barrier Therapeutics Canada Inc.
– Février 2008
Vepesid, Bristol-Myers Squibb Canada Co.
– Février 2009
AndroGel est un gel topique contenant 1 % de testostérone. Il est indiqué comme traitement de remplacement pour les hommes atteints d’une insuffisance ou d’une absence de testostérone endogène.
Le 24 juin 2008, le président du Conseil a approuvé l’engagement de conformité volontaire que lui a soumis Solvay Pharma Inc. pour son médicament AndroGel. En vertu de cet engagement, Solvay Pharma a réduit le prix du sachet de 2,5 mg de son médicament au prix maximum non excessif (MNE) de 2008 (2,1263 $) et a remboursé les recettes excessives qu’il a encaissées entre mai 2002 et le 31 décembre 2007 en remettant la somme de 3 327 180,61 $ au gouvernement du Canada. Solvay Pharma a également remboursé les recettes excessives encaissées en 2008.
Le Concerta est indiqué pour traiter les troubles déficitaires de l’attention avec hyperactivité (TDAH).
Le 24 juillet 2006, le Conseil a émis un Avis d’audience sur le prix du médicament Concerta. Le 24 avril 2009, le Panel d’audience a approuvé l’engagement de conformité volontaire que lui ont présenté les parties et ainsi mis fin aux procédures d’audience. L’engagement prévoit, entre autres, que Janssen-Ortho Inc. rembourse des recettes excessives totalisant 1 464 441,58 $ au gouvernement du Canada.
Le Denavir est indiqué pour traiter l’herpès labial récurrent chez les adultes.
Le 20 mai 2008, le président du Conseil a approuvé l’engagement de conformité volontaire soumis par Barrier Therapeutics Canada Inc. pour son médicament Denavir.
Barrier a remboursé au gouvernement du Canada la somme de 61 021,80 $ qui correspond à la valeur des recettes excessives encaissées entre août 2006 et décembre 2007.
Le Denavir n’est plus vendu au Canada.
Le Eligard est indiqué pour le traitement palliatif du cancer de la prostate ayant atteint un stade avancé.
Le 20 avril 2009, le président du Conseil a approuvé l’engagement de conformité volontaire que lui a soumis sanofi-aventis Canada Inc. pour son médicament Eligard. En plus de s’assurer que les prix auxquels il vend son médicament dans les différentes provinces ne dépassent pas le prix MNE de 2009, sanofi-aventis a remboursé les recettes excessives encaissées entre janvier 2005 et décembre 2008 en remettant la somme de 13 127 953,14 $ au gouvernement du Canada. De plus, sanofi-aventis remboursera directement à ses clients des différentes provinces ayant acheté son médicament à un prix excessif les recettes excessives encaissées en 2009.
Le Lantus est indiqué une fois par jour pour le traitement des adultes atteints de diabète de type 2 et des adultes et enfants (de 6 à 17 ans) atteints du diabète de type 1 à qui doit être administrée de l’insuline basale à durée d’action prolongée pour contrôler l’hypoglycémie.
Le 14 mars 2008, le président du Conseil a approuvé l’engagement de conformité volontaire soumis par sanofi-aventis Canada Inc. pour son médicament breveté Lantus. En plus d’avoir porté le prix de son médicament à un niveau où il n’est plus considéré excessif, sanofi-aventis a remboursé les recettes excessives encaissées en date du 18 septembre 2006. À cette fin, il a remis la somme de 694 239,50 $ au gouvernement du Canada et réduit le prix d’un autre de ses médicaments, le Altace HCT.
Le Strattera est indiqué pour le traitement des enfants de six ans et plus, des adolescents et des adultes atteints du trouble déficitaire de l’attention avec hyperactivité.
Le 19 février 2009, le Conseil a approuvé l’engagement de conformité volontaire pour le médicament Strattera, mettant ainsi fin aux procédures engagées suite à l’émission d’un Avis d’audience le 15 décembre 2006. L’engagement prévoit que Eli Lily Canada Inc. maintienne les prix de son médicament Strattera dans les limites des prix MNE de 2009 et rembourse au gouvernement du Canada les recettes excessives dont la valeur totalise 15 326 066,49 $. S’il y a lieu, Eli Lilly remettra au gouvernement du Canada la valeur des recettes excessives qui n’auront pas été remboursées en date du 30 juin 2009.
Le Suprax est un antibiotique utilisé pour traiter des infections causées par des souches sensibles de microorganismes spécifiés.
Le président du Conseil a approuvé l’engagement de conformité volontaire que lui a soumis sanofiaventis Canada Inc. pour son médicament Suprax 400 mg/comprimé. Aux termes de cet engagement, sanofi-aventis devait réduire le prix de son médicament Suprax pour qu’il se situe dans les limites du prix MNE de 2009 et remettre au gouvernement du Canada la somme de 97 900,30 $ en guise de remboursement des recettes excessives encaissées entre le 1er juillet 2007 et le 30 juin 2008. sanofi-aventis doit également rembourser les recettes excessives qu’il a encaissées entre juillet et décembre 2008.
Le Vaniqa est indiqué pour ralentir chez les femmes la pousse de poils indésirables au niveau de la figure. Son utilisation est recommandée en complément d’un traitement d’épilation.
Le 28 février 2008, le président du Conseil a approuvé l’engagement de conformité volontaire que lui a soumis Barrier Therapeutics Canada Inc. pour son médicament Vaniqa. Barrier a remboursé la partie excessive des recettes qu’il a tirées de la vente de son médicament à un prix excessif entre novembre 2005 et décembre 2007 en remettant au gouvernement du Canada la somme de 70 860,59 $.
Le Vaniqa n’est plus vendu au Canada.
Le Vepesid est utilisé en combinaison avec d’autres agents antinéoplasiques pour traiter en première ligne certaines maladies néoplasiques.
Le 23 février 2009, le président du Conseil a approuvé l’engagement de conformité volontaire que lui a soumis Bristol-Myers Squibb pour son médicament Vepesid. Bristol-Myers Squibb Canada Inc. a remboursé ses recettes excessives directement à ses clients qui, entre 2005 et 2007, ont acheté son médicament à des prix excessifs. La valeur de ces recettes totalisait 53 161,48 $.
Le Vepesid n’est plus vendu au Canada.
5 A fait l’objet d’un Avis d’audience.
AUDIENCES
DANS L’EXERCICE DE SON MANDAT DE RÉGLEMENTATION, LE CEPMB DOIT VEILLER À CE QUE LES BREVETÉS NE VENDENT PAS AU CANADA LEURS MÉDICAMENTS BREVETÉS À DES PRIX EXCESSIFS.
LORSQUE LE PRIX D’UN MÉDICAMENT BREVETÉ SEMBLE EXCESSIF, LE CONSEIL PEUT TENIR UNE AUDIENCE PUBLIQUE ET, S’IL EST DÉMONTRÉ QUE LE PRIX DU MÉDICAMENT EST EXCESSIF, RENDRE UNE ORDONNANCE OBLIGEANT LE BREVETÉ À RÉDUIRE LE PRIX DE SON MÉDICAMENT ET À REMBOURSER LA PARTIE EXCESSIVE DES RECETTES TIRÉES DE LA VENTE DE SON MÉDICAMENT À UN PRIX EXCESSIF. LES DÉCISIONS DU CONSEIL PEUVENT FAIRE L’OBJET D’UNE REQUÊTE EN RÉVISION JUDICIAIRE AUPRÈS DE LA COUR FÉDÉRALE DU CANADA.
En date du 1er janvier 2008, huit audiences étaient en cours dans les affaires suivantes : Adderall XR, Concerta, Copaxone, Nicoderm, Penlac, Pentacel et Quadracel, Strattera et Thalomid. Le Conseil a réglé cinq de ces affaires en cours d’année : deux affaires (Strattera et Concerta) ont été réglées au moyen d’un engagement de conformité volontaire. De plus amples détails sur ces engagements de conformité volontaire sont offerts dans la section du présent rapport qui traite spécifiquement des engagements de conformité volontaire.
Au moyen d’ordonnances, le Conseil a conclu les procédures dans deux affaires : Adderall XR et Copaxone. Le Panel d’audience a également rendu sa décision dans l’affaire du médicament Thalomid, mais le breveté a interjeté appel de cette décision. L’affaire est maintenant devant de la Cour d’appel fédérale. De plus amples détails sur cette affaire sont offerts à la page 19 sous la rubrique « Appels interjetés auprès de la Cour fédérale ».
Durant l’année 2008, le Conseil a émis quatre Avis d’audience, nommément dans les affaires de Apotex et de ratiopharm Inc. pour défaut de présenter ses rapports et dans les affaires des prix des médicaments Apo-Salvent exempt de CFC et ratio-Salbutamol HFA. Le 16 mars 2009, le Conseil a émis un Avis d’audience dans l’affaire de Amgen Canada Inc. et du prix du médicament Neulasta.
Au moment d’aller sous presse, le Conseil comptait huit affaires dans son calendrier d’audiences : Apotex (défaut de présenter son rapport), Apo-Salvent exempt de CFC, Neulasta, Nicoderm, Penlac, Pentacel et Quadracel, ratiopharm (défaut de présenter son rapport) et ratio-Salbutamol HFA.
Le tableau 8, à la page 18, présente un sommaire des affaires dont le Conseil a été saisi entre le 1er janvier 2008 et la date de publication du présent rapport.
TABLEAU 8 Statut des audiences devant le Conseil
Produit mé
dicamenteux
breveté |
Indication/Utilisation |
Breveté |
Date de l’Avis d’audience |
Règlement |
| Adderall XR |
Traitement des troubles déficitaires de l’attention avec hyperactivité (TDAH) |
Shire Canada Inc. (Shire BioChem Inc. lors de l’émission de l’Avis d’audience) |
18 janvier 2006 |
Décision : 10 avril 2008
Ordonnance : 27 août 2008
i) Réduction du prix
ii) Remboursement des recettes excessives – 5 622 863,63 $
iii) Autres recettes excessives à rembourser : pour
la période du 8 janvier au 15 septembre 2008
|
| Apotex Inc. |
|
|
3 mars 2008 |
en cours |
Apo-Salvent
CFC-Free |
Bronchodilatateur qui atténue le malaise respiratoire causé par des spasmes et par le rétrécissement du diamètre des bronches |
Apotex Inc. |
8 juillet 2008 |
en cours |
| Concerta |
Traitement des troubles déficitaires de l’attention avec hyperactivité (TDAH) |
Janssen-Ortho Inc. |
24 juillet 2006 |
Engagement de conformité volontaire : 24 avril 2009 (voir page 15) |
| Copaxone |
Réduction de la fréquence des rechutes chez les malades en traitement ambulatoire atteints de la sclérose en plaques à périodes progressives et rémittentes |
Teva Neuroscience
G.P.-S.E.N.C. |
8 mai 2006 |
Décision : 25 février 2008
Ordonnance : 12 mai 2008
i) Remboursement des recettes excessives : 2 417 223,29 $ |
| Neulasta |
Réduction de la fréquence des infections se manifestant par une neutropénie fébrile chez les patients atteints d’un cancer et traités par chimiothérapie myélosuppresseur |
Amgen Canada Inc. |
16 mars 2009 |
Conférence préparatoire : 3 juin 2009 |
| Nicoderm |
Atténuation des malaises causés par l’assuétude du tabac |
sanofi-aventis Canada Inc. (Hoechst Marion Roussel
Canada lors de l’émission
de l’Avis d’audience) |
20 avril 1999 |
Audience : 5 octobre 2009 |
| Penlac |
Traitement des ongles des patients immunocompétents atteints d’une onychomycose ou infection fongique des ongles ne touchant pas la lunule |
sanofi-aventis Canada Inc. |
26 mars 2007 |
En attente de la décision |
| Pentacel |
Immunisation systématique des enfants de 2 à 59 mois contre la diphtérie, le tétanos, la coqueluche, la poliomyélite et l’haemophilus influenzae de type b.
Le médicament est offert au Canada sous forme de fiole monodose de Act-HIB
(poudre lyophilisée pour injection) et d’une ampoule à dose unique (0,5 ml)
de Quadracel (suspension pour injection). |
sanofi pasteur Limited |
27 mars 2007 |
En attente de la décision |
| Quadracel |
Primovaccination des nourrissons à partir de l’âge de 2 mois et comme vaccin
de rappel pour les enfants jusqu’à 7 ans contre la diphtérie, le tétanos, la
coqueluche et la poliomyélite. |
|
|
|
| ratiopharm Inc. |
|
|
28 août 2008 |
en cours |
| ratio-Salbutamol HFA |
Atténuation des malaises respiratoires causés par des spasmes et par le rétrécissement du diamètre des bronches |
ratiopharm Inc. |
18 juillet 2008 |
Audience : 6 juillet 2009 |
| Strattera |
Traitement des enfants d’au moins six ans, des adolescents et des adultes atteint de troubles déficitaires de l’attention avec hyperactivité (TDAH) |
Eli Lilly Canada Inc. |
15 décembre 2006 |
Engagement de conformité volontaire
(Voir les détails à la page 16) |
APPELS INTERJETÉS AUPRÈS DE LA COUR FÉDÉRALE
Au cours de 2008, certaines décisions du Conseil ont été soumises à la révision judiciaire de la Cour fédérale.
Adderall XR, Shire Canada Inc. et Concerta, Janssen-Ortho Inc.
En janvier 2006, le Conseil a émis un Avis d’audience dans cette affaire. Le 15 décembre 2006, le Conseil a par voie d’ordonnance rejeté la requête déposée par Shire Canada Inc. aux fins que le Conseil corrige son Avis d’audience de manière à limiter son examen à la période commençant à la date d’attribution du brevet lié au médicament Adderall XR. Shire a déposé une requête en révision judiciaire devant la Cour fédérale. Le 19 décembre 2007, la Cour fédérale a rendu sa décision par laquelle elle rejetait la requête de Shire. Shire a interjeté appel de cette dernière décision devant la Cour d’appel fédérale, mais a retiré sa requête le 5 novembre 2008.
Dans cette affaire, Janssen-Ortho Inc., qui exploite le brevet du produit médicamenteux Concerta, a été admis comme intervenant devant la Cour fédérale dans l’affaire de la révision judiciaire de la décision relative à la compétence du Conseil. Janssen-Ortho a aussi renoncé à l’appel le 27 novembre 2008.
Copaxone, Teva Neuroscience G.P.-S.E.N.C.
Le 8 mai 2006, le Conseil a émis un Avis d’audience dans cette affaire.
Le 25 février 2008, le Panel d’audience a rendu sa décision et ses motifs et, le 12 mai 2008, son ordonnance. Teva Neuroscience a déposé une requête en révision judiciaire auprès de la Cour fédérale. La date de l’audience n’a pas encore été fixée.
Nicoderm, sanofi-aventis Canada Inc.
sanofi-aventis a déposé une requête en révision judiciaire de la désicion du Conseil de poursuivre l’audience sur le fond. La Cour fédérale n’a pas annoncée la date de l’audience.
Pentacel et Quadracel, sanofi pasteur Limitée
Le 27 mars 2007, le Conseil a émis un Avis d’audience dans cette affaire
Suite à la décision du Panel d’audience rendue le 26 novembre 2007 qui rejetait la requête de sanofi pasteur aux fins que le Conseil substitue son conseiller juridique dans l’affaire, sanofi pasteur a déposé une requête en révision judiciaire auprès de la Cour fédérale. La Cour fédérale a rejeté la requête de sanofi pasteur.
Le Panel a fini d’entendre l’affaire sur le fond le 6 janvier 2009 et sa décision est en instance.
Thalomid, Celgene Corporation
Le Panel d’audience a entendu les parties concernant la compétence du Conseil dans l’affaire du produit médicamenteux Thalomid qui était administré à des patients canadiens en vertu du Programme d’accès spécial de Santé Canada. Dans la décision qu’il a rendue le 21 janvier 2008, le Conseil a confirmé sa compétence sur le prix du médicament Thalomid. Celgene Corporation a soumis une requête en révision judiciaire par la Cour fédérale, laquelle requête a été entendue le 3 mars 2009. Dans sa décision du 17 mars 2009, la Cour fédérale a renversé la décision du Conseil. Le Procureur général du Canada a interjeté appel de la décision de la Cour fédérale auprès de la Cour d’appel fédérale. La date de l’audience n’est pas encore connue.
Depuis la création du CEPMB en 1987, le Conseil a approuvé 54 engagements de conformité volontaire et engagé 23 audiences publiques. Ces mesures ont donné lieu à des réductions de prix et au remboursement des recettes excessives par voie de paiements au gouvernement du Canada et (ou) de remboursements faits directement aux clients tels que des hôpitaux et des cliniques. En 2008-2009, la valeur des remboursements faits au gouvernement du Canada dépassait les 27 millions de dollars. De plus amples renseignements sur les engagements de conformité volontaire et sur les ordonnances du Conseil sont offerts à l’annexe 3, à la page 54.
COMMUNIQUÉ DU CONSEIL DU 18 AOÛT 2008 À SES INTERVENANTS
APRÈS LA PUBLICATION, LE 18 AOÛT 2008, D’UN COMMUNIQUÉ DU CONSEIL À L’INTENTION DE SES INTERVENANTS QUI TRAITAIT DE L’OBLIGATION IMPOSÉE AUX BREVETÉS DE FAIRE RAPPORT DES AVANTAGES QU’ILS CONSENTENT À LEURS CLIENTS, RX&D ET AL ET PFIZER CANADA INC. ONT SOUMIS UNE REQUÊTE EN RÉVISION JUDICIAIRE DU COMMUNIQUÉ DU CONSEIL. LA COUR FÉDÉRALE DOIT ENTENDRE CES DEUX REQUÊTES LES 16 ET 17 JUIN 2009.
MODIFICATIONS APPORTÉES AU RÈGLEMENT SUR LES MÉDICAMENTS BREVETÉS
Les modifications apportées au Règlement sur les médicaments brevetés, 1994 (le « Règlement ») ont été enregistrées le 6 mars 2008 et publiées le 19 mars suivant dans la partie II de la Gazette du Canada. Ces modifications ont rendu le processus d’examen du prix des médicaments brevetés plus efficient et plus célère.
Le processus de modification du Règlement a été engagé en janvier 2005 avec la publication d’un Avis et commentaires. Après avoir mené de vastes consultations auprès des intervenants, le Conseil a donné suite aux préoccupations qu’ils avaient exprimées en proposant de nouvelles modifications aux renseignements exigés sur le Formulaire 1 : Renseignements identifiant le médicament, sur le Formulaire 2 : Renseignements sur les prix et sur les ventes du médicament, et sur le Formulaire 3 : Renseignements sur les dépenses de R-D. Ces modifications ont également permis au Conseil de mettre en place un processus d’examen du prix des produits médicamenteux brevetés en vente libre et des produits médicamenteux brevetés pour usage vétérinaire qui ne s’engage que sur réception d’une plainte.
Par ailleurs, depuis le 1er juillet 2008, les brevetés doivent soumettre leurs trois rapports au Conseil par voie électronique en utilisant le formulaire et le format du Conseil. De même, la signature numérisée du fondé de pouvoir autorisé à certifier la conformité des renseignements fournis au Conseil doit être apposée sur le formulaire électronique.
Enfin, au titre de son Programme de liaison auprès des brevetés, le personnel du Conseil a, en mai et en juin 2008, tenu des séances d’information sur la façon de se conformer aux nouvelles exigences du Règlement.
RÉVISION DES LIGNES DIRECTRICES DU CONSEIL SUR LES PRIX EXCESSIFS
Le Conseil est sur le point de finaliser l’examen de ses Lignes directrices sur les prix excessifs qu’il a engagé en 2005. Par cet examen, le Conseil voulait s’assurer que les politiques, les Lignes directrices et les procédures appliquées aux fins de l’exercice de son mandat demeurent pertinentes et appropriées, que ses examens sont effectués d’une façon juste, transparente et ouverte et que leurs résultats sont prévisibles.
Pour la révision de ses Lignes directrices, le CEPMB a mis en place un important processus de consultation de ses intervenants de l’industrie (secteurs des médicaments de marque, de la biotechnologie et des produits médicamenteux génériques), des gouvernements fédéral, provinciaux et territoriaux, des associations de consommateurs, des groupes de protection des intérêts des patients, de tierces payeurs et autres.
En janvier 2008, le Conseil a consulté ses intervenants à l’aide du document portant l’intitulé Document de discussion : Changements qui pourraient être apportés au Règlement sur les médicaments brevetés, 1994 et aux Lignes directrices sur les prix excessifs. Au printemps, les cinq groupes de travail créés par le Conseil et constitués d’intervenants de différents secteurs d’activité avaient soumis leurs rapports respectifs : niveaux d’amélioration des bienfaits thérapeutiques; comparaison du prix selon le groupe thérapeutique du médicament dans les pays de comparaison; tests appliqués aux prix; coûts de réalisation et de mise en marché; et réglementation des prix des produits médicamenteux génériques brevetés.
En août 2008, après avoir pris connaissance des points de vue exprimés par les intervenants dans les mémoires qui lui ont été transmis, le Conseil a publié pour Avis et commentaires la première ébauche de ses Lignes directrices révisées sur les prix excessifs. Le Conseil a reçu quarante-deux mémoires et, par la suite, a tenu des conférences téléphoniques et des rencontres avec les intervenants afin de mieux cerner leurs objets de préoccupation.
En mars 2009, le Conseil a invité ses intervenants à lui soumettre leurs Avis et commentaires sur la deuxième et dernière ébauche de ses Lignes directrices révisées sur les prix excessifs. Trente et un intervenants ont répondu à cette invitation en faisant parvenir un mémoire au Conseil.
Le Conseil met actuellement la dernière touche à la dernière version révisée de ses Lignes directrices et publiera le 9 juin prochain son tout nouveau Compendium des politiques, des Lignes directrices et des procédures qui entrera en vigueur le 1er janvier 2010. Enfin, pour aider les brevetés à bien comprendre les changements apportées aux Lignes directrices et par la suite à bien s’y conformer, le CEPMB tiendra des séances d’information au cours du printemps et de l’automne.
PRINCIPALES ACTIVITÉS DE CONSULTATION MENÉES EN 2008-2009
| Date |
Événement |
| Janvier 2008 |
Publication du document de discussion : Changements qui pourraient être
apportés au Règlement sur les médicaments brevetés, 1994 et aux Lignes
directrices sur les prix excessifs |
| Avril 2008 |
Réception du rapport final du Groupe de travail sur l’amélioration des bienfaits
thérapeutiques et du rapport du Groupe de travail sur la comparaison du prix
selon le groupe thérapeutique dans les pays de comparaison |
| Mai 2008 |
Réception du rapport final du Groupe de travail de l’Association canadienne
du médicament générique (ACMG)/CEPMB et du Groupe de travail sur
l’utilisation des coûts de réalisation et de mise en marché en application du
paragraphe 85(2) de la Loi sur les brevets |
| Juin 2008 |
Rencontre du Conseil avec des représentants des secteurs de la fabrication
des médicaments de marque et de la biotechnologie |
| Juillet 2008 |
Réception du rapport final du Groupe de travail sur les tests appliqués aux prix |
| Août 2008 |
Publication de l’ébauche des Lignes directrices révisées sur les prix excessifs
aux fins d’un Avis et commentaires |
| Octobre 2008 |
Rencontre du Conseil avec les membres du conseil d’administration de Rx&D |
| Décembre 2008 |
Rencontres bilatérales avec différents groupes d’intervenants |
| Décembre 2008 à mai 2009 |
Réunions d’un Comité spécial Rx&D et CEPMB, constitué de chefs de la direction et de membres du Conseil |
| Mars 2009 |
Publication d’une nouvelle ébauche des Lignes directrices révisées sur les prix
excessifs pour Avis et commentaires |
| Mai 2009 |
Approbation par le Conseil du nouveau Compendium des politiques, des Lignes
directrices et des procédures (dans lequel ont été intégrées les nouvelles
Lignes directrices sur les prix excessifs) |
| Juin 2009 |
Publication du nouveau Compendium des politiques, des Lignes directrices et des procédures |
| Juin 2009 |
Séances d’information des brevetés |
| Automne 2009 |
Autres séances d’information |
| Janvier 2010 |
Entrée en vigueur des nouvelles Lignes directrices sur les prix excessifs |
RAPPORT SUR LES PRINCIPALES TENDANCES, 2008
TENDANCES DES VENTES DE PRODUITS MÉDICAMENTEUX BREVETÉS6
En vertu du Règlement sur les médicaments brevetés (le « Règlement »), les brevetés doivent faire rapport au CEPMB de leurs ventes de produits médicamenteux brevetés au Canada, dont les quantités vendues et les recettes nettes par produit médicamenteux, par catégorie de clients et par province/territoire. Le CEPMB utilise ces éléments d’information pour analyser les tendances aux niveaux des ventes, de l’utilisation faite des médicaments et des prix. Les résultats de cette analyse sont présentés dans la présente section.7
VENTES ET PRIX
La population canadienne consacre aujourd’hui beaucoup plus d’argent à l’achat de médicaments qu’elle ne le faisait il y a encore à peine dix ans. Il est toutefois important de préciser qu’une augmentation des dépenses en médicaments n’est pas nécessairement attribuable à une augmentation des prix des médicaments. Selon les rapports annuels antérieurs, les prix des produits médicamenteux brevetés n’ont que très peu augmenté au Canada au fil des ans alors que la valeur des ventes, elle, a augmenté au-delà de 10 %. Dans ces cas, ce sont le volume et la composition de l’utilisation faite des médicaments qui sont à l’origine de la croissance de la valeur des ventes.8
Différents facteurs peuvent être à l’origine de tels changements, dont les suivants :
- augmentation de la population du pays
- variations de la composition démographique de la population (par ex. vieillissement de la population et, partant, une plus grande incidence de problèmes de santé)
- plus grande incidence des problèmes de santé nécessitant une pharmacothérapie
- nouvelles habitudes d’ordonnance des médecins (par ex. tendance à prescrire des nouveaux médicaments pour traiter une condition à l’aide de médicaments existants souvent offerts à moindre prix)
- recours plus régulier à des pharmacothérapies en remplacement d’autres formes de traitement
- recours à de nouveaux produits médicamenteux pour traiter des conditions pour lesquelles il n’existait pas encore un traitement efficace.
TENDANCES DES VENTES
Le tableau 9, à la page 23, présente la valeur des ventes au prix du fabricant des médicaments au Canada pour les années 1990 à 2008. Les ventes de produits médicamenteux brevetés ont totalisé 13,0 milliards de dollars en 2007, soit 5,0 % de plus qu’en 2007 où ce montant totalisait 12,4 milliards de dollars. En guise de comparaison, le taux annuel de croissance des ventes de produits médicamenteux était de 27,0 % en 1999 et s’est maintenu dans les deux chiffres jusqu’en 2003.
La troisième colonne du tableau 9 présente la valeur des ventes des produits médicamenteux brevetés exprimée en pourcentage de la valeur des ventes de tous les produits médicamenteux brevetés et non brevetés. Entre 1990 et 2003, le pourcentage de la valeur des ventes de produits médicamenteux brevetés par rapport à la valeur des ventes de tous les médicaments est passé de 43 % à 72,7 %. Ce pourcentage ayant reculé depuis 2003, il apparaît que les ventes des produits médicamenteux génériques et des produits médicamenteux de marque non brevetés ont augmenté davantage au cours de cette période que celles de produits médicamenteux brevetés.9
TABLEAU 9 Ventes de produits médicamenteux brevetés, 1990 – 2008
|
Produits médicamenteux brevetés |
| Année |
Ventes aux prix départ-usine
(en milliards $) |
Variation (%) |
Ventes de produits médicamenteux brevetés
(% des ventes de tous les médicaments aux prix départ-usine) |
| 2008 |
13,0 |
5,0 |
64,9 |
| 2007 |
12,4 |
3,3 |
66,0 |
| 2006 |
12,0 |
3,7 |
67,9 |
| 2005 |
11,5 |
4,7 |
70,8 |
| 2004 |
11,0 |
8,6 |
72,2 |
| 2003 |
10,2 |
14,3 |
72,7 |
| 2002 |
8,9 |
17,5 |
67,4 |
| 2001 |
7,6 |
18,9 |
65,0 |
| 2000 |
6,3 |
16,7 |
63,0 |
| 1999 |
5,4 |
27,0 |
61,0 |
| 1998 |
4,3 |
18,9 |
55,1 |
| 1997 |
3,7 |
22,6 |
52,3 |
| 1996 |
3,0 |
12,8 |
45,0 |
| 1995 |
2,6 |
10,8 |
43,9 |
| 1994 |
2,4 |
-2,1 |
40,7 |
| 1993 |
2,4 |
9,4 |
44,4 |
| 1992 |
2,2 |
14,0 |
43,8 |
| 1991 |
2,0 |
13,1 |
43,2 |
| 1990 |
1,7 |
– |
43,2 |
| Sources: CEPMB, IMS Health |
FACTEURS À LA SOURCE DE LA CROISSANCE DES DÉPENSES
Le tableau 10, à la page 24, décompose en différents éléments la croissance des ventes enregistrée entre 2007 et 2008. Ces éléments sont les suivants :
- produits médicamenteux brevetés dont le brevet est arrivé à échéance ou dont le brevet a été cédé au domaine public (« Effet du retrait du médicament »)
- produits médicamenteux brevetés lancés sur le marché canadien en 2008 (« Effet du nouveau médicament »);
- variations des prix des produits médicamenteux brevetés vendus au Canada en 2007 et en 2008 (« Effet du prix »);
- écarts de quantités vendues de ces produits médicamenteux en 2007 et en 2008 (« Effet du volume »); et
- interactions des variations de prix et de quantité (« Effets croisés »).
La première rangée du tableau 10 présente les incidences d’après leur valeur monétaire. La deuxième rangée les présente au moyen de la variation des ventes en 2008 par rapport à 2007. Pour des fins de comparaison, la troisième rangée présente les incidences avec les taux moyens de variation annuelle des ventes pour la période de 2003 à 2007.10
Les résultats de ce tableau révèlent que l’augmentation des ventes observée entre 2007 et 2008 était essentiellement attribuable aux augmentations des quantités de médicaments brevetés existants vendus et au lancement de nouveaux produits médicamenteux brevetés. L’effet de volume a largement compensé l’effet important (négatif) de retrait du produit médicamenteux du marché ainsi que les effets croisés et le léger effet négatif sur le prix. À la différence de 2007, les produits médicamenteux nouveaux ont eu un effet important en 2008.11
À différents égards, les résultats de la décomposition des ventes effectuées en 2008 sont typiques en ce sens que les effets du médicament retiré du marché et du volume s’inscrivent dans les moyennes historiques observées dans le tableau 10. À d’autres égards, les résultats sont atypiques étant donné que l’effet du médicament nouveau et celui du prix représentent près de trois fois leurs moyennes historiques respectives. Il s’ensuit que, en 2008, les produits médicamenteux nouveaux lancés sur le marché canadien expliquent une croissance des dépenses plus importante que celle récemment observée. Par contre, l’effet de modération du recul des prix sur l’ensemble des dépenses a constitué en 2008 un facteur plus important que jamais.
La baisse marquée de la croissance des ventes de produits médicamenteux brevetés observée ces dernières années est assez surprenante. Il a été mentionné dans le rapport annuel de 2006 que la croissance des ventes au cours des années 1990 était essentiellement associée à de nouveaux produits médicamenteux « vedettes » ou, en d’autres mots, aux produits médicamenteux qui génèrent d’importants volumes de ventes, et que depuis le début de la présente décennie, l’industrie des médicaments n’a pas lancé sur le marché des produits médicamenteux vedettes en nombre suffisant pour soutenir un taux de croissance des ventes à deux chiffres de l’ordre de ceux enregistrés au cours des années 1990. En conséquence, en 2006, les ventes des médicaments brevetés au Canada étaient toujours dominées par les produits médicamenteux lancés sur le marché entre 1995 et 1999.
Dans une certaine mesure, cette tendance s’est estompée en 2008. Le graphique 4 présente pour 2008 une ventilation de la valeur des ventes de médicaments brevetés selon l’année de leur première vente au Canada. Ces ventes sont réparties d’une façon presque égale entre les produits médicamenteux lancés sur le marché avant l’année 2000 et ceux lancés sur le marché depuis l’année 2000. Les produits médicamenteux lancés sur le marché canadien entre 1995 et 1999 accaparent encore en 2008 près de 40 % de l’ensemble des ventes.
TABLEAU 10 Décomposition des variations des ventes des produits médicamenteux brevetés
|
Changement
total |
Effet de retrait du médicament |
Effet du
médicament nouveu |
Effet du prix |
Effet du Volume
|
Effets croisés
|
Incidence surle revenu net
2008/2007 (millions $) |
615,0 |
-287,7 |
545,2 |
-39,5 |
796,2 |
-399,1 |
Proportion de la variation
totale 2008/2007 (%) |
100,0 |
-46,8 |
88,7 |
-6,4 |
129,5 |
-64,9 |
Proportion moyenne de la variation
totale 2003 – 2007 (%) |
100,0 |
-48,5 |
33,7 |
2,3 |
112,2 |
0,3 |
| Source: CEPMB |
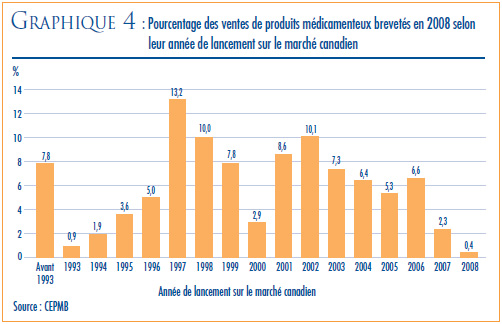
VENTES SELON LA CATÉGORIE THÉRAPEUTIQUE
Pour ses analyses de prix au niveau du groupe thérapeutique, le CEPMB classe généralement les médicaments à l’aide du système de classification anatomique thérapeutique chimique (ATC) de l’Organisation mondiale de la santé (OMS). Ce système hiérarchique classe les médicaments selon leur utilisation thérapeutique principale et leur composition chimique. Au plus haut niveau de ce système, à savoir au niveau 1, le système ATC classe les médicaments selon la partie de l’anatomie à laquelle ils sont principalement associés.
Le tableau 11 ventile les ventes des produits médicamenteux brevetés effectuées au Canada en 2008 selon le groupe thérapeutique principal, à savoir le premier niveau de la classification ATC. Il présente les ventes effectuées en 2008 dans les différents groupes de produits médicamenteux, leur part de l’ensemble des ventes ainsi que le taux d’augmentation de la valeur de leurs ventes par rapport à 2007. Les valeurs présentées dans la dernière colonne correspondent à la composante de la croissance de l’ensemble des ventes attribuables aux médicaments du groupe thérapeutique.12 La mesure ainsi obtenue permet de dégager les groupes thérapeutiques qui ont le plus contribué à la croissance de la valeur des ventes. Au cours du dernier exercice, ces groupes étaient les suivants :
- antiinfectieux généraux pour usage systémique et produits antiparasitaires
- agents antinéoplasiques et immunomodulateurs.
TABLEAU 11 Ventes des produits médicamenteux brevetés, selon leur groupe thérapeutique principal, 2008
| Groupe thérapeutique principal |
Ventes en 2008
(millions $) |
Part des ventes
en 2008 (%) |
Croissance : (millions $) |
2008/2007 (%) |
Part de la croissance
des ventes (%) |
| A : Tube digestif et métabolisme |
1 274,6 |
9,8 |
-327,8 |
-20,5 |
-53,3 |
| B : Sang et organes sanguinoformateurs |
882,3 |
6,8 |
-2,4 |
-0,3 |
-0,4 |
| C : Système cardiovasculaire |
3,174,7 |
24,5 |
64,4 |
2,1 |
10,5 |
| D : Produits dermatologiques |
128,6 |
1,0 |
1,8 |
1,4 |
0,3 |
| G : Système génito-urinaire et hormones sexuelles |
500,9 |
3,9 |
83,0 |
19,9 |
13,5 |
| H : Préparations hormonales systémiques |
96,2 |
0,7 |
0,7 |
0,8 |
0,1 |
J : Antiinfectieux généraux pour usage systémique
P : Produits antiparasitaires13 |
1 375,3 |
10,6 |
198,0 |
16,8 |
32,2 |
| L : Agents antinéoplasiques et immunomodulateurs |
2,030,5 |
15,6 |
348,8 |
20,7 |
56,7 |
| M : Système musculo-squelettique |
521,4 |
4,0 |
20,6 |
4,1 |
3,4 |
| N : Système nerveux |
1 637,4 |
12,6 |
40,0 |
2,5 |
6,5 |
| R : Système respiratoire |
1 023,8 |
7,9 |
76,2 |
8,0 |
12,4 |
| S : Organes sensoriels |
268,7 |
2,1 |
106,9 |
66,1 |
17,4 |
| V : Divers |
64,1 |
0,5 |
4,8 |
8,1 |
0,8 |
| Tous les groupes thérapeutiques |
12 978,4 |
100,0* |
615,0 |
5,0 |
100,0* |
Source : CEPMB
* Le total de cette colonne peut ne pas correspondre à 100,0 du fait que certains chiffres ont été arrondis. |
En 2008, ces deux catégories de produits médicamenteux ont été conjointement à la source de plus de 89 % de la croissance de la valeur des ventes de produits médicamenteux. C’est la quatrième année consécutive que les agents antinéoplasiques et immunomodulateurs constituent la principale source d’augmentation de la valeur des ventes.
6 Dans le présent chapitre, on entend par « produit médicamenteux breveté » tout produit assujetti à la compétence du CEPMB pour l’examen de son prix.
7 Les résultats statistiques présentés pour 2008 se fondent sur les données que les brevetés ont soumises au CEPMB en date d’avril 2009. Il arrive que des brevetés soumettent un nouveau rapport révisant les données déjà présentées ou contenant des données qui n’avaient pas été présentées dans un rapport antérieur. Ces données peuvent modifier d’une façon assez importante les statistiques utilisées pour la préparation du présent chapitre du rapport annuel. Pour tenir compte d’une telle éventualité, le CEPMB révise le calcul des données sur les ventes (voir la section « Tendances des ventes de médicaments brevetés », à la page 22). Il fait aussi rapport du calcul révisé des indices de prix et de quantité (voir la section « Tendances des prix », à la page 26 ainsi que dans la section « Utilisation des médicaments brevetés », à la page 35, des ratios des prix pratiqués dans les pays de comparaison par rapport aux prix pratiqués au Canada dans la section « Comparaison des prix au Canada avec les prix dans les pays de comparaison » à la page 31). Ces calculs couvrent les cinq années précédant l’année sur laquelle porte le présent rapport annuel. Les nouvelles valeurs ainsi obtenues reflètent les données courantes disponibles. En conséquence, lorsque la révision des données a été faite, les valeurs rapportées dans le présent rapport annuel peuvent être différentes de celles présentées dans des rapports annuels antérieurs.
8 Selon les études effectuées par le CEPMB sur les régimes publics d’assurance-médicaments, c’est l’augmentation de l’utilisation faite des médicaments existants et des nouveaux médicaments qui est à l’origine de la majeure partie de la croissance des dépenses récemment enregistrée. Voir le document publié en juin 2006 par le CEPMB et portant l’intitulé Rapport sommaire des tendances des produits pharmaceutiques : 1997-1998 à 2003-2004.
9 Le dénominateur dans ce ratio comprend la valeur des ventes des produits médicamenteux brevetés, des produits médicamenteux génériques et des produits médicamenteux de marque non brevetés. L’estimé de la valeur totale des ventes utilisé pour calculer le ratio de 2006 se fonde sur les données tirées de la base de données du Canadian Pharmaceutical Market: Drug Store and Hospital Purchases de IMS Health. Pour les années antérieures, les données d’IMS Health n’ont été utilisées que pour calculer la valeur des ventes des produits médicamenteux génériques. Quant à la valeur des ventes des produits médicamenteux de marque non brevetés, elle était alors estimée à l’aide des données fournies par les brevetés. Pour mettre un terme aux anomalies dans ce dernier estimé causées par les variations annuelles de la liste des brevetés, le CEPMB n’utilise désormais que les données d’IMS. Il convient de préciser que la baisse du ratio observée en 2006 par rapport à 2005 est en partie attribuable à ce dernier changement de méthodologie.
10 Dans le présent cas, l’« effet du produit médicamenteux existant » correspond au montant des ventes générées en 2007 par les produits médicamenteux qui étaient assujettis à la compétence du CEPMB en 2007, mais non en 2008. L’« effet du nouveau produit médicamenteux » correspond au montant des ventes générées en 2008 par les produits médicamenteux qui étaient assujettis à la compétence du CEPMB en 2008, mais non en 2007. Les autres effets sont calculés au moyen de la relation suivante :
S p2008(i) q2008(i) – S p2007(i) q2007(i) = S [p2008(i) – p2007(i)] q2007(i)
+ S p2007(i) [q2008(i) – q2007(i)]
+ S [p2008(i) – p2007(i)] [q2008(i) – q2007(i)]
où py(i) correspond au prix du produit médicamenteux « I » l’année « y », qy(i) au volume physique du produit médicamenteux « I » vendu l’année « y » et S à la somme des produits médicamenteux qui étaient assujettis à la compétence du CEPMB en matière d’examen du prix pour les années 2007 et 2008. La partie gauche de l’équation représente la variation des ventes de ces produits médicamenteux en 2008 par rapport à 2007. Du côté droit de l’équation, les trois termes définissent respectivement l’effet de volume, l’effet de prix et les effets croisés. Ces effets sont présentés dans le tableau 10, à la page 24. 11 Tel que mentionné
11 Tel que mentionné précédemment, l’« effet du nouveau produit médicamenteux » est limité à l’année au cours de laquelle le nouveau produit médicamenteux breveté a été lancé sur le marché canadien. Au moins une partie de l’« effet de volume » se fera alors sentir en raison de la rapidité avec laquelle les nouveaux produits médicamenteux se démarqueront pour leur valeur thérapeutique au cours des premières années qui suivent leur lancement sur le marché canadien.
12 Ratio de la variation annuelle de la valeur monétaire des ventes de cette catégorie thérapeutique par rapport à la variation de la valeur des ventes de tous les produits médicamenteux brevetés.
13 Pour des raisons de confidentialite, les donnees sur ces deux groupes ont ete combinees.
Tendances des prix
Le CEPMB compile l’Indice des prix des médicaments brevetés (IPMB). Cet indice nous permet d’observer les tendances des prix des produits médicamenteux brevetés. L’IPMB mesure la variation moyenne des prix auxquels les brevetés vendent leurs produits médicamenteux brevetés sur le marché canadien (prix départ-usine) par rapport à l’année précédente. L’indice est calculé à l’aide de la formule qui correspond à la moyenne de la variation des prix au niveau du produit médicamenteux pondérée en fonction des ventes du produit médicamenteux.14 La méthodologie utilisée rappelle celle qu’utilise Statistique Canada pour compiler l’Indice des prix à la consommation (IPC). L’IPMB est actualisé à chaque semestre à partir des données sur les prix et sur les ventes dont les brevetés font rapport au Conseil.15
Il est important de bien comprendre la relation théorique qui existe entre l’IPMB et les coûts en produits médicamenteux. L’IPMB ne mesure pas les effets des changements de l’utilisation faite des produits médicamenteux sur les dépenses en médicaments. Cette mesure est prise par un autre indice appelé l’indice du volume des ventes de médicaments brevetés — l’IVVMB, (voir à la page 35 « Utilisation des produits médicamenteux brevetés ». L’IPMB ne mesure pas non plus l’incidence sur les coûts des nouvelles habitudes d’ordonnance des médecins ou de l’arrivée sur le marché de nouveaux produits médicamenteux. L’IPMB est conçu pour isoler la composante de variation des ventes attribuable aux variations des prix des produits médicamenteux brevetés.
Le graphique 5 présente les variations annuelles de l’IPMB pour les années 1988 à 2008. Selon la mesure prise par l’IPMB, les prix départ-usine des produits médicamenteux brevetés ont augmenté en moyenne de 0,1 % en 2008 par rapport à 2007.
, 1988-2008")
COMPARAISON DE L’IPMB ET DE L’IPC
La Loi sur les brevets prévoit que le CEPMB doit tenir compte des variations de l’Indice des prix à la consommation (IPC) lorsqu’il est appelé à déterminer si le prix d’un médicament breveté est ou non excessif. Le graphique 6 présente les variations annuelles de l’IPMB par rapport aux variations de l’IPC pour les mêmes années. L’inflation des prix, mesurée au moyen de l’IPC, a été supérieure à l’augmentation moyenne des prix des produits médicamenteux brevetés presque chaque année depuis 1988.16 La situation s’est répétée en 2008 alors que l’IPC a augmenté de 2,3 %17 et que l’IPMB a reculé de 0,1 %.
Il n’est pas surprenant que l’IPMB n’ait pas augmenté au même rythme que l’IPC. Les Lignes directrices du Conseil prévoient que les prix des produits médicamenteux brevetés ne peuvent augmenter davantage que le taux moyen d’augmentation de l’indice des prix à la consommation calculé sur une période de trois ans. (Les Lignes directrices limitent également les augmentations annuelles de prix à une fois et demi le taux d’inflation calculé à l’aide de l’IPC.) Ces exigences ont pour effet de limiter les augmentations de l’IPC sur toute période d’au moins trois années.18 En pratique, les variations de l’IPC n’atteignent jamais cette limite étant donné que certains brevetés n’augmentent pas les prix de leurs politiques dans toute la mesure autorisée en vertu des Lignes directrices du CEPMB lorsqu’ils ne les réduisent pas.
 et de l’Indice des prix à la consommation (IPC), 1988-2008")
VARIATION DES PRIX SELON LE GROUPE THÉRAPEUTIQUE
Le tableau 12, à la page 28, présente les taux moyens de variation des prix des médicaments brevetés selon leur groupe thérapeutique principal. Ce tableau a été établi en appliquant la méthode de calcul de l’IPMB aux données sur les prix des différents médicaments brevetés ventilées selon le groupe thérapeutique principal. La dernière colonne du tableau présente le résultat de la décomposition de la variation globale de l’IPMB où chaque entrée représente la composante attribuable aux médicaments du groupe thérapeutique correspondant. Selon cette mesure, l’augmentation de 0,1 % de l’IPMB indique que les prix des médicaments des différentes catégories thérapeutiques sont relativement stables. En effet, toutes catégories thérapeutiques confondues, aucun médicament n’affiche une augmentation du prix supérieure à celle de l’inflation mesuré au moyen de l’IPC.19
TABLEAU 12 Variation de l’IPMB selon le groupe thérapeutique principal, 2008
| Groupe thérapeutique principal |
Pourcentage des ventes en 2008 (%) |
Variation des prix 2007 par rapport à 2008 (%) |
Croissance (2008 par rapport à 2007) |
| A : Tube digestif et métabolisme |
12,0 |
-1,9 |
-0,2 |
| B : Sang et organes sanguinoformateurs |
6,9 |
-0,5 |
0,0 |
| C : Système cardiovasculaire |
25,1 |
0,4 |
0,1 |
| D : Produits dermatologiques |
0,9 |
0,0 |
0,0 |
| G : Système génito-urinaire et hormones sexuelles |
3,7 |
0,8 |
0,0 |
| H : Préparations hormonales systémiques |
0,8 |
1,4 |
0,0 |
J : Antiinfectieux généraux pour usage systémique
P : Produits antiparasitaires20 |
9,3 |
-1,0 |
-0,1 |
| L : Agents antinéoplasiques et immunomodulateurs |
14,5 |
-0,3 |
0,0 |
| M : Système musculo-squelettique |
4,2 |
0,9 |
0,0 |
| N : Système nerveux |
12,6 |
0,2 |
0,0 |
| R : Système respiratoire |
8,0 |
1,4 |
0,1 |
| S : Organes sensoriels |
1,5 |
0,9 |
0,0 |
| V : Divers |
0,5 |
-3,2 |
0,0 |
| Tous les groupes thérapeutiques |
100,0 |
0,1 |
0,1* |
| * Voir la note de bas de page no 19, à la page 27 |
VARIATION DES PRIX SELON LA CATÉGORIE DE CLIENTS
Le graphique 7 présente les taux moyens de variation des prix selon la catégorie de clients. Ces taux ont été obtenus en appliquant la méthodologie du calcul de l’IPMB aux données sur la valeur des ventes de produits médicamenteux brevetés ventilées selon que les ventes ont été faites aux hôpitaux, aux pharmacies ou aux grossistes.21 Pour ces catégories de clients, les taux de variation des prix ont été de -0,8 % dans le cas des hôpitaux, de 0,2 % pour les pharmacies et 0,6 % pour les grossistes. Mis ensemble, les pharmacies et les grossistes affichent une augmentation des prix de l’ordre de 0,5 %. Aucune catégorie de clients n’a enregistré un taux de variation de prix largement inférieur à l’inflation mesurée à l’aide de l’IPC.
 selon la catégorie de clients, 2005-2008")
VARIATION DES PRIX SELON LA PROVINCE OU LE TERRITOIRE
Le graphique 8 présente les taux moyens de variation des prix des produits médicamenteux brevetés selon la province ou le territoire. Les résultats ont été obtenus en appliquant la méthodologie du calcul de l’IPMB aux données sur les prix ventilées selon la province ou le territoire dans lequel les ventes ont été effectuées. Ces résultats révèlent que, entre 2007 et 2008, les prix des produits médicamenteux brevetés ont reculé dans l’Île-du-Prince-Édouard, dans les Territoires du Nord-Ouest et au Yukon et n’ont pratiquement pas bougé en Nouvelle-Écosse et en Alberta. Ce sont le Manitoba (1,3 %), Terre-Neuve et Labrador (0,8 %) qui ont connu les augmentations les plus marquées. En Ontario et au Québec, le taux d’augmentation de l’IPMB était de 0,2 % pour l’Ontario et 0,3 % pour le Québec. Toutefois, le taux moyen de variation du prix dans chaque province/territoire se situait sous le taux d’inflation mesuré au moyen de l’IPC.

VARIATION DU PRIX D’UN PRODUIT MÉDICAMENTEUX BREVETÉ DANS LES ANNÉES QUI SUIVENT SON LANCEMENT SUR LE MARCHÉ CANADIEN
Le prix d’un produit médicamenteux breveté varie-t-il beaucoup au cours des années qui suivent le lancement du produit médicamenteux sur le marché canadien ? Le graphique 9 répond à cette question en présentant le ratio moyen des prix de vente des produits médicamenteux en 2008 par rapport aux prix auxquels ils ont été offerts au moment de leur lancement sur le marché canadien. Le graphique présente un ratio pour les produits médicamenteux lancés sur le marché chaque année commençant en 1995 et années suivantes.
Les résultats obtenus démontrent une stabilité des prix : en 2008, le prix d’un produit médicamenteux breveté se situait dans une marge de plus ou moins 4 % de son prix de lancement et ce, quelle que soit l’année de lancement du produit médicamenteux sur le marché canadien. Les résultats ne révèlent donc aucune tendance à la hausse ou à la baisse des prix après le lancement du produit médicamenteux sur le marché canadien. Les prix semblent plutôt varier d’une façon aléatoire tout en se maintenant dans la parité.22
VARIATION DES PRIX SELON LE PAYS
La Loi et le Règlement obligent les brevetés à faire rapport au CEPMB des prix départ-usine accessibles au public pratiqués dans les sept pays de comparaison nommés dans le Règlement. Ces pays sont la France, l’Allemagne, l’Italie, la Suède, la Suisse, le Royaume-Uni et les États- Unis. Le CEPMB utilise ces données aux fins suivantes :
- pour effectuer les comparaisons des prix internationaux prévues dans les Lignes directrices, et
- pour comparer les prix des produits médicamenteux pratiqués au Canada avec les prix pratiqués dans d’autres pays.
Le graphique 10 présente les taux de variation annuelle des prix pour le Canada et pour les sept pays de comparaison. Ces valeurs ont été obtenues en appliquant la méthodologie de l’IPMB (avec pondération pour tenir compte des tendances des ventes au Canada) aux données sur les prix pratiqués dans les différents pays de comparaison fournies par les brevetés. À titre d’information, deux résultats sont présentés pour les États-Unis : le premier résultat porte exclusivement sur les prix du marché (à savoir les coûts d’acquisition au prix de gros)23 déclarés par les brevetés alors que le deuxième tient compte des prix de la Classification fédérale des approvisionnements (US Federal Supply Schedule ou FSS) également déclarés par les brevetés.24
D’après le graphique 10, les prix aux États-Unis auraient augmenté d’un taux de 8 à 9 % en 2008. Pour la même période, les prix des médicaments auraient augmenté de 1,9 % au Royaume-Uni et de 1,8 % en Allemagne, des augmentations plus modestes. La Suisse a pour sa part connu la baisse de prix des médicaments la plus marquée (-2,7 %).


14 Soit au niveau défini par le Numéro d’identification du médicament (DIN) émis par Santé Canada. Chaque DIN représente une combinaison unique d’ingrédient(s) actif(s), de forme(s) posologique(s) et de concentration(s).
15 Pour comprendre comment est calculé l’IPMB, voir le document du CEPMB intitulé « Description de la méthodologie de l’indice-chaîne Laspeyres utilisée pour calculer l’indice des prix des médicaments brevetés (IPMB) » juin 2000. Depuis 1999, l’IPMB ne porte que sur les variations des prix des produits médicamenteux brevetés pour usage humain
16 La limite appliquée à l’augmentation annuelle du prix fait en sorte que l’IPMB peut augmenter d’un taux plus élevé que l’IPC. L’année 1992 est la seule année où l’IPMB a augmenté davantage que l’IPC. Dans un effort pour faciliter et encourager la conformité des brevetés, la méthodologie de rajustement des prix en fonction de l’IPC du CEPMB utilise le taux d’IPC prévu et publié par le ministère des Finances. En 1992, le taux prévu était de 3,2 % alors que le taux réel n’était que de 1,5 %. Cette méthodologie du prix rajusté pour tenir compte des variations de l’IPC est présentée dans le Compendium de politiques, des Lignes directrices, et des procédures.
17 Statistique Canada, CANSIM, Série V735319.
18 Cette limite appliquée au prix fait en sorte que l’IPMB pourrait augmenter davantage que l’IPC sur une période de douze mois.
19 R représente le taux général de variation de l’IPMB et N, les groupes thérapeutiques nommés 1,2… R(i) représente le taux moyen de variation du prix du groupe thérapeutique principal i obtenu avec la méthodologie de l’IPMB.
R étant une moyenne des variations des prix de tous les produits médicamenteux pondérée en fonction de la valeur des ventes, il devient facile de calculer la relation suivante :
R = w(1)R(1) + w(2)R(2) + … + w(N)R(N),
où w(i) représente la part du groupe thérapeutique principal de l’ensemble des ventes. Cette dernière équation constitue la base de la décomposition par groupe thérapeutique présentée à la dernière colonne du tableau 12, à la page 28. Chaque terme du côté droit multiple le taux moyen de variation du prix pour un groupe thérapeutique donné par sa part de l’ensemble des ventes. La valeur ainsi obtenue peut facilement être considérée comme la contribution correspondante du groupe thérapeutique à la variation de l’IPMB. L’envergure de cette contribution dépend du taux de variation du prix pour le groupe thérapeutique en question et de son importance relative (mesurée par sa part de l’ensemble des ventes).
Tel que mentionné, la décomposition dans le tableau 12 est approximative étant donné que les pondérations utilisées sont tirées des données sur les ventes annuelles alors que l’IPMB est calculé avec des données couvrant des périodes de six mois. L’écart obtenu est généralement minime.
20 Pour des raisons de confidentialité, les données sur ces deux groupes ont été combinées.
21 Les résultats pour une quatrième catégorie de clients, la catégorie « autres », ne sont pas fournis. Les acheteurs de la catégorie « autres » sont essentiellement des établissements de soins de santé autres que les hôpitaux, notamment des cliniques médicales et des centres de soins infirmiers. En 2008, cette catégorie a été à la source d’environ 5,5 % de toutes les ventes de produits médicamenteux brevetés.
22 Ce constat fait référence au comportement des prix en général. Il existe sans aucun doute des cas où le prix d’un produit médicamenteux a augmenté ou baissé d’une façon marquée depuis son lancement sur le marché canadien.
23 L’expression « coût d’acquisition au prix de gros » (Wholesale Acquisition Costs – WAC) désigne le prix que le grossiste paie à son fournisseur qui est généralement le fabricant du médicament. Le coût d’acquisition au prix de gros accessible au public correspond habituellement au prix de liste du fabricant et ne reflète pas toujours tous les rabais et escomptes consentis par le fabricant.
24 L’industrie pharmaceutique des États-Unis a fait valoir que les prix accessibles au public dans ce pays ne reflètent pas vraiment les prix réels en raison des remises et des rabais consentis sur une base confidentielle. Depuis janvier 2000, dans la foulée d’une consultation publique, le CEPMB inclut les prix figurant dans la Classification fédérale des approvisionnements (Federal Supply Schedule ou FSS) des États-Unis dans son calcul des prix moyens des médicaments brevetés pratiqués aux États-Unis. Les prix de la Classification fédérale sont négociés entre les fabricants et le département des Anciens combattants des États-Unis. Ils sont généralement moins élevés que les autres prix accessibles au public pratiqués aux États-Unis et divulgués dans les rapports des brevetés au CEPMB.
COMPARAISON DES PRIX AU CANADA AVEC CEUX PRATIQUÉS DANS LES PAYS DE COMPARAISON
Les tableaux 13 et 14, aux pages 32 et 33, présentent des statistiques détaillées qui permettent de comparer les prix des médicaments pratiqués dans les sept pays de comparaison avec ceux pratiqués au Canada. Chaque tableau présente quatre séries de ratios de prix moyens. Ils sont différents l’un de l’autre selon (1) la formule de calcul de la moyenne utilisée et (2) la méthode de conversion en équivalents en dollars canadiens des prix exprimés dans la devise des différents pays. Les deux tableaux présentent également le nombre de produits médicamenteux (DIN) et le volume des ventes couvertes par les statistiques.25
Le CEPMB faisait jusqu’ici rapport des ratios moyens des prix pratiqués dans les pays de comparaison par rapport aux prix pratiqués au Canada sous forme de ratios calculés à l’aide des moyennes géométriques pondérées en fonction du volume des ventes. Les résultats obtenus sont présentés dans les tableaux 13 et 14 (sous « Moyenne géométrique »). Ces tableaux présentent aussi les résultats obtenus avec une moyenne arithmétique pondérée en fonction du volume des ventes (sous « Moyenne arithmétique »).26 Ces statistiques permettent de répondre aux questions comme celle-ci :
« COMBIEN LES CANADIENS AURAIENT-ILS PAYÉ, EN PLUS OU EN MOINS, LEURS PRODUITS MÉDICAMENTEUX BREVETÉS EN 2008 S’ILS LES AVAIENT ACHETÉS AUX PRIX PRATIQUÉS DANS LE PAYS X ? »
Par exemple, vous pouvez voir dans le tableau 13 que le ratio du prix moyen en France par rapport au prix moyen au Canada calculé avec la moyenne arithmétique est 0,88 pour 2008. Ce ratio signifie que les Canadiens auraient payé leurs médicaments brevetés 12 % de moins en 2008 s’ils avaient pu les acheter aux prix pratiqués en France.
Pendant bon nombre d’années, le CEPMB a fait rapport des ratios des prix moyens pratiqués dans les pays de comparaison par rapport aux prix moyens pratiqués au Canada après avoir converti les prix pratiqués dans les pays de comparaison en équivalents dollars canadiens, utilisant pour la conversion les moyennes des taux de change (ou, plus précisément, les moyennes mobiles des taux de change sur une période de 36 mois que le CEPMB utilise généralement lorsqu’il applique ses Lignes directrices sur l’examen du prix).
Le tableau 13 compare également les ratios des prix des produits médicamenteux dans les pays de comparaison par rapport à leurs prix au Canada après avoir converti la devise à l’aide de la parité du pouvoir d’achat. Le taux de parité des pouvoirs d’achat représente le coût de la vie relatif dans ces deux pays exprimés dans leurs devises respectives. En pratique, le coût de la vie est calculé à l’aide d’un panier de produits et de services aux prix courants. Étant donné que les taux de parité des pouvoirs d’achat représentent le coût de la vie dans chacun des pays, ils consti - tuent un moyen simple de rajuster les prix pour tenir compte des différences de revenus et d’autres valeurs monétaires dans la comparaison des prix pratiqués dans les différents pays. Lorsque appliqués au calcul des ratios moyens des prix pratiqués dans les pays de comparaison par rapport aux prix pratiqués au Canada, les taux de parité des pouvoirs d’achat fournissent des statistiques qui nous permettent de répondre à des questions comme celle-ci :
« DANS QUELLE MESURE LES CANADIENS AURAIENT-ILS DÛ SABRER DANS LEUR CONSOMMATION DE BIENS ET DE SERVICES POUR ACHETER DES PRODUITS MÉDICAMENTEUX BREVETÉS OU, ENCORE, AURAIENT-ILS PU AUGMENTER LEUR CONSOMMATION DE BIENS ET DE SERVICES SI, EN 2008, ILS AVAIENT VÉCU ET ACHETÉ LEURS PRODUITS MÉDICAMENTEUX BREVETÉS DANS LE PAYS X ? »
On ne peut répondre à telle question en limitant la comparaison aux prix des produits médicamenteux. Il faut en effet calculer ce que chaque prix représente en termes de biens et de services sacrifiés. C’est précisément ce que permettent de faire les parités des pouvoir d’achat.
COMPARAISONS BILATÉRALES DES PRIX
Le tableau 13 compare les prix pratiqués dans les sept pays de comparaison avec ceux pratiqués au Canada. D’après les résultats de la conversion des différentes devises aux taux de change du marché, les prix des produits médicamenteux brevetés pratiqués au Canada se situent encore dans la juste moyenne. Les prix en Italie et en France sont beaucoup moins élevés qu’au Canada. Comme dans les années antérieures, les prix des médicaments brevetés étaient encore en 2008 beaucoup plus élevés aux États-Unis qu’au Canada et que dans les autres pays de comparaison.
Les ratios moyens de prix obtenus suite à la conversion des devises aux taux de parité des pouvoirs d’achat (PPA) (bas du tableau 13) présentent des différences plus marquées entre le Canada et les pays de comparaison. Si l’on tient compte des différences du coût de la vie dans les sept pays de comparaison, le Canada apparaît comme le pays où les coûts de consommation pour les produits médicamenteux brevetés sont les plus élevés. En effet, ils donnent à penser que les Canadiens ont dû en 2008 sacrifier un taux beaucoup plus élevé de leur pouvoir d’achat pour se procurer des médicaments brevetés que n’ont dû le faire les consommateurs des pays de comparaison, exclusion faite des consommateurs des États-Unis et de l’Allemagne.
Le graphique 11 présente ces résultats dans une perspective historique. En 1987, les prix au Canada étaient en moyenne moins élevés que ceux pratiqués aux États-Unis, mais bien au-dessus de ceux pratiqués dans les autres pays. La situation s’est renversée dans les années 1990 alors que les prix au Canada se situaient dans la moyenne de ceux pratiqués dans les six pays européens. En 2008, les prix au Canada étaient en moyenne supérieurs à ceux pratiqués en Italie et en France, mais moins élevés que ceux aux États-Unis bien qu’à l’intérieur d’une marge de plus ou moins 10 % lorsque comparés à ceux en Allemagne, en Suède, en Suisse et au Royaume-Uni.
TABLEAU 13 Ratios des prix moyens des produits médicamenteux brevetés pratiqués dans les pays de comparaison par rapport aux prix
pratiqués au Canada, Comparaisons bilatérales, 2008
| (i) Taux de change du marché |
|
Canada |
France |
Italie |
Allemagne |
Suède |
Suisse |
Royaume Uni |
États Unis |
| Moyenne géométrique |
1,00 |
0,82 |
0,75 |
1,02 |
0,90 |
0,94 |
0,93 |
1,63 |
| Moyenne arithmétique |
1,00 |
0,88 |
0,83 |
1,10 |
0,96 |
0,99 |
0,98 |
1,76 |
| Nbre de DIN |
1 18927 |
753 |
764 |
873 |
857 |
807 |
845 |
1 005 |
| Revenus nets (en millions $) |
12 978,4 |
10 900,1 |
11 029,6 |
11 244,5 |
10 976,5 |
11 217,3 |
11 042,2 |
12 324,8 |
|
|
| (ii) Parité des pouvoirs d’achat |
|
Canada |
France |
Italie |
Allemagne |
Suède |
Suisse |
Royaume Uni |
États Unis |
| Moyenne géométrique |
1,00 |
0,75 |
0,72 |
1,00 |
0,76 |
0,75 |
0,84 |
1,81 |
| Moyenne arithmétique |
1,00 |
0,80 |
0,79 |
1,07 |
0,80 |
0,79 |
0,89 |
1,96 |
| Nbre de DIN |
1 18927 |
753 |
764 |
873 |
857 |
807 |
845 |
1 005 |
| Revenus nets (en millions $) |
12 978,4 |
10 900,1 |
11 029,6 |
11 244,5 |
10 976,5 |
11 217,3 |
11 042,2 |
12 324,8 |
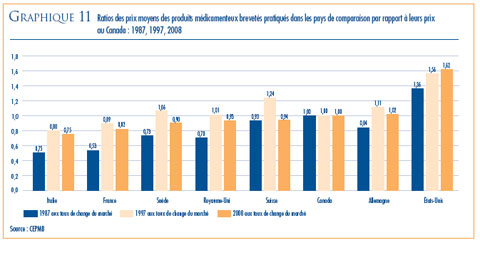
COMPARAISONS MULTILATÉRALES DES PRIX
Le tableau 14 présente les ratios moyens des prix pratiqués dans les pays de comparaison par rapport aux prix pratiqués au Canada et ce, pour plusieurs mesures multilatérales de prix. Le « prix international médian » correspond à la médiane des prix de vente des produits médicamenteux dans les sept pays de comparaison. D’autres ratios de prix multilatéraux comparent la moyenne minimale, maximale et simple des prix pratiqués dans les pays de comparaison par rapport aux prix au Canada.
Sous l’angle des résultats obtenus avec les taux de change du marché, le ratio de la médiane des prix pratiqués dans les pays de comparaison par rapport aux prix au Canada s’est maintenu à 0,96 en 2008 lorsque celui-ci a été calculé comme moyenne géométrique et à 1,02 avec la moyenne arithmétique. Dans le rapport annuel 2007, ces valeurs étaient de 0,98 (moyenne géométrique) et 1,04 (moyenne arithmétique).
Le graphique 12 présente ce résultat dans une perspective historique. En 1987, les médianes des prix pratiqués dans les pays de comparaison étaient en moyenne de 19 % inférieures aux prix canadiens. Toutefois, en 1998, elles dépassaient les prix canadiens de 14 %. Le ratio moyen de la médiane des prix pratiqués dans les pays de comparaison par rapport aux prix pratiqués au Canada s’est maintenu au-dessus de la parité jusqu’en 2007.
Les résultats obtenus avec les autres mesures multilatérales ne sont pas surprenants. Fait intéressant, la moyenne des prix pratiqués dans les pays de comparaison semble produire des ratios des prix pratiqués dans les pays de comparaison par rapport aux prix pratiqués au Canada plus élevés que les médianes des prix pratiqués dans les pays de comparaison. Cette situation s’explique par l’influence des prix pratiqués aux États-Unis où les prix sont beaucoup plus élevés que dans tous les autres pays. (Les prix pratiqués aux États-Unis sont presque toujours pris en compte dans le calcul du prix moyen pratiqué dans les pays de comparaison, mais bien rarement dans la médiane des prix pratiqués dans les pays de comparaison.)
Comme pour les comparaisons bilatérales, les différences entre les résultats obtenus avec les taux de change du marché et les résultats obtenus avec les PPA sont frappantes. Elles confirment l’idée que le Canada peut apparaître comme un pays où les prix des médicaments brevetés sont « moyens » en termes purement monétaires, mais où sa population doit sacrifier beaucoup plus de sa consommation d’autres produits et services pour acheter des produits médicamenteux brevetés que ne doivent le faire les résidants de la plupart des autres pays de comparaison. Avec la conversion des devises à l’aide de la PPA, le ratio moyen de la médiane des prix pratiqués dans les pays de comparaison par rapport aux prix pratiqués au Canada (moyenne géométrique) est de 0,86 pour 2008, soit beaucoup moins que la valeur de 0,96 obtenue avec les taux de change du marché.
TABLEAU 14 Ratios des prix moyens des produits médicamenteux brevetés dans les pays
de comparaison par rapport aux prix moyens au Canada, Comparaisons multilatérales, 2008
| (i) Taux de change du marché |
|
Médiane |
Minimum |
Maximum |
Moyenne |
| Moyenne géométrique |
0,96 |
0,69 |
1,75 |
1,07 |
| Moyenne arithmétique |
1,02 |
0,76 |
1,86 |
1,12 |
| Nbre de DIN |
1 125 |
1 125 |
1 125 |
1 125 |
| Revenus nets (en millions $ ) |
12 679,0 |
12 679,0 |
12 679,0 |
12 679,0 |
|
|
| (ii) Parité des pouvoirs d’achat |
|
Médiane |
Minimum |
Maximum |
Moyenne |
| Moyenne géométrique |
0,86 |
0,64 |
1,87 |
1,02 |
| Moyenne arithmétique |
0,92 |
0,71 |
2,00 |
1,07 |
| Nbre de DIN |
1 125 |
1 125 |
1 125 |
1 125 |
| Revenus nets (en millions $ ) |
12 679,0 |
12 679,0 |
12 679,0 |
12 679,0 |

Le graphique 13 présente avec encore plus de détails les ratios des prix des produits médicamenteux brevetés pratiqués dans les pays de comparaison par rapport aux prix pratiqués au Canada, ventilés selon la moyenne de la valeur des ventes rapportée dans le tableau 13. Ce graphique ventile les ventes de médicaments brevetés effectuées en 2008 selon le ratio de la médiane des prix des produits médicamenteux brevetés pratiqués dans les pays de comparaison par rapport aux prix pratiqués au Canada (ou, pour être plus précis, selon la fourchette dans laquelle s’inscrit le ratio).28 Ces résultats révèlent une dispersion importante des ratios de prix au niveau du produit. Même si les produits dont les ratios du prix international médian par rapport au prix au Canada se situent entre 0,90 et 1,10 accaparent 33 % des ventes, ceux dont les ratios se situent sous 0,90 accaparaient 37 % des ventes et ceux dont les ratios dépassaient 1,10, 30 % des ventes. À l’inverse, les produits médicamenteux brevetés dont les ratios du prix international médian par rapport aux prix pratiqués au Canada se situent entre 0,75 et 1,25 accaparent 69,8 % des ventes, alors que les produits dont les ratios se situent sous 0,75 en accaparent 15,3 % et les produits dont les ratios dépassent 1,25 accaparent 14,9 % des ventes.

RATIOS DES PRIX MOYENS : ANALYSE DES VARIATIONS
Dans l’ensemble, les résultats des comparaisons avec le prix international obtenus en 2008 sont très similaire à ceux dont faisait état le Rapport annuel de l’an dernier. Le changement le plus important porte sur les ratios moyens des prix des médicaments aux États-Unis par rapport à leurs prix au Canada calculés à la parité du pouvoir d’achat qui sont beaucoup plus élevés cette année. Considérant la façon dont sont calculés ces ratios, les quatre facteurs suivants peuvent être à l’origine de la baisse observée :
- appréciation de la valeur du dollar canadien par rapport au dollar américain résultant de l’utilisation de nouveaux facteurs de conversion des devises
- augmentation des prix pratiqués aux États-Unis
- baisse des prix au Canada
- changement des pondérations en fonction des ventes qui favorise les médicaments présentant des ratios plus élevés des prix des médicaments brevetés pratiqués aux États-Unis par rapport aux prix pratiqués au Canada.
D’autres analyses de données révèlent que l’augmentation observée des ratios des prix des produits médicamenteux aux États-Unis par rapport à leurs prix au Canada calculés à la parité des pouvoirs d’achat est presque exclusivement attribuable à l’augmentation des prix des médicaments aux États-Unis. Par ailleurs, si on calcule les ratios des prix moyens des médicaments aux États-Unis par rapport à leurs prix moyens au Canada avec les prix de 2007 des produits médicamenteux aux États-Unis plutôt que ceux de 2008, les ratios obtenus sont très similaires à ceux présentés dans le rapport annuel de l’an dernier.29 D’autre part, si on remplace les valeurs de 2008 des autres variables par celles de 2007, on observe une faible incidence sur ces ratios.
UTILISATION FAITE DES MÉDICAMENTS BREVETÉS
Les données sur les prix et sur la valeur des ventes utilisées pour calculer l’IPMB servent également à déterminer les tendances des quantités de médicaments brevetés vendus au Canada. Le CEPMB calcule à cette fin l’Indice de volume des ventes de médicaments brevetés (IVVMB).30 Le graphique 14 présente pour les années 1988 à 2008 les taux moyens de croissance de l’utilisation des médicaments brevetés, mesurée à l’aide de l’IVVMB. Les résultats obtenus confirment que la croissance de l’utilisation faite des médicaments brevetés est le principal facteur d’augmentation de la valeur des ventes. Les taux de croissance de l’utilisation des dernières années talonnent en effet de près les taux de croissance de la valeur des ventes. Cette tendance s’est maintenue en 2008, le taux d’utilisation des médicaments brevetés ayant augmenté de 3,9 %. Considérant l’ampleur de l’effet du nouveau médicament présenté dans le tableau 10, à la page 24, il n’est pas surprenant que le taux de croissance de l’utilisation faite des médicaments brevetés soit un peu moins élevé que le taux de croissance des ventes.
, 1988-2008")
CROISSANCE DE L’UTILISATION FAITE DES MÉDICAMENTS SELON LA CATÉGORIE THÉRAPEUTIQUE
Le tableau 15 présente les taux moyens de croissance de l’utilisation faite des médicaments brevetés. Ces taux sont ventilés selon les groupes thérapeutiques principaux. Les résultats présentés dans ce tableau ont été obtenus en appliquant la méthodologie de l’IVVMB aux données du premier niveau de la classification ATC. Comme dans le tableau 12, à la page 28, la dernière colonne donne un aperçu de la contribution des différents groupes thérapeutiques à la variation de l’IVVMB. Exception faite de trois groupes thérapeutiques, le taux d’utilisation des médicaments a augmenté en 2008. Les principaux groupes thérapeutiques à l’origine en 2008 des variations de l’IVVMB31 sont les suivants :
- agents antinéoplasiques et immunomodulateurs
- médicaments utilisés pour traiter le système cardiovasculaire.
TABLEAU 15 Variation de l’Indice du volume des ventes de médicaments brevetés selon le
groupe thérapeutique principal, 2008
| Groupe thérapeutique principal |
Pourcentage des ventes de 2008 (%) |
Variation de l’IVVMB 2007-2008 (%) |
Contribution à la variation de l’IVVMB (%) |
| A : Tube digestif et métabolisme |
12,0 |
-19,4 |
-2,3 |
| B : Sang et organes sanguinoformateurs |
6,9 |
-2,8 |
-0,2 |
| C : Système cardiovasculaire |
25,1 |
7,0 |
1,7 |
| D : Produits dermatologiques |
0,9 |
9,1 |
0,1 |
| G : Système génito-urinaire et hormones sexuelles |
3,7 |
14,8 |
0,5 |
| H : Préparations systémiques hormonales |
0,8 |
-1,2 |
0,0 |
J : Antiinfectieux généraux pour usage systémique
P: Produits antiparasitaires32 |
9,3 |
2,4 |
0,2 |
L : Agents antinéoplasiques et agents
immunomodulateurs |
14,5 |
17,9 |
2,6 |
| M : Système musculo-squelettique |
4,2 |
3,9 |
0,2 |
| N : Système nerveux |
12,6 |
2,6 |
0,3 |
| R : Système respiratoire |
8,0 |
6,1 |
0,5 |
| S : Organes sensoriels |
1,5 |
35,8 |
0,6 |
| V : Divers |
0,5 |
11,4 |
0,1 |
| Tous les groupes thérapeutiques |
100,0 |
3,9 |
3,9* |
* Voir la note de bas de page 31
Source : CEPMB |
Ces deux groupes thérapeutiques sont conjointement à l’origine d’une augmentation encore plus marquée que celle de l’utilisation rapportée à l’aide de l’IVVMB. L’augmentation générale de l’utilisation aurait été beaucoup plus prononcée s’il n’y avait pas eu une réduction marquée (19,4 %) de l’utilisation faite du groupe thérapeutique « tube digestif et métabolisme ».
25 Le nombre de produits médicamenteux et la valeur des ventes varient selon le produit médicamenteux de comparaison étant donné qu’il n’est pas toujours possible de trouver pour chaque produit médicamenteux breveté vendu au Canada les prix auxquels le médicament est vendu dans les pays de comparaison. À cet égard, il convient ici de préciser que tous les ratios des prix moyens présentés dans les tableaux 13 et 14, aux pages 32 et 33, couvrent au moins 84 % de la valeur des ventes au Canada en 2008. Les ratios déclarés des prix pratiqués aux États-Unis par rapport aux prix pratiqués au Canada couvrent environ 95 % des ventes de 2008.
26 Si RG représente le ratio moyen des prix calculé à l’aide de moyenne géométrique, RA correspond au ratio moyen des prix obtenu avec la moyenne arithmétique. Si p(i) représente le prix du médicament i pratiqué au Canada, pf(i) représente le prix de ce médicament à l’étranger (converti en dollars canadiens) et w(i) sa part de la valeur des ventes au Canada. Alors RG = ? [pf(i)/p(i)]w(i) (où ? représente le résultat de la multiplication de tous les médicaments brevetés), alors que RA = S w(i)[pf(i)/p(i)] (où S correspond à la somme de tous les produits médicamenteux brevetés). Il peut ainsi être démontré que RG ne peut être supérieur à RA. Il est également possible de démontrer que l’écart entre RA et RG augmentera dans la même proportion que la variation des ratios des différents médicaments et que RG ne sera égal à RA que dans le cas où tous les ratios de prix ont la même valeur.
27 Ce nombre comprend les sept produits médicamenteux brevetés lancés sur le marché canadien en décembre 2008. Ces sept produits ne sont toutefois pas pris en compte dans les nouveaux produits médicamenteux brevetés dont il est question à la page 8, sous « Réglementation des prix des médicaments brevetés ».
28 Pour obtenir ces résultats, les prix dans les pays de comparaison ont été convertis en équivalents dollars canadiens à l’aide des taux de change du marché.
29 Il convient ici de préciser que les ratios des prix aux États-Unis par rapport aux prix au Canada calculés aux taux de change du marché n’ont que très peu varié en 2008. En effet, la moyenne mobile des taux de change du marché des 36 derniers mois utilisée pour ce calcul révèle une augmentation marquée de la valeur du dollar canadien par rapport à celle du dollar américain, reflétant les mouvements du taux de change connus en 2007 et au début de 2008. Cette augmentation aurait compensée l’augementation des prix pratiqués aux Etats-Unis.
30 À l’instar de l’IPMB, l’IVVMB est calculé à l’aide de la formule de l’indice-chaîne de Laspeyres. Les ratios des volumes des ventes pour des périodes successives remplacent alors les ratios de prix de l’IPMB. Ici encore, la valeur cumulée de l’indice est obtenue sous forme d’une moyenne des ratios pondérée en fonction des recettes générées par les différents médicaments. Puisque l’IVVMB ne couvre que les médicaments brevetés, il ne représente pas les tendances de l’utilisation faite des médicaments sur l’ensemble du marché des médicaments.
31 Comme pour le tableau 12, à la page 28, cette décomposition est approximative. Voir la note de bas de page no 19, à la page 27.
32 Pour des raisons de confidentialité, les données sur ces deux groupes ont été combinées.
TENDANCES DE L’INDUSTRIE CANADIEN - NE DE FABRICATION DE MÉDICAMENTS
À l’échelle mondiale, l’industrie de la fabrication de médicaments est dominée par des multinationales établies dans plusieurs pays. La plupart de ces multinationales ont des filiales au Canada qui, avec une poignée de fabricants canadiens, ont la mainmise sur la fabrication, la vente et la distribution de médicaments au Canada.
Selon Statistique Canada, l’industrie canadienne de fabrication de médicaments a livré en 2008 pour 9,8 milliards de dollars de médicaments, ce qui représente 1,6 % de la valeur totale des livraisons du secteur manufacturier canadien.33 L’industrie canadienne fournit de l’emploi à 28 697 personnes, soit à 1,5 % de l’effectif du secteur manufacturier.34
Le graphique 15 présente les variations annuelles des livraisons et de l’emploi dans le secteur canadien de la fabrication de médicaments.

VENTES DE PRODUITS MÉDICAMENTEUX AU CANADA PAR RAPPORT AUX VENTES DANS D’AUTRES PAYS
IMS Health fait régulièrement rapport des ventes des fabricants au secteur du détail dans différents pays. Le graphique 16 illustre la répartition de ce montant entre les marchés.35 En ce qui concerne le Canada, les ventes de médicaments ont représenté 3,8 % de l’ensemble des ventes sur les principaux marchés mondiaux, un taux comparable à celui de l’Italie. Le marché des États-Unis est de loin le plus important marché au monde. En effet, la valeur des ventes de médicaments sur ce marché dépasse le total combiné des ventes effectuées sur tous les autres grands marchés nommés dans le graphique 16.

Le graphique 17 présente la part des ventes du Canada sur les principaux marchés canadiens pour la période de 2001 à 2008.36 Cette part des ventes est passée de 2,4 % qu’elle était en 2001 à 3,8 % en 2008.

Le graphique 18 compare la croissance des ventes de médicaments au Canada à celle sur d’autres grands marchés. Au cours des dernières années, les taux d’augmentation des ventes de médicaments au Canada ont été supérieurs à ceux des autres pays. La même tendance a été observée au Canada en 2008 avec une croissance annuelle des ventes de 6 %.37 Pour la même période, le taux de croissance des ventes a été de 2,7 % sur les autres grands marchés.

Le graphique 19 présente les taux de croissance des ventes sur les différents marchés du monde pour 2008 par rapport à 2007. Selon les données de IMS Health, la croissance des ventes au Canada a été plus importante que celle observée dans tous les autres pays de comparaison, incluant les États-Unis.

On peut aussi comparer les coûts en médicaments entre les pays à l’aide de la proportion du produit intérieur brut consacrée à l’achat de médicaments.38 Le graphique 20 présente les dépenses en médicaments exprimées en pourcentage du produit intérieur brut (PIB) du Canada et des sept pays de comparaison (données de 2006). Dans les sept pays de comparaison, les dépenses en médicaments ont accaparé entre 1,2 % et 1,9 % du PIB. Sur cette échelle, le Canada s’inscrit près de l’extrémité supérieure.

TABLEAU 16 Dépenses en médicaments exprimées en pourcentage du PIB, 2006
|
|
2006 Dépenses en médicaments (% du PIB) |
2000 Dépenses en médicaments (% du PIB) |
2000-2006 Croissance des dépenses en médicaments (%) |
2000 – 2006 Croissance du PIB (%) |
| Canada |
1.74 |
1.42 |
119.51 |
79.14 |
| France |
1.80 |
1.81 |
72.73 |
73.30 |
| Allemagne |
1.57 |
1.43 |
70.82 |
55.71 |
| Italie |
1.80 |
1.74 |
78.70 |
72.74 |
| Suède |
1.22 |
1.18 |
70.03 |
63.97 |
| Suisse |
1.19 |
1.11 |
72.92 |
61.77 |
| R.-U. |
1.33 |
1.14 |
96.91 |
69.14 |
| É.-U. |
1.93 |
1.46 |
77.41 |
34.36 |
| Source : OCDE |
Au cours des dernières années, la part du PIB consacrée aux dépenses en médicaments a augmenté dans la plupart des pays industrialisés. Le tableau 16 montre que les dépenses en médicaments ont, entre 2000 et 2006, augmenté plus rapidement que le PIB au Canada et que dans les différents pays de comparaison exception faite de la France. En ce qui concerne les États-Unis, les résultats sont particulièrement frappants : les dépenses en médicaments y ont enregistré un taux de croissance presque deux fois plus élevé que le taux de croissance du produit intérieur. Entre 2000 et 2006, les dépenses en médicaments au Canada ont augmenté d’un taux représentant plus ou moins une fois et demie le taux de croissance du PIB.
Le tableau 17 présente la valeur des ventes de médicaments au prix départ-usine au Canada et dans six pays de comparaison.39 Ces ventes sont ventilées selon le groupe thérapeutique principal. À quelques exceptions près, ces résultats révèlent un degré d’uniformité remarquable entre les différents pays. Dans presque tous les pays, les ventes sont dominées par les médicaments pour le système cardiovasculaire et pour le système nerveux central qui accaparent entre 35 % et 47 % de l’ensemble des ventes. Viennent ensuite les médicaments indiqués pour traiter le système digestif et les médicaments indiqués pour traiter les troubles respiratoires qui accaparent entre 21 % et 28 % des ventes.
TABLEAU 17 Ventes selon le groupe thérapeutique principal au Canada et dans les pays de comparaison, 2007
| Groupe thérapeutique principal |
Canada |
Moyenne pays de comparaison |
France |
Allemagne |
Italie |
Suisse |
R.-U. |
É.-U. |
| A : Tube digestif et métabolisme |
14.7 |
13.8 |
12.7 |
14.0 |
13.8 |
14.9 |
13.6 |
13.7 |
| B : Sang et organes sanguinoformateurs |
3.1 |
4.3 |
7.2 |
5.2 |
2.9 |
3.9 |
3.8 |
3.0 |
| C : Système cardiovasculaire |
27.2 |
21.2 |
20.9 |
15.8 |
30.9 |
20.0 |
22.3 |
17.1 |
| D : Produits dermatologiques |
2.7 |
2.5 |
1.9 |
2.1 |
2.7 |
3.3 |
2.7 |
2.5 |
G : Système génito-urinaire et
hormones sexuelles |
4.6 |
5.6 |
4.4 |
5.2 |
6.6 |
6.0 |
5.3 |
6.0 |
| H : Préparations hormonales systémiques |
0.8 |
1.7 |
2.0 |
2.5 |
1.4 |
1.5 |
1.6 |
1.0 |
J : Antiinfectieux pour usage systémique;
P : et Produits antiparasitaires |
5.2 |
7.2 |
9.4 |
7.7 |
7.6 |
7.6 |
2.8 |
8.0 |
L : Agents antinéoplasiques et
immunomodulateurs |
6.4 |
6.2 |
8.2 |
11.0 |
3.4 |
6.9 |
4.0 |
3.6 |
| M : Système musculo-squelettique |
6.3 |
5.7 |
6.6 |
6.2 |
5.5 |
6.8 |
4.9 |
4.3 |
| N : Système nerveux central |
19.7 |
19.6 |
15.8 |
19.3 |
13.4 |
18.2 |
23.3 |
27.4 |
| R : Système respiratoire |
7.6 |
10.1 |
8.7 |
8.4 |
9.2 |
8.8 |
14.1 |
11.0 |
| S : Organes sensoriels |
1.5 |
1.9 |
1.8 |
1.7 |
2.4 |
1.9 |
1.6 |
2.0 |
| V : Divers |
0.2 |
0.3 |
0.3 |
0.7 |
0.1 |
0.1 |
0.1 |
0.2 |
| Total |
100.0* |
100.0* |
100.0* |
100.0* |
100.0* |
100.0* |
100.0* |
100.0* |
* Le total de cette colonne peut ne pas correspondre à 100,0 certains chiffres ayant été arrondis.
Source : Valeurs calculées par le CEPMB à partir de données sur les ventes tirées de la base de données MIDAS de IMS Health. |
33 Depuis la publication de notre Rapport annuel 2005, Statistique Canada a révisé ses données sur les livraisons manufacturières
publiées dans ses Enquêtes annuelles sur les manufactures pour les années 2002 à 2004. Cette révision a donné
lieu à une réduction marquée des estimés des livraisons de médicaments et de produits pharmaceutiques par les fabricants.
34 Statistique Canada, CANSIM, Séries V800188 et V1709627.
35 IMS Health’s Retail Drug Monitor, 2008 (www.imshealth.com). Ce document présente des estimés des achats directs (achats effectués directement auprès du fabricant) et des achats indirects des pharmacies (achats effectués auprès d’un grossiste) dans 13 pays industrialisés. Ces pays sont l’Argentine, l’Australie, le Brésil, le Canada, la France, l’Allemagne, l’Italie, le Japon, le Mexique, la Nouvelle-Zélande, l´Espagne, le Royaume-Uni et les États-Unis. Les valeurs sont exprimées aux prix du fabricant (prix départ-usine) et couvrent tous les médicaments d’ordonnance et certains médicaments en vente libre. Les taux présentés dans le graphique 16 ont été calculés à l’aide des données couvrant les cinq premiers mois de 2008. Les 13 marchés pour lesquels IMS produit des estimés représentent globalement plus des deux tiers du marché mondial des produits pharmaceutiques. La part du Canada du marché mondial des produits pharmaceutiques est d’environ 2,5 %.
36 Pour calculer les parts présentées dans les graphiques 16 et 17, il faut en premier lieu convertir dans une même devise les données sur la valeur des ventes de chaque pays. À cette fin, IMS Health utilise les taux de change du marché. Ainsi, les parts présentées pour le Canada dans ces graphiques sont susceptibles d´être largement influencées par les variations de la valeur relative du dollar canadien.
37 Pour diverses raisons, ce taux de croissance n´est pas le même que celui présenté dans le tableau 9, à la page 23. Il en est ainsi puisque le taux de croissance a été calculé à l’aide de données sur les ventes couvrant des médicaments brevetés et des médicaments non brevetés. Ces données ne couvrent que les ventes faites aux pharmacies.
38 Les comparaisons faites sur cette base tiennent compte des différences aux niveaux des prix des médicaments, de l’utilisation
qui en est faite, des habitudes de choix thérapeutiques et du revenu national.
39 Les données utilisées pour ces calculs (1) ne couvrent que les ventes faites aux pharmacies, (2) comprennent les médicaments génériques et les médicaments de marque non brevetés, (3) sont tirées de données de sondages effectués auprès des acheteurs de médicaments plutôt que des données rapportées directement par les fabricants de médicaments. En conséquence, les résultats présentés dans le Tableau 17 pour le Canada ne sont pas directement comparables à ceux rapportés dans le Tableau 11, à la page 25.
ANALYSE DES DÉPENSES DE RECHERCHEDÉVELOPPEMENT
La Loi confère au CEPMB le mandat de faire le suivi des dépenses des brevetés en recherchedéveloppement et de faire rapport des tendances observées (la Loi ne confère toutefois pas au CEPMB un droit de regard sur le montant des dépenses des brevetés dans la recherche-développement ni sur le type de recherche-développement.) Le présent chapitre fournit les statistiques sur la situation actuelle des investissements dans la recherche-développement pharmaceutique au Canada.
SOURCES DES DONNÉES
La Loi oblige les brevetés à faire rapport au CEPMB des recettes qu’ils tirent des ventes de leurs médicaments pour usage humain et pour usage vétérinaire (y compris les recettes tirées des ventes de médicaments non brevetés et les recettes découlant d’ententes de production sous licence) ainsi que de leurs dépenses de R-D au Canada pour leurs différents médicaments (brevetés et non brevetés, pour usage humain et pour usage vétérinaire). Les résultats présentés ci-après ont été tirés des rapports semestriels que les brevetés ont soumis au Conseil.
Le Règlement exige que le rapport sur les dépenses de R-D que le breveté doit soumettre au Conseil soit accompagné d’un document certifiant l’exactitude et la conformité des données fournies au Conseil. Le CEPMB ne vérifie pas systématiquement l’information qui lui est présentée, mais cherche plutôt les anomalies et les contradictions et, lorsqu’il y a lieu, demande aux brevetés de corriger leurs données ou de les étoffer. Pour garantir la juste interprétation des données, chaque breveté est invité à confirmer, avant la publication du rapport annuel, l’exactitude du ratio de ses dépenses de R-D par rapport aux recettes tirées des ventes calculé par le CEPMB.
Les sociétés pharmaceutiques qui n’ont fait aucune vente au Canada ne sont pas tenues de présenter un rapport sur leurs dépenses de R-D. Ainsi, alors que de nouveaux brevets sont attribués et que d’autres arrivent à échéance, la liste des sociétés pharmaceutiques ayant soumis un rapport sur leurs dépenses de R-D varie d’année en année. Pour 2008, 82 sociétés pharmaceutiques vendant des médicaments brevetés pour usage humain ou pour usage vétérinaire ont présenté des rapports sur leurs dépenses de recherche-développement. De ce nombre, 35 étaient membres de Rx&D (Compagnies de recherche pharmaceutique du Canada).
DÉFAUT DE SOUMETTRE SON RAPPORT SUR SES DÉPENSES DE R-D
En application du paragraphe 89(3) de la Loi, le CEPMB doit faire rapport de l’identité des brevetés qui n’ont pas soumis leur rapport sur leurs dépenses de R-D dans les délais mentionnés dans l’article 88 de la Loi. En 2008, une seule société, Biogen Idec Canada Inc., n’a pas soumis son rapport sur ses dépenses de R-D dans le délai imparti. Le 27 mars 2009, le Conseil a émis une ordonnance à l’encontre de Biogen Idec qui s’est acquitté de son obligation le 9 avril 2009.
RECETTES TIRÉES DES VENTES
Pour des fins du présent rapport, les recettes tirées des ventes s’entendent du produit brut des ventes de médicaments au Canada40 ainsi que des recettes découlant d’ententes de vente sous licence (par ex. redevances et droits de licences versés au breveté).
La valeur des recettes brutes tirées des ventes de médicaments au Canada déclarées par les brevetés a totalisé 16,3 milliards de dollars en 2008, ce qui représente 2,0 % de plus qu’en 2007 (tableau 9, à la page 23). Les recettes tirées des ventes déclarées par les brevetés membres de Rx&D ont totalisé 13,2 milliards de dollars sur la même période, soit 80,9 % des recettes tirées des ventes. De ce montant, moins de 1 % des recettes découlent d’ententes de vente sous licence.
DÉPENSES DE R-D
En vertu de l’article 6 du Règlement, les brevetés ne doivent inclure dans leurs rapports que leurs dépenses de R-D qui auraient été admissibles au crédit d’impôt à l’investissement pour la recherche scientifique et le développement expérimental aux termes de la Loi de l’impôt sur le revenu, dans sa version du 1er décembre 1987. Ainsi, les dépenses de R-D peuvent inclure les dépenses courantes, les coûts d’immobilisation et l’amortissement autorisé. Les frais engagés pour les études de marché, la promotion des ventes, le contrôle de la qualité ou les essais systématiques de matériel, de dispositifs ou de produits ainsi que pour la collecte de données n’étant pas admissibles au crédit d’impôt à l’investissement, ils ne doivent pas figurer dans les rapports au CEPMB.
Le tableau 18 présente la valeur des dépenses de R-D déclarées par l’ensemble des brevetés pour la période de 1988 à 2008. En 2008, les dépenses des brevetés dans la R-D ont totalisé 1,3 milliard de dollars, soit 1,1 % de moins qu’en 2007. Les dépenses déclarées par les brevetés membres de Rx&D ont totalisé 1,2 milliard de dollars en 2008, ce qui représente un recul de 1,0 % par rapport à 2007. Les brevetés membres de Rx&D sont à la source de 89,4 % de toutes les dépenses de R-D déclarées par les brevetés. À titre de comparaison, les brevetés non membres de Rx&D ont déclaré des dépenses de R-D de 0,1 milliard de dollars en 2008, soit 1,8 % de moins qu’en 2007.
TABLEAU 18 Dépenses de R-D déclarées par les brevetés et ratios des dépenses
de R-D par rapport aux recettes tirées des ventes des brevetés, 1988 – 2008
| Année |
Nbre de
brevetés |
Dépenses de R-D Brevetés (millions $) |
Variation par rapport à l’année précédente (%) |
Recettes tirées des ventes (millions $) |
Variation par rapport à l’année précédente (%) |
Ratio des dépenses de R-D par rapport aux recettes tirées des ventes |
| brevetés (%) |
membres de
Rx&D (%) |
| 2008 |
82 |
1 310,7 |
-1,1 |
16 316,7 |
2,0 |
8,1 |
8,9 |
| 2007 |
82 |
1 325,0 |
9,5 |
15 991,0 |
7,3 |
8,3 |
8,9 |
| 2006 |
72 |
1 210,0 |
-1,9 |
14 902,0 |
4,7 |
8,1 |
8,5 |
| 2005 |
80 |
1 234,3 |
5,5 |
14 231,3 |
0,5 |
8,7 |
8,8 |
| 2004 |
84 |
1 170,0 |
-2,0 |
14 168,3 |
4,0 |
8,3 |
8,5 |
| 2003 |
83 |
1 194,3 |
-0,4 |
13 631,1 |
12,8 |
8,8 |
9,1 |
| 2002 |
79 |
1 198,7 |
13,0 |
12 081,2 |
12,5 |
9,9 |
10,0 |
| 2001 |
74 |
1 060,1 |
12,6 |
10 732,1 |
15,3 |
9,9 |
10,6 |
| 2000 |
79 |
941,8 |
5,3 |
9 309,6 |
12,0 |
10,1 |
10,6 |
| 1999 |
78 |
894,6 |
12,0 |
8 315,5 |
19,2 |
10,8 |
11,3 |
| 1998 |
74 |
798,9 |
10.2 |
6 975.2 |
10,9 |
11,5 |
12,7 |
| 1997 |
75 |
725,1 |
9,0 |
6 288,4 |
7,4 |
11,5 |
12,9 |
| 1996 |
72 |
665,3 |
6,4 |
5 857,4 |
9,9 |
11,4 |
12,3 |
| 1995 |
71 |
625,5 |
11,5 |
5 330,2 |
7,5 |
11,7 |
12,5 |
| 1994 |
73 |
561,1 |
11,4 |
4 957,4 |
4,4 |
11,3 |
11,6 |
| 1993 |
70 |
503,5 |
22,1 |
4 747,6 |
14,0 |
10,6 |
10,7 |
| 1992 |
71 |
412,4 |
9,6 |
4 164,4 |
6,9 |
9,9 |
9,8 |
| 1991 |
65 |
376,4 |
23,2 |
3 894,8 |
18,1 |
9,7 |
9,6 |
| 1990 |
65 |
305,5 |
24,8 |
3 298,8 |
11,0 |
9,3 |
9,2 |
| 1989 |
66 |
244,8 |
47,4 |
2 973,0 |
9,4 |
8,2 |
8,1 |
| 1988 |
66 |
165,7 |
– |
2 718,0 |
– |
6,1 |
6,5 |
| Source : CEPMB |
RATIOS DES DÉPENSES DE R-D PAR RAPPORT AUX RECETTES TIRÉES DES VENTES
Le tableau 18, à la page 41, présente également les ratios des dépenses de R-D par rapport aux recettes tirées des ventes. En contrepartie de l’adoption en 1987 des modifications apportées à la Loi, Rx&D s’était engagé à augmenter graduellement ses dépenses annuelles de recherche-développement pour qu’elles totalisent en 1996 au moins 10 % des recettes tirées des ventes.41
Le ratio de 2008 des dépenses de R-D par rapport aux recettes tirées des ventes de tous les brevetés est de 8,1 % alors qu’il était de 8,3 % en 2007. Quant au ratio des brevetés membres de Rx&D, il n’a pas changé par rapport à 2007 (8,9 %).42 Les ratios de dépenses de R-D par rapport aux recettes tirées des ventes pour tous les brevetés et pour les brevetés membres de Rx&D ont baissé au cours des dernières années après avoir été en progression entre 1988 et le milieu des années 1990. C’est la huitième fois en autant d’années que le ratio des dépenses de R-D par rapport aux recettes tirées des ventes se situe sous la barre des 10 % et la sixième année où les brevetés membres de Rx&D n’ont pas atteint 10 %.
Le tableau 23 à l’annexe 4 présente les ratios des dépenses de R-D par rapport aux recettes tirées des ventes. Des 82 brevetés ayant soumis des rapports sur leurs dépenses de R-D au CEPMB en 2008, 62 ont présenté un ratio de R-D par rapport aux recettes tirées des ventes de moins de 10 %. Les recettes de ces derniers représentent 71 % de l’ensemble des recettes tirées des ventes en 2008.

DÉPENSES COURANTES DE R-D SELON LE TYPE DE RECHERCHE
Le tableau 19 et le graphique 22 ventilent les dépenses courantes de R-D43 engagées en 2008 selon le type de recherche, à savoir la recherche fondamentale, la recherche appliquée et autres types de recherche admissible.44 Pour 2008, les brevetés ont fait état de dépenses de recherche fondamentale totalisant 200,2 millions de dollars ou 15,9 % du total des dépenses courantes de R-D, soit une diminution de 22,7 % par rapport aux dépenses de 2007. Les brevetés ont déclaré des dépenses de recherche appliquée totalisant 723,2 millions de dollars ou, encore, 57,3 % des dépenses courantes de R-D. Les essais cliniques ont accaparé 74,6 % des dépenses de recherche appliquée.
TABLEAU 19 Dépenses courantes de R-D selon le type de recherche, 2008 et 2007
| Type de recherche |
2008 |
2007 |
Augmentation annuelle des dépenses (%) |
| $Millions |
% |
$Millions |
% |
| Recherche fondamentale |
200,2 |
15,9 |
259,0 |
20,3 |
-22,7 |
| Chimique |
126,4 |
10,0 |
122,6 |
9,6 |
3,1 |
| Biologique |
73,8 |
5,9 |
136,4 |
10,7 |
-45,9 |
| Recherche appliquée |
723,2 |
57,3 |
688,2 |
54,4 |
4,9 |
| Processus de fabrication |
90,5 |
7,2 |
92,1 |
7,3 |
-1,7 |
| Essais précliniques I |
30,7 |
2,4 |
12,4 |
1,0 |
147,6 |
| Essais précliniques II |
62,1 |
4,9 |
46,3 |
3,7 |
34,1 |
| Essais cliniques I |
53,1 |
4,2 |
62,0 |
4,9 |
-14,3 |
| Essais cliniques II |
125,0 |
9,9 |
121,6 |
9,6 |
2,7 |
| Essais cliniques III |
361,8 |
28,7 |
353,8 |
27,9 |
2,3 |
| Autre R-D admissible |
337,9 |
26,9 |
326,8 |
25,6 |
3,4 |
| Total |
1 261,3 |
100,0* |
1 274,0 |
100,0* |
-1,0 |
Source : CEPMB
* Le total de la colonne peut ne pas totaliser 100,0 du fait que certains chiffres ont été arrondis. |

DÉPENSES COURANTES DE R-D SELON LE MILIEU DE RECHERCHE ET LA PROVENANCE DES FONDS
Les brevetés peuvent inclure dans leurs dépenses de R-D la recherche qu’ils effectuent eux-mêmes à l’interne ainsi que la recherche qu’ils font faire à l’externe, notamment par des universités, des hôpitaux et d’autres sociétés pharmaceutiques. Le tableau 20 révèle que, en 2008, 49,2 % des dépenses de R-D ont été effectuées à l’interne. En 2007, cette proportion était de 53,3 %. La proportion de la R-D effectuée à l’externe pour le compte des brevetés a représenté 22,4 % de l’ensemble des dépenses courantes de R-D. Quant à la recherche effectuée par les universités et par les hôpitaux, sa valeur a représenté 12,9 % des dépenses courantes de R-D.
Le tableau 21 présente des renseignements sur la provenance des fonds que les brevetés ont investis pour financer leurs activités de R-D. En 2008, les brevetés ont financé à même leurs propres fonds la majeure partie de leur R-D (90,2 %). Les fonds provenant du gouvernement n’ont servi à financer que 2,8 % de l’ensemble des dépenses courantes de R-D.
TABLE 20 Current R&D Expenditures by R&D Performer, 2008 and 2007
| Milieu de recherche |
2008 |
2007 |
Variation annuelle des dépenses (%) |
| $Millions |
% |
$Millions |
% |
| À l’interne |
620,5 |
49,2 |
679,5 |
53,3 |
-8,9 |
| Brevetés |
620,5 |
49,2 |
679,5 |
53,3 |
-8,9 |
| À l’externe |
640,8 |
50,8 |
594,5 |
46,6 |
7,7 |
| Universités et hôpitaux |
162,1 |
12,9 |
177,1 |
14,0 |
-8,5 |
| Autres sociétés pharmaceutiques |
282,6 |
22,4 |
251,4 |
19,7 |
11,9 |
| Autres |
196,1 |
15,5 |
166,0 |
13,1 |
18,1 |
| Total |
1 261,3 |
100,0* |
1 274,0 |
100,0* |
-1,0 |
Source : CEPMB
* Le total de la colonne peut ne pas totaliser 100,0 du fait que certains chiffres ont été arrondis. |
TABLEAU 21 Dépenses de R-D selon la provenance des fonds, 2008 et 2007
| Provenance des fonds |
2008 |
2007 |
Variation annuelle des dépenses (%) |
| $Millions |
% |
$Millions |
% |
| Brevetés |
1 182,7 |
90,2 |
1 207,3 |
91,1 |
-2,1 |
| Gouvernements fédéral/provinciaux |
36,3 |
2,8 |
32,8 |
2,5 |
10,7 |
| Autres |
91,7 |
7,0 |
84,9 |
6,5 |
8,0 |
| Total |
1 310,7 |
100,0* |
1 325,0 |
100,0* |
-1,1 |
Source : CEPMB
* Le total de la colonne peut ne pas totaliser 100,0 du fait que certains chiffres ont été arrondis. |
DÉPENSES COURANTES DE R-D SELON LA RÉGION GÉOGRAPHIQUE
Le tableau 22, à la page 45, (ainsi que le tableau 25 que vous trouverez dans l’annexe 4) ventile les dépenses courantes de R-D selon la province dans laquelle elles ont été engagées. Cette année encore, les dépenses ont été surtout engagées en Ontario et au Québec qui ont accaparé 89,5 % de la valeur totale des dépenses courantes de R-D au Canada. La valeur des dépenses de R-D a baissé d’un taux annuel de 10,2 % dans l’Ouest du pays, mais elle a augmenté de 5,0 % en Ontario, ce qui est beaucoup plus que la moyenne nationale (-1,0 %).
TABLE 22 Current R&D Expenditures by Location, 2008 and 2007
| Région géographique |
2008 |
2007 |
Variation annuelle des dépenses (%) |
| $Millions |
% |
$Millions |
% |
| Provinces atlantiques |
21,3 |
1,7 |
20,5 |
1,6 |
4,0 |
| Québec |
532,5 |
42,2 |
561,7 |
44,1 |
-5,2 |
| Ontario |
596,1 |
47,3 |
567,8 |
44,6 |
5,0 |
| Provinces de l’Ouest |
111,2 |
8,8 |
124,0 |
9,7 |
-10,2 |
| Territoires |
0,2 |
0,0 |
0,0 |
0,0 |
– |
| Total |
1 261,3 |
100,0 |
1 274,0 |
100,0 |
-1,0 |
| Source : CEPMB |

LE CONTEXTE MONDIAL
Le graphique 23 compare pour les années 2000 et 2006 les ratios des dépenses de R-D par rapport aux recettes tirées des ventes du Canada aux mêmes ratios des sept pays de comparaison.45 Comme nous l’avons vu au graphique 23, le ratio du Canada était de 10,1 % en 2000. Cette année-là, seule l’Italie présentait un ratio plus bas (6,2%). La Suisse présentait le ratio d’investissements dans la R-D par rapport aux recettes tirées des ventes le plus élevé (102,5 %), suivie de la Suède (44,4 %). La France, l’Allemagne et les États-Unis ont affiché des ratios variant entre 16 et 18 % tandis que le Royaume-Uni présentait un ratio deux fois plus élevé (35,1 %). La même tendance a été observée pour 2006. L’Italie présentait alors le ratio le moins élevé (6,8 %), suivi du Canada (8,1 %). Les ratios de tous les autres pays de comparaison étaient cette année-là également largement supérieurs au ratio du Canada.
40 Les ventes déclarées dans la présente section couvrent les ventes des médicaments pour usage humain et des médicaments pour usage vétérinaire.
41Selon le Résumé de l’étude d’impact de la réglementation (RÉIA) du Règlement sur les médicaments brevetés, 1988 publié dans la Partie II de la Gazette du Canada, vol. 122, no 20 – SOR/DORS/88-474
42 Les ratios des dépenses de R-D par rapport aux recettes tirées des ventes présentés dans le tableau 18, à la page 41, tiennent compte des dépenses de recherche financées par des subventions du gouvernement. Si on exclut ces dernières dépenses, le ratio 2008 pour tous les brevetés est alors 7,8 % et celui pour les brevetés membres de Rx&D, 8,7 %.
43 Les dépenses courantes de R-D comprennent les dépenses autres qu’en capital directement associées à la recherche, dont (a) les salaires, (b) le matériel direct, (c) les honoraires des entrepreneurs et des sous-traitants, (d) d’autres coûts directs de production tels que les frais généraux, (e) les paiements aux institutions désignées, (f) les paiements aux organismes subventionnaires et (g) les paiements à d’autres organismes. Ces éléments sont décrits plus en détail dans le Formulaire 3 - Recettes et dépenses en recherche et développement, affiché dans notre site Web du CEPMB sous « Formulaires réglementaires ».
44 Les dépenses courantes de R-D représentent 96,5 % de l’ensemble des dépenses de R-D de 2008. Les coûts en immobilisations représentent 1,7 % des dépenses courantes de R-D et les frais d’amortissement admissibles, 1,8 %. La « recherche fondamentale » désigne les travaux qui contribuent à faire avancer la connaissance scientifique et qui sont entrepris sans aucune application scientifique en vue. La « recherche appliquée » désigne les travaux qui contribuent à faire avancer la connaissance scientifique et qui sont entrepris avec une application pratique en vue. Elle peut viser à créer de nouveaux produits ou procédés, à améliorer ceux qui existent à l’aide de procédés de fabrication ou, encore, d’études précliniques ou cliniques. Enfin, l’expression « Autres R-D admissibles » désigne les présentations sur la réglementation des médicaments, les études de biodisponibilité ainsi que les essais cliniques de phase IV.
45 Dans le graphique 23, les ventes sont celles effectuées exclusivement au pays. Elles ne comprennent pas les ventes à l’exportation.
SYSTÈME NATIONAL D’INFORMATION SUR L’UTILISATION DES MÉDICAMENTS PRESCRITS
Le Système national d’information sur l’utilisation des médicaments prescrits (SNIUMP) effectue des analyses critiques des tendances des prix des médicaments d’ordonnance, de l’utilisation faite de ces médicaments et des coûts en médicaments au Canada. Les résultats de ces analyses éclairent le processus de décision des régimes d’assurancemédicaments fédéraux, provinciaux et territoriaux participants (seul le régime du Québec ne participe pas au SNIUMP). Le CEPMB et l’Institut canadien d’information sur la santé (ICIS) travaillent en partenariat dans cette initiative.
Le mandat du SNIUMP comporte les deux volets suivants :
- élaboration d’une base de données sur les demandes de remboursement soumises aux différents régimes d’assurance-médicaments
- préparation de rapports présentant les conclusions des analyses effectuées à l’aide des renseignements de la base de données.
L’ICIS s’occupe du premier volet de ce mandat et le CEPMB, du second volet (le ministre de la Santé ayant confié cette responsabilité au CEPMB en vertu de l’article 90 de la Loi sur les brevets). Un comité directeur, constitué de représentants de Santé Canada et des différents régimes d’assurance-médicaments qui participent au SNIUMP conseille le CEPMB sur son programme de recherche et lui propose des sujets d’étude.
Au moment d’aller sous presse, plusieurs études au titre du SNIUMP étaient en cours dont les suivantes :
- utilisation de la dose thérapeutique quotidienne de l’Organisation mondiale de la Santé dans les analyses sur l’utilisation des médicaments d’ordonnance et dans les analyses des coûts
- incidence à long terme des changements démographiques sur les régimes publics d’assurance-médicaments
- deuxième livraison de L’Observateur des médicaments émergents
- rapport sommaire des tendances observées au niveau des produits pharmaceutiques.
Parmi les autres recherches actuellement sur la planche, citons les suivantes :
- analyse comparative des tendances récemment observées des honoraires des pharmaciens des régimes publics d’assurance-médicaments du Canada
- méthodologie de décomposition de la croissance des dépenses de programme dans le contexte des données relatives aux réclamations, et
- Lignes directrices relatives à la prévision des dépenses de programme.
Depuis avril 2008, les rapports sur les prix des médicaments non brevetés distribués sous ordonnance sont effectués au titre du SNIUMP. Deux rapports sur les tendances observées au niveau des médicaments génériques non brevetés au Canada devraient être finalisés au cours de l’été 2009 : Tendances des prix et comparaisons des prix dans d’autres pays ainsi que Structure du marché – Tendances et incidences.
Certaines études du SNIUMP nous informeront sur les grandes tendances observées au niveau des produits médicamenteux brevetés et non brevetés.
Tous les rapports publiés au titre du SNIUMP sont affichés dans le site Web du CEPMB.
COMMUNICATIONS
PROGRAMME DE COMMUNICATION
Le programme de communication s’occupe de la planification et de la gestion des communications du CEPMB avec les intervenants et le grand public. Il assure également la visibilité de l’organisation. Le programme cherche tout particulièrement à adapter le CEPMB aux nouvelles exigences de l’environnement dans lequel il évolue.
Sur le plan de l’élaboration et de la gestion des communications à l’externe, le programme s’occupe des relations avec les médias et rapporte les résultats des procédures quasi judiciaires du Conseil.
Le programme des communications s’est donné pour objectifs de maintenir des niveaux élevés de transparence et d’accessibilité et de favoriser l’engagement des intervenants.
PUBLICATIONS
À l’aide de ses différentes publications, le CEPMB tient ses intervenants bien informés. Certaines publications, dont le Rapport annuel et La Nouvelle, sont publiées à intervalles réguliers alors que d’autres sont publiées spécifiquement aux fins d’un programme ou pour les besoins de l’organisation.
Toutes les publications du CEPMB, y compris les décisions que rend le Conseil après une audience, sont affichées dans son site Web.
GLOSSAIRE
Le glossaire qui suit a été préparé dans le but de faciliter votre compréhension. Vous trouverez de plus amples explications et définitions dans les documents suivants : Loi sur les brevets, Règlement sur les médicaments brevetés, Compendium des politiques, des Lignes directrices, et des procédures et Règlement sur les aliments et drogues ou, encore, en communiquant directement avec le CEPMB.
ATC
Système de classification Anatomique, Thérapeutique, Chimique (ATC) conçu et tenu à jour par le Centre collaborateur de l’OMS pour la méthodologie sur l’établissement des statistiques concernant les produits médicamenteux de l’Organisation mondiale de la santé (OMS). Ce système distingue les médicaments selon leur site d’action et leurs caractéristiques thérapeutiques et chimiques. Le CEPMB utilise ce système pour sélectionner les médicaments qui seront utilisés dans les comparaisons des prix.
Avis de conformité
Avis donné par la Direction générale des produits de santé et des aliments de Santé Canada en vertu de l’article C.08.004 du Règlement sur les aliments et drogues. Cet avis confirme que le médicament respecte les normes prescrites par Santé Canada pour une administration à des humains ou à des animaux, selon le cas, et que sa vente est autorisée au Canada.
Brevet
Instrument émis par le Commissaire aux brevets sous forme de lettres patentes. Le brevet confère à son titulaire un monopole d’une durée limitée pour les allégations formulées. Le brevet confère également à son titulaire et à ses représentants légaux le droit exclusif de fabriquer, de construire, d’exploiter ou de vendre son invention.
Brevet en instance
Demande pour un brevet qui n’a pas encore été attribué.
Breveté
Aux termes du paragraphe 79(1) de la Loi sur les brevets, le mot « breveté » désigne « la personne ayant droit aux retombées d’un brevet pour une invention liée à un médicament, ainsi que quiconque était titulaire d’un brevet pour une telle invention ou qui exerce ou a exercé les droits d’un titulaire dans un cadre autre qu’une licence prorogée en vertu du paragraphe 11(1) de la Loi de 1992 modifiant la Loi sur les brevets ».
Certificat de décision préalable
Certificat révocable émis à la demande du breveté en vertu du paragraphe 98(4) de la Loi sur les brevets lorsque le Conseil estime que le prix pratiqué ou proposé du médicament ne dépasse pas le prix maximal non excessif qu’autorisent ses Lignes directrices.
Cession de brevet
Avis donné par le breveté au Commissaire aux brevets l’informant qu’il renonce irrévocablement à ses droits de propriété à l’égard du brevet en cause et qu’il les cède son brevet au domaine public.
Nota : Depuis le 30 janvier 1995, le Conseil ne reconnaît pas la cession d’un brevet lorsque le breveté utilise cette mesure pour se soustraire à sa compétence en matière d’examen du prix.
Défaut de présenter ses rapports
Défaut partiel ou complet d’un breveté de présenter les rapports qu’il est tenu de présenter au CEPMB en vertu de la Loi sur les brevets et du Règlement sur les médicaments brevetés.
Dépenses de recherche-développement
Aux termes du Règlement sur les médicaments brevetés, et plus particulièrement de ses articles 5 et 6, la recherche-développement s’entend des activités qui auraient été considérées admissibles au crédit d’impôt à l’investissement pour la recherche scientifique et le développement expérimental en vertu de la Loi de l’impôt sur le revenu dans sa version du 1er décembre 1987.
Dépenses courantes de recherche et développement
Désigne les dépenses autres qu’en capital directement liées à la recherche, dont : (a) salaires, (b) matériel direct, (c) entrepreneurs et sous-traitants, (d) coûts directement associés aux frais indirects de production, (e) paiements aux institutions désignées, (f) paiements aux organismes subventionnaires et (g) paiements aux autres organismes. Ces éléments sont décrits plus amplement dans le formulaire 3 présenté dans le Guide du breveté que vous trouverez dans notre site Web sous « Formulaires réglementaires ».
Drogue de recherche
Médicament dont l’utilisation a été autorisée par Santé Canada aux fins d’une évaluation clinique (à savoir des essais sur les humains), mais dont la vente pour l’indication sous examen n’a pas encore été autorisée.
Engagement de conformité volontaire
Engagement écrit pris par le breveté de baisser le prix de son médicament pour le rendre conforme aux Lignes directrices du CEPMB sur les prix excessifs. Le président du Conseil peut, en lieu d’un avis d’audience, approuver un engagement de conformité volontaire s’il sert les meilleurs intérêts du grand public. La politique du Conseil sur la conformité et l’application autorise le breveté à soumettre un engagement de conformité volontaire même si un avis d’audience a été émis. Toutefois, l’engagement soumis à ce point doit être approuvé par le panel d’audience et non seulement par le président du Conseil. Le Conseil publie tous les engagements approuvés par le président ou par un panel d’audience.
Indice des prix des médicaments brevetés (IPMB)
Indice établi par le CEPMB pour mesurer la variation annuelle des prix de transaction des médicaments brevetés vendus au Canada. Cet indice est établi à partir des données sur les prix et sur les ventes déclarées par les brevetés.
Licence volontaire
Engagement contractuel entre un breveté et un titulaire de licence permettant à ce dernier de bénéficier des retombées d’un brevet ou d’exercer des droits à l’égard de celui-ci moyennant une contrepartie financière (comme, par ex., redevances sous forme de pourcentage des recettes tirées des ventes).
Médicament
Toute substance ou tout mélange de substances produites biologiquement, chimiquement ou autrement qui est appliqué ou administré in vivo pour faciliter le diagnostic, le traitement, l’atténuation ou la prévention d’une maladie, de symptômes, de troubles ou d’états physiques anormaux ou, encore, pour modifier des fonctions organiques chez les humains ou chez les animaux. Cette définition comprend les vaccins, les préparations topiques, les anesthésiques et les produits diagnostics in vivo quel que soit le mode d’administration (par ex. préparations transdermiques, gélules, solutions injectables, solutions pour inhalation, etc.) Cette définition exclut les appareils médicaux, les produits diagnostiques in vitro et les désinfectants qui ne sont pas utilisés in vivo.
Numéro d’identification de drogue (DIN)
Numéro d’identification que la Direction générale de la protection de la santé de Santé Canada attribue à chaque médicament vendu sous ordonnance ou en vente libre et commercialisé en vertu du Règlement sur les aliments et drogues. Le DIN est assigné en tenant compte des éléments suivants : le fabricant du produit, le ou les ingrédients actifs, la concentration de ou des ingrédients actifs, la forme posologique, le nom de marque du produit et son mode d’administration.
Produit générique
Produit médicamenteux contenant le même ingrédient actif, la même concentration et la même forme posologique que son équivalent de marque.
Produit médicamenteux
Présentation d’un médicament qui se distingue par sa forme pharmaceutique et la concentration de son ingrédient actif.
Programme d’accès spécial
Programme en vertu duquel Santé Canada autorise la vente à des médecins de médicaments n’ayant pas encore reçu l’avis de conformité et qui ne seraient autrement pas disponibles sur le marché canadien.
Recherche et développement (R-D)
Recherche fondamentale ou appliquée visant à créer de nouveaux matériaux, dispositifs, produits ou procédés ou à améliorer ceux qui existent (par ex. procédés de fabrication).
Recherche et développement – recherche appliquée
Travaux qui sont entrepris avec une application pratique en vue. Ils peuvent viser à créer de nouveaux produits ou procédés, à améliorer ceux qui existent à l’aide de procédés de fabrication ou, encore, d’études précliniques et cliniques.
Recherche et développement – recherche fondamentale
Travaux qui contribuent à faire avancer la connaissance scientifique et qui sont entrepris sans aucune application pratique en vue.
Recherche et développement – autres R-D admissibles
Comprend les dépenses de recherche-développement qui ne correspondent à aucune des catégories de R-D susmentionnées. Elle comprend les présentations sur la réglementation des médicaments, les études de biodisponibilité ainsi que les essais cliniques de Phase IV.
Substance active
Substance chimique ou biologique responsable de l’effet pharmacologique d’un produit médicamenteux.
ANNEXE 1
CRITÈRES JUSTIFIANT LA TENUE D’UNE ENQUÊTE
Un prix est considéré conforme aux Lignes directrices dans la mesure où aucun critère ne justifie une enquête. Les critères correspondent aux normes qu’applique le Conseil pour utiliser de la façon la plus efficiente possible les ressources dont il dispose pour les enquêtes. L’existence de ces critères ne sous-tend pas que le Conseil tolère les écarts à ses Lignes directrices. Le Conseil estime que ses critères permettent de reconnaître et de soumettre à une enquête tous les cas importants de prix non conformes à ses Lignes directrices. Le Conseil s’attend à ce que les prix de tous les médicaments brevetés soient conformes à ses Lignes directrices et tout élément de preuve démontrant que le prix d’un médicament se maintient au-delà de ce que permettent ses Lignes directrices, ne serait-ce que d’une petite fraction, peut justifier la tenue d’une enquête.
Le personnel du Conseil engagera une enquête sur le prix d’un produit médicamenteux lorsqu’il a observé une des situations suivantes :
NOUVEAUX PRODUITS MÉDICAMENTEUX
- le prix de lancement dépasse d’au moins 5 % le prix maximal jugé non excessif
- les recettes excessives tirées de la vente du médicament à un prix excessif au cours de la période de lancement totalisent 25 000 $ ou plus
- la réception de plaintes fondées.
PRODUITS MÉDICAMENTEUX EXISTANTS
- le prix dépasse d’au moins 5 % le prix maximal jugé non excessif et les recettes excessives tirées de la vente du médicament à un prix excessif au cours de toute la durée du brevet à compter du 1er janvier 1992 sont égales ou supérieures à 25 000 $
- les recettes excessives encaissées tout au cours de la durée du brevet à compter du 1er janvier 1992 sont égales ou supérieures à 50 000 $
- la réception de plaintes fondées.
Le Compendium des politiques, des Lignes directrices et des procédures fournit de plus amples renseignements sur les critères qui justifient la tenue d’une enquête. Le Compendium est affiché dans le site Web du CEPMB sous la rubrique « Loi, Règlement et Lignes directrices ».
ANNEXE 2
PRODUITS MÉDICAMENTEUX BREVETÉS LANCÉS SUR LE MARCHÉ CANADIEN EN 2008
| Nom de marque |
Breveté |
DIN |
NSA1/PBA2 |
ATC3 |
Statut |
Catégorie |
Advagraf - 0,5 mg/gélule
|
Astellas Pharma Canada Inc. |
02296462 |
|
L |
Conforme aux Lignes directrices |
1 |
| Advagraf - 1 mg/capsule |
Astellas Pharma Canada Inc. |
02296470 |
|
L |
Conforme aux Lignes directrices |
1 |
| Advagraf - 5 mg/capsule |
Astellas Pharma Canada Inc. |
02296489 |
|
L |
Conforme aux Lignes directrices |
1 |
| Advate 2000 |
Baxter Corporation |
02313111 |
|
B |
Sous enquête |
1 |
| Advicor 1000/40 - 1040 mg/comprimé |
Sepracor Pharmaceuticals Inc. |
02293501 |
|
C |
Conforme aux Lignes directrices |
1 |
| Angeliq 1/1 - 2 mg/comprimé |
Bayer Inc. |
02268825 |
|
G |
Conforme aux Lignes directrices |
3 |
| Arestin - 1 mg/cartouche |
Johnson & Johnson Inc. |
02278219 |
|
A |
Sous examen |
3 |
| Atacand - 32 mg/comprimé |
AstraZeneca Canada Inc. |
02311658 |
|
C |
Conforme aux Lignes directrices |
1 |
| Avamys - 27,5 mcg/dose |
GlaxoSmithKline Inc. |
02298589 |
PBA |
R |
Conforme aux Lignes directrices |
3 |
| Benefix - 2000 unité/fiole |
Wyeth Pharmaceuticals |
02293803 |
|
B |
Sous enquête |
1 |
| Benefix - 500 unité/fiole |
Wyeth Pharmaceuticals |
02293773 |
|
B |
Sous enquête |
1 |
| Biphentin - 10 mg/gélule |
Purdue Pharma |
02277166 |
PBA |
N |
Conforme aux Lignes directrices |
1 |
| Biphentin - 15 mg/gélule |
Purdue Pharma |
02277131 |
PBA |
N |
Conforme aux Lignes directrices |
1 |
| Biphentin - 20 mg/gélule |
Purdue Pharma |
02277158 |
PBA |
N |
Conforme aux Lignes directrices |
1 |
| Biphentin - 30 mg/gélule |
Purdue Pharma |
02277174 |
PBA |
N |
Conforme aux Lignes directrices |
1 |
| Biphentin - 40 mg/gélule |
Purdue Pharma |
02277182 |
PBA |
N |
Conforme aux Lignes directrices |
1 |
| Biphentin - 50 mg/gélule |
Purdue Pharma |
02277190 |
PBA |
N |
Conforme aux Lignes directrices |
1 |
| Biphentin - 60 mg/gélule |
Purdue Pharma |
02277204 |
PBA |
N |
Conforme aux Lignes directrices |
1 |
| Biphentin - 80 mg/gélule |
Purdue Pharma |
02277212 |
PBA |
N |
Conforme aux Lignes directrices |
1 |
| Brevibloc Pre-Mix - 10 mg/ml |
Baxter Corporation |
02309238 |
PBA |
C |
Conforme aux Lignes directrices |
1 |
| Catena - 150 mg/comprimé |
Santhera Pharmaceuticals (Canada) Inc. |
02314150 |
NSA |
N |
Conforme aux Lignes directrices |
3 |
| Cialis - 2.5 mg/comprimé |
Eli Lilly Canada Inc. |
02296888 |
|
G |
Conforme aux Lignes directrices |
1 |
| Cialis - 5 mg/comprimé |
Eli Lilly Canada Inc. |
02296896 |
|
G |
Conforme aux Lignes directrices |
1 |
| Climara Pro - 5.79 mg/timbre |
Bayer Inc. |
02250616 |
|
G |
Conforme aux Lignes directrices |
3 |
| Cymbalta - 30 mg/gélule |
Eli Lilly Canada Inc. |
02301482 |
NSA |
N |
Conforme aux Lignes directrices |
3 |
| Cymbalta - 60 mg/gélule |
Eli Lilly Canada Inc. |
02301490 |
NSA |
N |
Conforme aux Lignes directrices |
3 |
| Diovan-HCT 320/12.5 - 332.5 mg/comprimé |
Novartis Pharma Canada Inc. |
02308908 |
|
C |
Conforme aux Lignes directrices |
1 |
| Diovan-HCT 320/25 - 345 mg/comprimé |
Novartis Pharma Canada Inc. |
02308916 |
|
C |
Conforme aux Lignes directrices |
1 |
| Eraxis - 100 mg/fiole |
Pfizer Canada Inc. |
02302160 |
NSA |
J |
Conforme aux Lignes directrices |
3 |
| Exelon 10 - 18 mg/timbre |
Novartis Pharma Canada Inc. |
02302853 |
|
N |
Conforme aux Lignes directrices |
3 |
| Exelon 5 - 9 mg/timbre |
Novartis Pharma Canada Inc. |
02302845 |
|
N |
Conforme aux Lignes directrices |
3 |
| Fosavance 70/5600 IU - 70 mg/comprimé |
Merck Frosst Canada Ltd. |
02314940 |
|
M |
Sous enquête |
1 |
| Frova - 2.5 mg/comprimé |
Teva Neuroscience |
02257084 |
NSA |
N |
Conforme aux Lignes directrices |
3 |
| Fucidin - 250 mg/comprimé |
LEO Pharma Inc. |
01934252 |
PBA |
J |
Conforme aux Lignes directrices |
1 |
| Glumetza - 1000 mg/comprimé |
Biovail Pharmaceuticals Canada |
02300451 |
|
A |
Sous enquête |
1 |
| Intelence - 100 mg/comprimé |
Janssen-Ortho Inc. |
02306778 |
NSA/PBA |
J |
Conforme aux Lignes directrices |
3 |
| Januvia - 100 mg/comprimé |
Merck Frosst Canada Ltd. |
02303922 |
NSA |
A |
Conforme aux Lignes directrices |
3 |
| Kaletra 100/25 - 125 mg/comprimé |
Abbott Laboratories Ltd. |
02312301 |
|
J |
Conforme aux Lignes directrices |
1 |
| Kogenate FS Bioset 2000 |
Bayer Inc. |
02302225 |
|
B |
Sous enquête |
1 |
| Lantus Solostar - 100 unité/ml |
sanofi-aventis Canada Inc. |
02294338 |
|
A |
Sous enquête |
1 |
| Lucentis - 3 mg/fiole |
Novartis Pharma Canada Inc. |
02296810 |
NSA/PBA |
S |
Conforme aux Lignes directrices |
2 |
| Myozyme - 50 mg/fiole |
Genzyme Canada Inc. |
02284863 |
NSA/PBA |
A |
Conforme aux Lignes directrices |
2 |
| Natrecor - 1,5 mg/fiole |
Janssen-Ortho Inc. |
02301393 |
NSA |
C |
Conforme aux Lignes directrices |
3 |
| Nevanac - 1 mg/ml |
Alcon Canada Inc. |
02308983 |
NSA |
S |
Sous examen |
|
| Nexium - 10 mg/sachet |
AstraZeneca Canada Inc. |
02300524 |
|
A |
Conforme aux Lignes directrices |
1 |
| Nimotuzumab - 50 mg/fiole |
YM Biosciences Inc. |
|
NSA |
|
Sous examen |
|
| Omnaris - 50 mcg/dose |
Nycomed Canada Inc. |
02303671 |
|
R |
Conforme aux Lignes directrices |
1 |
| Pradax - 110 mg/gélule |
Boehringer Ingelheim (Canada) Ltd. |
02312441 |
NSA |
B |
Conforme aux Lignes directrices |
3 |
| Pradax - 75 mg/gélule |
Boehringer Ingelheim (Canada) Ltd. |
02312433 |
NSA |
B |
Conforme aux Lignes directrices |
3 |
| PregVit |
Duchesnay Inc. |
02246067 |
PBA |
B |
Sous enquête |
3 |
| PregVit Folic 5 |
Duchesnay Inc. |
02276194 |
PBA |
B |
Sous enquête |
1 |
| Priorix Tetra |
GlaxoSmithKline Inc. |
02297884 |
|
J |
Conforme aux Lignes directrices |
3 |
| Relistor - 20 mg/ml |
Wyeth Pharmaceuticals |
02308215 |
NSA |
A |
Conforme aux Lignes directrices |
2 |
| Revlimid - 10 mg/gélule |
Celgene |
02304902 |
NSA |
L |
Conforme aux Lignes directrices |
2 |
| Revlimid - 15 mg/gélule |
Celgene |
02317699 |
|
L |
Conforme aux Lignes directrices |
1 |
| Revlimid - 25 mg/gélule |
Celgene |
02317710 |
|
L |
Conforme aux Lignes directrices |
1 |
| Revlimid - 5 mg/gélule |
Celgene |
02304899 |
NSA |
L |
Conforme aux Lignes directrices |
2 |
| Risperdal Consta - 12,5 mg/fiole |
Janssen-Ortho Inc. |
02298465 |
|
N |
Conforme aux Lignes directrices |
1 |
| Seasonale ,15/,03 |
Procter & Gamble Pharmaceuticals Canada Inc. |
02296659 |
PBA |
G |
Sous examen |
1 |
| Stalevo 100/25/200 - 325 mg/comprimé |
Novartis Pharma Canada Inc. |
02305941 |
|
N |
Conforme aux Lignes directrices |
3 |
| Stalevo 150/37,5/200 - 387,5 mg/comprimé |
Novartis Pharma Canada Inc. |
02305968 |
|
N |
Conforme aux Lignes directrices |
3 |
| Stalevo 50/12,5/200 - 262,5 mg/comprimé |
Novartis Pharma Canada Inc. |
02305933 |
|
N |
Conforme aux Lignes directrices |
3 |
| Tears Naturale Forte - 4 mg/ml |
Alcon Canada Inc. |
02246397 |
PBA |
S |
Conforme aux Lignes directrices |
3 |
| Torisel - 25 mg/fiole |
Wyeth Pharmaceuticals |
02304104 |
NSA |
L |
Conforme aux Lignes directrices |
3 |
| Travatan Z - 0,04 mg/ml |
Alcon Canada Inc. |
02318008 |
|
S |
Conforme aux Lignes directrices |
1 |
| Tridural - 100 mg/comprimé |
Paladin Labs Inc. |
02296381 |
PBA |
N |
Sous enquête |
1 |
| Tridural - 200 mg/comprimé |
Paladin Labs Inc. |
02296403 |
PBA |
N |
Sous enquête |
1 |
| Tridural - 300 mg/comprimé |
Paladin Labs Inc. |
02296411 |
PBA |
N |
Sous enquête |
1 |
| Valcyte - 50 mg/ml |
Hoffmann-La Roche Ltd. |
02306085 |
|
J |
Conforme aux Lignes directrices |
3 |
| Vfend - 40 mg/ml |
Pfizer Canada Inc. |
02279991 |
|
J |
Conforme aux Lignes directrices |
3 |
| Volibris - 10 mg/comprimé |
GlaxoSmithKline Inc. |
02307073 |
NSA |
C |
Conforme aux Lignes directrices |
3 |
| Volibris - 5 mg/comprimé |
GlaxoSmithKline Inc. |
02307065 |
NSA |
C |
Conforme aux Lignes directrices |
3 |
| Xarelto - 10 mg/comprimé |
Bayer Inc. |
02316986 |
NSA |
B |
Sous enquête |
3 |
| Zeldox - 20 mg/gélule |
Pfizer Canada Inc. |
02298597 |
NSA |
N |
Conforme aux Lignes directrices |
3 |
| Zeldox - 40 mg/gélule |
Pfizer Canada Inc. |
02298600 |
NSA |
N |
Conforme aux Lignes directrices |
3 |
| Zeldox - 60 mg/gélule |
Pfizer Canada Inc. |
02298619 |
NSA |
N |
Conforme aux Lignes directrices |
3 |
| Zeldox - 80 mg/gélule |
Pfizer Canada Inc. |
02298627 |
NSA |
N |
Conforme aux Lignes directrices |
3 |
| Zevalin - 1,6 mg/ml |
Bayer Inc. |
|
NSA/PBA |
V |
Sous enquête |
3 |
|
1. NSA : Nouvelle substance active
2. PBA : Premier brevet attribué
3. ATC : Classification anatomique thérapeutique chimique
Source : CEPMB
|
ANNEXE 3
APERÇU DES ENGAGEMENTS DE CONFORMITÉ VOLONTAIRE ET DES ORDONNANCES DU CONSEIL –
TOTAL DES REVENUS EXCESSIFS
Date
d’approbation |
|
Breveté |
Revenus
excessifs |
Remboursement des revenus excessifs – paiements au gouvernement du Canada |
| 24 avril 2009 |
Concerta |
Janssen-Ortho Inc. |
$1,464,441.58 |
$1,464,441.58 |
| 23 avril 2009 |
Eligard |
sanofi-aventis Canada Inc. |
$13,127,953.14 |
$13,127,953.14 |
|
|
|
$14,592,394.72 |
$14,592,394.72 |
|
|
|
|
|
| 4 mars 2009 |
Suprax |
sanofi-aventis Canada Inc. |
$97,900.30 |
$97,900.30 |
| 23 février 2009 |
Vepesid |
Bristol-Myers Squibb Canada Co. |
$53,161.48 |
Customers |
| 19 février 2009 |
Strattera |
Eli Lilly Canada Inc. |
$15,326,066.49 |
$15,326,066.49 |
| 29 septembre 2008 |
Adderall XR - ORDER |
Shire Canada Inc. |
$5,622,863.63 |
$5,622,863.63 |
| 25 juin 2008 |
AndroGel |
Solvay Pharma Inc. |
$3,327,180.61 |
$3,327,180.61 |
|
|
|
$399,206.25 |
$399,206.25 |
|
|
|
$16,573.84 |
$16,573.84 |
| 11 juin 2008 |
Copaxone - ORDER |
Teva Neauroscience |
$2,417,223.29 |
$2,417,223.29 |
| 20 ma, 2008 |
Denavir |
Barrier Therapeutics Canada Inc. |
$61,021.80 |
$61,021.80 |
|
|
|
$27,321,197.69 |
$27,268,036.21 |
|
|
|
|
|
| 4 mars 2008 |
Lantus |
sanofi-aventis Canada Inc. |
$694,239.50 |
$694,239.50 |
| 28 février 2008 |
Vaniqa |
Barrier Therapeutics Canada Inc. |
$70,860.59 |
$70,860.59 |
| 20 décembre 2007 |
Dovobet |
LEO Pharma Inc. |
$870,425.68 |
$870,425.68 |
| 26 septembre 2007 |
Zemplar |
Abbott Laboratories Ltd. |
$58,741.67 |
Hospitals |
| 18 septembre, 2007 |
Dovobet - ORDER |
LEO Pharma Inc. |
$3,736,398.71 |
$3,736,398.71 |
| 13 septembre 2007 |
OctreoScan |
Bristol-Myers Squibb Canada Co. |
$387,181.87 |
$7,439.82 |
| (and payments to customers) |
| 28 juin 2007 |
Forteo |
Eli Lilly Canada Inc. |
$333,629.25 |
Prices lower than MNE |
| 4 juin 2007 |
Risperdal Consta |
Janssen-Ortho Inc. |
$4,386,172.99 |
$4,386,172.99 |
|
|
|
$322,927.12 |
$322,927.12 |
| 14 mai 2007 |
Airomir |
3M Canada Company |
$485,498.58 |
$485,498.58 |
|
|
|
$11,346,075.96 |
$10,573,962.99 |
| 14 juillet 2006 |
Eloxatin |
sanofi-aventis Canada Inc. |
$1,767,078.84 |
Hospitals and Cancer Clinics |
| 14 juillet 2006 |
Hextend |
Hospira Healthcare Corporation (Canada) |
$8,823.60 |
$8,823.60 |
| 20 juin 2006 |
NuvaRing |
Organon Canada Ltd. |
$115,584.93 |
$115,584.93 |
| 8 avril 2006 |
Dukoral ™ |
sanofi pasteur Limitée |
$74,073.32 |
$74,073.32 |
|
|
|
$1,965,560.69 |
$198,481.85 |
|
|
|
|
|
| 15 décembre 2005 |
Risperdal |
Janssen-Ortho Inc. |
$669,426.81 |
$669,426.81 |
| 15 décembre 2005 |
Dukoral ™ |
sanofi pasteur Limitée |
$481,198.49 |
$481,198.49 |
| 9 septembre 2005 |
Ortho 7/7/7 |
Janssen-Ortho Inc. |
$99,892.72 |
$99,892.72 |
| 25 juillet 2005 |
Starlix |
Novartis Pharma |
$174,306.29 |
$174,306.29 |
| 14 juillet 2005 |
Ceretec |
Amersham Health Inc. |
$278,112.65 |
By price reduction |
|
|
|
$1,702,936.96 |
$1,424,824.31 |
|
|
|
|
|
| 7 mai 2005 |
Tamiflu |
Hoffmann-La Roche Limitée |
$442,973.47 |
$442,973.47 |
| 7 mai 2005 |
Paxil CR |
GlaxoSmithKline Inc. |
$310,403.64 |
$310,403.64 |
| 17 février 2005 |
Evra |
Janssen-Ortho Inc. |
$3,000,000 |
$1,359,263.67 |
| 16 novembre 2004 |
Busulfex |
ESP Pharma |
$144,215.55 |
$144,215.55 |
| 15 juillet 2004 |
Starnoc |
Servier Canada Inc. |
$739,739.99 |
$739,739.99 |
| 9 juillet 2004 |
Prolastin |
Bayer Inc. |
|
By price reduction |
| 25 juin 2004 |
Fasturtec |
Sanofi-Synthelabo Canada Inc. |
|
By price reduction |
| 6 mai 2004 |
One-Alpha |
LEO Pharma Inc. |
$23,049.10 |
$23,049.10 |
|
|
|
$4,660,381.75 |
$3,019,645.42 |
|
|
|
|
|
| 21 octobre 2003 |
Dostinex |
Pfizer Canada Inc. |
$42,116.31 |
$42,116.31 |
| 26 avril 2003 |
Aromasin |
Pharmacia Canada Inc. |
$87,484.65 |
By price reduction |
| 31 mars 2003 |
Remicade |
Schering Canada Inc. |
$7,792,650.89 |
$7,792,650.89 |
| 16 septembre 2002 |
Differin Pledget |
Galderma Canada Inc. |
$17,575.12 |
$17,575.12 |
| 15 octobre 2001 |
Zanaflex |
Draxis Health Inc. |
$62,559 |
$62,559 |
| 30 juin 2000 |
Plavix |
Bristol-Myers Squibb/Sanofi |
$583,065 |
$583,065 |
| 11 août 1999 |
Anaprox |
Hoffmann-La Roche Limited |
$67,252.55 |
$67,252.55 |
| 29 avril 1998 |
Humalog |
Eli Lilly Canada Inc. |
$666,824 |
$666,824 |
| 26 juille, 1996 |
Virazole - ORDER |
ICN Canada Ltd. |
$3,460,014 |
$1,200,000 |
| 5 mars 1996 |
Prostep |
Boehringer Ingelheim (Canada) Ltd. |
$14,959 |
$14,959 |
| 10 octobre 1995 |
Betaseron |
Berlex Canada Inc. |
$27,415 |
By price reduction |
| 23 mai 1995 |
Hepatate II |
Amersham Canada Limited |
$16,286 |
By price reduction |
| 20 avril 1995 |
Beclomethasone |
Kenral Inc. |
$72,054 |
$72,054 |
| 28 novembre 1994 |
Ortho 7/7/7 (21 & 28) pack |
Ortho-McNeil Inc. |
$487,091 |
$444,571 |
| 14 novembre 1994 |
Minocin (50 & 100) mg |
Cyanamid Canada Inc. Lederle Laboratories |
$84,813 |
$84,813 |
| 18 octobre 1994 |
Habitrol (7, 14, 21) mg |
Ciba-Geigy Canada Inc. |
$3,600,000 |
$2,950,000 |
| 26 septembre 1994 |
Ponderal (60 mg) |
Servier Canada Inc. |
$144,894 |
$144,894 |
| 20 décembre 1993 |
Lopid/Gemfibrozil (300mg & 600 mg) |
Parke-Davis |
$1,635,970 |
$1,635,970 |
| 22 novembre 1993 |
Megace (40 & 160) mg) |
Bristol-Myers Squibb Pharmaceutical Group |
$993,157 |
$993,157 |
| 2 novembre, 1993 |
Hytrin (10 mg) |
Abbott Laboratories Limited |
$24,510 |
$24,510 |
| 28 septembre 1993 |
Metrogel (7.5 mg/g) |
Cyanamid Canada Inc. Lederle Laboratories |
$406,642 |
$406,642 |
| 10 juin 1993 |
Imovane (7.5 mg) |
Rhône Poulenc Rorer Canada Inc. |
$1,663,393 |
$1,663,393 |
| 2 juin 1993 |
Activase (vials) |
Genentech Canada Inc. |
$1,755,000 |
$1,755,000 |
|
|
|
$23,705,725.52 |
$20,622,005.87 |
|
|
|
|
|
| Total – engagements et ordonnances |
$85,294,273.29 |
$77,699,351.37 |
ANNEXE 4
RECHERCHE-DÉVELOPPEMENT
TABLEAU 23 Ratio des dépenses de R-D par rapport aux recettes tirées des ventes,
selon le nombre de brevetés ayant soumis des rapports et la valeur des recettes tirées des ventes
| Ratio |
2008 |
2007 |
|
Nbre de brevetés ayant
soumis un rapport |
Recettes tirées des ventes |
Nbre de brevetés ayant soumis un rapport |
Recettes tirées des ventes |
| $Millions |
% des ventes |
$Millions |
% des ventes |
| 0% |
25 |
737.7 |
4.5 |
26 |
510.7 |
3.2 |
| ¡Ü10% |
37 |
10,803.3 |
66.2 |
43 |
11,651.2 |
72.8 |
| > 10% |
20 |
4,775.7 |
29.3 |
13 |
3,829.1 |
24.0 |
| Total |
82 |
16,316.7 |
100.0 |
82 |
15,991.0 |
100.0 |
| Source : CEPMB |
Insert Graphique 24
TABLE 24 Ratios of R&D Expenditures to Sales Revenue by Reporting Patentee1 2008 and 2007
| Company |
R&D-to-Sales Ratio (%) |
| 2008 |
2007 |
| Abbott, Les Laboratoires Limitée 2 |
4.9 |
3.3 |
| Abraxis BioSciences Canada Inc. 5 |
17.6 |
3.2 |
| Actelion Pharmaceutiques Canada Inc. 2 |
7.8 |
5.1 |
| Alcon Canada Inc. |
0.3 |
0.3 |
| Allergan Inc. |
6.6 |
6.8 |
| Amersham Health Inc (GE Healthcare Inc,) |
0.0 |
0.0 |
| Amgen Canada Inc. 2, 5 |
6.1 |
8.4 |
| Astellas Pharma Canada Inc. 2, 5, 9 |
10.4 |
7.7 |
| AstraZeneca Canada Inc. 2,5 |
6.7 |
7.3 |
| Axcan Pharma Inc. 2 |
27.7 |
24.8 |
| Baxter Corporation 5 |
0.2 |
0.2 |
| Bayer Inc., Healthcare Division 2, 5 |
3.2 |
3.7 |
| Biogen Idec Canada Inc. 2, 5 |
1.6 |
2.5 |
| Biovail Pharmaceuticals Canada, Division of Biovail Corporation 5 |
23.5 |
59.5 |
| Boehringer Ingelheim (Canada) Ltd. 2 |
22.0 |
24.6 |
| Bracco Diagnostics Canada Inc. |
0.0 |
0.0 |
| Bristol-Myers Squibb Pharmaceutical Group 2, 5 |
13.3 |
9.9 |
| Duchesnay Inc. |
12.3 |
4.6 |
| Eli Lilly Canada Inc. (includes Provel Animal Health Division) 2, 5 |
11.4 |
7.5 |
| EMD Serono Canada Inc. 2, 5 |
2.9 |
2.6 |
| Enzon Pharmaceuticals Inc. |
0.0 |
0.0 |
| Ferring Inc. |
2.9 |
1.2 |
| Fournier Pharma Inc. 2, 4 |
0.0 |
0.0 |
| Fresenius Kabi Canada |
0.7 |
0.0 |
| Fresenius Medical Care Canada 6 |
0.0 |
¨C |
| Galderma Canada Inc. |
1.1 |
0.0 |
| Genzyme Canada Inc. 5 |
1.3 |
3.4 |
| Gilead Sciences Inc. 5 |
45.8 |
54.2 |
| GlaxoSmithKline 2, 5 |
11.3 |
13.1 |
| GlaxoSmithKline Consumer Healthcare Inc. |
0.0 |
0.0 |
| Graceway Pharmaceuticals |
0.0 |
0.0 |
| Hoffmann-La Roche Limited 2, 5 |
3.8 |
4.7 |
| Hospira Healthcare Corp. |
0.0 |
0.008 |
| INO Therapeutics Inc. |
2.1 |
2.4 |
| Iroko International LP |
0.0 |
0.0 |
| Janssen-Ortho Inc. 2, 5 |
8.7 |
8.4 |
| Johnson & Johnson Merck, Consumer Pharmaceuticals of Canada |
0.0 |
0.0 |
| Lantheus MI Canada Inc. 6 |
0.0 |
¨C |
| LEO Pharma Inc. 2 |
3.7 |
1.7 |
| Les Laboratories Inc. 7 |
0.0 |
0.0 |
| Lundbeck Canada Inc. 2 |
3.9 |
3.5 |
| McNeil Consumer Healthcare |
2.9 |
3.1 |
| Merck Frosst Canada Ltd. 2, 5 |
14.8 |
17.4 |
| Merck Frosst ¨C Schering Pharma 2 |
0.7 |
0.7 |
| Novartis Consumer Health Canada Inc. |
0.0 |
0.0 |
| Novartis Pharma Canada Inc. 2, 5 |
16.7 |
14.6 |
| Novo Nordisk Canada Inc. 5 |
3.1 |
3.9 |
| Nycomed Canada Inc. 2, 3, 5 |
0.7 |
2.2 |
| Organon Canada Ltd. 2 |
2.4 |
2.4 |
| Ortho Dermatological, Division of Johnson & Johnson Inc. |
0.0 |
0.0 |
| Otsuka America Pharmaceuticals 6 |
0.0 |
¨C |
| Ovation Pharmaceuticals Inc. |
0.0 |
0.0 |
| Paladin Labs Inc. 2 |
0.2 |
0.2 |
| Pfizer Canada Inc. Animal Health Group |
0.3 |
0.3 |
| Pfizer Canada Inc. 2, 5 |
4.9 |
5.1 |
| Pharmaceutical Partners of Canada Inc. |
0.0 |
0.0 |
| Pharmascience Inc. |
8.5 |
8.3 |
| Procter & Gamble Pharmaceuticals Canada, Inc. 2, 5 |
0.6 |
0.7 |
| Purdue Pharma 2 |
1.7 |
1.8 |
| Rare Disease Therapeutics Inc. |
0.0 |
0.0 |
| RGR Pharma Ltd. |
0.0 |
0.0 |
| Sandoz Canada Inc. 6 |
0.0 |
¨C |
| sanofi pasteur Limited 2, 5, 10 |
53.9 |
46.3 |
| sanofi-aventis Pharma Inc. 2, 11 |
14.2 |
12.7 |
| Santhera Pharmaceuticals Canada Inc. 5, 6 |
111.9 |
¨C |
| Schering-Plough Canada Inc. 2, 5 |
3.5 |
3.8 |
| Sepracor Pharmaceuticals Inc. 12 |
0.0 |
0.0 |
| Servier Canada Inc. 2 |
10.9 |
14.6 |
| Shire Canada Inc. 2, 5 |
0.0 |
0.0 |
| Shire Human Genetic Therapies 5 |
3.8 |
|
| Solvay Pharma Inc. 2, 5 |
14.6 |
5.5 |
| Sopherion Therapeutics Canada Inc. |
0.0 |
617.8 |
| Squire Pharma 2, 13 |
0.4 |
0.08 |
| Stiefel Canada Inc. |
0.7 |
0.2 |
| Talecris Biotherapeutics Inc. 5 |
0.9 |
2.3 |
| Teva Neuroscience 5 |
4.8 |
6.3 |
| Tyco Healthcare Group Canada Inc. |
0.0 |
0.0 |
| UCB Pharma Canada Inc. 5, 6 |
55.6 |
¨C |
| Unither Biotech Inc. |
0.0 |
0.0 |
| Valeant Canada Ltd. 8 |
1.8 |
2.2 |
| Wyeth Pharmaceuticals 2, 5 |
24.1 |
18.8 |
| YM Biosciences Inc. 5, 6 |
12658.8 |
¨C |
|
Source : CEPMB
1. Les recettes tirées des redevances sont comprises dans le ratio de chaque société, mais pour éviter la double comptabilisation elles sont soustraites lorsqu¡¯il ya lieu du total pour l¡¯ensemble du secteur. Les subventions des gouvernements fédéral et provinciaux ne sont pas comptabilisées dans les dépenses utilisées pour le calcul des ratios des dépenses de R-D de chaque société, mais elles le sont dans les statistiques pour l¡¯ensemble des brevetés. La liste des brevetés ayant soumis un rapport sur les prix n¡¯est pas identique à celle des brevetés ayant soumis un rapport sur leurs activités de R-D en raison des différences des modalités de rapport entre les brevetés et leurs sociétés affiliées ou les détenteurs d¡¯une licence d¡¯exploitation ainsi que du fait que les titulaires d¡¯un brevet pour un médicament vétérinaire sont tenus de présenter chaque année un rapport sur leurs dépenses de R-D, mais pas nécessairement sur les prix qu¡¯ils pratiquent et la valeur de leurs ventes.
2. Membre de Rx&D
3. Auparavant appelé Altana Pharma Inc. (et avant BYK Canada Inc.)
4. Fusionné avec Solvay Pharma Inc.
5. Membre de BIOTECanada
6. N¡¯était pas un breveté en 2008
7. Le titulaire du brevet est Les Laboratories Inc., mais BLES Biochemicals est l¡¯exploitant du brevet et le fabricant du médicament.
8. Auparavant appelé ICN Canada Ltd.
9. Auparavant appelé Fujisawa Canada Inc.
10. Auparavant appelé Aventis Pasteur Limited
11. Auparavant appelé Aventis Pharma Inc.
12. Auparavant, Oryx Pharmaceuticals Inc.
13. Division de Paladin Labs Inc.
|
TABLEAU 25 Dépenses courantes de R-D selon la province et le milieu de recherche, 2008
| Province |
|
Brevetés |
Autres sociétés |
Universités |
Milieu de recherche Hôpitaux |
Autres |
Total |
Rx&D |
Pourcentage des dépenses |
| Terre-Neuve |
$(000) |
531.35 |
1,660.65 |
514.19 |
538.95 |
1,688.88 |
4,864.81 |
4,934.02 |
0.391 |
|
% |
10.76 |
33.65 |
10.42 |
10.92 |
34.22 |
100.00 |
0.428 |
|
| Île-du-Prince-Édouard |
$(000) |
1.78 |
293.98 |
11.69 |
68.73 |
484.80 |
108.62 |
484.80 |
0.038 |
|
% |
0.36 |
60.64 |
2.41 |
14.17 |
22.40 |
100.00 |
0.043 |
|
| Nouvelle-Écosse |
$(000) |
1,636.12 |
3,412.52 |
801.81 |
3,628.79 |
3,935.27 |
13,414.50 |
12,474.36 |
1.064 |
|
% |
12.19 |
25.43 |
5.97 |
27.05 |
29.33 |
100.00 |
1.099 |
|
| Nouveau-Brunswick |
$(000) |
430.38 |
1,030.33 |
51.55 |
449.96 |
531.94 |
2,494.15 |
2,478.44 |
0.198 |
|
% |
17.25 |
41.31 |
2.06 |
18.04 |
21.32 |
100.00 |
0.218 |
|
| Québec |
$(000) |
333,208.71 |
107,273.28 |
9,862.34 |
28,624.58 |
53,524.23 |
532,493.15 |
497,641.58 |
42.216 |
|
% |
62.57 |
20.14 |
1.85 |
5.37 |
10.05 |
100.00 |
43.31 |
|
| Ontario |
$(000) |
242,486.17 |
136,745.84 |
31,609.66 |
64,330.54 |
120,909.78 |
596,081.99 |
538,081.43 |
47.258 |
|
% |
40.68 |
22.94 |
5.30 |
10.79 |
20.28 |
100.00 |
47.393 |
|
| Manitoba |
$(000) |
5,578.11 |
4,931.91 |
563.10 |
1,894.10 |
1,826.51 |
14,793.73 |
11,641.41 |
1.173 |
|
% |
37.70 |
33.33 |
3.80 |
12.80 |
12.34 |
100.00 |
1.025 |
|
| Saskatchewan |
$(000) |
1,044.02 |
870.44 |
663.21 |
407.53 |
896.36 |
3,881.56 |
3,658.95 |
0.308 |
|
% |
26.89 |
22.42 |
17.08 |
10.49 |
23.09 |
100.00 |
0.322 |
|
| Alberta |
$(000) |
31,224.84 |
15,339.16 |
6,202.41 |
2,269.80 |
4,985.56 |
60,021.77 |
32,574.00 |
4.759 |
|
% |
52.16 |
25.55 |
10.33 |
3.78 |
8.30 |
100.00 |
2.869 |
|
| Colombie-Britannique |
$(000) |
4,410.04 |
10,819.40 |
4,129.91 |
5,546.84 |
7,628.43 |
32,534,63 |
31,244.65 |
2.579 |
|
% |
13.55 |
33.25 |
12.69 |
17.04 |
23.44 |
100.00 |
2.752 |
|
| Yukon; T, N-O.; Nunavut |
$(000) |
00.00 |
00.00 |
169.88 |
00.00 |
44.44 |
214.32 |
214.32 |
0.017 |
|
% |
00.00 |
79.26 |
00.00 |
00.00 |
20.73 |
100.00 |
0.019 |
|
| Canada |
$(000) |
620,551.53 |
282,547.39 |
54,409.87 |
107,759.83 |
196,080.01 |
1,261,348.62 |
1,135,358.76 |
100.00 |
|
Source : CEPMB
- Le pourcentage figurant sous chaque catégorie de R-D correspond au pourcentage de toutes les dépenses encourues dans cette catégorie dans la province.
- Les dépenses présentées sous forme de pourcentage du total correspondent au pourcentage des dépenses de R-D par rapport à l¡¯ensemble des dépenses de R-D faites au Canada.
- Le total des colonnes et des rangées ne correspond pas nécessairement, car certains chiffres ont été arrondis.
- Dépenses courantes plus dépenses en immobilisations (équipement + amortissement) = total des dépenses de R-D.
|