2004 Rapport Annuel
La section Rapport sur les principales tendances des médicaments du présent rapport annuel a été réorganisée. De plus, des graphiques et des tableaux ont été ajoutés. Le Conseil espère que cette analyse plus exhaustive des principaux indices vous aidera à mieux comprendre la conjoncture actuelle quant aux médicaments brevetés au Canada. Ces changements vont dans le sens du mandat de rapport du CEPMB dont l'objectif est d'éclairer les processus de prise de décisions et d'élaboration de politiques en faisant entre autres rapport des tendances des prix des produits pharmaceutiques.
Téléchargez le PDF
Table des matières
- Lettre au Ministre
- Faits saillants de l’exercice 2004
- Mot du President
- Le Conseil d'examen du prix des médicaments brevetés : Mandat et compétences
- Réglementation des prix des médicaments brevetés
- Certificat de décision préalable
- Engagements de conformité volontaire
- Activités quasi-judiciaires
- Rapport sur les principales tendances des médicaments
- Tendances des ventes
- Tendances des prix
- Comparaison des prix pratiqués au Canada aux prix pratiqués dans d'autres pays
- Volume des ventes de médicaments brevetés
- Tendances de l'industrie canadienne de fabrication de médicaments
- Le contexte mondial
- Système national d'information sur les médicaments prescrits
- Analyse des dépenses de recherche-développement
- Initiatives de politique et de recherche
- Gouvernance
- Biographies des membres du Conseil
- Budget
- Publications
- Glossaire
- Acronymes
- Annexe 1
- Annexe 2
- Annexe 3
- Médicaments brevetés pour usage humain et titulaires des brevets au Canada
- Notes
Le 31 mai 2005
L'honorable Ujjal Dosanjh, C.P., député
Ministre de la Santé
Chambre des communes
Ottawa (Ontario)
K1A 0A6
Monsieur le ministre,
J'ai l'honneur de vous présenter, conformément aux articles 89 et 100 de la Loi sur les brevets, le Rapport annuel du Conseil d'examen du prix des médicaments brevetés pour l'exercice terminé le 31 décembre 2004.
Je vous prie d'agréer, Monsieur le ministre, l'assurance de mes sentiments distingués.
Le vice-président,
Réal Sureau
Ventes
- Au Canada, la valeur totale des ventes au prix du fabricant de tous les médicaments pour usage humain a augmenté de 5,3 % par rapport à l'exercice 2003 pour se situer à 15,9 milliards de dollars. Ce taux de croissance de la valeur des ventes n'a jamais été aussi bas depuis 1997.
- La valeur des ventes des médicaments brevetés a totalisé 10,9 milliards de dollars, soit 7,9 % de plus qu'en 2003. Ce taux de croissance de la valeur des ventes est le plus modeste depuis 1996.
- Les médicaments brevetés absorbent 68,6 % de la valeur totale des ventes de médicaments, un taux légèrement plus élevé que l'an dernier.
Conformité
- Quatre-vingt-quatorze médicaments ont été lancés sur le marché canadien, dont 25 nouvelles substances actives. En date du 31 mars 2005, les prix de 90 nouveaux médicaments brevetés avaient fait l'objet d'un examen du CEPMB. Les prix de 68 de ces 90 nouveaux médicaments ont été jugés conformes aux Lignes directrices et ceux de 22 médicaments sont actuellement sous enquête.
Application
- Le Conseil a émis trois Avis d'audience et accepté huit engagements de conformité volontaire.
Tendances des prix des medicaments
- Les prix des médicaments brevetés mesurés à l'aide de l'Indice des prix des médicaments brevetés (IPMB) ont reculé de 0,2 %. L'analyse des prix selon la catégorie thérapeutique révèle des écarts importants par rapport à l'exercice précédent.
- Le ratio des prix des médicaments brevetés pratiqués au Canada par rapport à la médiane des prix pratiqués dans les différents pays de comparaison nommés dans le Règlement sur les médicaments brevetés est inférieur au prix médian international, soit à environ 91 % de celui-ci. Les prix des médicaments brevetés pratiqués au Canada sont habituellement inférieurs aux prix pratiqués en Suède, en Allemagne, au Royaume Uni et en Suisse, mais supérieurs aux prix pratiqués en France et en Italie. Cette année encore, les prix pratiqués aux États-Unis sont très supérieurs aux prix pratiqués en Europe et au Canada.
Recherche et développement
- Les brevetés ont déclaré des dépenses de R-D totalisant 1,17 milliard de dollars, soit 2 % de moins que l'exercice précédent pour lequel ces dépenses ont totalisé 1,19 milliard de dollars. Dans le cas des brevetés membres de Rx&D, ces dépenses ont totalisé 1 008,3 millions de dollars, soit 86,2 % des dépenses de R-D déclarées.
- Le ratio des dépenses de R-D par rapport aux recettes tirées des ventes pour tous les brevetés a reculé, passant de 8,8 % qu'il était en 2003 à 8,3 %. Dans le cas des brevetés membres de Rx&D, leur ratio est passé de 9,1 % à 8,5 % au cours de la même période. Ces deux ratios ont reculé au cours des dernières années, après avoir été en hausse entre 1988 et le milieu des années 1990. Dans les faits, ces ratios sont les moins élevés depuis 1989.
- La valeur des dépenses dans la recherche fondamentale a représenté 19,7 % des dépenses courantes dans la R-D et a totalisé 221,7 millions de dollars. Ces dépenses ont augmenté de 23 % par rapport à l'exercice précédent.
Cette année, l'insigne honneur m'est donné de signer le Mot du président dans le rapport annuel pour l'exercice 2004 du Conseil d'examen du prix des médicaments brevetés.
À l'instar de l'environnement dynamique des soins de santé, le CEPMB a connu au cours de la dernière année de nombreux changements dont le plus important a probablement été son évolution organisationnelle. En effet, après une décennie à la barre du CEPMB, le mandat du Dr Elgie est arrivé à son terme. L'une des influences marquantes du Dr Elgie a été sa capacité d'encourager ses collaborateurs à continuer d'étudier et de discuter des questions et des politiques qui orientent le travail du CEPMB. Le Dr Elgie a beaucoup accompli durant son passage au CEPMB. À preuve, le CEPMB a constamment atteint son objectif de protection des consommateurs contre les prix excessifs des médicaments.
En ma qualité de vice-président, j'assume les fonctions de la présidence du CEPMB d'ici à ce que soit nommé un nouveau président. L'exemple du Dr Elgie me guide dans l'exercice de ces fonctions dont l'objectif premier est d'appliquer les valeurs et la mission du CEPMB.
Les prix des produits pharmaceutiques demeurent au centre de nos discussions sur les politiques publiques. Le régime canadien de soins de santé, dont le CEPMB constitue un élément clé, a servi à protéger les consommateurs canadiens contre les prix excessifs des médicaments brevetés. En 1987, les prix des médicaments brevetés pratiqués au Canada étaient les deuxièmes plus élevés au monde, se situant à 23 % au-dessus de la médiane des prix internationaux et au-dessus également des prix des six pays européens utilisés aux fins des comparaisons des prix internationaux. Suite à la création du CEPMB et de l'adoption de ses Lignes directrices, le ratio des prix canadiens a diminué, mais au début des années 90 les prix des médicaments brevetés dépassaient encore d'environ 10 % la médiane des prix internationaux. Conscient de ne pas avoir atteint son objectif, le Conseil a modifié ses Lignes directrices en 1994. Depuis, les prix canadiens des médicaments brevetés se situent de 5 à 12 % sous la médiane des prix internationaux.
En 2004, le CEPMB a pris connaissance d'articles publiés dans les médias annonçant une hausse des prix des médicaments et a commencé à recevoir des questions des régimes publics d'assurance-médicaments concernant les préavis d'augmentation de prix reçus. Le Conseil a été mis au courant d'informations selon lesquelles un certain nombre de fabricants de médicaments brevetés avaient annoncé publiquement les augmentations des prix de leurs médicaments. Ces augmentations, si elles sont appliquées, pourraient faire renverser les tendances des prix observées tout au cours de la dernière décennie. Par
conséquent, nous avons engagé une discussion publique sur les augmentations des prix et publié à cette fin un document de discussion. Nous prenons actuellement acte des mémoires que nous ont fait parvenir les intervenants après quoi le Conseil déterminera les mesures qu'il y a lieu d'appliquer.
Au cours de la dernière décennie, le secteur des médicaments brevetés a enregistré une forte croissance - sa part de l'ensemble des ventes de médicaments brevetés au Canada ayant en effet passé de 45 % qu'elle était en 1996 à plus de 68 % en 2004. Cette même année, la valeur totale des ventes de tous les médicaments frisait les 16 milliards de dollars. Ces augmentations se sont également reflétées au niveau des dépenses des gouvernements et des consommateurs plus particulièrement au niveau de la protection de l'assurance privée et des sommes investies personnellement pour se procurer des médicaments.
Dans son dernier rapport, l'Institut canadien d'information sur la santé (ICIS) a estimé à 22 milliards de dollars la valeur totale des dépenses engagées au Canada pour l'achat de médicaments, ce qui représente environ 17 % de la valeur totale des dépenses en soins de santé. Les régimes publics ont cherché à mieux saisir les raisons d'une telle croissance des dépenses en médicaments afin de déterminer si elle est justifiée. Ils ont à cette fin adopté de nouvelles approches afin de limiter les coûts et de favoriser une collaboration.
Le CEPMB, pour sa part, a été appelé à se pencher sur les questions ayant trait aux coûts des médicaments. Nos études antérieures ont démontré que le lancement sur le marché canadien de nouveaux médicaments et le recours plus grand aux médicaments par le régime de soins de santé constituent les principaux facteurs à la source des augmentations des dépenses en médicaments.
Au titre du Système national d'information sur les médicaments prescrits (SNIUMP), le CEPMB a mis en place diverses initiatives. Le SNIUMP a pour mandat de fournir des analyses critiques des prix, de l'utilisation et des tendances des coûts des médicaments de manière à fournir à notre régime de santé des renseignements plus complets et plus exacts sur la façon dont sont utilisés les médicaments d'ordonnance ainsi que sur les sources d'augmentation des coûts. À l'heure actuelle, le CEPMB participe à différents projets qui permettront de fournir ces éléments d'information aux juridictions participantes.
Comme l'a démontré le SNIUMP, la collaboration entre les différentes instances gouvernementales constitue un élément important des solutions aux problèmes qui affectent actuellement le régime de soins de santé et, par ricochet, tous les Canadiens et toutes les Canadiennes. En septembre, les premiers ministres du pays ont convenu de pousser plus loin leur collaboration en adoptant la Stratégie nationale sur les produits pharmaceutiques dans le cadre de leur entente générale sur les soins de santé. Ils ont déclaré que " L'accès aux médicaments à des prix abordables constitue une condition incontournable à la santé de notre population ". Un groupe de travail ministériel étudie actuellement différents sujets clés portant, entre autres, sur l'assurance-médicaments en situation de catastrophe, l'adoption d'un formulaire national des médicaments couverts par l'assurance-médicaments, l'amélioration de l'accès aux médicaments constituant une découverte et aux médicaments non brevetés et l'atteinte d'une parité internationale des prix des médicaments non brevetés.
Non seulement assistons-nous à une plus grande collaboration entre les différentes instances canadiennes, mais également entre tous les intervenants du régime de soins de santé avec l'objectif d'améliorer la gestion des produits pharmaceutiques au cours des prochaines années.
Le CEPMB est à juste titre fier de la contribution qu'il a apportée à la société canadienne en prenant les mesures nécessaires pour que les Canadiens et les Canadiennes n'aient pas à acheter des médicaments brevetés à des prix excessifs. Nous nous promettons de continuer de travailler en collaboration avec nos partenaires et nos intervenants dans le meilleur intérêt de la population canadienne.
Enfin, permettez-moi de souhaiter la plus cordiale des bienvenues au Dr Brien Benoit, membre du Consiel depuis le 19 mai 2005. Je souhaite également la bienvenue à M. Anthony Boardman qui a été nommé au Conseil en mars pour un second mandat ainsi qu'à Mme Barbara Ouellet, notre nouvelle directrice exécutive depuis janvier 2005. Je tiens également à remercier Mme Ingrid Sketris pour sa contribution insigne à titre de membre du Conseil. Le mandat de Mme Sketris a pris fin en mai 2004.
Je saisis également l'occasion de remercier les membres du personnel du CEPMB pour leur contribution professionnelle et dévouée. Je souhaite remercier tout particulièrement M. Wayne Critchley qui pendant 15 ans a occupé le poste de directeur exécutif du CEPMB et qui a grandement contribué à son évolution. Mes meilleurs vœux de succès s'adressent à nos anciens collègues ainsi qu'aux nouveaux qui se joignent à notre équipe.
Le Vice-président,
Réal Sureau
Le Conseil d'examen du prix des médicaments brevetés est un organisme indépendant qui détient des pouvoirs quasi-judiciaires. Il a été créé par le Parlement en 1987 en vertu de la Loi sur les brevets (Loi). Le Ministre de la Santé est responsable de l'application des dispositions pharmaceutiques de la Loi formulées aux articles 79 à 103.
Même s'il fait techniquement partie du portefeuille de la Santé, le CEPMB exerce son mandat en toute indépendance du Ministre de la Santé.[1] Il fonctionne d'une façon indépendante des autres organismes, dont Santé Canada qui vérifie l'innocuité et l'efficacité des médicaments et les régimes publiques d'assurance-médicaments qui approuvent l'inscription des médicaments sur leurs formulaires respectifs aux fins de leur admissibilité à un remboursement.
Mandat
Le CEPMB est investi du double rôle suivant :
- Réglementation - Protéger les intérêts des consommateurs et contribuer au régime de santé canadien en exerçant un contrôle pour que les prix départ-usine des médicaments brevetés ne soient pas excessifs.
- Rapports - Éclairer les processus décisionnel et d'élaboration des politiques en établissant des rapports sur les tendances des prix des médicaments et sur les dépenses que les brevetés engagent dans la R-D.
Compétence du CEPMB
Réglementation - Le CEPMB passe en revue les prix départ-usine, à savoir les prix auxquels les brevetés vendent leurs médicaments pour usage humain ou vétérinaire distribués au Canada sous ordonnance ou en vente libre aux grossistes, aux hôpitaux et aux pharmacies pour que ces prix ne soient pas excessifs. Le CEPMB exerce un contrôle sur le prix de chaque médicament breveté, soit de chaque concentration de chaque forme posologique de chaque médicament breveté offert sur le marché canadien. C'est habituellement à ce niveau que Santé Canada attribue le numéro d'identification de drogue (DIN). C'est également à ce niveau que le CEPMB exerce son contrôle.
Au Canada, c'est Santé Canada qui évalue les nouveaux médicaments pour en assurer la conformité à la Loi sur les aliments et drogues et à son règlement d'application. L'autorisation officielle de commercialiser ou de distribuer un médicament est accordée au moyen d'un Avis de conformité. Dans certains cas, un médicament peut être temporairement distribué même si l'avis de conformité n'a pas été émis, nommément à titre de drogue de recherche ou de médicament distribué dans le cadre du Programme d'accès spécial.
Le CEPMB n'est pas habilité à exercer un contrôle sur les prix des médicaments non brevetés, incluant les médicaments génériques vendus en vertu de licences obligatoires. Il n'a droit de regard sur les prix de vente au gros et au détail ni sur les honoraires des pharmaciens. La distribution et l'ordonnance des médicaments ne relèvent pas non plus de la compétence du CEPMB.
Aux fins de la réglementation des prix, le Règlement sur les médicaments brevetés (Règlement) exige des brevetés qu'ils soumettent deux fois par année des données sur les prix et sur les ventes de chaque concentration de chaque forme posologique de chaque médicament breveté qu'ils offrent sur le marché canadien. Les brevetés sont également tenus en vertu du Règlement de présenter une fois par année un rapport sur les dépenses de R-D qu'ils effectuent au Canada.
Les fabricants doivent également informer le CEPMB de leur intention de vendre un nouveau médicament breveté sur le marché canadien, mais ils ne sont pas tenus de faire approuver au préalable le prix auquel ils offriront leur médicament.
Les brevetés doivent se conformer aux dispositions de la Loi sur les brevets de manière à maintenir les prix des médicaments brevetés à des niveaux non excessifs. Lorsque, à l'issue d'une audience publique, le Conseil arrive à la conclusion que le prix d'un médicament vendu sur tout marché canadien est excessif, il peut obliger le breveté à réduire le prix de son médicament et prendre les mesures qui s'imposent pour que le breveté rembourse les recettes excessives qu'il a perçues.
Rapports - Le CEPMB rend annuellement compte de ses activités au Parlement par le truchement du ministre de la Santé. Le rapport annuel, qui porte sur une année civile, passe en revue les principales activités du CEPMB, analyse les prix des médicaments brevetés et les tendances des prix de tous les médicaments, et fait rapport des dépenses de R-D déclarées par les titulaires de brevets pharmaceutiques. Le CEPMB fait également rapport de ses activités au moyen de son feuillet trimestriel La Nouvelle et de différentes études.
En vertu d'une entente intervenue entre les ministres fédéral, provinciaux et territoriaux de la Santé et à la demande expresse du ministre de la Santé, le CEPMB effectue des recherches sur l'utilisation et la gestion des produits pharmaceutiques au Canada et en fait rapport au titre du Système national d'information sur l'utilisation des médicaments prescrits (SNIUMP).
Ventes de médicaments au Canada
La valeur totale des ventes au prix du fabricant des médicaments pour usage humain est évaluée à 15,9 milliards de dollars pour l'exercice 2004, ce qui représente une augmentation de 5,3 % par rapport à l'exercice 2003. Les brevetés ont fait rapport de ventes de médicaments brevetés totalisant 10,9 milliards de dollars, soit 7,9 % de plus que l'exercice précédent.
Conformité et Lignes directrices sur les prix excessifs
En vertu de l'article 82 de la Loi sur les brevets (Loi), les brevetés sont tenus d'informer le CEPMB de leur intention de lancer un médicament sur le marché canadien et de la date à laquelle ils envisagent le faire.
En vertu du Règlement sur les médicaments brevetés, 1994 (Règlement), les brevetés doivent :
- remplir le formulaire Renseignements identifiant le médicament (Formulaire 1) dans les 30 jours suivant la réception de l'Avis de conformité ou de la date de la première vente du médicament, soit la première éventualité
- faire rapport des prix de lancement de leurs médicaments brevetés et de la valeur de leurs ventes (Formulaire 2) dans les 60 jours suivant la date de la première vente
- tant qu'un brevet lié au médicament est en vigueur, continuer de soumettre des données détaillées sur les prix et sur les ventes de chaque médicament breveté et ce, pour chaque semestre de l'exercice (Formulaire 2).
Le CEPMB passe en revue sur une base régulière les données fournies sur le prix de tous les médicaments brevetés offerts sur le marché canadien afin de s'assurer que les prix pratiqués sont conformes à ses Lignes directrices sur les prix excessifs. Ces Lignes directrices sont publiées dans le Compendium des Lignes directrices, politiques et procédures (Compendium) qui est affiché sur notre site Web sous la rubrique " Loi, Règlement et Lignes directrices ". Vous pouvez également en obtenir copie en composant notre numéro sans frais 1 877 861-2350.
Lignes directrices sur les prix excessifs
Les Lignes directrices sur les prix excessifs tiennent compte des facteurs de détermination des prix cités à l'article 85 de la Loi. Elles ont été formulées en consultation avec différents intervenants, dont les ministres de la Santé des provinces et des territoires, des associations de consommateurs et des représentants du secteur pharmaceutique. D'une façon générale, les Lignes directrices prévoient ce qui suit :
- les prix de la plupart des nouveaux médicaments brevetés sont limités de manière à ce que le coût de revient de la thérapie à l'aide de ce médicament ne soit pas supérieur au coût de la thérapie utilisée au Canada pour traiter la même condition
- les prix des médicaments brevetés constituant une découverte ou apportant une amélioration importante ne peuvent être supérieurs à la médiane des prix pratiqués dans les sept pays industrialisés nommés dans le Règlement, à savoir l'Allemagne, la France, l'Italie, la Suède, la Suisse, le Royaume Uni et les États-Unis
- les taux d'augmentation des prix des médicaments brevetés existants ne peuvent être supérieurs à l'Indice des prix à la consommation
- le prix d'un médicament breveté au Canada ne peut en aucun temps être supérieur au prix le plus élevé pratiqué pour le même médicament dans les pays de comparaison nommés dans le Règlement.
Le personnel du Conseil passe en revue les prix de tous les médicaments brevetés commercialisés au Canada. Le personnel effectue une enquête lorsque le prix d'un médicament breveté lui apparaît supérieur au prix que permettent les Lignes directrices et que les circonstances justifient la tenue d'une enquête pour faire la lumière sur les faits. Vous trouverez à l'annexe 1, à la page 45, de plus amples explications sur les critères qui justifient la tenue d'une enquête. Une enquête peut mener aux résultats suivants :
- sa fermeture lorsque le prix se révèle conforme aux Lignes directrices
- un engagement de conformité volontaire en vertu duquel le fabricant s'engage à réduire le prix de son médicament et à prendre d'autres mesures pour se conformer aux Lignes directrices, ou
- une audience publique pour déterminer si le prix du médicament est excessif ainsi que l'ordonnance qu'il y a lieu d'imposer.
Depuis 2001, dans un effort pour améliorer la transparence de son processus d'examen du prix, le CEPMB publie chaque mois sur son site Web la liste des Nouveaux médicaments brevetés ayant fait l'objet d'un rapport au CEPMB. Cette liste contient de l'information sur le statut de l'examen (par ex. à l'étude, conforme aux Lignes directrices, engagement de conformité volontaire, avis d'audience). Les médicaments classés " à l'étude " comprennent les médicaments sous enquête. Comme il en a été fait mention dans la livraison d'avril 2005 de La Nouvelle, à compter de 2005, les médicaments qui font l'objet d'une enquête ne seront plus classés sous la rubrique " à l'étude ". Lorsque le prix semblera supérieur aux limites autorisées par les Lignes directrices et lorsque les conditions justifiant une enquête seront en place, le médicament en cause sera inscrit sous la nouvelle rubrique " sous enquête ".
Nouvelles substances actives approuvées en 2004
Santé Canada a approuvé 17 nouvelles substances actives (NSA) en 2004, mais elles n'ont pas toutes été offertes sur le marché canadien cette même année. [2] La liste du CEPMB des nouvelles substances actives n'est pas nécessairement identique à celle des nouvelles substances approuvées par la Direction des produits thérapeutiques de Santé Canada pour l'une ou l'autre des raisons suivantes :
- la NSA n'est pas brevetée et, par conséquent, n'est pas assujettie à la compétence du CEPMB
- la NSA ne figure pas sur la liste de la Direction des produits thérapeutiques parce qu'elle est vendue au titre du Programme d'accès spécial avant même d'avoir reçu son Avis de conformité
- la NSA peut avoir été approuvée, mais elle n'a pas encore été vendue.
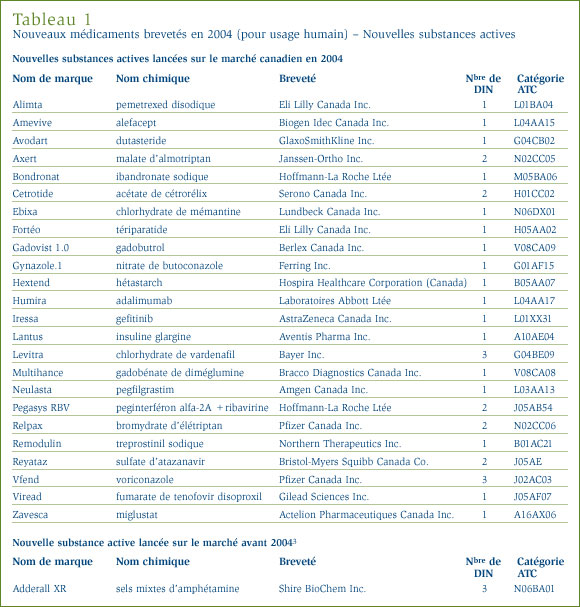
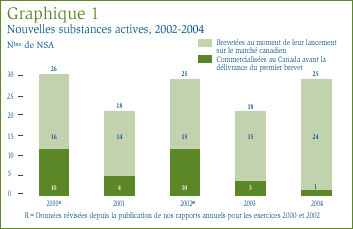
Comme le montrent le tableau 1, à la page 10, et le graphique 1, une des 25 NSA brevetées devenues assujetties à l'examen du CEPMB était commercialisée sur le marché canadien avant 2004.
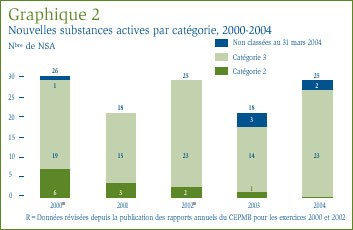
Une NSA peut être associée à différents DIN lorsqu'elle est distribuée sous diverses formes posologiques et dans diverses concentrations. Les 25 NSA approuvées en 2004 ont été commercialisées sous 36 présentations (DIN). Le graphique 2 ventile les NSA brevetées pour usage humain selon la catégorie attribuée aux fins de l'examen des prix pour la période de 2000 à 2004 inclusivement. [4]
Les rapports sommaires des examens du prix des nouvelles substances actives sont affichés sur notre site Web.
Depuis la publication de notre rapport annuel pour l'exercice 2003, nous avons mis à jour les graphiques 1 et 2 de manière à y inclure la nouvelle substance active Dicetel (bromure de pinaverium, Solvay Pharma Inc.) lancée sur le marché canadien en 2000. Le breveté a fait rapport de ce médicament au CEPMB en mars 2004 et son prix est actuellement sous examen.
Nouveaux médicaments brevetés commercialisés au Canada en 2004
Au total, 94 nouveaux médicaments brevetés pour usage humain, aussi appelés DIN, ont été lancés sur le marché canadien en 2004. Certains de ces nouveaux médicaments représentent une ou plusieurs concentrations d'une NSA et d'autres, de nouvelles présentations de médicaments existants.
Aux fins de notre examen du prix, tout médicament breveté lancé sur le marché canadien ou commercialisé avant l'obtention de son premier brevet entre le 1er décembre 2003 et le 30 novembre 2004 est réputé avoir obtenu son brevet en 2004. [5]
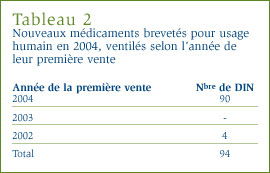
Six (6,4 %) de ces 94 nouveaux médicaments brevetés ont été commercialisés au Canada avant la délivrance d'un premier brevet canadien qui les assujettit automatiquement à la compétence du Conseil. Ces DIN sont identifiés par les lettres PBA (pour premier brevet accordé) dans l'annexe 2, à la page 46. Le tableau 2, à la page 12, présente le nombre de médicaments brevetés selon la première année de leur commercialisation. Pour ces médicaments, le délai écoulé entre la date de la première vente et celle de l'obtention du premier brevet varie entre plusieurs mois et deux années.
Examen du prix des nouveaux médicaments brevetés pour usage humain
La liste des 94 nouveaux médicaments brevetés, incluant le statut de l'examen des prix en date du 31 mars 2005, est présentée à l'annexe 2, à la page 46. Des 94 nouveaux DIN brevetés, 90 alors avaient fait l'objet d'un examen du prix. De ces 90 DIN, 25 ont été commercialisés à des prix supérieurs aux prix autorisés, justifiant ainsi une enquête. Au moment de la publication du présent rapport, trois enquêtes ont été complétées, dont deux suite à un engagement de conformité volontaire et une parce que le prix s'est révélé conforme aux Lignes directrices. Ainsi, les prix de 22 autres médicaments sont actuellement sous enquête. Vous trouverez à l'annexe 1, à la page 45, de plus amples explications sur les critères qui justifient la tenue d'une enquête. Les prix de 68 nouveaux médicaments brevetés lancés sur le marché canadien ont été jugés conformes aux Lignes directrices.
Examen du prix des médicaments brevetés existants pour usage humain
Aux fins du présent rapport, les médicaments existants désignent tous les médicaments brevetés commercialisés sur le marché canadien avant le 1er décembre 2003. Les Lignes directrices du CEPMB limitent les augmentations des prix des médicaments existants aux variations de l'Indice des prix à la consommation (IPC). Par ailleurs, le prix d'un médicament breveté ne peut être supérieur à son prix de vente le plus élevé des sept pays de comparaison nommés dans le Règlement (ces pays sont l'Allemagne, la France, l'Italie, la Suède, la Suisse, le Royaume Uni et les États-Unis). Au total, 993 médicaments brevetés existants pour usage humain (DIN) ont été commercialisés au Canada au cours de l'exercice 2004.
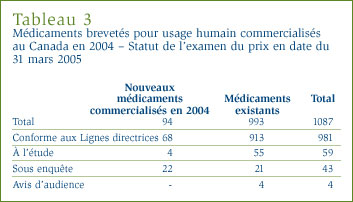
En début d'exercice, 51 enquêtes étaient en cours et 11 nouvelles se sont ajoutées parce que les prix de ces médicaments ne semblaient pas conformes aux Lignes directrices. En fin d'exercice, 41 des 62 enquêtes étaient finalisées, laissant 21 enquêtes en cours.
Au moment de la rédaction du présent rapport :
- les prix des 913 DIN existants (92 %) ont, après examen, été jugés conformes aux Lignes directrices
- 21 DIN faisaient l'objet d'une enquête engagées en raison des prix pratiqués au cours d'exercices antérieurs (5 DIN étaient de nouveaux médicaments lancés sur le marché canadien en 2002, 6 de nouveaux médicaments lancés sur le marché canadien en 2003, 10 des médicaments existants - 5 en 2003 et 5 autres en 2004)
- 4 DIN, dont 3 concernant le Nicoderm et 1 concernant le Dovobet, faisaient l'objet d'une audience en vertu de l'article 83 de la Loi (voir la rubrique Activités quasi-judiciaires à la page 18)
- 55 DIN étaient encore à l'étude.
Le tableau 3 présente un aperçu du statut d'examen, de conformité et d'enquête en date du 31 mars 2005 des médicaments brevetés nouveaux et existants commercialisés au Canada au cours de l'exercice 2004.
Nous avons mentionné dans le rapport annuel de l'an dernier que le CEPMB s'était intéressé d'une façon toute particulière à certaines initiatives touchant l'examen des échéanciers. Ce projet a donné lieu à une diminution importante du nombre d'enquêtes en cours qui sont passées de 67 à 51 entre le 31 mars 2003 et le 31 mars 2004. Le CEPMB a poursuivi son travail au niveau de ce projet. D'autres initiatives ont été mises en œuvre en 2004 (voir page 34). Le nombre d'enquêtes a continué de diminuer passant à 43 en date du 31 mars 2005.
PCEM / CEPMB
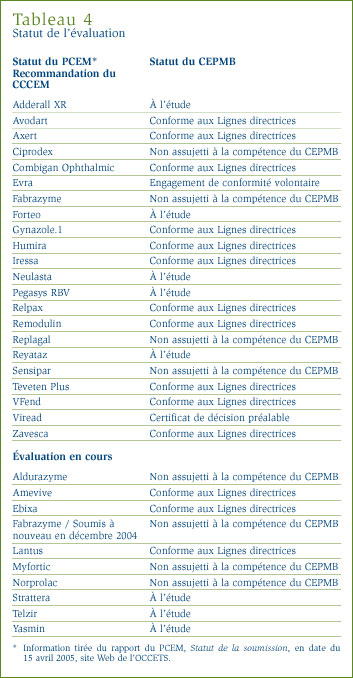
Le Programme commun d'évaluation des médicaments (PCEM), un processus unifié d'évaluation des nouveaux médicaments, donne lieu à la formulation de recommandations à l'intention des régimes d'assurance-médicaments fédéral, provinciaux et territoriaux (F-P-T) quant à l'opportunité d'ajouter certains médicaments à leurs formulaires respectifs. À l'exception du Québec, toutes les provinces et tous les territoires participent à ce programme. Le PCEM évalue les nouveaux médicaments et communique les recommandations formulées par le Comité consultatif canadien d'expertise sur les médicaments (CCCEM) concernant la liste des médicaments admissibles à un remboursement par les régimes publics d'assurance-médicaments. Au moment de prendre des décisions concernant les médicaments qu'il y a lieu d'inscrire sur les formulaires de médicaments admissibles à un remboursement, les différents régimes publics d'assurance-médicaments évaluent la recommandation formulée au titre du PCEM à la lumière de leur mandat, de leurs priorités et de leurs ressources respectives. Vous trouverez de plus amples renseignements sur le PCEM et sur le CCCEM sur le site Web de l'Office canadien de coordination de l'évaluation des technologies de la santé (OCCETS) (http://www.ccohta.ca).
Le tableau 4 présente de l'information sur le statut des examens du PCEM et sur l'examen des prix du CEPMB.
Suivi : nouveaux médicaments brevetés mentionnés dans des rapports annuels antérieurs
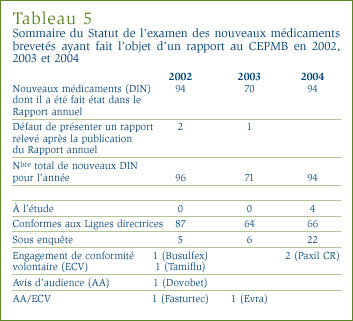
Le tableau qui suit constitue une mise à jour en date du 31 mars 2005 des nouveaux médicaments brevetés, exprimés en DIN, dont il a été fait état dans les rapports annuels d'exercices antérieurs.
Mise à jour des médicaments existants tirés du Rapport annuel 2003
Dans son rapport annuel de l'an dernier, le Conseil mentionnait que les prix de 41 des 974 médicaments brevetés pour usage humain commercialisés au Canada en 2003 étaient sous examen au moment d'aller sous presse. Il est ressorti de ces examens que les prix de 19 de ces médicaments étaient conformes aux Lignes directrices et que les prix de quatre DIN semblaient supérieurs aux limites autorisées et justifiaient la tenue d'une enquête. Les prix de 18 DIN encore à l'étude sont comptabilisés dans le tableau 3, à la page 12.
Le Conseil mentionnait également dans son rapport annuel de 2003 que 39 DIN étaient sous enquête. Trente quatre de ces enquêtes sont closes : 28 de ces cas, les prix ont été reconnus conformes aux Lignes directrices; six cas, à savoir Fasturtec, One-Alpha, Tamiflu, Starnoc, Busulfex et Prolastin, ont été réglés au moyen d'un Engagement de conformité volontaire (voir la rubrique Engagements de conformité volontaire à la page 15).
Médicaments brevetés pour usage vétérinaire
En septembre 2003, le CEPMB a adopté le processus d'examen qui ne s'engage que sur réception d'une plainte relative au prix d'un médicament pour usage vétérinaire breveté. Cette décision a été communiquée aux intervenants dans la livraison de janvier 2004 de La Nouvelle. Étant donné que le Règlement ne fait aucune distinction entre les médicaments brevetés pour usage humain et les médicaments brevetés pour usage vétérinaire en ce qui a trait à la présentation de rapport, il doit être modifié pour permettre cette distinction. Les modifications proposées et soumises à une consultation auprès des intervenants ont été publiées dans la livraison de janvier 2005 de La Nouvelle. La date limite de réception des mémoires des intervenants sur les changements proposés au Règlement a été fixée au 15 avril 2005. Le Conseil fera rapport dans son Programme de recherche du suivi qu'il donnera à cette initiative et publiera les mémoires reçus.
Dans l'intervalle, le processus d'examen des médicaments brevetés pour usage vétérinaire est maintenu. Le personnel du Conseil ne passe en revue que les prix des nouveaux médicaments brevetés pour usage vétérinaire. Les médicaments existants ne font l'objet d'un examen que sur réception d'une plainte fondée. Le Conseil n'a reçu en 2004 aucune plainte concernant le prix d'un médicament breveté pour usage vétérinaire.
Notre rapport annuel pour l'exercice 2003 mentionnait que les prix de sept DIN étaient à l'étude. Les prix de cinq de ces DIN ont été jugés conformes aux Lignes directrices alors que les prix des deux autres DIN et le prix d'un nouveau médicament lancé sur le marché canadien en 2003 étaient à l'étude au moment de la rédaction du présent rapport. Les rapports sommaires de l'examen du prix des médicaments pour usage vétérinaire sont affichés sur notre site Web sous les rubriques " Médicaments brevetés; Rapports sur les nouveaux médicaments brevetés pour usage vétérinaire ".
En vertu de l'alinéa 4 de l'article 98 de la Loi sur les brevets, le Conseil peut, à la demande du breveté, émettre un certificat de décision préalable lorsqu'il est convaincu que le prix pratiqué ou proposé du médicament n'est pas supérieur au prix maximal non excessif établi en vertu des Lignes directrices du CEPMB. Ce certificat n'engage d'aucune façon la décision ultérieure du CEPMB. Comme le prévoit l'alinéa 4 de l'article 98 de la Loi, tout examen mené aux fins de la délivrance d'un certificat doit se fonder sur les faits importants alors disponibles.
Viread, Gilead Sciences Inc.
Le 13 avril 2004, le Président du Conseil a pris la décision de publier un Avis et Commentaires dans lequel il proposait de délivrer un certificat de décision préalable concernant le prix du médicament breveté Viread.
Le Viread est indiqué pour le traitement des infections au VIH-1. Il est distribué au Canada par Gilead Sciences, Inc. depuis le mois de mars 2004.
À l'issue de négociations avec le personnel du Conseil, Gilead a demandé au Conseil de délivrer un certificat de décision préalable relativement au prix moyen de vente du comprimé de 300 mg de Viread à 15,1250 $.
Le personnel du Conseil a recommandé au Conseil de conclure que, à la lumière des facteurs mentionnés à l'article 85 de la Loi, il n'existait pas de motifs justifiant une ordonnance à l'encontre du Viread en vertu de l'article 83 de la Loi.
Le Conseil a reçu un mémoire présenté par le Conseil canadien de surveillance et d'accès aux traitements (CCSAT) suite à la publication d'un Avis et commentaires. Les ministres de la Santé des provinces et des territoires n'ont soumis aucun mémoire dans cette affaire. Gilead et le personnel du Conseil ont répliqué par écrit au mémoire du CCSAT.
Après avoir pris connaissance des mémoires du CCSAT, de Gilead et du personnel du Conseil et à la lumière des faits portés à sa connaissance, le Président du Conseil est arrivé à la conclusion qu'il n'existait pas de motifs justifiant une ordonnance en vertu de l'article 83 de la Loi et qu'il était de l'intérêt public de délivrer un certificat de décision préalable relativement au prix proposé du médicament Viread. Le CEPMB continuera d'exercer un suivi du prix du Viread afin de s'assurer qu'il demeure conforme à ses Lignes directrices tant et aussi longtemps que le médicament sera assujetti à sa compétence.
Le Certificat de décision préalable et les motifs du Conseil sont publiés sur notre site Web sous les rubriques " Publications; Certificats de décision préalable; Viread ". Vous pouvez obtenir des copies des mémoires auprès de la Secrétaire du Conseil.
En vertu de la politique de conformité et d'application du CEPMB, les brevetés ont la possibilité de conclure un engagement de conformité volontaire (engagement) lorsque, après enquête, le personnel du Conseil arrive à la conclusion que le prix d'un médicament fixé par le breveté semble supérieur au prix maximal autorisé en vertu des Lignes directrices sur les prix excessifs.
Engagement écrit pris par le breveté de baisser le prix de son médicament pour le rendre conforme aux Lignes directrices du CEPMB sur les prix excessifs. Vous trouverez de plus amples renseignements et définitions dans la section " Glossaire " du présent rapport.
L'acceptation de cet engagement par le Président constitue une alternative aux procédures quasi-judiciaires qui s'engagent suite à la publication d'un Avis d'audience. La politique du Conseil sur la conformité et l'application autorise la présentation d'un engagement de conformité volontaire après la publication d'un Avis d'audience. L'engagement soumis à ce point requiert l'aval du Conseil.
En 2004, cinq engagements de conformité volontaire ont été acceptés pour les médicaments brevetés suivants :
- One-Alpha, LEO Pharma Inc.
- Fasturtec, Sanofi-Synthélabo Canada Inc.
- Prolastin, Bayer Inc.
- Starnoc, Servier Canada Inc.
- Busulfex, ESP Pharma Inc.
En février 2005, le Conseil a accepté l'engagement soumis par Janssen-Ortho Inc. pour son médicament breveté Evra. En mars 2005, le Président a accepté deux autres engagements, soit un présenté par GlaxoSmithKline Inc. pour son médicament Paxil CR et un autre présenté par Hoffmann-La Roche Limitée pour son médicament Tamiflu.
One-Alpha, LEO Pharma Inc.
One-Alpha est indiqué pour le traitement de l'hypocalcémie, de l'hyperthyroïdisme secondaire et de l'ostéotrophie chez les patients souffrant d'insuffisance rénale chronique.
Le 6 mai 2004, le Président a accepté l'engagement soumis par LEO Pharma Inc. pour son médicament breveté One-Alpha (alfacalcidol). LEO Pharma commercialise ce médicament au Canada depuis janvier 2001.
Comme le prévoyait l'engagement, LEO Pharma a réduit le prix moyen de son médicament pour qu'il se situe dans les limites du prix maximal non excessif établi à 13,3750 $ le millilitre pour 2004. En guise de remboursement des recettes excessives encaissées au cours de la période du 1er janvier 2001 au 31 décembre 2003, LEO Pharma a remis un chèque de 23 049,10 $ au gouvernement du Canada.
Le rapport annuel portant sur l'exercice 2003 présentait de plus amples renseignements concernant l'engagement soumis par LEO Pharma pour son médicament One-Alpha. Cet engagement est également affiché sur notre site Web sous les rubriques " Publications; Engagements de conformité volontaire; One-Alpha ".
Fasturtec, Sanofi-Synthélabo Canada Inc.
Le Fasturtec est indiqué pour le traitement et la prévention de l'hyperuricémie chez les enfants et les adultes atteints d'un cancer. Il est administré par intraveineuse exclusivement en milieu hospitalier.
Le Conseil a mis fin aux procédures qu'il avait engagées le 20 mai 2004 relativement au médicament breveté Fasturtec en acceptant l'engagement de Sanofi-Synthélabo Canada Inc. (Sanofi). Comme le prévoyait cet engagement, Sanofi a à compter du 26 juillet 2004 réduit le prix de la fiole de son médicament qui est passé de 295 $ à environ 125 $.
Cet engagement est favorable pour les consommateurs canadiens et pour le régime de soins de santé étant donné qu'il donne lieu à une réduction immédiate du prix du Fasturtec à moins de la moitié de son prix de vente moyen et qu'il fait en sorte qu'aucun consommateur canadien n'aura à l'avenir à acheter ce médicament à un prix plus élevé que le prix maximal non excessif. Le prix du Fasturtec est ainsi devenu conforme aux Lignes directrices du CEPMB et doit le demeurer tant et aussi longtemps que le médicament sera assujetti à la compétence du Conseil, soit au moins jusqu'en 2015.
L'engagement établit que le prix de vente moyen du Fasturtec pour 2004 ne sera pas supérieur au prix maximal non excessif établi à 124,7854 $ la fiole. L'engagement prévoit également le remboursement des recettes excessives encaissées entre le 21 mai 2002 et le 31 décembre 2003 au moyen de rabais consentis à différents clients de Sanofi, à savoir aux 28 hôpitaux qui ont acheté du Fasturtec au cours de la période où le prix du médicament était excessif.
Dans son mémoire, le personnel du Conseil a noté que Sanofi se proposait de maintenir pour son médicament un prix de liste beaucoup plus élevé que le prix réduit et ce, malgré l'engagement pris de faire en sorte qu'aucun client canadien n'aurait à acheter le Fasturtec à un prix supérieur au prix réduit. Vous trouverez dans le présent rapport de plus amples renseignements sur cette initiative du Conseil sous la rubrique " Initiatives de politique de recherche " à la page 35.
Prolastin, Bayer Inc.
Le Prolastin, un dérivé du plasma humain, est indiqué pour le traitement d'un trouble génétique rare, plus précisément comme traitement de substitution chronique chez les personnes atteintes d'une déficience congénitale d'Alpha 1-PI (déficience d'antitrypsine alpha 1) et démontrant cliniquement un emphysème panlobulaire.
Le 9 juillet 2004, le Président a accepté l'engagement que lui a soumis Bayer Inc. concernant le prix de son médicament breveté Prolastin.
L'engagement reconnaît que le prix maximal non excessif d'une fiole de Prolastin était de 288 $ pour 2003 et que le prix de transaction moyen ne pouvait être supérieur à ce montant.
Bayer s'est également engagé à vendre son médicament au Canada au cours des années 2004, 2005 et 2006 à un prix se situant dans les limites (a) du prix maximal non excessif établi pour 2003 et rajusté en fonction de l'IPC et (b) du prix international médian établi pour ces mêmes années. De plus, si Bayer devait augmenter après 2006 le prix du Prolastin à un niveau supérieur au prix rajusté en fonction de l'IPC établi à l'aide de la méthodologie décrite dans les Lignes directrices, il devra en donner un préavis écrit au CEPMB et fournir les éléments de preuve justifiant l'augmentation. Considérant ces circonstances particulières, le Président a accepté l'engagement. Le CEPMB se réserve toutefois le droit d'engager une enquête en vertu de sa politique de conformité et d'application si les circonstances le justifient.
Starnoc, Servier Canada Inc.
Le Starnoc est indiqué pour le traitement à court terme et pour le traitement symptomatique de l'insomnie chez les patients éprouvant de la difficulté à s'endormir.
Après avoir pris connaissance de l'engagement soumis par Servier Canada Inc., le CEPMB a mis fin à son enquête sur le prix du médicament breveté Starnoc. Par cet engagement, Servier Canada Inc. s'est engagé à réduire de plus de 40 % le prix de son médicament et à rembourser au gouvernement du Canada les recettes excessives encaissées grâce à la vente de son médicament à un prix excessif.
Le 15 juillet, le Président a accepté l'engagement qui reconnaissait que le prix maximal non excessif de la gélule de 5 mg de Starnoc était de 0,4526 $ pour l'année 2000 et de 0,4964 $ pour l'année 2004 alors que pour la gélule 10 mg ce prix était respectivement de 0,6816 $ et de 0,7475 $ pour les années 2000 et 2004.
Pour faire en sorte que Servier n'encaisse pas de recettes excessives en raison d'une pratique de prix excessifs entre le 1er janvier et le 30 juin 2004, Servier a remis en 2004 la somme de 739 739,99 $ au gouvernement du Canada.
De plus, pour rembourser le reliquat des recettes excessives de 3 838 801,86 $, Servier pratiquera jusqu'à la fin de l'année 2005 des prix inférieurs aux prix rajustés en fonction de l'IPC pour tous ses médicaments brevetés. Dans l'éventualité où les recettes excessives n'auraient pas été totalement remboursées à la fin du mois de décembre 2005, Servier remettra au gouvernement du Canada le solde des recettes excessives qu'il a encaissées et ce, au plus tard le 30 janvier 2006.
Les prix du Starnoc demeureront assujettis à la compétence du CEPMB jusqu'à l'échéance de son brevet, soit jusqu'en juin 2007.
Busulfex, ESP Pharma Inc.
Le Busulfex est un agent antinéoplasique indiqué pour utilisation en combinaison avec d'autres agents chimiothérapeutiques et (ou) avec la radiothérapie comme schéma préalable à la transplantation de cellules hématopoïétiques souches ou de la moelle osseuse.
Le CEPMB a mis fin à son enquête sur le prix du médicament Busulfex après que le breveté se soit engagé à réduire de plus de 7 % le prix de son médicament.
Le 16 novembre, le Président a accepté l'engagement soumis par ESP Pharma. En vertu de cet engagement et en conformité avec les Lignes directrices du CEPMB, ESP a réduit le prix de transaction moyen de l'ampoule de Busulfex au niveau du prix maximal non excessif établi pour 2004 à 359,89 $. En guise de remboursement des recettes excessives encaissées, ESP a versé 150 646,99 $ au gouvernement du Canada.
Le Busulfex est commercialisé au Canada depuis avril 1999 quoique le brevet du médicament n'a été délivré qu'en juillet 2002. Même si le Busulfex n'est techniquement assujetti à la compétence du CEPMB que depuis juillet 2002, la compétence du CEPMB en matière d'examen du prix est rétroactive à la période préalable à la délivrance du brevet soit dans le présent cas à avril 1999.
Le prix du Busulfex demeurera assujetti à la compétence du CEPMB jusqu'en août 2014, soit jusqu'à l'échéance du brevet.
Evra, Janssen-Ortho Inc.
Le Evra est un timbre contraceptif transdermique indiqué pour empêcher la grossesse chez les femmes utilisant des contraceptifs hormonaux.
Le 21 février 2005, le Conseil a mis fin aux procédures engagées le 23 décembre 2004 concernant le médicament breveté Evra en acceptant l'engagement soumis par Janssen-Ortho Inc. En vertu de cet engagement, Janssen-Ortho a réduit d'environ 45 % le prix de son médicament, soit à 4,47 $ le timbre.
Pour rembourser les recettes excédentaires encaissées grâce à la vente du médicament Evra à un prix excessif entre la date de la première vente et le 30 juin 2004, Janssen-Ortho a remis au gouvernement du Canada un chèque de 1 359 263,67 $. D'autre part, le reliquat des recettes excédentaires encaissées entre le 1er juillet et le 31 décembre 2004, soit 1 496 019,02 $, sera remboursé au moyen d'une réduction du prix d'un autre médicament breveté de Janssen-Ortho, en l'occurrence le Levaquin 5mg/mL et 25mg/mL. Cette réduction de prix est entrée en vigueur le 1er mars 2005.
Si, en date du 31 décembre 2005, le montant des recettes excessives perçues de la vente du médicament Evra à un prix excessif n'a pas été intégralement remboursé, Janssen-Ortho remettra au gouvernement du Canada le reliquat de ces recettes au plus tard le 31 janvier 2006.
Le prix du Evra demeurera assujetti à la compétence du CEPMB jusqu'en juin 2016, soit jusqu'à la date d'échéance du brevet.
Paxil CR, GlaxoSmithKline Inc.
Le Paxil CR, contrairement aux autres présentations du Paxil, un antidépresseur, permet une libération contrôlée de la substance active. Le Paxil CR est distribué sous forme de comprimés de deux concentrations, à savoir de 12,5 mg et de 25 mg.
Pour se conformer aux Lignes directrices du CEPMB, GlaxoSmithKline (GSK) s'est engagé à porter le prix de transaction moyen de son médicament Paxil CR à un niveau inférieur au prix maximal non excessif établi pour 2005 au cours de la période de rapport allant du 1er janvier au 30 juin 2005. Pour 2005, le prix maximal non excessif d'un comprimé de 12,5 mg est de 1,5861 $ et celui d'un comprimé de 25 mg, de 1,7019 $.
GSK a remboursé les recettes excessives encaissées entre le 5 janvier et le 31 décembre 2004 en remettant au gouvernement du Canada la somme de 310 403,64 $.
Le prix du Paxil CR demeurera assujetti à la compétence du CEPMB jusqu'en juillet 2016, soit jusqu'à l'échéance du brevet.
Tamiflu, Hoffmann-La Roche Limitée
Le Tamiflu est un inhibiteur de neuraminidase à action directe.
Afin de se conformer aux Lignes directrices du CEPMB sur les prix excessifs, Hoffmann-La Roche Limitée (Roche) a reconnu que le prix maximal non excessif de la gélule de 75 mg de son médicament Tamiflu était de 3,7695 $ pour la période de janvier à décembre 2003 et de 3,8383 $ pour la période de janvier à décembre 2004. Roche s'est de plus engagé à maintenir le prix de transaction moyen de la gélule de 75 mg de Tamiflu sous la barre du prix maximal non excessif établi à 3,8917 $ pour 2005. De plus, Roche doit remettre au gouvernement du Canada les recettes excédentaires encaissées entre le 1er janvier 2003 et le 31 décembre 2004 au moyen d'un chèque de 442 973,47 $.
Le prix du Tamiflu demeurera assujetti à la compétence du CEPMB jusqu'à l'échéance de son brevet, soit jusqu'en mai 2019.
Nicoderm, Hoechst Marion Roussel Canada Inc.
Le Nicoderm est un timbre de nicotine transdermique administré pour atténuer les symptômes d´assuétude à la nicotine chez les personnes qui cessent de fumer.
Le 20 avril 1999, le Conseil a publié un Avis d´audience aux fins de déterminer en vertu des articles 83 et 85 de la Loi sur les brevets si Hoechst Marion Roussel Canada Inc. (HMRC) vendait ou avait vendu sur le marché canadien son médicament Nicoderm à des prix que le Conseil considérait excessifs et, le cas échéant, de déterminer l´ordonnance qu´il y avait lieu d´imposer. Ce cas a été mentionné à diverses reprises dans les derniers rapports annuels et dans La Nouvelle.
Suite aux décisions rendues en 1999 et 2000 par lesquelles le Conseil confirmait sa compétence à tenir une audience sur le prix du Nicoderm, HMRC a déposé deux demandes de révision judiciaire devant la Cour fédérale du Canada visant à faire infirmer les décisions du Conseil. Les 16 et 17 mai 2005, la Cour fédérale a entendu les demandes de révision judiciaire, mais elle n´a pas encore rendu ses décisions.
Fasturtec, Sanofi-Synthélabo Canada Inc.
Le Fasturtec est indiqué pour le traitement et la prévention de l´hyperuricémie chez les enfants et les adultes atteints d´un cancer. Ce médicament est administré par voie intraveineuse.
Le 28 juin 2004, le Conseil a mis fin aux procédures engagées le mois précédent concernant le prix du médicament Fasturtec en acceptant l´engagement de conformité volontaire de Sanofi-Synthélabo Canada Inc. Sanofi s´engageait ainsi à réduire à compter du 26 juillet 2004 le prix de son médicament qui passait ainsi de 295 $ à 125 $ la fiole.
Vous trouverez de plus amples renseignements sur cette affaire à la page 16 du présent rapport, dans la section portant l´intitulé Engagements de conformité volontaire.
Dovobet, LEO Pharma Inc.
Le Dovobet est indiqué pour le traitement topique des lésions actives du psoriasis vulgaris chez les adultes.
Le Conseil a publié un Avis d´audience le 29 novembre 2004 dans l´affaire LEO Pharma Inc. et le prix de son médicament breveté Dovobet. L´audience a pour objet de déterminer si, en vertu des articles 83 et 85 de la Loi sur les brevets, LEO Pharma Inc. vend ou a vendu son médicament Dovobet sur tout marché canadien à un prix que le Conseil juge excessif et de décider de l´ordonnance qu´il y a lieu de prononcer.
Le Conseil a tenu une conférence préparatoire à l´audience le 19 janvier 2005 puis trois jours d´audience en mars. Le Conseil doit entendre cette cause sur le fond en septembre.
Evra, Janssen-Ortho Inc.
Le Evra est un timbre contraceptif transdermique indiqué pour empêcher la grossesse chez les femmes utilisant des contraceptifs hormonaux.
Le 23 décembre 2004, le Conseil a publié un Avis d´audience à l´encontre de Janssen-Ortho Inc. et du prix de son médicament breveté Evra. Le 21 février 2005, le Conseil a approuvé l´engagement soumis par Janssen-Ortho Inc. et par lequel le fabricant s´engageait à réduire le prix de son médicament Evra.
En vertu de cet engagement, Janssen-Ortho a réduit de 45 % le prix de son médicament Evra qui est ainsi passé à 4,47 $ le timbre. Janssen-Ortho Inc. s´est également engagé à rembourser les recettes excessives qu´il a encaissées au moyen d´un paiement au gouvernement du Canada et à réduire le prix d´un autre de ses médicaments brevetés, en l´occurrence le Levaquin.
Vous trouverez de plus amples renseignements sur cette affaire à la page 17 du présent rapport, dans la section portant l´intitulé Engagements de conformité volontaire.
La présente section a été réorganisée et de nouveaux tableaux et graphiques y ont été ajoutés. Nous espérons que cette analyse plus exhaustive des principaux indices vous aidera à mieux comprendre la conjoncture actuelle quant aux médicaments brevetés au Canada. Ces changements vont dans le sens du mandat de rapport du CEPMB dont l'objectif est d'éclairer les processus de prise de décisions et d'élaboration de politiques en faisant entre autres rapport des tendances des prix des produits pharmaceutiques.
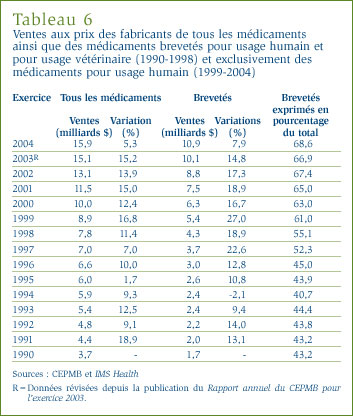
La valeur des ventes des médicaments a totalisé 15,9 milliards de dollars en 2004, ce qui représente une augmentation de 5,3 % par rapport aux ventes de 2003. [6] Ce taux de croissance, qui est beaucoup moindre que le taux de 15,2 % enregistré en 2003, est de fait le taux le plus bas enregistré depuis 1996. Le tableau 6 présente les valeurs estimées des ventes de médicaments aux prix des fabricants effectuées entre 1990 et 2004.
Ventes et prix : L'augmentation de la valeur des ventes de médicaments ne sous-tend pas nécessairement une augmentation des prix des médicaments et vice versa. [7] Plusieurs autres facteurs - à savoir des facteurs ayant une incidence sur le volume et sur la composition de l'utilisation des médicaments - peuvent donner lieu à des taux marqués de croissance de la valeur des ventes et ce, même lorsque les prix des médicaments sont en baisse. Au nombre de ces facteurs, citons les suivants : [8]
- variations démographiques
- variations de la composition démographique de la population (par ex. vieillissement de la population et, partant, une recrudescence des problèmes de santé)
- augmentation de l'incidence (au sein de certains groupes démographiques) de problèmes de santé pouvant être traités au moyen de médicaments
- changements des habitudes d'ordonnance des médecins (qui, par exemple, sont portés à prescrire les nouveaux médicaments pour traiter une condition qu'ils traitaient avec des médicaments existants.
Les nouveaux médicaments sont plus dispendieux que les anciens et possiblement plus efficaces)
- recours plus régulier à des pharmacothérapies en remplacement d'autres traitements (par ex. la chirurgie)
- utilisation de nouvelles pharmacothérapies pour traiter des conditions pour lesquelles il n'existait aucun traitement efficace, et
- plus grande propension des médecins et des patients (par ex. suite à de nouvelles découvertes médicales) à utiliser des médicaments pour traiter des conditions qui n'étaient jusque là pas considérées problématiques.
Composition des ventes au prix du fabricant : Le CEPMB détermine la valeur des ventes au prix du fabricant en faisant la somme de la valeur des ventes des médicaments brevetés, des médicaments non brevetés et des médicaments génériques. À cette fin, l'expression " médicament breveté " s'entend de tout médicament assujetti à la compétence du CEPMB aux fins de l'examen du prix. Un " médicament de marque non breveté " est un médicament vendu par un breveté (à savoir un fabricant commercialisant au Canada un ou plusieurs médicaments assujettis à l'examen du prix du CEPMB), mais qui n'est pas breveté (soit parce que le brevet est en instance, parce que tous les brevets liés au médicament sont arrivés à échéance ou, encore, parce que le médicament n'a jamais été breveté).
En vertu du Règlement sur les médicaments brevetés, les brevetés doivent faire rapport au CEPMB de la valeur totale de leurs ventes de médicaments brevetés et non brevetés sur le marché canadien. Les brevetés doivent également soumettre des renseignements sur leurs ventes de médicaments brevetés, ventilés selon le médicament et la catégorie de client. À partir de ces éléments d'information, le CEPMB calcule la valeur des ventes de médicaments brevetés de chaque breveté et fait un estimé de la valeur des ventes de médicaments non brevetés de chacun. Le CEPMB complète ses calculs en estimant la valeur des ventes de médicaments génériques des membres de l'Association canadienne du médicament générique (ACMG) à l'aide des données de IMS Health. [9]
Pour revenir au tableau 6, à la page 19, la valeur des ventes de médicaments brevetés est passée à 10,9 milliards de dollars, ce qui représente une augmentation de 7,9 % par rapport à la valeur de l'exercice 2003. Cette augmentation de la valeur des ventes est la plus faible depuis 1994. En 2004, les médicaments brevetés ont accaparé 68,6 % de la valeur totale des ventes de médicaments, soit un peu plus que l'exercice précédent. La part de la valeur des ventes des médicaments brevetés au prix du fabricant a augmenté d'une façon marquée depuis le milieu des années quatre-vingt-dix alors qu'elle représentait moins de la moitié de la valeur de l'ensemble des ventes.
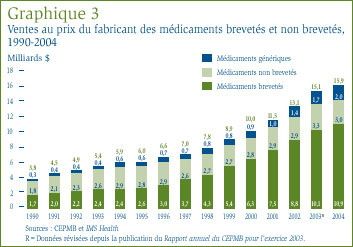
Le graphique 3 présente de plus amples renseignements concernant la composition des ventes des médicaments au prix du fabricant. La baisse de la valeur relative des médicaments de marque non brevetés est particulièrement marquée. En 1995, la valeur des ventes de médicaments de marque non brevetés représentait presque la moitié de la valeur de l'ensemble des ventes de médicaments, mais elle ne représentait plus que 18,9 % de la valeur totale des ventes en 2004. Par ailleurs, la valeur des ventes des médicaments génériques par rapport à l'ensemble des ventes de médicaments a augmenté au cours de la même période, passant de 10,0 % qu'elle était en 1995 à 12,5 % en 2004. Au cours de cette période, la valeur des ventes des médicaments génériques a plus que triplé, passant de 0,6 milliard de dollars à 2,0 milliards de dollars.
Comment expliquer ce ralentissement impressionnant de la croissance des ventes des médicaments brevetés en 2004 ? Les brevets de plusieurs médicaments importants sont venus à échéance en 2004 alors que d'autres médicaments brevetés ont continué de perdre leur part de marché au profit de médicaments non brevetés. Les retraits du marché de médicaments (la plupart effectués au cours du deuxième semestre de l'exercice 2004) ont également contribué, quoique dans une mesure relativement modeste, à une réduction de la croissance de la valeur des ventes.
Des facteurs à plus long terme interviennent également. Tout au long des années quatre-vingt-dix, la croissance des ventes de médicaments brevetés a largement été associée à l'arrivée successive sur le marché de nouveaux médicaments " supervendeurs ". Depuis le début de la présente décennie, l'industrie pharmaceutique n'a pas lancé sur le marché un nombre suffisant de médicaments " supervendeurs " pour maintenir les taux de croissance élevés enregistrés au cours des années quatre-vingt-dix. Les produits lancés sur le marché depuis l'année 2000 ont moins favorisé un accroissement des ventes que ne l'ont fait les médicaments lancés sur le marché à la fin des années quatre-vingt-dix et ce, tant en termes absolus qu'en termes de base de ventes (laquelle, dans le cas des médicaments brevetés, a plus que doublé par rapport à 1999). Le ralentissement de la croissance des ventes des médicaments brevetés a été masqué au cours des premières années de la présente décennie par une progression des ventes de médicaments " supervendeurs " lancés sur le marché canadien à la fin des années quatre-vingt-dix.
Ventes selon la catégorie thérapeutique : Aux fins de ses examens du prix, le CEPMB classe les médicaments suivant le système de classification ATC (Anatomique, Thérapeutique, Chimique) de l'Organisation mondiale de la santé. Ce système hiérarchique classe les médicaments selon leurs utilisations thérapeutiques principales et leur composition chimique. Au plus haut niveau de ce système, à savoir au niveau I, le système ATC classifie les médicaments selon la partie de l'anatomie humaine auxquels ils sont principalement associés.
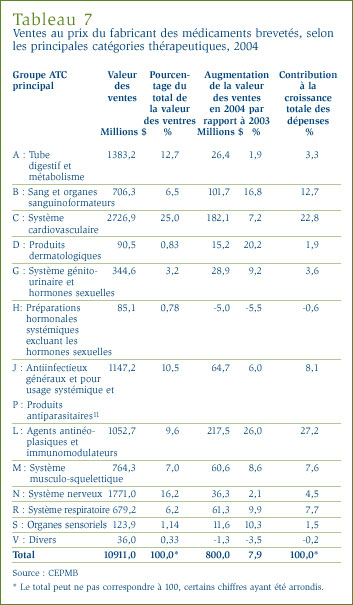
Le tableau 7 ventile selon la catégorie thérapeutique, à savoir les catégories de niveau I, les ventes au prix du fabricant des médicaments brevetés effectuées au Canada en 2004. [10] Le tableau ventile les ventes effectuées en 2004 selon les différentes catégories, leur part de l'ensemble des ventes ainsi que le taux d'augmentation/diminution de la valeur des ventes par rapport à l'exercice précédent. La dernière colonne de ce tableau présente le ratio d'augmentation des ventes des médicaments appartenant aux différentes catégories ATC par rapport à l'augmentation générale des ventes ou, autrement dit, par rapport à la contribution des médicaments de chaque " catégorie ATC " à l'augmentation des ventes. Les valeurs figurant dans cette colonne révèlent les catégories ATC ayant contribué largement à la croissance des ventes. En 2004, ces principaux facteurs étaient les suivants :
- agents antinéoplasiques et immunomodulateurs (à la source de 27,2 % de l'augmentation de la valeur des ventes de médicaments brevetés)
- médicaments pour le système cardiovasculaire, tels que des agents réducteurs de lipides et médicaments servant à traiter l'hypertension (22,8 %)
- médicaments servant à traiter le sang et les organes sanguinoformateurs (12,7 %), et
- antiinfectieux généraux et pour usage systémique (8,1 %).
Ces quatre catégories de médicaments sont à la source de presque les trois quarts de la croissance de la valeur des ventes de médicaments au prix du fabricant entre 2003 et 2004. Ce sont les médicaments pour le système cardiovasculaire qui depuis de nombreuses années constituent la principale source d'augmentation de la valeur des ventes. Quant aux agents antinéoplasiques et aux agents immunomodulateurs (essentiellement utilisés en chimiothérapie), leur contribution à la croissance des ventes est sans précédent. Il est également important de noter que plusieurs catégories thérapeutiques qui étaient jadis considérées comme des facteurs importants d'augmentation de la valeur des ventes - telles que les médicaments utilisés pour traiter le tube digestif et le métabolisme, le système nerveux et le système respiratoire - ont eu peu d'incidence sur la croissance des ventes en 2004.
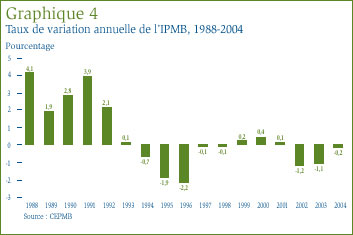
Le CEPMB compile l'Indice des prix des médicaments brevetés (IPMB) qui lui permet d'observer les tendances des prix des médicaments brevetés. L'IPMB mesure la variation moyenne par rapport à l'année précédente des prix du fabricant, soit le prix départ-usine, des médicaments brevetés offerts sur le marché canadien. L'IPMB est calculé chaque année à l'aide des données sur les prix et les ventes dont les brevetés ont fait rapport au CEPMB. [12]
Le graphique 4 présente les variations annuelles de l'IPMB pour les années 1988 à 2004. Selon la mesure prise par l'IPMB, les prix des médicaments brevetés pratiqués par les brevetés ont reculé d'une moyenne de 0,2 % en 2004. Ce résultat s'inscrit dans une suite de diminutions ou d'augmentations négligeables commencée en 1993. Comme cela a été le cas au cours des années antérieures, la stabilité des prix observée en 2004 a été généralisée, la majorité des prix des médicaments brevetés ayant peu ou pas changé.
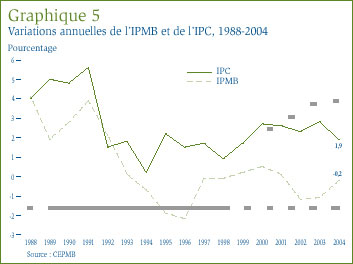
Comparaison de l'IPMB et de l'IPC : La Loi sur les brevets prévoit que le CEPMB doit tenir compte des variations de l'Indice des prix à la consommation (IPC) lorsqu'il est appelé à déterminer si le prix d'un médicament breveté est ou non excessif. Le graphique 5 qui suit présente les variations annuelles de l'IPMB par rapport aux variations de l'IPC pour les mêmes années. L'inflation générale des prix, mesurée au moyen de l'IPC, a été supérieure à l'augmentation moyenne des prix des médicaments brevetés presque chaque année depuis 1988. [13] La situation s'est répétée en 2004 alors que le taux d'inflation mesuré à l'aide de l'IPC dépassait d'environ 2,1%[14] le taux de variation de l'IPMB, quoique l'écart entre ces deux indices s'est considérablement résorbé entre 2003 et 2004.
Il n'est pas surprenant que l'IPMB ait augmenté moins rapidement que l'IPC. Les Lignes directrices du CEPMB prévoient que la moyenne des augmentations des prix des médicaments brevetés sur une période de trois années consécutives ne doit pas être supérieure à la moyenne du taux d'inflation mesuré à l'aide de l'IPC. Les Lignes directrices limitent également les augmentations sur douze mois des prix. En effet, ces augmentations ne peuvent être supérieures à une fois et demie le taux d'inflation de l'année en cours. Ces exigences, appliquées sur une base individuelle aux différents médicaments brevetés, a pour effet de limiter les augmentations de l'IPMB. En pratique, les variations de l'IPMB n'ont jamais atteint cette limite étant donné que certains fabricants n'augmentent pas les prix de leurs médicaments dans toute la mesure autorisée en vertu des Lignes directrices lorsqu'ils ne réduisent tout simplement pas leurs prix.
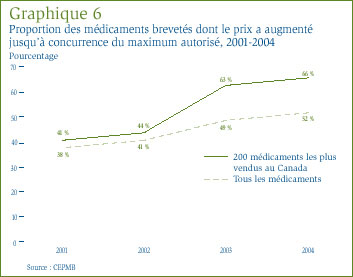
Le graphique 6 présente de l'information sur la mesure dans laquelle les fabricants ont augmenté les prix de leurs médicaments entre 2001 et 2004. En 2004, les prix de 52 % de l'ensemble des médicaments brevetés ont augmenté d'un taux variant entre 0 % et le taux maximal autorisé, alors que cette proportion n'était que de 38 % en 2001. Si l'on restreint l'analyse aux 200 médicaments les plus vendus au Canada en 2004, les prix de 66 % de ces médicaments ont augmenté d'un taux se situant dans les limites autorisées par rapport à seulement 41 % en 2001.
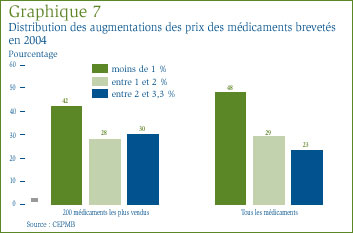
Le graphique 7 présente de l'information sur la mesure dans laquelle les fabricants ont appliqué les augmentations autorisées en vertu des Lignes directrices. On peut y voir que, en 2004, les prix de 48 % des médicaments brevetés ont augmenté de 1 % et les prix de 52 % des médicaments, de 1 à 3,3 %. Si on limite l'analyse aux 200 médicaments brevetés les plus vendus au pays, les prix de 42 % de ces médicaments ont augmenté de 1 % et ceux de 58 % des médicaments, de 1 à 3,3 %. Les Lignes directrices prévoient que les augmentations annuelles des prix des médicaments brevetés ne peuvent représenter plus d'une fois et demie le taux de variation prévu de l'IPC. Pour 2004, le taux maximal d'augmentation des prix des médicaments était de 3,3 %.
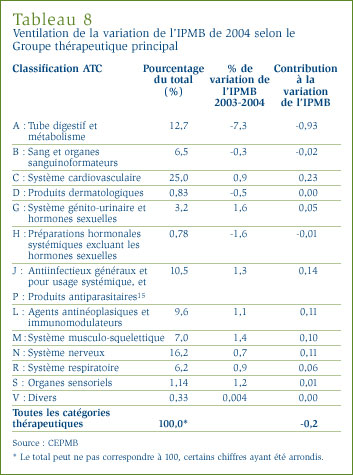
Variation des prix selon la catégorie thérapeutique : Le tableau 8, à la page 24, présente les taux moyens de variation des prix des médicaments brevetés appartenant aux mêmes catégories thérapeutiques.
Ce tableau a été établi en appliquant la méthode de calcul de l'IPMB aux données sur les prix des différents médicaments brevetés appartenant à la même catégorie thérapeutique. Le tableau présente la part des ventes des médicaments brevetés appartenant aux différentes catégories de médicaments brevetés ainsi que le taux moyen de variation des prix. La dernière colonne du tableau est le résultat de la multiplication du taux moyen de variation des prix des médicaments de la catégorie par sa part de l'ensemble des ventes, ce qui donne la " contribution " du groupe de médicaments à la variation de l'IPMB (tel qu'illustré dans le graphique 7). Les valeurs figurant dans cette colonne révèlent les principales catégories de médicaments à la source des variations des prix de l'ensemble des médicaments brevetés.
Les résultats du tableau 8 montrent bien qu'il ne faut pas se fier à une seule mesure générale de variation des prix. Il apparaît d'une façon évidente que plusieurs catégories thérapeutiques ont connu entre 2003 et 2004 des augmentations marquées des prix des médicaments et ce, malgré une baisse de l'IPMB. Il apparaît également clairement que la plus importante influence sur l'IPMB a été la baisse des prix des médicaments utilisés pour traiter le tube digestif et le métabolisme (catégorie A de l'ATC). La contribution de cette catégorie de médicaments contrebalance largement les contributions des autres catégories de médicaments : sans les variations de prix observées au niveau des médicaments de la catégorie A, l'IPMB aurait augmenté d'environ 0,7 %.
Au cours de 2004, le CEPMB a eu vent d'augmentations des prix de médicaments brevetés. En raison du nombre assez élevé d'augmentations de prix rapportées en 2004, le CEPMB a organisé une consultation sur la question des augmentations des prix des médicaments brevetés dont la première étape a été la publication le 8 mars 2005 d'un document de discussion. Le CEPMB poursuivra son analyse de la question des augmentations de prix au cours de l'exercice 2005 et fera rapport de son examen de politique dans son Programme de recherche.
La Loi sur les brevets et le Règlement sur les médicaments brevetés exigent des brevetés qu'ils dévoilent au CEPMB les prix départ-usine publiquement disponibles qu'ils pratiquent dans les sept pays de comparaison nommés dans le Règlement qui sont la France, l'Allemagne, l'Italie, la Suède, la Suisse, le Royaume Uni et les États-Unis. Le CEPMB utilise ces données aux fins suivantes :
- pour effectuer les comparaisons des prix internationaux (CPI) prévues dans les Lignes directrices, et
- pour comparer les prix des médicaments pratiqués au Canada aux prix pratiqués dans d'autres pays.
Le graphique 8 révèle le ratio moyen des prix pratiqués au Canada par rapport à la médiane des prix pratiqués dans les sept pays de comparaison (le prix international médian) pour les années 1987 à 2004. [16] En 1987, les prix canadiens dépassaient en moyenne de 23 % le prix international médian, mais le ratio moyen est passé à 0,93 en 1995 pour ensuite se situer entre 5 et 12 % sous le prix international médian entre 1995 et 2001. Après avoir augmenté à 1,01 en 2002, le ratio moyen est descendu sous la parité. En effet, en 2004, le ratio moyen était de 0,91.
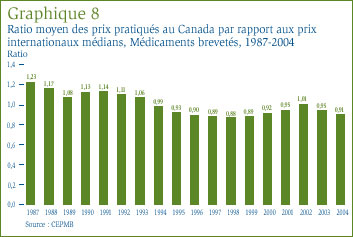
Les statistiques présentées dans le graphique 8 correspondent à une moyenne pondérée du ratio du prix canadien par rapport au prix international médian. Cette moyenne est pondérée en fonction de la valeur des ventes de chaque médicament breveté ayant fait l'objet d'un rapport des prix pratiqués dans l'un ou l'autre des pays de comparaison nommés dans le Règlement. Ce calcul sous-tend la conversion des prix exprimés dans la devise des différents pays de comparaison en équivalents exprimés en dollars canadiens. [17] De cette manière, les variations des ratios moyens permettent de dégager :
- les tendances des prix pratiqués au Canada
- les tendances des prix internationaux
- les variations des taux de change
- les variations des groupes de médicaments couverts (alors que de nouveaux médicaments brevetés sont lancés sur le marché canadien et que d'autres changent de statut suite à l'échéance du brevet), et
- des variations des parts de revenus des différents médicaments.
L'analyse de la sensibilité révèle que les variations des taux de change - et plus particulièrement l'augmentation de la valeur de la couronne suédoise par rapport au dollar canadien [18] - sont grosso modo à la source des trois quarts du recul du ratio moyen entre 2003 et 2004. L'augmentation des prix pratiqués dans les différents pays de comparaison et les variations des pondérations en fonction des ventes sont à la source de l'autre quart. Les mouvements des prix canadiens n'ont pratiquement pas contribué à la baisse du ratio moyen.
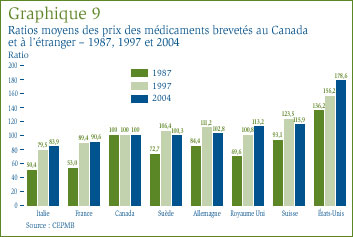
Le graphique 9 illustre la relation entre les prix des médicaments brevetés au Canada et les prix de ces mêmes médicaments dans les sept pays de comparaison. En 1987, les prix pratiqués au Canada étaient généralement inférieurs aux prix pratiqués aux États-Unis, mais supérieurs aux prix pratiqués dans les autres pays de comparaison. Au milieu des années 1990, la situation avait radicalement changé, les prix canadiens se situant alors dans la juste moyenne des prix pratiqués dans les six pays de comparaison européens. La situation n'a guère changé en 2004. En effet, les prix des médicaments brevetés au Canada sont en général inférieurs aux prix pratiqués en Suède, en Allemagne, au Royaume Uni et en Suisse, mais supérieurs aux prix pratiqués en France et en Italie. Comme cela a été le cas au cours des années précédentes, les prix pratiqués aux États-Unis [19] semblent largement supérieurs aux prix pratiqués en Europe et au Canada. L'écart s'agrandit.
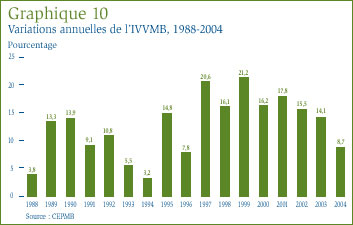
Dans le contexte des médicaments, le concept d' « utilisation » désigne en règle générale les quantités physiques de médicaments vendus ou consommés. Les données sur les prix et sur les ventes utilisées pour calculer l'IPMB permettent également au CEPMB d'observer les tendances quant à l'utilisation faite des médicaments brevetés au Canada. À cette fin, le CEPMB compile l'indice du volume des ventes de médicaments brevetés (IVVMB). [20] Le graphique 10 présente pour les années 1988 à 2004 les taux moyens de croissance de l'utilisation faite des médicaments brevetés mesurés à l'aide de l'IVVMB. Ces résultats confirment qu'au cours des dernières années la croissance de l'utilisation des médicaments brevetés a été la principale cause de l'augmentation des ventes, avec des taux de croissance relativement équivalents aux taux de croissance des ventes. Cette tendance s'est répétée en 2004 : l'utilisation des médicaments brevetés a augmenté de 8,7 %, soit le taux le plus faible observé depuis 1996.
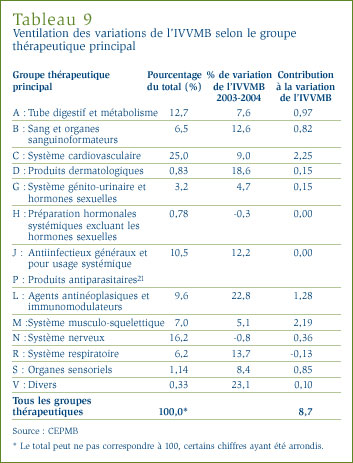
Croissance du volume des ventes de médicaments brevetés selon le groupe thérapeutique : Le tableau 9 présente les taux moyens de croissance de l'utilisation faite des médicaments brevetés ventilés selon les principaux groupes thérapeutiques. Les résultats présentés dans ce tableau ont été obtenus en appliquant la méthodologie de l'IVVMB aux données relatives au volume des ventes de médicaments brevetés des différents groupes thérapeutiques. Le tableau présente la part des ventes des médicaments brevetés selon le groupe thérapeutique ainsi que le taux moyen de croissance de l'utilisation faite des médicaments des différents groupes. La dernière colonne présente la contribution du groupe thérapeutique à la variation de l'IVVMB. Cette contribution a été calculée en multipliant le taux moyen d'utilisation des médicaments des différents groupes par leur part de l'ensemble des ventes. Les valeurs présentées dans cette troisième colonne permettent de reconnaître les groupes de médicaments qui constituent les principales sources de croissance des volumes de vente des médicaments brevetés. Au nombre de ces principales sources, citons les suivantes :
- médicaments utilisés pour traiter le système cardiovasculaire (2,25 % de l'augmentation de l'IVVMB)
- médicaments utilisés pour traiter le système musculo-squelettique (2,19 %)
- agents antinéoplasiques et agents immunomodulateurs (1,28 %).
À l'échelle mondiale, l'industrie de fabrication de médicaments est dominée par des multinationales établies dans plusieurs pays. La plupart de ces multinationales ont des filiales au Canada qui, avec une poignée de fabricants canadiens, exercent la mainmise sur la fabrication, la vente et la distribution de médicaments au Canada.
Selon Statistique Canada, l'industrie canadienne de fabrication de médicaments a livré en 2003 pour 7,8 milliards de dollars de médicaments, ce qui représente 1,4 % de la valeur totale des livraisons du secteur manufacturier canadien. De ce montant de 7,8 milliards de dollars, 3,4 milliards sont associés à l'exportation, ce qui sous-tend que l'industrie pharmaceutique canadienne n'a livré en 2003 que pour environ 4,4 milliards de dollars de la valeur totale des ventes de médicaments au Canada que le CEPMB a estimée à 15,1 milliards de dollars. La part des exportations est encore plus grande si l'on considère que le calcul ne tient compte que des médicaments de marque (étant donné que la plupart des médicaments génériques offerts sur le marché canadien sont fabriqués au Canada). [22] L'industrie canadienne fournit de l'emploi à 29 312 personnes, soit à
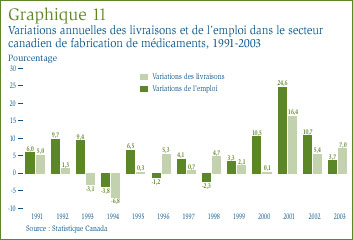
1,5 % de l'effectif du secteur manufacturier. [23] Le graphique 11 présente les taux annuelsde variation des livraisons et des emplois du secteur de la fabrication de médicaments. Au cours de la présente décennie, les taux de croissance de la production et de l'emploi du secteur canadien de fabrication de médicaments sont largement supérieurs à ceux de l'ensemble du secteur manufacturier.
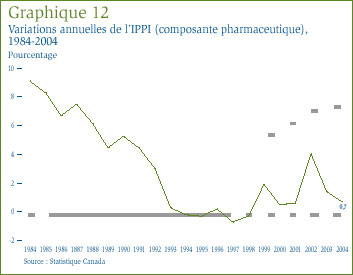
Le contexte se prête à un examen des dernières tendances des prix de vente des médicaments fabriqués au Canada. L'indice des prix des produits industriels (composante pharmaceutique) que compile Statistique Canada a été tout particulièrement conçu à cette fin. [24] Le graphique 12 présente les taux annuels de variation de l'IPPI (composante pharmaceutique) pour les années 1984 à 2004. D'une façon générale, les prix inclus dans l'IPPI (composante pharmaceutique) n'ont pas suivi l'inflation des prix enregistrée au Canada. Le taux d'augmentation de l'IPPI (composante pharmaceutique) a reculé d'une façon constante entre 1984 et 1993. L'indice n'a pratiquement pas bougé entre 1993 et 2001, mais a augmenté de 0,7 % en 2004.
IMS Health fait régulièrement rapport des ventes des fabricants au secteur du détail dans un vaste nombre de pays. Selon IMS Health, ces ventes sur les principaux marchés ont totalisé 452,3 milliards de dollars en 2004. [25] Le graphique 13 présente la répartition de ce montant entre les marchés. Au Canada, les ventes de médicaments ont représenté 2,9 % de l'ensemble des ventes sur les principaux marchés. Le marché des États-Unis est de loin le plus important marché au monde, avec des ventes de médicaments supérieures au total combiné des ventes effectuées au Canada, en France, en Allemagne, en Italie, au Japon et au Royaume Uni.
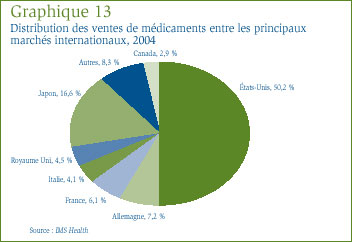
Le graphique 14 présente la part des ventes du Canada sur les principaux marchés pour la période de 2001 à 2004. Cette part des ventes a augmenté d'une façon constante depuis 2001, reflétant le fait que la croissance des ventes au Canada a invariablement dépassé celle sur les autres grands marchés.
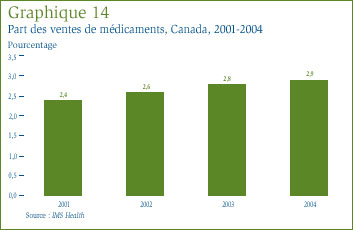
Comme on peut le voir dans le graphique 15, cette tendance s'est maintenue en 2004 alors que la croissance annuelle des ventes au Canada (9%) [26] dépassait encore de la moitié celle des autres grands marchés (6 %).
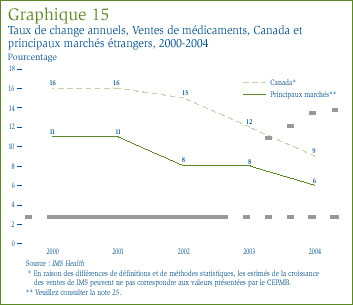
Le graphique 16, qui présente les taux de croissance des ventes sur les différents marchés, montre que la croissance des ventes au Canada était relativement équivalente à celle observée aux États-Unis, mais beaucoup plus importante que celle enregistrée en France, en Allemagne et en Italie.
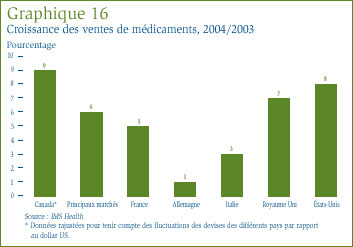
Un bon moyen de comparer les coûts des médicaments à l'échelle internationale est de déterminer la proportion du revenu national du pays que ses résidents investissent dans les médicaments. [27] À cette fin, le graphique 17 présente pour 2002 les dépenses en médicaments sous forme de pourcentage du Produit intérieur brut (PIB) au Canada et dans les sept pays de comparaison nommés dans le Règlement. Le graphique révèle que les dépenses en médicaments représentaient dans ces différents pays entre 1,2 % et 2,0 % du PIB. Le ratio des dépenses en médicaments engagées au Canada par rapport au PIB, qui est de 1,6 %, se situe dans la juste moyenne des ratios des pays de comparaison. En effet, le ratio établi pour le Canada était plus élevé que ceux de la Suède, de la Suisse et du Royaume Uni, mais inférieur aux ratios de la France, des États-Unis et de l'Italie.
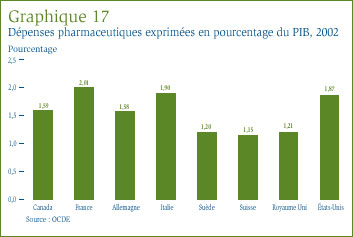
Au cours de la dernière décennie, le pourcentage du revenu national associé aux dépenses pharmaceutiques a augmenté d'une façon appréciable dans la plupart des pays industrialisés. Le tableau 10 montre que, entre 1998 et 2002, les dépenses en médicaments ont augmenté beaucoup plus rapidement que le PIB dans tous les pays mentionnés au graphique 17, exception faite de la Suède. À cet égard, les États-Unis constituent le cas le plus marquant : le taux des dépenses associées aux médicaments a augmenté de presque le triple du taux du revenu national (croissance de 76,8 % des dépenses pharmaceutiques versus croissance de 26,7 % du PIB).
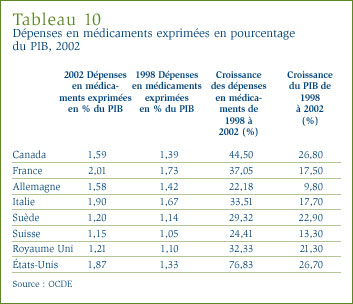
Le Système national d'information sur les médicaments prescrits (SNIUMP) a pour mandat de préparer des analyses critiques sur les tendances des prix des médicaments d'ordonnance, sur l'utilisation qui en est faite et sur les coûts engagés pour l'achat de médicaments. Ces analyses fournissent au régime de santé canadien une mine de renseignements sur l'utilisation faite des médicaments d'ordonnance et sur les facteurs d'augmentation des coûts. L'Institut canadien d'information sur la santé (ICIS) et le CEPMB sont partenaires dans ce système. Un comité directeur formé de représentants de Santé Canada et des différents régimes publics d'assurance-médicaments a été constitué pour conseiller l'ICIS et le CEPMB en matière d'établissement des bases de données du SNIUMP et d'analyses.
Le mandat du SNIUMP compte les deux volets principaux suivants :
- L'élaboration et la mise en oeuvre d'une base de données sur les ordonnances dans laquelle seront colligées les données des différents régimes publics d'assurance-médicaments
- La production d'analyses fondées sur les renseignements tirés de cette base de données.
L'ICIS est responsable du premier volet du mandat tandis que le CEPMB a été appelé, à la demande du ministre de la Santé, à s'occuper du second.
Au cours de leur conférence de septembre 2004, les premiers ministres du pays ont adopté un plan décennal ayant pour objet de rendre les régimes de soins de santé plus sensibles aux besoins de la population et d'assurer leur pérennité. Les premiers ministres ont affirmé qu'aucun Canadien ou Canadienne ne devrait avoir à s'endetter pour obtenir les pharmacothérapies requises. À cette fin, ils ont demandé à leurs ministres de la santé respectifs de constituer un Groupe de travail ministériel qui élaborera et mettra en oeuvre une Stratégie nationale sur les produits pharmaceutiques (SNPP) et qui soumettra un rapport intérimaire d'ici le 30 juin 2006. La Stratégie touchera diverses initiatives dont une analyse des facteurs de coûts et de l'efficience des médicaments, y compris des meilleures pratiques des régimes d'assurance-médicaments.
La SNPP constitue pour le CEPMB une occasion toute choisie de fournir par le truchement du SNIUMP une analyse pointue des tendances des prix, de l'utilisation faite des médicaments et des coûts et toute autre analyse dont pourraient avoir besoin les décideurs. Le défi sera de déterminer quelles autres analyses d'ordre pharmaceutique pourraient être effectuées aux fins de la SNPP dans le cadre du SNIUMP.
Afin que les analyses effectuées au titre du SNIUMP répondent dans toute la mesure du possible aux besoins des décideurs des régimes publics et qu'elles contribuent à relever les défis et à saisir les possibilités qu'offre la Stratégie nationale, le Comité directeur du SNIUMP prévoit effectuer une évaluation des besoins en matière d'information et d'analyse concernant la gestion et l'utilisation des produits pharmaceutiques. L'évaluation des besoins servira à déterminer les priorités des initiatives menées au titre du SNIUMP ainsi que le travail à faire pour améliorer ou pour concevoir des stratégies efficaces dans les secteurs pauvres de l'information. Tout dépendant des résultats, les projets menés au titre du SNIUMP seront peaufinés et d'autres seront ajoutés. Les projets du SNIUMP font l'objet d'un rapport dans notre Programme de recherche publié sur notre site Web sous la rubrique " Publications ".
Vous trouverez des renseignements sur la participation du CEPMB et de l'ICIS au SNIUMP dans les sites Web de nos deux organismes dont les adresses sont www.pmprb-cepmb.gc.ca et www.cihi.ca/drugs.
En contrepartie de l'adoption en 1987 des modifications à la Loi sur les brevets (Loi), les Compagnies de recherche pharmaceutique du Canada (Rx&D) se sont engagées pour le compte de l'industrie des médicaments de marque à investir dans la recherche-développement (R-D) au Canada au moins 10 % de la valeur des recettes tirées de leurs ventes et ce, à compter de l'année 1996. [28]
En application de la Loi, le CEPMB comptabilise les dépenses annuelles des brevetés dans la R-D et en fait rapport. Le CEPMB n'a toutefois pas droit de regard sur le type de recherche-développement effectuée ni sur les sommes investies dans la R-D par les brevetés. Le présent chapitre révèle les principales statistiques sur les investissements actuellement faits dans la recherche-développement pharmaceutique au Canada.
Source des données
L'information présentée dans la présente section est tirée des rapports soumis par les brevetés. La Loi oblige les brevetés à faire rapport au CEPMB des recettes qu'ils tirent des ventes de leurs médicaments, y compris des recettes tirées des ventes de médicaments non brevetés et des recettes découlant d'ententes de production sous licence ainsi que des dépenses de R-D qu'ils engagent au Canada pour leurs différents médicaments. La Loi n'oblige pas les brevetés qui n'ont fait aucune vente au cours de l'exercice à soumettre un rapport sur leurs dépenses de R-D. Étant donné que de nouveaux brevets sont accordés chaque année alors que d'autres arrivent à échéance, la liste des sociétés tenues de faire rapport de leurs dépenses de R-D varie d'année en année.
Le Règlement sur les médicaments brevetés (Règlement), exige qu'un fondé de pouvoir de la société pharmaceutique certifie l'exactitude de l'information fournie au CEPMB. Le Conseil ne vérifie pas systématiquement l'information qui lui est présentée, mais cherche plutôt à relever toute anomalie ou contradiction et, lorsqu'il y a lieu, demande aux brevetés de corriger leurs données ou de les étoffer. Pour confirmer que les données qu'il a soumises ont été bien interprétées, chaque breveté est invité à confirmer, avant la publication du rapport annuel, l'exactitude du ratio de ses dépenses de R-D par rapport aux recettes tirées des ventes calculé par le CEPMB.
En 2004, 84 sociétés pharmaceutiques distribuant des médicaments brevetés pour usage humain ou pour usage vétérinaire ont soumis au CEPMB un rapport sur leurs dépenses de R-D. De ce nombre, 37 étaient membres de Rx&D.
Défaut de présenter un rapport au CEPMB
Dans son Rapport annuel pour l'exercice 2003, le CEPMB mentionnait qu'il menait une enquête sur le défaut de Draxis Health Inc. de présenter un rapport sur ses dépenses de R-D pharmaceutique. Le dossier a depuis été fermé à la suite de la présentation par Draxis Health Inc. des données sur ses dépenses de R-D pour l'exercice 2003.
Recettes tirées des ventes
Pour des fins de rapport, les recettes tirées des ventes s'entendent des recettes tirées des ventes de médicaments [29] au Canada ainsi que des recettes découlant d'ententes de vente sous licence.
Comme l'illustre le tableau 11, à la page 32, la valeur des recettes tirées des ventes de médicaments au Canada déclarées par les brevetés a totalisé 14,2 milliards de dollars en 2004, soit 4 % de plus qu'en 2003. De ce montant, moins de 1 % des recettes découlent des ententes de vente sous licence. Les recettes tirées des ventes déclarées par les brevetés membres de Rx&D ont totalisé 11,8 milliards de dollars sur la même période, ce qui représente 83,1 % du total des recettes tirées des ventes.
Dépenses de R-D
En vertu de l'article 6 du Règlement, les brevetés ne doivent inclure dans leurs rapports que leurs dépenses de R-D qui auraient été admissibles au crédit d'impôt à l'investissement pour la recherche scientifique et le développement expérimental aux termes de la Loi de l'impôt sur le revenu, dans sa version du 1er décembre 1987. Ainsi, les dépenses de R-D peuvent inclure les dépenses courantes, les coûts d'immobilisation et l'amortissement autorisé. Les frais engagés pour les études de marché, la promotion des ventes, le contrôle de la qualité ou les essais systématiques de matériel, de dispositifs ou de produits ainsi que pour la collecte de données courantes n'étant pas admissibles au crédit d'impôt à l'investissement, ils ne doivent pas être déclarés dans les rapports au CEPMB.
Comme le montre le tableau 11, la valeur des dépenses de R-D déclarées par l'ensemble des brevetés a totalisé 1 170,0 millions de dollars en 2004, soit 0,2 % de moins qu'en 2003. Les dépenses déclarées par les brevetés membres de Rx&D ont totalisé 1 008,3 millions de dollars en 2004, ce qui représente 86,2 % du total des dépenses de R-D déclarées.
Ratios de dépenses de r-d par rapport aux recettes tirées des ventes
Le ratio des recettes de R-D par rapport aux recettes tirées des ventes du secteur de la production de médicaments brevetés est de 8,3 % pour 2004. Quant au ratio des brevetés membres de Rx&D, il est passé de 9,1 % qu'il était en 2003 à 8,5 % en 2004.
Comme le montre le graphique 18, à la page 33, les ratios de dépenses de R-D par rapport aux recettes tirées des ventes pour tous les brevetés et pour les brevetés membres de Rx&D ont augmenté entre 1988 et le milieu des années 1990, mais ont baissé au cours des dernières années. Pour tous les brevetés, membres ou non de Rx&D, les ratios des dépenses de R-D par rapport aux recettes tirées des ventes n'ont jamais été aussi bas depuis 1989.
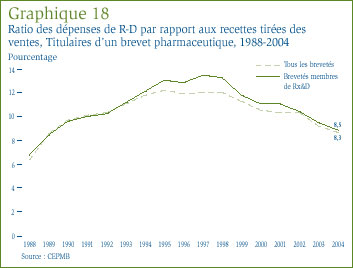
Le tableau 13 à l'annexe 3, à la page 49, affiche les ratios des dépenses de R-D par rapport aux recettes tirées des ventes. Des 84 brevetés ayant soumis des rapports sur leurs dépenses de R-D au CEPMB, 66 ont présenté pour 2004 un ratio de R-D par rapport aux recettes tirées des ventes de 10 % et moins. Les recettes de ces derniers brevetés représentaient 68,7 % de l'ensemble des recettes tirées des ventes.
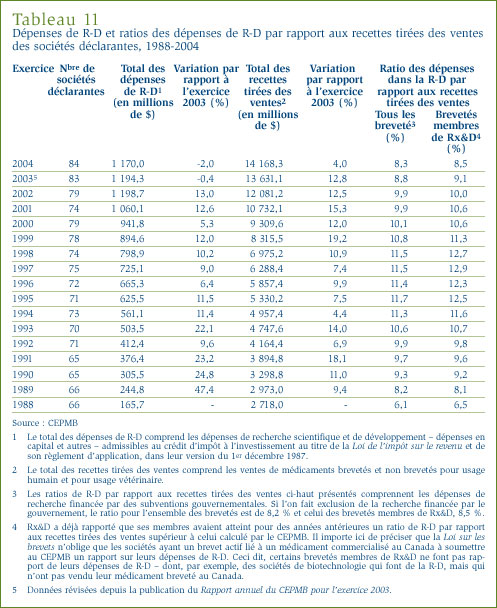
Le tableau 14, à l'annexe 3, à la page 49, constitue une liste de tous les brevetés ayant présenté des rapports au CEPMB et leurs ratios respectifs de dépenses de R-D par rapport aux recettes tirées des ventes.
Dépenses courantes de r-d selon le type de dépenses
En 2004, les dépenses courantes de R-D [30] ont totalisé 1 124,2 millions de dollars, soit 96,1 % de l'ensemble des dépenses de R-D. Les coûts d'acquisition de biens d'équipement et les coûts d'amortissement admissibles représentent respectivement 2,4 % et 1,5 % de l'ensemble des dépenses de R-D.
Dépenses courantes de r-d selon le type de recherche
Le tableau 15, à l'annexe 3, à la page 52, ventile les dépenses courantes de R-D engagées en 2004 selon le type de recherche, à savoir la recherche fondamentale, la recherche appliquée et autres types de recherche admissible. La recherche fondamentale désigne les travaux effectués pour faire avancer les connaissances scientifiques, sans application spécifique en vue. Les brevetés ont fait état de dépenses de recherche fondamentale totalisant 221,7 millions de dollars ou 19,7 % du total des dépenses courantes de R-D. Comme on peut le voir dans le graphique 19, la valeur des dépenses dans la recherche fondamentale a augmenté de 23 % en 2004 par rapport à l'exercice précédent.
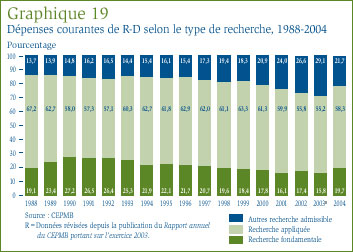
La recherche appliquée vise une application pratique, notamment l'amélioration des procédés de fabrication, les essais précliniques et les essais cliniques. Les brevetés ont déclaré des dépenses dans la recherche appliquée totalisant 658,3 millions de dollars ou, encore, 58,3 % des dépenses courantes de R-D. Les essais cliniques ont accaparé 76,2 % des dépenses de recherche appliquée.
Les dépenses au titre " autre R-D admissible " (qui comprennent les coûts engagés pour la préparation des rapports réglementaires, les études sur la biodisponibilité et la phase IV des essais cliniques) ont représenté en 2004, 21,7 % des dépenses courantes de R-D.
Dépenses courantes de r-d selon le milieu de recherche et la provenance des fonds
Les titulaires de brevets pharmaceutiques peuvent inclure dans leurs dépenses de R-D la recherche qu'ils effectuent eux-mêmes à l'interne ainsi que la recherche qu'ils font effectuer à l'externe, notamment par des universités, des hôpitaux et d'autres sociétés pharmaceutiques. Le tableau 16, présenté à l'annexe 3, à la page 53, révèle qu'un peu plus de la moitié (55 % des dépenses courantes de R-D) de la recherche a été effectuée par les brevetés eux-mêmes. La valeur de la recherche effectuée à l'externe pour le compte des brevetés a augmenté en 2004 pour représenter 20,9 % de l'ensemble des dépenses courantes de R-D. Quant à la recherche effectuée par les universités et par les hôpitaux, sa valeur a représenté 13,2 % des dépenses courantes de R-D.
En 2004, comme pour les exercices précédents, la plupart des activités de R-D effectuées par les brevetés ont été financées à l'interne. (Pour de plus amples détails, voir le Tableau 17, à l'annexe 3, à la page 53).
Dépenses courantes de r-d selon la région géographique
Les tableaux 18 et 19, que vous trouverez à l'annexe 3, aux pages 53 et 54, ventilent les dépenses courantes de R-D selon les provinces dans lesquelles elles ont été engagées. En 2004, les dépenses de R-D ont augmenté dans toutes les provinces du Canada, sauf en Ontario. Cette année encore, les dépenses ont été surtout engagées en Ontario et au Québec qui ont ainsi accaparé 88,5 % de la valeur totale des dépenses courantes de R-D au Canada.
Programme de recherche
Chaque année, le CEPMB établit son programme de recherche dans le cadre de son processus de planification annuelle. Ce programme présente les projets en cours, les projets en préparation ainsi que les projets sur le point d'être mis en oeuvre. Il présente également les initiatives soumises à des consultations publiques ou qui pourraient l'être.
Le Système national d'information sur l'utilisation des médicaments prescrits (SNIUMP), un partenariat avec l'Institut canadien d'information sur la santé (ICIS), a été mis en oeuvre au cours de l'exercice 2002. Au titre de ce système, le CEPMB a effectué en 2004 diverses études de recherche sur la gestion et sur l'utilisation de produits médicamenteux. Les projets de recherche effectués au titre du SNIUMP sont inscrits à notre programme de recherche.
Notre programme de recherche fait également état de consultations récemment menées sur les modifications proposées au Règlement sur les médicaments brevetés ainsi que sur les augmentations des prix des médicaments brevetés.
Notre programme de recherche est affiché sur notre site Web sous la rubrique " Publications ". Des mises à jour sont publiées dans notre feuillet d'information trimestriel intitulé La Nouvelle.
Projet d'examen des échéanciers
Dans le deuxième rapport qu'il a soumis en novembre 2001 au Conseil, le Groupe de travail sur les questions relatives à l'examen des prix [31] a recommandé d'assujettir le processus d'examen du prix à des étapes et à un échéancier. Considérant cette recommandation ainsi que les difficultés que posent à nos experts scientifiques les nouveaux médicaments, les nouveaux types de rapports des brevetés et les pressions exercées par les brevetés pour être autorisés à étoffer leurs rapports et même à en présenter d'autres, le CEPMB a entrepris le Projet d'examen des échéanciers.
Dans notre rapport annuel de 2003, nous avons fait rapport de différentes mesures prises à l'interne pour apporter d'autres changements au processus d'examen du prix des médicaments et pour mener une consultation publique sur le projet d'examen des échéanciers. En 2004, le CEPMB a apporté d'autres améliorations à son processus d'examen de prix. Il a entre autres publié le calendrier des réunions du Groupe consultatif sur les médicaments pour usage humain (GCMUH) pour l'année 2005 et fixé les délais de présentation des mémoires des brevetés aux fins d'examen par le GCMUH. Ces mesures ont été adoptées pour donner plus de transparence au processus d'examen scientifique et le rendre plus efficient.
Il est apparu en cours de projet que l'information que les brevetés soumettent au CEPMB a une incidence sur le processus d'examen du prix des médicaments en ce sens qu'elle doit être totalement reçue avant que ne puisse commencer le processus d'examen scientifique. Dans la livraison de janvier 2005 de La Nouvelle, le CEPMB a publié un Avis et commentaires relativement aux modifications proposées au Règlement sur les médicaments brevetés. Selon une des modifications proposées, les brevetés seraient tenus de soumettre au Conseil des monographies de leurs médicaments. Les intervenants avaient jusqu'au 15 avril pour déposer leurs mémoires sur les différentes modifications proposées. Le Conseil fera rapport des prochaines étapes de ce projet dans une livraison future de La Nouvelle lorsqu'il aura pris connaissance des mémoires reçus.
Le Projet d'examen des échéanciers aura comme prochaines étapes l'adoption d'échéanciers pour les différentes étapes du processus d'examen des prix et à la tenue d'une consultation auprès de l'industrie et d'autres intervenants.
Le CEPMB fera rapport de l'évolution de ce projet sur son site Web et par le truchement de La Nouvelle.
Modifications proposées au Règlement - Consultation publique
Dans la livraison de janvier 2005 de La Nouvelle, le Conseil a invité ses intervenants à participer à une consultation sur les modifications proposées à son Règlement sur les médicaments brevetés, 1994. Ce Règlement spécifie les renseignements dont les brevetés doivent faire rapport comme l'exige la Loi sur les brevets. Il spécifie également les délais dans lesquels les rapports doivent être présentés au CEPMB.
Depuis son adoption en 1988, le Règlement n'a été modifié en profondeur qu'une seule fois, soit en 1994, essentiellement afin de l'adapter aux nouvelles exigences de la Loi sur les brevets modifiée.
Dix années plus tard, certains aspects du Règlement doivent être actualisés afin de mieux refléter les renseignements dont a besoin le CEPMB dans l'exercice des responsabilités qui lui sont dévolues en vertu de la Loi. Ces modifications visent à améliorer les délais d'examen du prix des médicaments qu'effectue le CEPMB et à établir une distinction entre les médicaments brevetés pour usage humain et les médicaments brevetés pour usage vétérinaire en ce qui a trait aux informations qui doivent être divulguées au Conseil.
Le Conseil avait fixé au 15 avril 2005 la date limite de réception des mémoires des intervenants concernant les modifications proposées au Règlement. Le Conseil fera rapport dans son Programme de recherche du suivi qu'il donnera à cette initiative et publiera les mémoires reçus.
Augmentations des prix des médicaments brevetés : Consultation publique
En 2004, le CEPMB a appris, après avoir pris connaissance de certaines publications et de rapports d'intervenants, que les fabricants d'un nombre assez élevé de médicaments brevetés se préparaient à augmenter les prix de leurs médicaments brevetés. Même si les Lignes directrices du CEPMB sur les prix excessifs autorisent des augmentations de prix dans les limites des variations de l'Indice des prix à la consommation, le nombre élevé d'augmentations de prix ne manque pas de soulever certaines questions.
Au cours de la dernière décennie, le Canada a réussi à stabiliser les prix des médicaments brevetés grâce à des politiques comme la réglementation des prix par le CEPMB et à des stratégies de limitation des coûts des régimes publics d'assurance-médicaments. Les récents rapports d'augmentations des prix amènent le CEPMB à se demander si le Canada est à la veille de connaître un changement en matière d'établissement des prix des médicaments brevetés, ce qui pourrait mettre un terme à une décennie de stabilité des prix. De plus, au moment où les augmentations de prix allaient être appliquées au Canada, certains pays imposaient d'autres limites sur les prix des médicaments.
Suite à ces rapports d'augmentations des prix, le CEPMB a annoncé en novembre 2004 son intention de réviser ses Lignes directrices sur les augmentations des prix des médicaments brevetés. [32] À cette fin, le CEPMB a le 8 mars 2005 engagé un dialogue avec les intervenants en publiant un document de discussion. Ce document rappelle l'évolution des Lignes directrices sur les augmentations des prix des médicaments brevetés et des tendances des prix et pose aux intervenants diverses questions concernant les augmentations des prix.
Le Conseil ne prendra en compte que les mémoires reçus en date du 9 mai 2005, soit la fin de la période d'Avis et de commentaires. Le Conseil fera rapport du suivi à ce projet et de ses mises à jour par le truchement de la prochaine livraison de La Nouvelle et de son Programme de recherche.
Projet relatif au système de double prix
Après avoir accepté l'engagement de conformité volontaire soumis pour le médicament Fasturtec, le CEPMB a entrepris de faire un examen de la pratique de certains fabricants qui tiennent pour leurs médicaments brevetés des prix de liste élevés qui n'ont aucune mesure avec les prix de vente moyens au Canada.
En juin 2004, le CEPMB a mis fin aux procédures qu'il avait engagées concernant le médicament breveté Fasturtec en acceptant l'engagement soumis par Sanofi-Synthélabo Canada Inc. (Sanofi). L'engagement prévoyait une baisse marquée du prix du Fasturtec, qui passait le 295 $ à 125 $ la fiole. Toutefois, Sanofi a indiqué dans son document d'engagement son intention de maintenir un prix de liste élevé pour son médicament tout en donnant l'assurance qu'aucun client canadien n'aurait à payer le Fasturtec à un prix plus élevé que le prix réduit. (Vous trouverez l'engagement et le communiqué sur notre site Web sous les rubriques " Publications " et " Engagements de conformité volontaire ".
Cette problématique étant nouvelle, le personnel du Conseil a recommandé au Conseil d'en faire l'examen dans les meilleurs délais.
Au cours des derniers mois, cette pratique de maintien d'un prix de liste élevé a également été portée à l'attention du CEPMB par le truchement de demandes d'information à caractère non officiel sans toutefois qu'aucune proposition ne soit faite. Ces demandes confirment l'intention de certains fabricants de pratiquer des prix de liste élevés et d'offrir en contrepartie des escomptes et des rabais pour que les prix de transaction moyens des médicaments brevetés se maintiennent dans les limites du prix maximum non excessif comme l'exigent les Lignes directrices sur le CEPMB.
Le Conseil est préoccupé par l'incidence négative que pourrait entraîner cette pratique de double prix, tant sur le consommateur et la protection de ses intérêts que sur la transparence du processus de fixation des prix des médicaments brevetés au Canada.
Le Conseil fera rapport aux moments opportuns de l'évolution de ce projet par le truchement du Programme de recherche du CEPMB. Le Programme de recherche est affiché sur notre site Web sous la rubrique " Publications ".
Communications
Le programme des communications du CEPMB fournit un cadre de gestion des volets importants de sa stratégie et ses pratiques. Ce service essentiel se révèle particulièrement utile pour les processus de prise de décisions et de préparation de rapports.
Le programme de communication, qui relève du Secrétariat, s'occupe entre autres de l'élaboration et de l'application des politiques, des plans et des activités de communication du CEPMB. Le Secrétariat répond également aux demandes d'information du grand public et assure la gestion, la gouverne et l'organisation des différentes activités de communication, ce qui englobe les relations avec les médias. Le Secrétariat participe également à la gestion collective des activités du CEPMB.
Le CEPMB s'est doté d'un plan de communications particulièrement solide afin de mieux faire connaître et comprendre son mandat, son rôle et son champ de compétences.
Au cours de l'exercice 2004, le CEPMB s'est tout particulièrement attaché à offrir des outils de communication efficaces pour vanter les vertus d'un partenariat entre les intervenants et les consommateurs et a utilisé pour ce faire les nouveaux modes de communication. Il a requinqué son site Web en juin pour le rendre plus convivial et plus interactif. Ce site offre entre autres la possibilité de s'inscrire en ligne sur la liste d'envoi de nos publications papier ou électroniques. Nous avons également ajouté à notre site la rubrique Foire aux questions qui est régulièrement consultée par les visiteurs à la recherche d'information sur notre organisme. La configuration et la conception graphique ont également été refaites pour faciliter la navigation de manière à mieux satisfaire aux besoins des internautes.
Les éléments centraux de notre Programme de communications demeurent la transparence, l'intégrité et l'accessibilité.
Le Conseil est formé d'au plus cinq membres siégeant à temps partiel, dont un président et un vice-président. Les membres du Conseil sont nommés par le gouverneur en conseil. En vertu de la Loi sur les brevets, le président du Conseil assume également les fonctions de chef de la direction du CEPMB et, à ce titre, est investi de la responsabilité de la supervision et de la direction des activités du Conseil. Une directrice exécutive supervise le travail du personnel. Les cadres supérieurs du CEPMB sont la directrice exécutive, la directrice de la conformité et de l'application, le directeur des politiques et de l'analyse économique, le directeur des services généraux, la secrétaire du Conseil et la conseillère juridique principale.
Le Dr Robert G. Elgie, président du CEPMB depuis 1995, a terminé le 7 mars 2005 un mandat de dix années à la barre du CEPMB. Le vice-président en poste, M. Réal Sureau, assume les fonctions de la présidence du CEPMB depuis le 8 mars 2005 d'ici à ce que soit nommé un successeur au Dr Elgie. Le mandat de M. Sureau, qui aura couvert une période de dix ans, arrivera à échéance en octobre 2005.
Le Dr Brien Benoit a été nommé Membre du Conseil le 19 mai 2005 pour une période de cinq ans. M. Anthony Boardman, qui a terminé en janvier 2004 un premier mandat de cinq ans à titre de membre du Conseil, a été reconduit dans ses fonctions le 11 mars 2005 pour un autre mandat de cinq ans.
Mme Ingrid Sketris a terminé son mandat à titre de membre du Conseil en mai 2004.
M. Wayne Critchley, qui a occupé le poste de directeur exécutif du CEPMB pendant 15 ans, a pris une retraite bien méritée. Lui succède dans ce poste Mme Barbara Ouellet, auparavant directrice de la Division de la qualité des soins, de la technologie et des produits pharmaceutiques de la Direction générale des politiques de santé de Santé Canada.
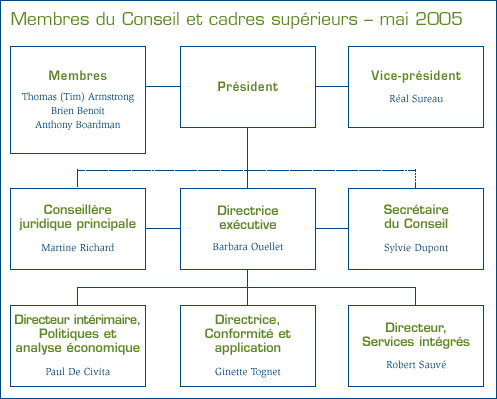
Président : Robert G. Elgie,
C.M., LL.B., M.D., F.R.C.S. (C), LL.D. (hon.)
Le Dr Elgie a été nommé membre et président du Conseil en mars 1995. Il a été reconduit dans ses fonctions pour un deuxième mandat, celui-là allant de mars 2000 à mars 2005. Son mandat a donc pris fin le 7 mars 2005.
Avocat et neurochirurgien, membre du Collège royal des chirurgiens du Canada, le Dr Elgie a fondé en 1991 l'Institut du droit de la santé de l'Université de Dalhousie qu'il a dirigé jusqu'en 1996. De 1992 à 1996, il a occupé à temps partiel le poste de président de la Commission des accidents de travail de la Nouvelle-Écosse. Le Dr Elgie a enseigné à la faculté de médecine des universités Queen's et Toronto. Il a occupé plusieurs postes à l'Hôpital général de Scarborough, dont celui de chef du corps médical. En 1977, il a été élu à l'Assemblée législative de l'Ontario et a occupé plusieurs postes au sein du Cabinet. Il a quitté l'Assemblée législative en septembre 1985 pour occuper jusqu'en 1991 le poste de président de la Commission des accidents de travail de l'Ontario. En octobre 2000, le Dr Elgie a été nommé membre du Conseil de presse de l'Ontario.
En mai 2001, le Dr Elgie a reçu un doctorat honorifique en droit de l'Université de Dalhousie en reconnaissance de ses réalisations insignes. En janvier 2003, le Dr Elgie a été nommé membre de l'Ordre du Canada.
Vice-président : Réal Sureau, F.C.A.
Monsieur Sureau a été nommé membre et vice-président du Conseil en octobre 1995. En octobre 2000, il a été reconduit dans ses fonctions actuelles pour un mandat allant d'octobre 2000 à octobre 2005. Depuis la fin du mandat du Dr Elgie, il assume les fonctions de la présidence du CEPMB.
Monsieur Sureau, qui est comptable agréé depuis 1963, a fait ses études aux universités Queen's et McGill. De 1957 à 1973, Monsieur Sureau a exercé les fonctions d'expert et de vérificateur comptable dans un cabinet régional. De 1973 à 1982, il a occupé le poste de vice-président aux Finances à la scierie Forex Inc. De 1982 à 1992, il a été directeur financier du groupe Canam Manac, un leader nord-américain de la fabrication de poutres d'acier triangulé et de semi-remorques. Il a par la suite poursuivi sa carrière comme expert-conseil en affaires et directeur d'entreprise.
Monsieur Sureau a été membre de l'Ordre des comptables agréés du Québec et a siégé à plusieurs de ses comités. Il en a également été le président en 1995-1996. Il a reçu le titre honorifique de Fellow comptable agréé en 1986.
Monsieur Sureau est président du cabinet Gestion Sureau Limitée. Depuis 1982, Monsieur Sureau a siégé à différents conseils d'administration d'émetteurs assujettis et d'organismes privés, dont Gaz Métro Inc. où il siège à titre de membre du conseil d'administration, du comité de gouvernance, du comité de la caisse de retraite et, depuis 1995, de président du comité de vérification. De plus, depuis 2005, Monsieur Sureau est membre du Comité sur le fonds de pension de la Société canadienne de la Croix-Rouge.
Membres du Conseil :
Thomais (TIM) Armstrong
C.R., O. Ont.
M. Armstrong a été nommé membre du Conseil le 3 octobre 2002 pour un mandat qui se terminera en octobre 2007.
Avocat de profession, M. Armstrong a connu une brillante carrière dans la fonction publique de l'Ontario. Il a été président du Conseil des relations de travail de l'Ontario de 1974 à 1976, sous-ministre du travail de 1976 à 1986, agent général de l'Ontario à Tokyo de 1986 à 1990, sous-ministre de l'Industrie, du commerce et de la technologie de 1991 à 1992, et conseiller du Premier ministre de l'Ontario en matière de développement économique de 1992 à 1995. Depuis 1996, il siège comme représentant principal du Canada à la Japan Bank for International Cooperation. Il siège également comme arbitre et médiateur dans les modes alternatifs de règlement de conflits, plus particulièrement en relations de travail.
M. Armstrong a reçu l'Ordre de l'Ontario en 1995 pour sa contribution insigne à la fonction publique de la province.
Brien G. Benoit,
M.D., F.R.C.S. (C), F.A.C.S.
Le Dr Benoit a été nommé membre du CEPMB pour un mandat allant de mai 2005 à mai 2010.
Le Dr Benoit, un neurochirurgien, est membre du Corps des médecins titulaires actifs à l'hôpital d'Ottawa. Le Dr Benoit a occupé divers postes administratifs au cours de sa carrière, dont médecin-chef à l'hôpital Civic d'Ottawa de 1996 à 1998, médecin-chef des résidents en neurochirurgie à l'Université d'Ottawa de 1995 à 2003, titulaire de la chaire en neurochirurgie à l'Université d'Ottawa de 1997 à 2003, et chirurgien chef adjoint au Campus Civic de l'hôpital d'Ottawa de 2002 à 2004. De 1993 à 2004, le Dr Benoit a également occupé le poste de président du comité de la salle d'opération au Campus Civic.
Le Dr Benoit a publié de nombreux articles dans des revues spécialisées et a mérité diverses distinctions, dont le prix d'excellence en enseignement chirurgical du département de chirurgie de l'Université d'Ottawa qui lui a été décerné en 1991 et en 2000.
En plus d'être Fellow du Collège royal des chirurgiens du Canada (Neurochirurgie), le Dr Benoit est membre de plusieurs associations professionnelles, dont l'Association médicale canadienne, l'Association médicale de l'Ontario, le Collège royal des médecins et chirurgiens du Canada et le American College of Surgeons pour ne nommer que celles-là.
Anthony Boardman
B.A., Ph.D.
M. Boardman a siégé au Conseil de janvier 1999 à janvier 2004. Il a été reconduit dans ses fonctions pour un deuxième mandat, celui-là allant de mars 2005 à mars 2010.
M. Boardman est professeur Van Dusen d'administration des affaires, Division de la stratégie et de l'économie d'entreprise au Saunder School of Business de l'Université de la Colombie-Britannique. M. Boardman est diplômé (B.A., 1970) de l'Université Kent de Canterbury en Angleterre ainsi que de l'Université Carnegie-Mellon (Ph.D., 1975). Avant d'enseigner à l'Université de la Colombie-Britannique, M. Boardman a enseigné à la Wharton School de l'Université de la Pennsylvanie.
Les domaines de recherche auxquels s'intéresse actuellement M. Boardman sont les partenariats publics-privés, l'analyse coûts-avantages et la gestion stratégique. M. Boardman a également oeuvré comme expert-conseil pour différents organismes privés et publics, dont Vodafone, Stora Enzo, Pricewaterhouse Coopers, le Trésor de la Nouvelle-Zélande ainsi que les différents niveaux de gouvernement au Canada. M. Boardman a enseigné à des cadres supérieurs dans différents pays et a reçu des prix soulignant ses activités en enseignement, dont le prix Alan Blizzard.
Au cours de sa carrière, M. Boardman a signé de nombreux articles savants. Il travaille actuellement à la préparation de la troisième édition de son livre Cost-Benefit Analysis: Concepts and Practice publié par Prentice Hall.
Ingrid S. Sketris,
BSc(Phm), Pharm.D., MPA(HSA)
Mme Sketris a siégé au Conseil de mai 1999 à mai 2004.
Mme Sketris est professeure au Collège de pharmacie et à l'École des études en administration des services de santé de l'Université de Dalhousie. Elle est également professeure au département de la santé communautaire et d'épidémiologie de cette même université. Elle travaille à titre d'experte-conseil en pharmacie auprès du département de pharmacie du Centre des sciences de la santé Queen Elizabeth II de Halifax. Depuis 2000,
Mme Sketris est titulaire de la chaire en services de recherche sur la santé de la Fondation canadienne de recherche sur les services de santé/Institut canadien de recherche en santé (cofinancée par la Nova Scotia Health Research Foundation).
Mme Sketris est diplômée de l'Université de Toronto (BSc(Phm), 1977), de l'Université du Minnesota (Pharm.D, 1979), de l'University of Tennessee Center for the Health Sciences (résidence en toxicologie clinique/pharmacie, 1980) ainsi que de l'Université de Dalhousie (MPA(HSA) 1989).
Mme Sketris est Fellow de l'Association canadienne des pharmaciens d'hôpitaux et du American College of Clinical Pharmacy. De 1996 à 1998, elle a été membre du comité consultatif scientifique de l'Office canadien de coordination de l'évaluation des technologies de la santé. Au niveau de la recherche, Mme Sketris s'intéresse tout particulièrement à l'incidence des changements de la politique d'assurance-médicaments et à l'utilisation des médicaments et des services de santé par la population de la Nouvelle-Écosse.
Mme Sketris siège actuellement comme représentante du CEPMB au comité de l'Institut canadien d'information sur la santé (ICIS) chargé d'examiner l'utilisation faite du Système de classification anatomique, thérapeutique, chimique (ATC) et des doses thérapeutiques quotidiennes (DTQ) dans les analyses.
Mme Sketris a publié de nombreux articles traitant de la thérapeutique pour les cas de grefffe et de la pharmacoépidémiologie.
Pour l'exercice 2004-2005, le Conseil dispose d'un budget de $5 417 000 $ et d'un effectif approuvé de 44 employés. Ce budget inclut la somme de 424 000 $ pour la Stratégie d'accès thérapeutique [33] et 832 000 $ pour le Système national d'information sur l'utilisation des médicaments prescrits (SNIUMP). [34]
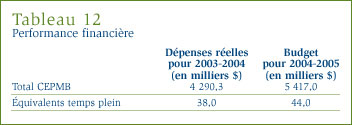
Vous trouverez de plus amples renseignements concernant le budget du CEPMB sur notre site Web sous la rubrique " Rapports au Parlement ".
Le CEPMB ne ménage aucun effort pour bien informer tous ses intervenants et ce, entre autres à l'aide de ses publications. Certaines publications, dont le Rapport annuel et La Nouvelle, sont publiées à intervalles réguliers alors que d'autres sont publiées aux moments opportuns, en réponse à un programme ou pour satisfaire les besoins de l'organisation.
Publications / Date de publication
Janvier 2004 - avril 2005
- Certificat de décision préalable
- Rapport annuel / Juin
- Facteurs de rajustement de l'IPC / Avril
- Audiences
- Nicoderm - Hoechst Marion Roussel Canada Inc. / Avril 1999 (en cours)
- Fasturtec, Sanofi-Synthélabo Canada Inc. / Mai (complétée)
- Dovobet, LEO Pharma Inc. / Novembre (en cours)
- Evra, Janssen-Ortho Inc. / Décembre (complétée)
- La Nouvelle / Trimestriel
- Avis et commentaires
- Proposition de Certificat de décision préalable concernant le prix du Viread / Janvier
- Proposition de mofidication du Règlement sur les médicaments brevetés - La Nouvelle / Janvier 2005
- Augmentations de prix pour les médicaments brevetés (article) / Mars 2005
- Médicaments brevetés
- Rapportés au CEPMB en 2004 (y compris le statut de l'examen du prix pour chaque médicament) / Mensuel
- Rapports sur les nouveaux médicaments brevetés :
- Aerius / Juin
- Alphagan / Septembre
- Avodart / Octobre
- Bextra / Mars
- BLES / Juin
- Bondronat / Avril 2005
- Cetrotide / Janvier 2005
- Crestor / Janvier
- Ebixa / Janvier 2005
- Ezetrol / Septembre
- Fasturtec / Août
- Gadovist / Janvier 2005
- Gynazole / Janvier 2005
- Hectorol / Septembre
- Infergen / Septembre
- Iressa / Octobre
- Kineret / Septembre
- Lantus / Février 2005
- Pegasys / Juin
- Valcyte / Juillet
- Viread / Janvier 2005
- Xatral / Mai
- Xigris / Janvier
- Zavesca / Janvier 2005
- Programme de recherche [35] / Janvier
- Discours
- Les médicaments brevetés et leurs prix : tendances et développements / Mars
- Contrôle des prix des produits pharmaceutiques au Canada / Mai
- L'avenir de la réglementation des prix des médicaments : Peut-on maintenir l'équilibre ? / Novembre
- Prix des médicaments au Canada et aux États-Unis : Une question complexe ? / Janvier 2005
- Allocution par le Vice-président du CEPMB devant le Comité permanent de la Santé sur le Budget principal / Avril 2005
- Engagements de conformité volontaire
- One-Alpha, LEO Pharma Inc. / Mai
- Fasturtec, Sanofi-Synthélabo Canada Inc. / Juin
- Prolastin, Bayer Inc. / Juillet
- Starnoc, Servier Canada / Juillet
- Busulfex, EPS Pharma Inc. / Novembre
- Evra, Janssen-Ortho Inc. / Février 2005
- Paxil CR, GlaxoSmithKline Inc. / Mars 2005
- Tamiflu, Hoffmann-La Roche Canada / Mars 2005
Le glossaire qui suit a été préparé dans le but de faciliter votre compréhension. Pour de plus amples explications et définitions, veuillez consulter la Loi sur les brevets, le Règlement sur les médicaments brevetés, le Compendium des Lignes directrices, des politiques et des procédures du CEPMB et le Règlement sur les aliments et drogues ou, encore, communiquez directement avec le CEPMB.
ATC :
Système de classification Anatomique, Thérapeutique, Chimique (ATC) conçu et tenu à jour par Collaborating Centre for Drug Statistics Methodology de l'Organisation mondiale de la santé (OMS). Ce système distingue les médicaments selon leur site d'action et leurs caractéristiques thérapeutiques et chimiques. Le CEPMB utilise ce système pour la sélection des médicaments de comparaison aux fins de l'examen des prix. (ATC)
Avis de conformité (NOC) :
Avis donné par la Direction générale des produits de santé et des aliments de Santé Canada en vertu de l'article C.08.004 du Règlement sur les aliments et drogues. L'émission de cet avis confirme que le médicament respecte les normes prescrites par Santé Canada pour usage humain et vétérinaire et que sa vente est autorisée sur le marché canadien. (Notice of Compliance)
Brevet :
Instrument émis par le Commissaire des brevets sous forme de lettres patentes conférant à son titulaire un monopole pour une période limitée concernant les réclamations qui y sont faites. Le brevet donne à son titulaire et à ses représentants légaux le droit exclusif de fabriquer, de construite, d'exploiter et de vendre à d'autres pour qu'ils l'exploitent l'objet de l'invention. (Patent)
Brevet en instance:
Demande pour un brevet qui n'a pas encore été délivré. (Pending Patent)
Nota : En ce qui concerne les médicaments vendus avant qu'ils soient brevetés, la politique du Conseil est de faire, une fois le médicament breveté, l'examen de son prix en remontant jusqu'à la date à laquelle la demande de brevet a été laissée à la connaissance du public pour inspection. (Voir le Bulletin du CEPMB no 15, page 7.)
Breveté ou titulaire du brevet :
Désigne aux termes du paragraphe 79(1) de la Loi sur les brevets " la personne ayant pour le moment droit à l'avantage d'un brevet pour une invention liée à un médicament, ainsi que quiconque était titulaire d'un brevet pour une telle invention ou qui exerce ou a exercé les droits d'un titulaire dans un cadre autre qu'une licence prorogée en vertu du paragraphe 11(1) de la Loi de 1992 modifiant la Loi sur les brevets. " (Patentee)
Certificat de décision préalable (CDP) :
Un certificat révocable émis à la demande du breveté en vertu de l'article 98(4) de la Loi sur les brevets lorsque le Conseil estime que le prix pratiqué ou proposé n'est pas supérieur au prix maximal qu'autorisent ses Lignes directrices. (Advance Ruling Certificate)
Cession d'un brevet :
Avis donné par le breveté au Commissaire des brevets l'informant qu'il renonce irrévocablement à ses droits de propriété à l'égard du brevet en cause et les cède au domaine public. (Dedication of Patent)
Nota : Depuis le 30 janvier 1995, le Conseil ne reconnaît pas la cession d'un brevet lorsque cette mesure constitue un moyen de se soustraire à sa compétence. (Voir le Bulletin no 17 du CEPMB, à la page 3)
Dépenses courantes de recherche-développement :
désigne les dépenses autres qu'en capital directement liées à la recherche, dont : (a) salaires, (b) matériel direct, (d) entrepreneurs et sous-traitants, (d) coûts directement associés aux frais indirects de production, (e) paiements aux institutions désignées, (f) paiements aux organismes subventionnaires. Ces éléments sont décrits plus en détail dans le formulaire 3 du Guide de rapport du breveté disponible sur notre site web sous la rubrique " Loi, Règlement et Lignes directrices ". (Current Research and Development Expenditures)
Dépenses de recherche-développement :
Aux termes du Règlement sur les médicaments brevetés, dans sa version de 1994, et plus particulièrement de ses articles 5 et 6, la recherche-développement s'entend des activités qui auraient été considérées admissibles au crédit d'impôt à l'investissement pour la recherche scientifique et le développement expérimental en vertu e la Loi de l'impôt sur le revenu dans sa version en vigueur le 1er décembre 1987. (Research and Development Expenditures)
Drogue de recherche :
Médicament autorisé par Santé Canada aux fins d'une autorisation clinique (c.-à-d. essais sur des humains), mais dont la vente pour l'indication à l'étude n'est pas encore autorisée. (Investigational New Drug)
Engagement de conformité volontaire :
Engagement écrit pris par le breveté de baisser le prix de son médicament pour le rendre conforme aux Lignes directrices du CEPMB sur les prix excessifs (voir chapitre 1 du Compendium des Lignes directrices, politiques et procédures). La Politique de conformité et d'application (voir chapitre 2, section 7) prévoit que le Président peut, plutôt que d'émettre un avis d'audience, approuver un engagement conforme aux exigences de la Loi sur les brevets et aux politiques du Conseil et servant les intérêts du grand public. La politique du Conseil sur la conformité et l'application autorise la présentation d'un engagement de conformité après la publication d'un Avis d'audience. L'engagement soumis à ce point requiert l'aval du Conseil. Le Conseil doit rendre publics tous les engagements approuvés par le Président ou par le Conseil. (Voluntary Compliance Undertaking)
Indice du prix des médicaments brevetés (IPMB) :
Indice établi par le CEPMB pour mesurer la variation annuelle des prix de transaction des médicaments brevetés vendus au Canada. Cet indice est établi à partir des données sur les prix et sur les ventes déclarées par les brevetés. (Patented Medicine Price Index)
Ingrédient actif :
Substance chimique ou biologique responsable de l'effet pharmacologique d'un produit médicamenteux. (Active Ingredient)
Licence obligatoire :
Licence émise par le Commissaire des brevets qui permet à son titulaire d'importer, de fabriquer, d'utiliser ou de vendre une invention brevetée relative à un médicament. La licence est accordée en vertu du paragraphe 39(4) de la Loi sur les brevets repris dans le paragraphe 11(1) de la Loi de 1992 modifiant la Loi sur les brevets. Le montant des redevances que le titulaire de la licence doit verser au breveté est déterminé par le Commissaire aux brevets qui établit les conditions des licences en vertu de l'article 39(5) de la Loi sur les brevets. (Licence, compulsory)
Licence volontaire :
Engagement contractuel entre un breveté et un titulaire de licence permettant à ce dernier de bénéficier des retombées d'un brevet ou d'exercer des droits à l'égard de celui-ci moyennant une contrepartie (par ex : royautés sous forme de pourcentage des recettes tirées des ventes du médicament utilisant le brevet). (Licence, Voluntary).
Médicament :
Toute substance ou tout mélange de substances qui est appliqué ou administré in vivo pour faciliter le diagnostic, le traitement, l'atténuation ou la prévention d'une maladie, de symptômes, de troubles ou d'état physiques anormaux ou pour modifier des fonctions organiques chez les humains et les animaux. Cette substance ou ce mélange de substances peut avoir été produit biologiquement, chimiquement ou autrement. Pour être plus précis, cette définition comprend les vaccins, les préparations topiques, les anesthésiques et les produits diagnostics utilisés in vivo, quel que soit le mode d'administration (par ex. préparations transdermiques, capsules, solutions injectables, solutions pour inhalation, etc.) Cette définition exclut toutefois les appareils médicaux, les produits diagnostiques in vivo et les désinfectants qui ne sont pas utilisés in vivo (Voir Compendium des Lignes directrices, politiques et procédures, Introduction, paragraphe 1.5). (Medicine)
Numéro d'identification de drogue (DIN) :
Numéro d'identification que la Direction générale de la protection de la santé de Santé Canada attribue à chaque médicament vendu sous ou sans ordonnance et commercialisé en vertu du Règlement sur les aliments et drogues. Le DIN est assigné en tenant compte des éléments suivants : le fabricant du produit, l'ingrédient actif ou les ingrédients actifs, la concentration de l'ingrédient actif, la forme posologique, le nom du produit et son mode d'administration. (Drug Identification Number)
Produit générique :
Produit médicamenteux contenant le même ingrédient actif, la même concentration et la même forme posologique qu'un produit de marque. (Generic product)
Produit médicamenteux :
Présentation particulière d'un médicament qui se distingue par sa forme posologique et la concentration de l'ingrédient actif. (Drug product)
Produit médicamenteux existant :
Tout médicament breveté (DIN) pour lequel un prix de référence a été fixé conformément aux Lignes directrices du Conseil (Voir le chapitre 1, paragraphe 3,3 du Compendium des Lignes directrices, politiques et procédures). (Drug Product, Existing )
Produit médicamenteux nouveau :
Un nouveau médicament dont le prix de lancement est sous examen. Les médicaments sont considérés nouveaux l'année au cours de laquelle ils sont lancés sur le marché canadien ou, encore, l'année où leur premier brevet leur a été attribué s'ils étaient déjà offerts sur le marché. Aux fins de l'examen des prix, les produits médicamenteux nouveaux pour une année donnée sont ceux qui ont été lancés sur le marché entre le 1er décembre de l'exercice précédent et le 30 novembre de l'exercice faisant l'objet du rapport annuel. En raison des dates limites de présentation des rapports en vertu du Règlement sur les médicaments brevetés et le mode de calcul des prix de référence, les produits médicamenteux lancés sur le marché canadien en décembre sont comptabilisés dans l'exercice suivant. (Voir le chapitre 1, paragraphe 3,2 du Compendium des Lignes directrices, politiques et procédures). (Drug Product, New)
Programme de médicaments d'urgence :
Voir Programme spécial d'accès.
Programme spécial d'accès :
Programme en vertu duquel Santé Canada autorise la vente à des médecins de médicaments n'ayant pas encore reçu l'avis de conformité et qui ne seraient autrement pas disponibles sur le marché canadien. (Auparavant appelé Programme de médicaments d'urgence) (Special Access Program)
Recherche-développement :
Recherche fondamentale ou appliquée visant à créer de nouveaux matériaux, dispositifs, produits ou procédés ou à améliorer ceux qui existent (par exemple les procédés de fabrication) (Research and Development)
Recherche et développement - recherche appliquée :
Travaux qui contribuent à faire avancer la connaissance scientifique et qui sont entrepris avec une application pratique en vue. Ils peuvent viser à créer de nouveaux produits ou procédés, à améliorer ceux qui existent à l'aide de procédés de fabrication ou, encore d'études précliniques et cliniques. (Research and Development C Applied Research)
Recherche et développement - recherche fondamentale :
Travaux qui contribuent à faire avancer la connaissance scientifique et qui sont entrepris sans aucune application pratique en vue (Research and Development C Basic Research)
Recherche et développement - recherche clinique :
Évaluation des effets d'un nouveau médicament sur les humains. Cette évaluation comporte généralement trois phases successives, commençant par des tests limités d'innocuité du médicament chez les humains en santé suivis de tests plus poussés portant sur l'innocuité et l'efficacité chez les sujets atteints de la maladie pour laquelle le médicament a été mis au point. (Research and Development C Clinical Research)
Recherche et développement - recherche préclinique :
Tests menés sur des animaux afin d'évaluer les effets pharmacologiques et toxicologiques des médicaments. (Research and Development C Preclinical Research)
Recherche et développement -autres R-D admissibles :
Comprend les dépenses de recherche-développement qui ne correspondent à aucune des catégories de R-D susmentionnées. Elle comprend les présentations sur la réglementation des médicaments, les études de biodisponibilité ainsi que les essais cliniques de Phase IV. (Research and Development C Other Qualifying)
Voici la liste des acronymes utilisés dans le présent rapport annuel et dans d'autres publications du CEPMB de même que par les parties intéressées.
- AC : Avis de conformité
- ACC : Association des consommateurs du Canada
- ACIMVL : Association canadienne de l'industrie des médicaments en vente libre
- ACMG : Association canadienne du médicament générique
- ATC : Anatomique, thérapeutique, chimique - système de classification
- CCCEM : Comité consultatif canadien d'expertise sur les médicaments
- CDP ou certificat : Certificat de décision préalable
- CEPMB : Conseil d'examen du prix des médicaments brevetés
- CPI : Comparaison des prix internationaux
- CTT : Comparaison de la classe thérapeutique
- DGPT : Direction générale des produits thérapeutiques (Santé Canada)
- DIN : Numéro d'identification du médicament (Drug Identification Number)
- DTQ : Dose thérapeutique quotidienne
- DVA : Département des Anciens combattants (Department of Veterans Affairs - États-Unis)
- ECV ou engagement : Engagement de conformité volontaire
- F-P-T : Fédéral, provincial, territorial
- FSS : Classification fédérale des approvisionnements (Federal Supply Schedule - États-Unis)
- GCMUH ou Groupe consultatif : Groupe consultatif sur les médicamentspour usage humain
- ICIS : Institut canadien d'information sur la santé
- IPPI : Indice des prix des produits industriels
- IPC : Indice des prix à la consommation
- IPMB : Indice des prix des médicaments brevetés
- IVVMB : Indice du volume des ventes des médicaments brevetés
- ME : Mémoire d'entente
- MNBSE : Médicament non brevetés de source exclusive
- MNE : (prix) Maximum non excessif
- NSA : Nouvelle substance active
- OCCETS : Office canadien de coordination de l'évaluation des technologies de la santé
- OCDE : Organisation de coopération et de développement économiques
- ODB : (Ontario Drug Benefit Plan) Régime d'assurance-médicament de l'Ontario
- OMS : Organisation mondiale
de la santé
- PAS : Programme d'accès spécial (Santé Canada)
- PBA : Premier brevet accordé
- PCME : Processus commun d'examen des médicaments
- PTM : Prix de transaction moyen
- PNB : Produit national brut
- R-D : Recherche-développement
- Rx&D : Compagnies de recherche pharmaceutique du Canada
- SNIUMP : Système national d'information sur l'utilisation des médicaments prescrits
- SNPP : Stratégie nationale sur les produits pharmaceutiques
- SSNA : Soins de santé non assurés
- VL : (médicaments en) vente libre
Critères justifiant une enquête
Un prix est considéré conforme aux Lignes directrices dans la mesure où aucun critère ne justifie une enquête. Les critères correspondent aux normes qu'applique le Conseil pour utiliser de la façon la plus efficiente possible les ressources dont il dispose pour les enquêtes. L'existence de ces critères ne sous-tend pas que le Conseil tolère les écarts à ses Lignes directrices. Le Conseil estime que ses critères permettent de reconnaître et de soumettre à une enquête tous les cas importants de prix non conformes à ses Lignes directrices. Dans la plupart des cas, lorsque le prix d'un médicament dépasse le prix maximal autorisé d'un montant trop minime pour justifier une enquête, le breveté est appelé à remettre les recettes excédentaires perçues en offrant l'année suivante son médicament à un prix inférieur au max maximal autorisé. Le Conseil s'attend à ce que les prix de tous les médicaments brevetés soient conformes à ses Lignes directrices et tout élément de preuve démontrant que le prix d'un médicament se maintient au-delà de ce que permettent ses Lignes directrices, ne serait-ce que d'un petit montant, peut justifier la tenue d'une enquête.
Critères justifiant la tenue d'une enquête
Le personnel du Conseil ouvre une enquête sur le prix d'un médicament breveté lorsque l'une ou l'autre des conditions suivantes est remplie :
Nouveaux médicaments
- le prix de lancement dépasse d'au moins 5 % le prix maximal jugé non excessif
- les recettes excédentaires perçues au cours de la période de lancement totalisent 25 000 $ ou plus
- des plaintes dûment fondées ont été formulées.
Médicaments existants
- le prix dépasse d'au moins 5 % le prix maximal jugé non excessif et les recettes excédentaires cumulatives perçues au cours de toute la durée du brevet à compter du 1er janvier 1992 sont égales ou supérieures à 25 000 $
- les recettes excédentaires cumulatives perçues au cours de toute la durée du brevet à compter du 1er janvier 1992 sont égales ou supérieures à 50 000 $
- des plaintes dûment fondées ont été formulées.
Vous trouverez de plus amples renseignements concernant les critères qui justifient la tenue d'une enquête à l'appendice 5 du Compendium des Lignes directrices, des politiques et des procédures. Le Compendium est affiché sur notre site web sous la rubrique " Loi, Règlement et Lignes directrices ".
Produits médicamenteux brevetés lancés sur le marché en 2004

Les Lignes directrices du Conseil établissent trois catégories de nouveaux produits médicamenteux brevetés aux fins de l'examen du prix
de lancement.
Catégorie 1 - nouveau DIN d'une forme pharmaceutique existante d'un médicament existant ou un nouveau DIN d'une autre forme
pharmaceutique du médicament qui est comparable à la forme pharmaceutique existante, habituellement une nouvelle concentration d'un médicament existant (extension de gamme de produits pharmaceutiques).
Catégorie 2 - premier produit médicamenteux mis au point pour traiter une condition ou qui constitue une amélioration importante
par rapport aux médicaments existants. Les médicaments de cette catégorie sont souvent qualifiés de "découverte" ou d'"amélioration importante".
Catégorie 3 - nouveau DIN, nouveau médicament ou nouvelle forme pharmaceutique d'un médicament existant qui procurent tout au plus des bienfaits modestes ou minimes par rapport aux médicaments existants.
Les définitions complètes de ces catégories sont présentées au chapitre 3, section 3, du Compendium des Lignes directrices, politiques
et procédures du CEPMB.
- NSA : Nouvelle substance active
- PBA : Premier brevet accordé
- ATC : Système de classification anatomique, thérapeutique, chimique
Recherche-développement
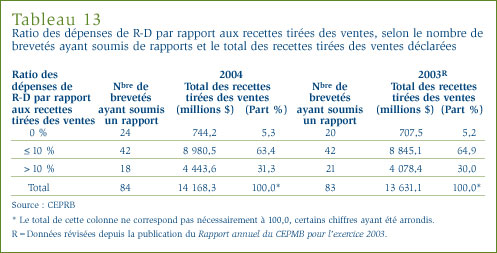
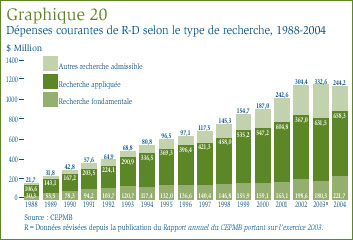
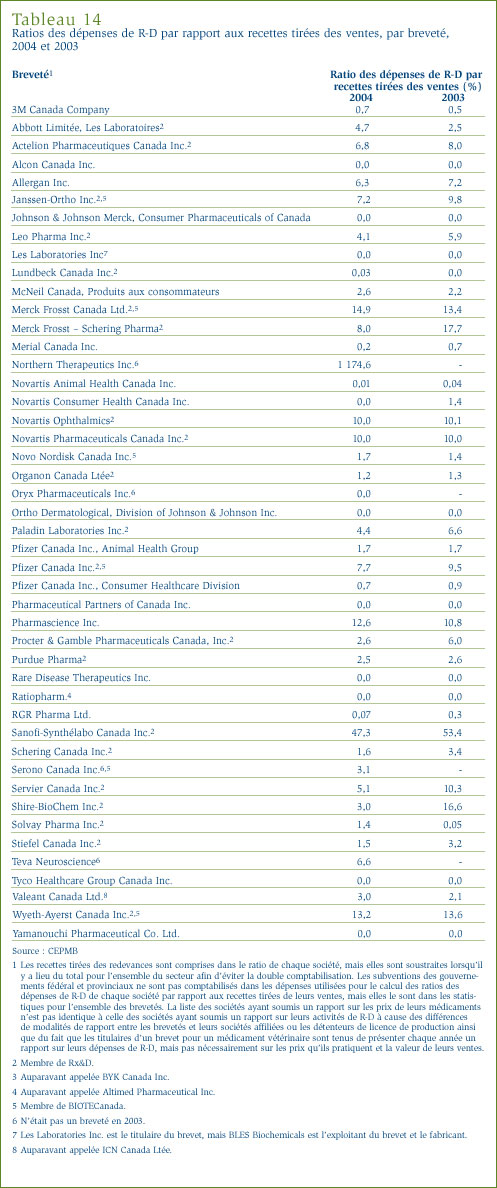
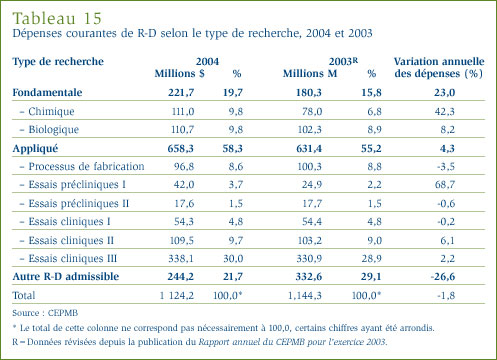
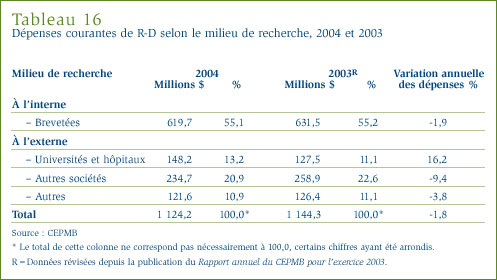
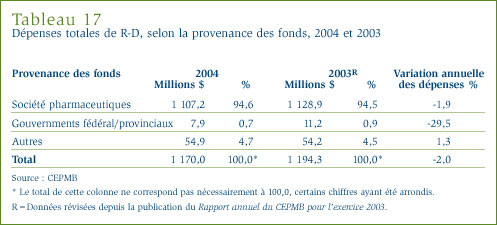
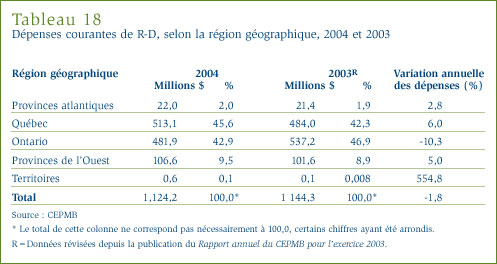
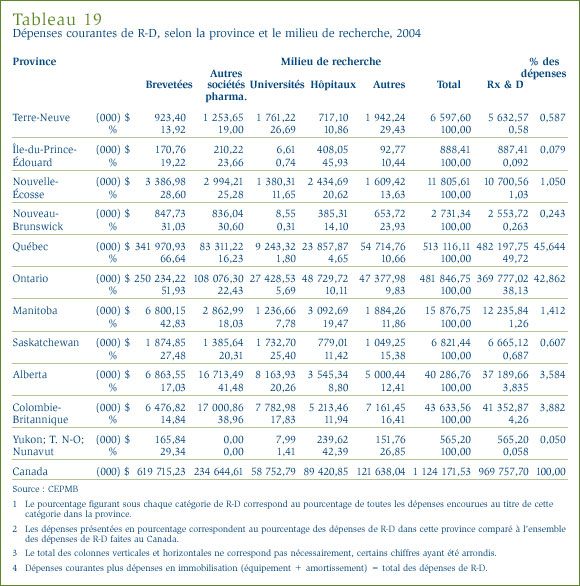
Téléchargez le Médicaments brevetés pour usage humain et titulaires des brevets au Canada - 1er janvier 2004 au 31 décembre 2004...
[1] Le portefeuille de la Santé contribue de multiples façons à améliorer l'état de santé des Canadiens et des Canadiennes. Il est formé de Santé Canada et des trois agences suivantes : les Instituts de recherche en santé du Canada, le Conseil de contrôle des renseignements relatifs aux matières dangereuses et le Conseil d'examen du prix des médicaments brevetés.
[2] Rapport annuel sur la performance, janvier - décembre 2004, Direction des produits thérapeutiques, Santé Canada.
[3] Ce médicament, qui était disponible sur le marché canadien avant 2004, est devenu assujetti à la compétence du CEPMB en 2004 après la délivrance d'un brevet.
[4] Les Lignes directrices du Conseil établissent trois catégories de nouveaux médicaments brevetés aux fins de l'examen du prix de lancement.
- Catégorie 1 - nouveau DIN d'une forme pharmaceutique existante d'un médicament existant ou un nouveau DIN d'une autre forme pharmaceutique du médicament qui est comparable à la forme pharmaceutique existante, habituellement une nouvelle concentration d'un médicament existant (extension d'une gamme de produits).
- Catégorie 2 - premier médicament mis au point pour traiter une condition ou qui constitue une amélioration importante par rapport aux médicaments existants. Les médicaments de cette catégorie sont souvent qualifiés de « découverte » ou d' « amélioration importante ».
- Catégorie 3 - nouveau DIN, nouveau médicament ou nouvelle forme pharmaceutique d'un médicament existant qui procure tout au plus des bienfaits modestes ou minimes par rapport aux médicaments existants.
Les définitions plus exhaustives de ces catégories sont présentées à la section 3 du chapitre 3 de notre Compendium des Lignes directrices, politiques et procédures.
[5] En raison des dates de présentation des rapports des brevetés établies par le Règlement sur les médicaments brevetés et la méthode de calcul des prix de référence, les médicaments lancés sur le marché canadien ou brevetés en décembre sont comptabilisés dans les nouveaux médicaments de l'exercice suivant.
[6] Depuis le début de l'exercice 1999, le calcul des ventes au prix du fabricant de tous les médicaments et des médicaments brevetés ne tient compte que des ventes de médicaments pour usage humain.
[7] Les rapports annuels antérieurs ont démontré, statistiques à l'appui, que les prix des médicaments brevetés ont peu changé alors que la valeur des ventes de médicaments brevetés a augmenté d'au moins 15 %.
[8] Selon les études effectuées par le CEPMB sur les régimes publics d'assurance-médicaments, l'augmentation de l'utilisation faite des médicaments existants et nouveaux est à la source de la majeure partie de la croissance des dépenses récemment enregistrée. CEPMB, Régimes d'assurance-médicaments provinciaux : Vue d'ensemble - évolution des prix des médicaments, 1995-1996 - 1999-2000, Septembre 2001.
[9] IMS Health, Canadian Hospital and Pharmacy Audit.
[10] Il convient de préciser que les pourcentages de la valeur des ventes de tous les médicaments au Canada, ventilés par groupe ATC, ne sont pas nécessairement les mêmes que ceux obtenus pour les médicaments brevetés.
[11] Pour des raisons de confidentialité, ces deux groupes ont été combinés.
[12] Pour comprendre comment est calculé l'IPMB, consultez le document du CEPMB intitulé Description de la méthodologie de l'indice chaîne Laspeyres utilisée pour calculer l'indice des prix des médicaments brevetés (IPMB), mars 1997, révisé en juin 2000. L'IPMB est calculé en appliquant aux différents médicaments la moyenne des taux de variation des prix pondérée en fonction de la valeur des ventes. L'IPMB mesure la variation des prix des médicaments brevetés existants, mais non les effets des variations sur les ventes des quantités de médicaments consommés ou substitués (par exemple, l'utilisation de nouveaux médicaments plutôt que de médicaments existants généralement vendus à prix moindres). Depuis la publication du rapport annuel de 1999, l'IPMB ne porte plus que sur les changements des prix des médicaments brevetés pour usage humain.
[13] 1992 est la seule année où l'IPMB a augmenté plus rapidement que l'IPC. Dans un effort pour faciliter et encourager la conformité des brevetés, la méthodologie de rajustement des prix en fonction de l'IPC du CEPMB utilise le taux d'IPC prévu et publié par le ministère des Finances. En 1992, le taux prévu était de 3,2 % alors que le taux réel n'était que de 1,5 %. Cette méthodologie du prix rajusté en fonction de l'IPC est présentée à l'appendice 4 du Compendium des Lignes directrices, politiques et procédures.
[14] Statistique Canada, CANSIM, Série V735319. En 2004, les consommateurs ont payé 1,9 % de plus qu'en 2003 pour les biens et les services inclus dans le panier d'achats constitué aux fins du calcul de l'IPC. Cette augmentation est moindre que la moyenne annuelle de 2,8 % mesurée en 2003. Selon Statistique Canada, les principaux produits de consommation ayant contribué à ce ralentissement de l'inflation sont les primes d'assurance-automobile, le gaz naturel, les cigarettes, l'équipement et les fournitures informatiques ainsi que l'achat et la location de véhicules automobiles.
[15] Pour des raisons de confidentialité, les données relatives à ces deux groupes ont été combinées.
[16] La méthodologie qu'utilise le CEPMB pour comparer les prix canadiens aux prix pratiqués dans les différents pays de comparaison est expliquée dans le Compendium des Lignes directrices, politiques et procédures ainsi que dans deux rapports publiés en 2002, Tendances des prix des médicaments brevetés et Vérification des prix des médicaments brevetés pratiqués à l'étranger.
[17] Le CEPMB effectue les conversions des devises sur une période donnée en utilisant une moyenne simple du cours d'échange au comptant des 36 mois précédents. Cette approche a un effet de lissage, en ce sens qu'elle limite l'influence des rajustements transitoires des taux de change sur les comparaisons des prix pratiqués au Canada à ceux pratiqués dans différents pays. Elle permet également d'intégrer progressivement les effets des fluctuations à long terme des taux de change. De cette façon, une augmentation ou une diminution de la valeur du dollar canadien peut continuer de produire des rajustements des ratios des prix canadiens par rapport aux prix étrangers sur une période de trois ans aprés la variation du taux de change.
[18] La couronne exerce à cet égard un effet de levier financier important considérant que les prix pratiqués en Suède correspondent souvent aux prix internationaux médians. La même observation s'applique à l'euro, la devise dans laquelle sont exprimés les prix pratiqués en France, en Italie et en Allemagne. Par ailleurs, les fluctuations du dollar US exercent peu d'incidence sur le ratio moyen étant donné que les prix des médicaments pratiqués aux États-Unis se situent à la limite supérieure de la distribution des prix à l'échelle internationale. Par conséquent, les prix américains représentent rarement le prix international médian.
[19] L'industrie pharmaceutique des États-Unis a fait valoir que les prix publiquement disponibles dans ce pays ne reflètent pas les prix réels en raison des remises et des rabais consentis sur une base confidentielle. Depuis janvier 2000, dans la foulée d'une consultation publique, le CEPMB inclut les prix figurant dans la Classification fédérale des approvisionnements (FSS) des États-Unis dans le calcul des prix moyens des médicaments brevetés pratiqués aux États-Unis. Les prix de la Classification fédérale des approvisionnements sont négociés entre les fabricants et le département des Anciens combattants des États-Unis. Ces prix sont généralement moins élevés que les autres prix publiquement disponibles pratiqués aux États-Unis et mentionnés dans les rapports des brevetés au CEPMB.
[20] À l'instar de l'IPMB, l'IVVMB est calculé à l'aide de la formule de l'indice chaîne de Laspeyres, les ratios des volumes des ventes pour des périodes successives remplaçant les ratios de prix de l'IPMB. Ici encore, la valeur cumulée de l'indice est obtenue sous forme de moyenne des ratios pondérée en fonction des recettes générées par les différents médicaments. Puisque l'IVVMB ne couvre que les médicaments brevetés, il ne peut représenter les tendances de l'utilisation faite des médicaments sur l'ensemble du marché des médicaments.
[21] Pour des raisons de confidentialité, les données relatives à ces deux groupes ont été combinées.
[22] Considérant la domination des importations comme source d'approvisionnement en médicaments ainsi que le rôle des exportations et des médicaments génériques au sein du secteur canadien de fabrication des médicaments, le CEPMB cessera d'utiliser l'IPPI (composante pharmaceutique) comme indicateur des prix de vente des médicaments de marque au Canada.
[23] Statistique Canada, CANSIM, Séries V768221 et V768217
[24] Statistique Canada, CANSIM, Série V1576093. D'une façon plus précise, l'IPPI (composante pharmaceutique) présente les prix départ-usine des médicaments fabriqués au Canada. De par leur conception, l'IPPI (composante pharmaceutique) et l'IPMB sont des indicateurs bien différents. Les médicaments destinés à l'exportation sont pris en compte dans le calcul de l'IPPI (composante pharmaceutique) alors que les médicaments importés au Canada ne le sont pas. L'IPMB mesure les tendances des prix départ-usine des médicaments brevetés qui, pour la plupart, sont fabriqués à l'étranger. D'autre part, l'IPPI (composante pharmaceutique) est dans une certaine mesure dominé par les prix départ-usine des médicaments génériques fabriqués au Canada.
[25] IMS Health's Retail Drug Monitor, Décembre 2004 (www.imshealth.com). Le IMS Health's Retail Drug Monitor couvre les achats directs et indirects des pharmacies (les achats directs sont effectués directement auprès du fabricant tandis que les achats indirects sont effectués auprès d'un grossiste) dans 13 principaux pays. Les graphiques sur les ventes présentent des valeurs aux prix du fabricant (ou départ-usine) pour tous les médicaments d'ordonnance et certains médicaments en vente libre. Les graphiques couvrent les ventes du secteur hospitalier au Japon et les ventes postales aux États-Unis. Les 13 marchés suivants accaparent globalement plus des deux tiers du marché mondial : l'Argentine, l'Australie, le Brésil, le Canada, la France, l'Allemagne, l'Italie, le Japon, le Mexique, la Nouvelle-Zélande, l'Espagne, le Royaume Uni et les États-Unis.
[26] Ce taux de croissance n'est pas le même que celui rapporté par le CEPMB (au tableau 6, à la page 19) parce que les données de IMS Health's Retail Drug Monitor ne portent que sur les ventes faites aux pharmacies.
[27] Pour l'OCDE l'expression « dépenses pharmaceutiques » désigne « l'ensemble des sommes engagées pour l'achat de médicaments et d'articles médicaux non durables ». Cette définition englobe les préparations médicales, les médicaments de marque et les médicaments génériques, les drogues, les médicaments brevetés, les sérums, les vaccins, les vitamines et les minéraux ainsi que les contraceptifs oraux. Elle englobe également les produits non pharmaceutiques tels que la pâte dentifrice et les condoms. Les statistiques rapportées portent sur les dépenses des secteurs public et privé. Les dépenses pharmaceutiques peuvent ou non selon le pays comprendre la valeur des médicaments administrés dans les hôpitaux. En ce qui concerne le Canada, l'OCDE utilise les estimés des dépenses pharmaceutiques établis par l'Institut canadien d'information sur la santé (ICIS). Notons que les estimés de l'ICIS ne tiennent pas compte de la valeur des médicaments administrés dans les hôpitaux.
[28] Tel que publié dans le Résumé de l'étude d'impact de la réglementation du Règlement sur les médicaments brevetés, 1988, publié dans la Partie II de la Gazette du Canada, vol. 122, no 20 - SOR/DORS/88-474.
[29] Dans la présente section du rapport sont incluses les recettes tirées des ventes des médicaments pour usage humain ainsi que les recettes tirées des ventes des médicaments pour usage vétérinaire.
[30] Les dépenses courantes de R-D comprennent les dépenses autres qu'en capital directement associées à la recherche, dont (a) salaires, (b) matériel direct, (c) entrepreneurs et sous-traitants, (d) autres coûts direct tels que les coûts indirects de production (e) paiements aux institutions désignées, (f) paiements aux organismes subventionnaires et (g) paiements aux autres organismes. Ces éléments sont décrits plus en détail dans le formulaire 3 du Guide du breveté concernant la façon de remplir les formulaires, disponible sur notre site Web sous les rubriques « Loi, Règlement et Lignes directrices ».
[31] Le Groupe de travail sur les questions relatives à l'examen des prix a été créé par le CEPMB en 1998 suivant la publication de son Guide pour la prochaine décennie. Le Groupe de travail comprenanit douze membres, tous des représentants des divers groupes d'intervenants du CEPMB. Son mandat était d'examiner, d'analyser et de rédiger un rapport sur trois sujets : l'utilisation des prix du formulaire du DVA dans la comparaison des prix à l'échelle internationale; le processus d'examen des prix des nouveaux médicaments brevetés; et le prix des médicaments de catégorie 3. Le Groupe de travail a complété son mandat en octobre 2002. Ses rapports et autres documents pertinents aux activités du Groupe de travail sont affichés sur notre site Web sous la rubrique « Groupe de travail sur les questions relatives à l'examen des prix ».
[32] Voir L'avenir de la réglementation des prix des médicaments : Peut-on maintenir l'équilibre ? discours prononcé par le Dr Robert G. Elgie, Président du CEPMB à PHARMAC 2004, et par Réal Sureau, Vice-président, à la conférence sur la Commercialisation des médicaments au Québec et au Canada, le 21 novembre 2004. Ce discours est affiché sur notre site Web sous les rubriques « Publications; Discours (Série) 2004 ».
[33] La Stratégie d'accès thérapeutique est une initiative de Santé Canada qui vise à aider les Canadiens et les Canadiennes à maintenir et à améliorer leur santé. Ainsi, Santé Canada voit à assurer que les médicaments pour usage humain, et tout autre produit thérapeutique, soient sécuritaires, de haute qualité, efficace, utilisés correctement et disponible en temps opportun et à des coûts acceptables. Le CEPMB a reçu des fonds par le biais de la Stratégie pour son Project d'examen des échéanciers. Pour de plus amples renseignements sur cette initiative, voir la page 34 du présent rapport.
[34] Pour de plus amples renseignements concernant le Système national d'information sur l'utilisation des médicaments prescrits (SNIUMP), voir la page 30 du présent rapport.
[35] Le Programme de recherche est publié dans La Nouvelle et affiché sur notre site Web sous les rubriques « Publications; Programme de recherche ».