Le marché des opioïdes d’ordonnance sous forme orale solide, de 2010 à 2017
Canada et États-Unis
Remerciements
Cette analyse a été préparée par le Conseil d’examen du prix des médicaments brevetés (CEPMB) dans le cadre du Système national d’information sur l’utilisation des médicaments prescrits (SNIUMP), à la demande du Comité consultatif du SNIUMP et de concert avec ses membres.
Nos remerciements vont aux membres du personnel du CEPMB Tanya Potashnik et Elena Lungu, qui ont supervisé l’élaboration de l’analyse, ainsi qu’à Brian O’Shea et à Fatemeh Saberianranjbar, qui ont dirigé ce projet d’analyse. Le CEPMB tient également à souligner la contribution de l’analyste Karine Landry, de la scientifique Dianne Breau et du personnel de rédaction.
Avis de non-responsabilité
Le SNIUMP fonctionne indépendamment des activités réglementaires du conseil d’administration du CEPMB. Les priorités de recherche, ainsi que les données, déclarations et opinions énoncées dans les rapports du SNIUMP ne représentent pas la position du CEPMB en matière de questions réglementaires. Les rapports du SNIUMP ne contiennent pas d’information confidentielle ou privilégiée en vertu des articles 87 et 88 de la Loi sur les brevets, et la mention d’un médicament dans un rapport du SNIUMP ne revient pas à reconnaître ou à nier que le médicament fait l’objet d’une demande de brevet en vertu de l’article 80, 81 ou 82 de la Loi sur les brevets, et ne doit pas être interprétée comme telles, ou que son prix est ou n’est pas excessif au sens de l’article 85 de la Loi sur les brevets.
Renseignements connexes
Introduction
Modifications réglementaires concernant le tramadol
- Santé Canada a proposé en juin 2018 d’ajouter le tramadol à l’annexe I de la Loi réglementant certaines drogues et autres substances et à l’annexe du Règlement sur les stupéfiants.
- Cette mesure vise à prévenir le détournement du tramadol et à protéger les Canadiens des risques pour la santé associés à son utilisation non autorisée, tout en maintenant son accès à des fins médicales et scientifiques légitimes.
- Vous trouverez de plus amples renseignements sur les modifications réglementaires proposées à l’adresse suivante : https://www.canada.ca/fr/sante-canada/programmes/consultation-modifications-tramadol.html
Objet de l’analyse
Donner un aperçu du marché des opioïdes d’ordonnance au Canada et aux États-Unis pour éclairer les discussions sur l’incidence des modifications réglementaires proposées.
Limites
Cette analyse des opioïdes d’ordonnance ne couvre qu’un aspect d’un enjeu de santé à multiples facettes. Les statistiques complexes présentées ici se limitent généralement au marché des opioïdes sous forme orale solide et les résultats ne tiennent pas compte de l’utilisation d’autres formulations ou des opioïdes obtenus illégalement au Canada et aux États-Unis. Bien que ce rapport vise à éclairer les politiques favorisant une consommation plus sûre des opioïdes, une analyse des enjeux généraux liés à la crise des opioïdes, comme les troubles de consommation, les répercussions d’une intoxication et l’utilisation illicite, déborde du cadre de la présente étude.
Sources des données
Les constatations présentées dans l’étude se fondent sur l’analyse de plusieurs bases de données. Les résultats relatifs aux marchés nationaux canadiens de la vente au détail et des hôpitaux s’appuient sur les données saisies dans la Base de données MIDAS™ d’IQVIA (tous droits réservés).
La Base de données du SNIUMP de l’Institut canadien d’information sur la santé (ICIS), soit les données des régimes publics de chaque province (sauf le Québec), ainsi que du Yukon et des SSNA, ont été utilisées dans les analyses du marché des régimes publics d’assurance-médicaments, alors que la Base de données Private Pay Direct Plan d’IQVIA (sur les régimes privés à paiement direct) a été utilisée dans les analyses du marché des régimes privés d’assurance-médicaments. Les données des régimes privés de la Colombie-Britannique de l’ICIS ont été utilisées dans une analyse.
La Base de données Payer Insights d’IQVIA (perspectives sur les payeurs) a permis d’obtenir une ventilation par marchés public, privé et des particuliers.
Pour de plus amples renseignements sur ces sources de données, consultez le document Références sur la page Études analytiques du site Web du CEPMB.
Bien qu’en partie appuyées sur les données fournies sous licence par les bases de données MIDAS™ et Payer Insights d’IQVIA et de l’Institut canadien d’information sur la santé (ICIS), les affirmations, constatations, conclusions, perspectives et opinions contenues dans le présent rapport sont exclusivement celles du CEPMB et ne sont pas attribuables à IQVIA ou à l’ICIS.
Méthodologies
L’étude met l’accent sur les marchés canadien et américain des formulations solides orales d’opioïdes d’ordonnance énumérés ci-dessous, y compris les produits combinés contenant les médicaments cibles. Pour certaines analyses, les formulations solides orales ne pouvaient pas être isolées du reste des données, de sorte que les résultats incluent toutes les formes de chaque opioïde. Les unités physiques renvoient au nombre de pilules, comprimés, caplets, etc., sans égard à leur concentration ou à leur formulation. Les opioïdes entièrement synthétiques comme le fentanyl ou la méthadone n’ont pas été inclus dans les analyses.
Voici la liste des opioïdes visés par l’étude, ainsi que leurs équivalents en morphine (EEM) respectifs :
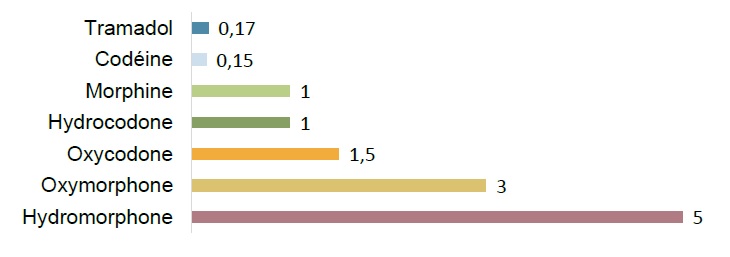
Description de la figure
L’histogramme à barres illustre l’équivalence en morphine des opioïdes inclus dans l’analyse.
blank
| Opioïde |
Équivalents en morphine |
| Tramadol |
0,17 |
| Codéine |
0,15 |
| Morphine |
1 |
| Hydrocodone |
1 |
| Oxycodone |
1,5 |
| Oxymorphone |
3 |
| Hydromorphone |
5 |
Les équivalents en morphine constituent une mesure normalisée utilisée dans l’étude pour comparer la puissance relative d’un milligramme de chaque opioïde à la puissance de la morphine.
1. Marchés nationaux des opioïdes, Canada et États-Unis
La consommation d’opioïdes par habitant est plus faible au Canada qu’aux États-Unis et a diminué dans les deux pays ces dernières années
En 2017, les opioïdes sous forme orale solide ont été prescrits en quantités suffisantes pour fournir à chaque Canadien l’équivalent de plus de 1 mg de morphine par jour. Le chiffre de 419 EEM par habitant en 2017 représente une baisse annuelle de 3,3 % par rapport aux 529 EEM par habitant de 2010.
Figure 1.1 Équivalents en morphine vendus par habitant, opioïdes sous forme orale solide, Canada et États-Unis, de 2010 à 2017
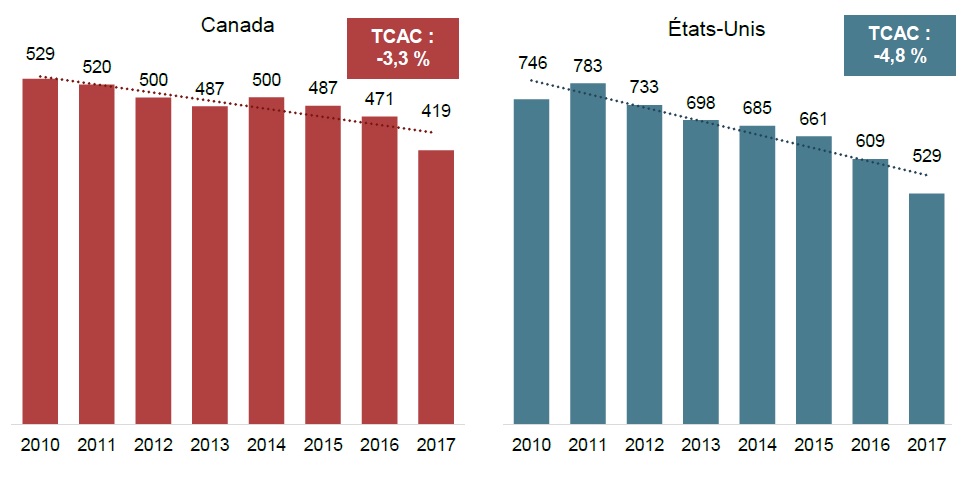
Description de la figure
La figure comprend deux histogrammes à barres comparant les équivalents en morphine vendus par habitant au Canada et aux États-Unis. Les résultats sont fournis par année, de 2010 à 2017, et les taux de croissance annuels composés sont inclus pour la période.
Canada
| Année |
Équivalents en morphine par habitant |
| 2010 |
529 |
| 2011 |
520 |
| 2012 |
500 |
| 2013 |
487 |
| 2014 |
500 |
| 2015 |
487 |
| 2016 |
471 |
| 2017 |
419 |
| Taux de croissance annuel composé |
-3,3 % |
États-Unis
| Année |
Équivalents en morphine par habitant |
| 2010 |
746 |
| 2011 |
783 |
| 2012 |
733 |
| 2013 |
698 |
| 2014 |
685 |
| 2015 |
661 |
| 2016 |
609 |
| 2017 |
529 |
| Taux de croissance annuel composé |
-4,8 % |
TCAC : taux de croissance annuel composé de 2010 à 2017.
Sources des données : Base de données MIDAS™ d’IQVIA, marchés de vente au détail et des hôpitaux des médicaments d’ordonnance, de 2010 à 2017. Tous droits réservés.
Bien que l’utilisation de la plupart des opioïdes d’ordonnance , soit en baisse au Canada et aux États-Unis, l’utilisation du tramadol et de l’hydromorphone est en hausse au Canada
Comme l’indique le nombre d’EEM vendu, l’utilisation du tramadol et de l’hydromorphone au Canada a augmenté à un taux annuel composé supérieur à 4 % de 2010 à 2017.
Figure 1.2 Nombre d’équivalents en morphine indexé sur 2010, opioïdes sous forme orale solide, Canada et États-Unis, de 2010 à 2017
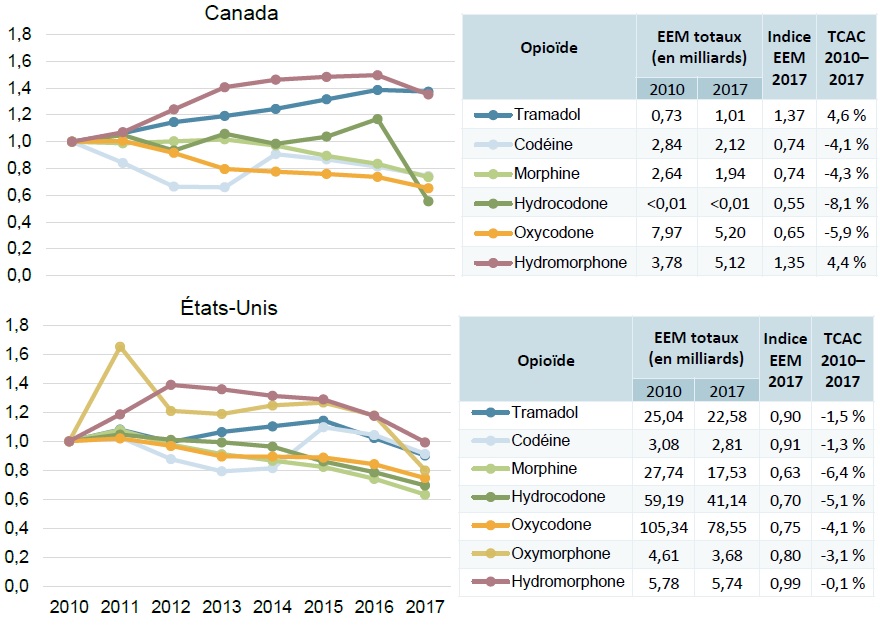
Description de la figure
Deux graphiques linéaires présentent les ventes de chacun des opioïdes sous forme orale solide de 2010 à 2017, indexées sur leurs ventes de 2010. Un tableau complémentaire indique les équivalents en morphine totaux (en milliards) de 2010 et de 2017, les résultats indexés pour 2017, ainsi que les taux de croissance annuels composés pour toute la période. Le premier graphique présente les tendances indexées pour le Canada et le deuxième, pour les États-Unis.
Canada
| Opioïde |
2010 |
2011 |
2012 |
2013 |
2014 |
2015 |
2016 |
2017 |
EEM totaux (en milliards) |
Taux de croissance annuel composé, de 2010 à 2017 |
| 2010 |
2017 |
| Tramadol |
1,00 |
1,06 |
1,15 |
1,19 |
1,24 |
1,32 |
1,39 |
1,37 |
0,73 |
1,01 |
4,6 % |
| Codéine |
1,00 |
0,84 |
0,66 |
0,66 |
0,91 |
0,87 |
0,81 |
0,74 |
2,84 |
2,12 |
-4,1 % |
| Morphine |
1,00 |
0,99 |
1,00 |
1,02 |
0,97 |
0,89 |
0,83 |
0,74 |
2,64 |
1,94 |
-4,3 % |
| Hydrocodone |
1,00 |
1,05 |
0,93 |
1,06 |
0,98 |
1,04 |
1,17 |
0,55 |
<0,01 |
<0,01 |
-8,1 % |
| Oxycodone |
1,00 |
1,01 |
0,92 |
0,80 |
0,78 |
0,76 |
0,74 |
0,65 |
7,97 |
5,20 |
-5,9 % |
| Hydromorphone |
1,00 |
1,07 |
1,24 |
1,41 |
1,46 |
1,48 |
1,50 |
1,35 |
3,78 |
5,12 |
4,4 % |
États-Unis
| Opioïde |
2010 |
2011 |
2012 |
2013 |
2014 |
2015 |
2016 |
2017 |
EEM totaux (en milliards) |
Taux de croissance annuel composé, de 2010 à 2017 |
| 2010 |
2017 |
| Tramadol |
1,00 |
1,08 |
0,99 |
1,06 |
1,10 |
1,14 |
1,02 |
0,90 |
25,04 |
22,58 |
-1,5 % |
| Codéine |
1,00 |
1,03 |
0,88 |
0,79 |
0,81 |
1,10 |
1,04 |
0,91 |
3,08 |
2,81 |
-1,3 % |
| Morphine |
1,00 |
1,08 |
0,98 |
0,91 |
0,87 |
0,82 |
0,74 |
0,63 |
27,74 |
17,53 |
-6,4 % |
| Hydrocodone |
1,00 |
1,05 |
1,01 |
0,99 |
0,96 |
0,86 |
0,79 |
0,70 |
59,19 |
41,14 |
-5,1 % |
| Oxycodone |
1,00 |
1,02 |
0,97 |
0,89 |
0,89 |
0,89 |
0,84 |
0,75 |
105,34 |
78,55 |
-4,1 % |
| Oxymorphone |
1,00 |
1,65 |
1,21 |
1,19 |
1,25 |
1,27 |
1,18 |
0,80 |
4,61 |
3,68 |
-3,1 % |
| Hydromorphone |
1,00 |
1,19 |
1,39 |
1,36 |
1,31 |
1,29 |
1,17 |
0,99 |
5,78 |
5,74 |
-0,1 % |
TCAC : taux de croissance annuel composé.
Sources des données : Base de données MIDAS™ d’IQVIA, marchés de vente au détail et des hôpitaux des médicaments d’ordonnance, de 2010 à 2017. Tous droits réservés.
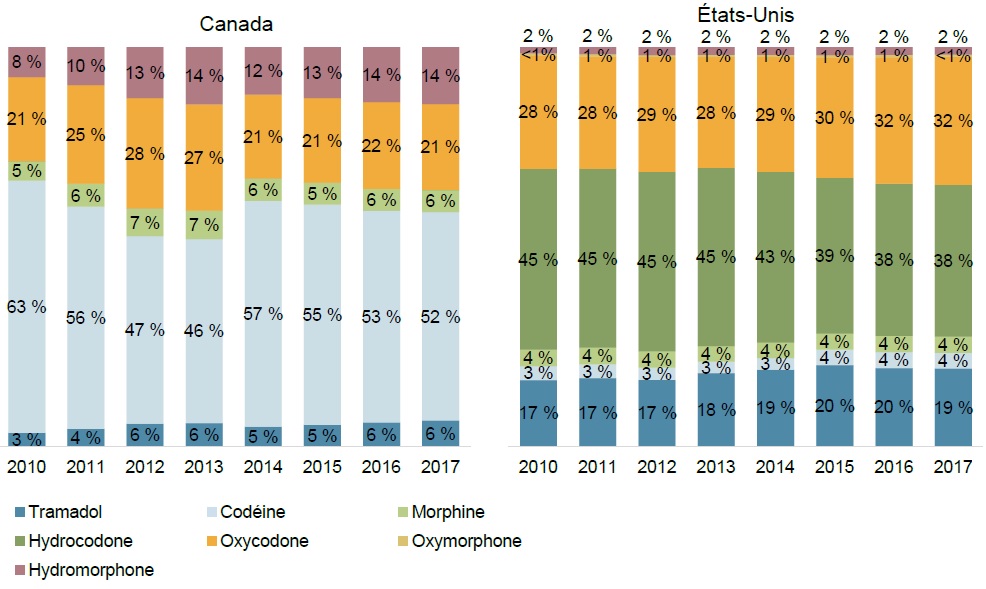
Le tramadol, l’un des opioïdes les moins puissants, capte une part relativement faible des unités d’opioïdes et de leurs EEM au Canada par rapport aux États-Unis; l’hydromorphone, l’opioïde le plus puissant, représente une part beaucoup plus importante des ventes au Canada par rapport aux États-Unis
L’oxycodone et l’hydromorphone constituent l’essentiel de l’utilisation des opioïdes vendus sur ordonnance (67 % des EEM totaux) et la majorité des ventes (60 %) au Canada en 2017. Aux États-Unis, l’oxycodone est l’opioïde le plus utilisé (46 % des EEM totaux), tandis que l’hydromorphone plus puissant ne représente qu’une part minime.
Figure 1.3 Répartition des parts de marché par unités, équivalents en morphine et ventes d’opioïdes sous forme orale solide, Canada et États-Unis, 2017
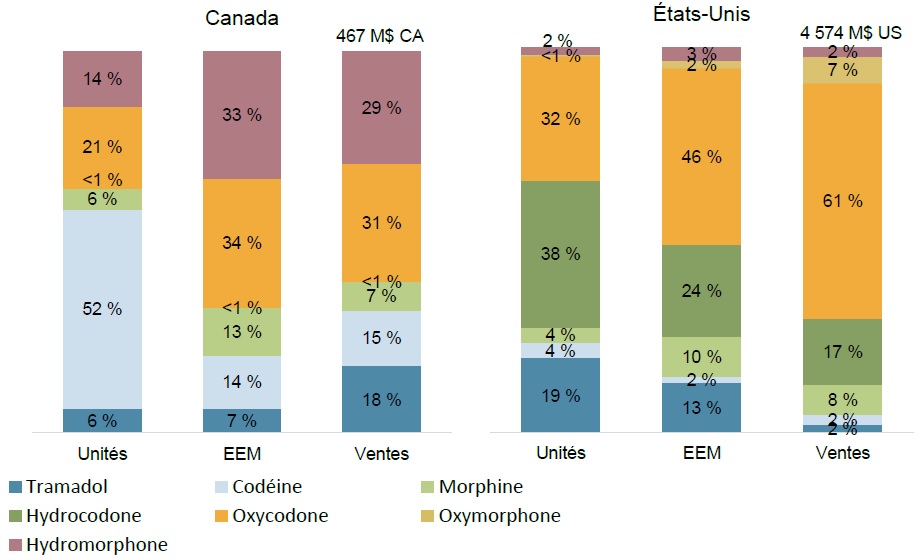
Description de la figure
Deux histogrammes empilés montrent la répartition des unités, des équivalents en morphine et des ventes pour chacun des opioïdes sous forme orale solide en 2017. Les ventes totales d’opioïdes sous forme orale solide sont également indiquées. Le premier histogramme présente les résultats pour le Canada et le deuxième, ceux pour les États-Unis.
Canada
| Opioïde |
Unités |
EEM |
Ventes |
| Hydromorphone |
14 % |
33 % |
29 % |
| Oxymorphone |
- |
- |
- |
| Oxycodone |
21 % |
34 % |
31 % |
| Hydrocodone |
<1 % |
<1 % |
<1 % |
| Morphine |
6 % |
13 % |
7 % |
| Codéine |
52 % |
14 % |
15 % |
| Tramadol |
6 % |
7 % |
18 % |
| Total |
|
|
467 M$ CA |
États-Unis
| Opioïde |
Unités |
EEM |
Ventes |
| Hydromorphone |
2 % |
3 % |
2 % |
| Oxymorphone |
<1 % |
2 % |
7 % |
| Oxycodone |
32 % |
46 % |
61 % |
| Hydrocodone |
38 % |
24 % |
17 % |
| Morphine |
4 % |
10 % |
8 % |
| Codéine |
4 % |
2 % |
2 % |
| Tramadol |
19 % |
13 % |
2 % |
| Total |
|
|
4 574 M$ US |
Sources des données : Base de données MIDAS™ d’IQVIA, marchés de la vente au détail et des hôpitaux des médicaments d’ordonnance, 2017. Tous droits réservés.
L’ augmentation de l’utilisation d’hydromorphone et de tramadol au Canada depuis 2010 confère à ceux-ci une part croissante du marché des opioïdes, combinée à la baisse de l’utilisation des autres opioïdes
La part de marché de l’hydromorphone en EEM est passée de 21 à 33 %. entre 2010 et 2017, tandis que la part du tramadol a presque doublé au cours de la même période, passant de 4 à 7 %. Les figures A1 et A2 de l’annexe fournissent des renseignements similaires en termes d’ unités et de ventes, respectivement.
Figure 1.4 Répartition des équivalents en morphine par opioïde sous forme orale solide, Canada et États-Unis, de 2010 à 2017
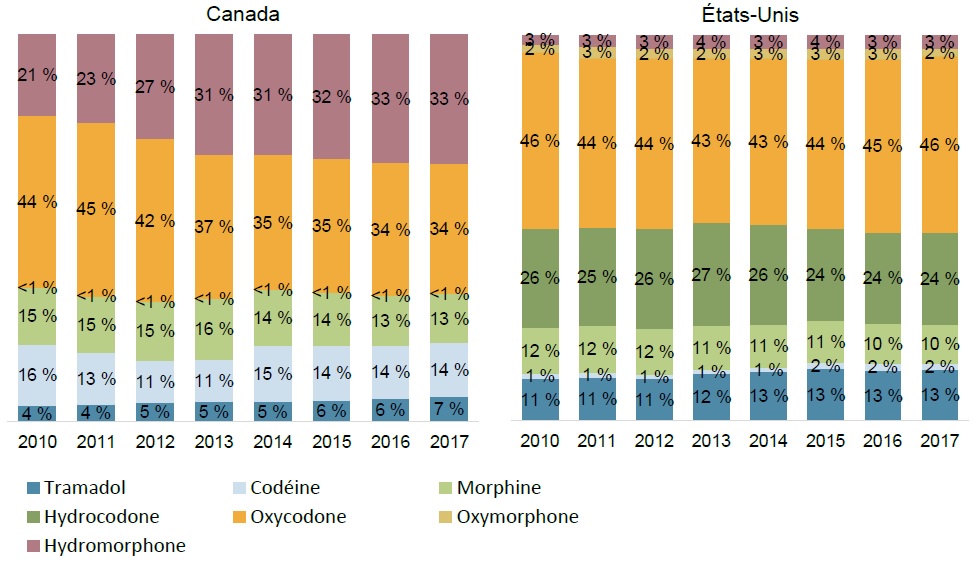
Description de la figure
La figure se compose de deux histogrammes empilés, l’un pour le marché canadien et l’autre pour celui des États-Unis, qui indiquent la répartition annuelle des équivalents en morphine par opioïdes de 2010 à 2017, en pourcentage des équivalents en morphine totaux vendus.
Canada
| |
2010 |
2011 |
2012 |
2013 |
2014 |
2015 |
2016 |
2017 |
| Hydromorphone |
21 % |
23 % |
27 % |
31 % |
31 % |
32 % |
33 % |
33 % |
| Oxymorphone |
- |
- |
- |
- |
- |
- |
- |
- |
| Oxycodone |
44 % |
45 % |
42 % |
37 % |
35 % |
35 % |
34 % |
34 % |
| Hydrocodone |
<1 % |
<1 % |
<1 % |
<1 % |
<1 % |
<1 % |
<1 % |
<1 % |
| Morphine |
15 % |
15 % |
15 % |
16 % |
14 % |
14 % |
13 % |
13 % |
| Codéine |
16 % |
13 % |
11 % |
11 % |
15 % |
14 % |
14 % |
14 % |
| Tramadol |
4 % |
4 % |
5 % |
5 % |
5 % |
6 % |
6 % |
7 % |
États-Unis
| |
2010 |
2011 |
2012 |
2013 |
2014 |
2015 |
2016 |
2017 |
| Hydromorphone |
3 % |
3 % |
3 % |
4 % |
3 % |
4 % |
3 % |
3 % |
| Oxymorphone |
2 % |
3 % |
2 % |
2 % |
3 % |
3 % |
3 % |
2 % |
| Oxycodone |
46 % |
44 % |
44 % |
43 % |
43 % |
44 % |
45 % |
46 % |
| Hydrocodone |
26 % |
25 % |
26 % |
27 % |
26 % |
24 % |
24 % |
24 % |
| Morphine |
12 % |
12 % |
12 % |
11 % |
11 % |
11 % |
10 % |
10 % |
| Codéine |
1 % |
1 % |
1 % |
1 % |
1 % |
2 % |
2 % |
2 % |
| Tramadol |
11 % |
11 % |
11 % |
12 % |
13 % |
13 % |
13 % |
13 % |
Sources des données : Base de données MIDAS™ d’IQVIA, marchés de la vente au détail et des hôpitaux des médicaments d’ordonnance, de 2010 à 2017. Tous droits réservés.
Il existe d’importantes disparités entre les prix des opioïdes au Canada et aux États-Unis
Les prix moyens par milligramme de codéine, de morphine et d’oxycodone étaient nettement plus bas au Canada qu’aux États-Unis en 2017, tandis que le prix de l’hydromorphone était plus élevé. Malgré la disponibilité de produits génériques, le tramadol coûtait plus de 12 fois plus cher au Canada qu’aux États-Unis.
Figure 1.5 Prix par milligramme d’opioïde sous forme orale solide, Canada et États-Unis, 2017
| Opioïde |
Prix par milligramme ($ CA) |
Différence de prix au Canada |
| Canada |
États-Unis |
| Tramadol |
0,0139 $ |
0,0010 $ |
1 277 % |
| Codéine |
0,0058 $ |
0,0079 $ |
-26 % |
| Morphine |
0,0176 $ |
0,0265 $ |
-33 % |
| Hydrocodone* |
0,2284 $ |
0,0249 $ |
817 % |
| Oxycodone |
0,0419 $ |
0,0691 $ |
-39 % |
| Oxymorphone |
S.O. |
0,3404 $ |
S.O. |
| Hydromorphone |
0,1333 $ |
0,1173 $ |
14 % |
* L’utilisation d’hydrocodone sous forme orale solide est très peu élevée au Canada et n’est assurée que par les régimes privés.
Sources des données : Base de données MIDAS™ d’IQVIA, marchés de la vente au détail et des hôpitaux des médicaments d’ordonnance, 2017. Tous droits réservés.
Les prix des concentrations les plus vendues ont augmenté au Canada, sauf pour le tramadol et l’oxycodone
Les prix canadiens des concentrations les plus vendues de codéine et de morphine ont connu la plus forte hausse depuis 2010, comme l’indique leur taux de croissance annuel composé (TCAC) d’environ 3 %. Une plus forte variabilité des prix a été observée aux États-Unis, le tramadol ayant connu une forte baisse ces dernières années. Des versions génériques étaient disponibles pour tous les opioïdes aux États-Unis et pour la plupart au Canada.
Figure 1.6 Prix indexés sur 2010 des concentrations les plus vendues d’opioïdes sous forme orale solide, au Canada et aux États-Unis, de 2010 à 2017
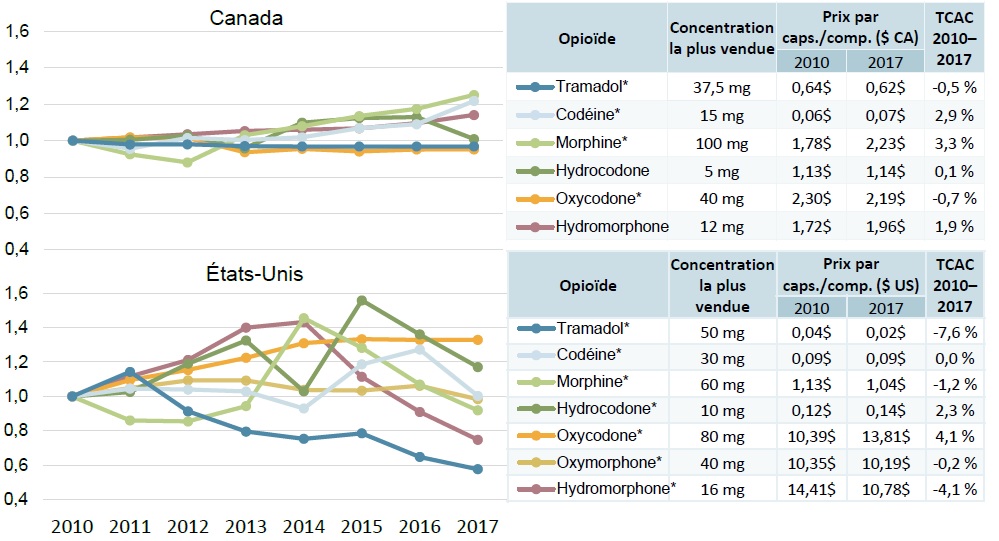
Description de la figure
Deux graphiques linéaires présentent les indices de prix canadiens et américains pour chaque opioïde sous forme orale solide de 2010 à 2017. Les prix annuels sont indexés au prix de 2010 et sont ceux de la concentration la plus vendue pour chaque opioïde. Les tableaux complémentaires indiquent le taux de croissance annuel composé de chaque opioïde au cours de la période, ainsi que le prix par capsule ou comprimé de 2010 et de 2017. Les opioïdes ayant des versions génériques sont marqués d’un astérisque.
Indice des prix canadiens
| Opioïde |
Concentration la plus vendue |
2010 |
2011 |
2012 |
2013 |
2014 |
2015 |
2016 |
2017 |
Prix par capsule ou comprimé ( $ CA) |
Taux de croissance annuel composé, de 2010 à 2017 |
| 2010 |
2017 |
| Tramadol* |
37,5 mg |
1,0 |
1,0 |
1,0 |
1,0 |
1,0 |
1,0 |
1,0 |
1,0 |
0,64 $ |
0,62 $ |
-0,5 % |
| Codéine* |
15 mg |
1,0 |
1,0 |
1,0 |
1,0 |
1,0 |
1,1 |
1,1 |
1,2 |
0,06 $ |
0,07 $ |
2,9 % |
| Morphine* |
100 mg |
1,0 |
0,9 |
0,9 |
1,0 |
1,1 |
1,1 |
1,2 |
1,3 |
1,78 $ |
2,23 $ |
3,3 % |
| Hydrocodone |
5 mg |
1,0 |
1,0 |
1,0 |
1,0 |
1,1 |
1,1 |
1,1 |
1,0 |
1,13 $ |
1,14 $ |
0,1% |
| Oxycodone* |
40 mg |
1,0 |
1,0 |
1,0 |
0,9 |
1,0 |
0,9 |
1,0 |
1,0 |
2,30 $ |
2,19 $ |
-0,7 % |
| Oxymorphone |
- |
- |
- |
- |
- |
- |
- |
- |
- |
- |
- |
- |
| Hydromorphone |
12 mg |
1,0 |
1,0 |
1,0 |
1,1 |
1,1 |
1,1 |
1,1 |
1,1 |
1,72 $ |
1,96 $ |
1,9 % |
Indice des prix américains
| Opioïde |
Concentration la plus vendue |
2010 |
2011 |
2012 |
2013 |
2014 |
2015 |
2016 |
2017 |
Prix par capsule ou comprimé ( $ US) |
Taux de croissance annuel composé, de 2010 à 2017 |
| 2010 |
2017 |
| Tramadol* |
50 mg |
1,0 |
1,1 |
0,9 |
0,8 |
0,8 |
0,8 |
0,6 |
0,6 |
0,04 $ |
0,02 $ |
-7,6 % |
| Codéine* |
30 mg |
1,0 |
1,0 |
1,0 |
1,0 |
0,9 |
1,2 |
1,3 |
1,0 |
0,09 $ |
0,09 $ |
0,0 % |
| Morphine* |
60 mg |
1,0 |
0,9 |
0,9 |
0,9 |
1,5 |
1,3 |
1,1 |
0,9 |
1,13 $ |
1,04 $ |
-1,2 % |
| Hydrocodone |
10 mg |
1,0 |
1,0 |
1,2 |
1,3 |
1,0 |
1,6 |
1,4 |
1,2 |
0,12 $ |
0,14 $ |
2,3 % |
| Oxycodone* |
80 mg |
1,0 |
1,1 |
1,2 |
1,2 |
1,3 |
1,3 |
1,3 |
1,3 |
10,39 $ |
13,81 $ |
4,1 % |
| Oxymorphone* |
40 mg |
1,0 |
1,0 |
1,1 |
1,1 |
1,0 |
1,0 |
1,1 |
1,0 |
10,35 $ |
10,19 $ |
-0,2 % |
| Hydromorphone* |
16 mg |
1,0 |
1,1 |
1,2 |
1,4 |
1,4 |
1,1 |
0,9 |
0,7 |
14,41 $ |
10,78 $ |
-4,1 % |
TCAC : Taux de croissance annuel composé.
Sources des données : Base de données MIDAS™ d’IQVIA, marchés de la vente au détail et des hôpitaux des médicaments d’ordonnance, de 2010 à 2017. Tous droits réservés.
2. Marchés provinciaux et publics canadiens
Le Québec représente une part beaucoup plus petite des ordonnances et des ventes d’opioïdes sous forme orale solide que celle des médicaments d’ordonnance en général, ce qui se traduit par une part proportionnellement plus élevée du marché des opioïdes dans la plupart des autres provinces
Le Québec représentait 21 % des ordonnances d’opioïde à l’échelle nationale en 2017, alors que la part de l’Ontario est le double (42 %) et que celle de la Colombie-Britannique et de l’Alberta est de 12 % chacune.
Figure 2.1 Répartition des ordonnances et des ventes au détail par province, opioïdes sous forme orale solide par rapport à tous les médicaments, 2017
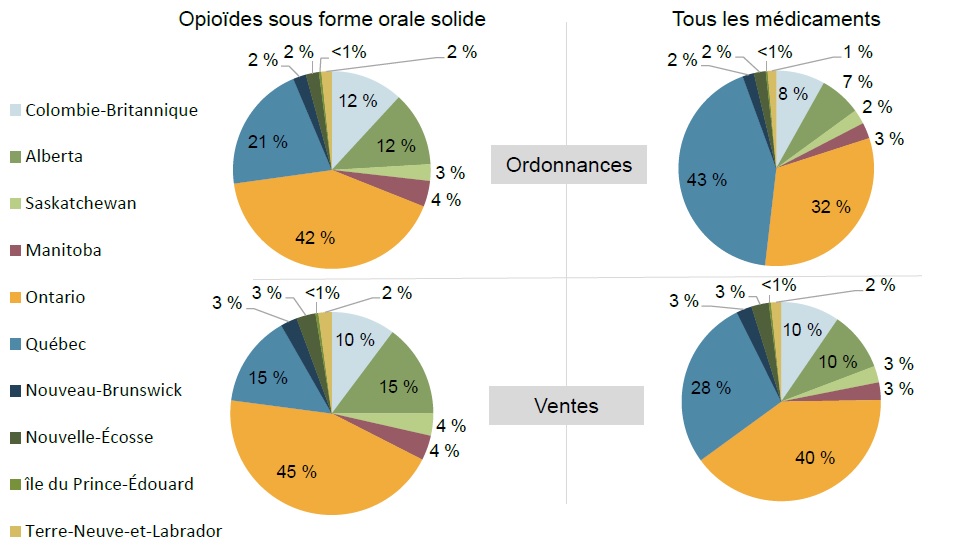
Description de la figure
La figure comprend quatre diagrammes circulaires ventilant les ventes et les ordonnances par province canadienne en 2017. Les résultats sont exprimés en proportion de l’ensemble du marché des médicaments d’ordonnance et du marché des opioïdes sous forme orale solide.
blank
| |
Colombie-Britannique |
Alberta |
Saskatchewan |
Manitoba |
Ontario |
Québec |
Nouveau-Brunswick |
Nouvelle-Écosse |
Île-du-Prince-Édouard |
Terre-Neuve-et-Labrador |
| Opioïdes sous forme orale solide |
| Ordonnances |
12 % |
12 % |
3 % |
4 % |
42 % |
21 % |
2 % |
2 % |
<1 % |
2 % |
| Ventes |
10 % |
15 % |
4 % |
4 % |
45 % |
15 % |
3 % |
3 % |
<1 % |
2 % |
| Tous les médicaments |
| Ordonnances |
8 % |
7 % |
2 % |
3 % |
32 % |
43 % |
2 % |
2 % |
<1 % |
1 % |
| Ventes |
10 % |
10 % |
3 % |
3 % |
40 % |
28 % |
3 % |
3 % |
<1 % |
2 % |
Sources des données : Base de données Payer Insight d’IQVIA sur les payeurs, 2017. Inclut les ventes au détail dans les marchés publics, privés et des particuliers.
En proportion, les payeurs privés et les particuliers canadiens utilisent une part proportionnellement plus importante d’opioïdes sous forme orale solide que celle de tous les médicaments combinés, selon le volume d’ordonnances
En 2017, la moitié des ordonnances pour opioïdes étaient payées par les payeurs privés et les particuliers, soit 27 % et 23 %, respectivement.
Figure 2.2 Part des ordonnances et des ventes au détail par payeur, opioïdes sous forme orale solide par rapport à tous les médicaments, 2017
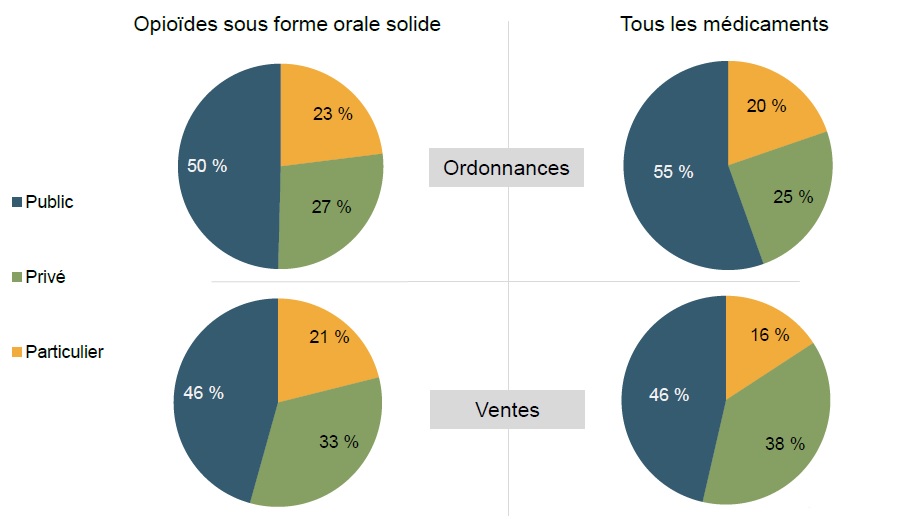
Description de la figure
La figure comprend quatre diagrammes circulaires ventilant les ventes et les ordonnances du marché canadien selon le type de payeur en 2017. Les résultats sont exprimés en proportion de l’ensemble du marché des médicaments d’ordonnance et du marché des opioïdes sous forme orale solide.
blank
| |
Public |
Privé |
Particuliers |
| Opioïdes sous forme orale solide |
| Ordonnances |
50 % |
27 % |
23 % |
| Ventes |
46 % |
33 % |
21 % |
| Tous les médicaments |
| Ordonnances |
55 % |
25 % |
20 % |
| Ventes |
46 % |
38 % |
16 % |
Sources des données : Base de données Payer Insight d’IQVIA sur les payeurs, 2017. Inclut les ventes au détail dans les marchés publics, privés et des particuliers.
La majorité des ordonnances de vente au détail d’opioïdes sous forme orale solide sont payées par des payeurs privés et des particuliers dans presque toutes les provinces
L’Ontario et le Québec sont les seules provinces où les régimes publics étaient le premier payeur pour la majorité des ordonnances de vente au détail, soit 52 % et 51 %, respectivement.
Figure 2.3 Part des ordonnances et des ventes au détail par payeur*, opioïdes sous forme orale solide, 2017
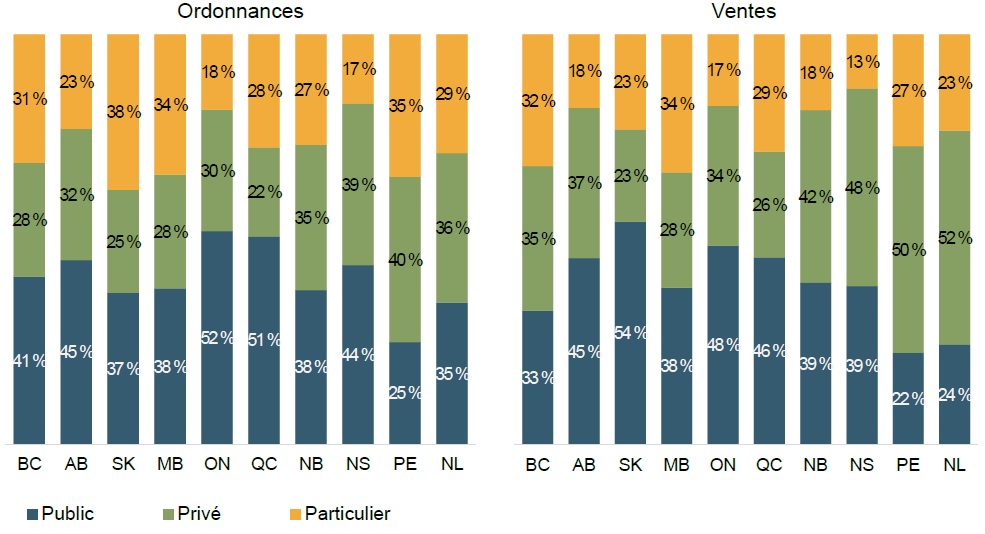
Description de la figure
Deux histogrammes empilés présentent une ventilation des ordonnances et des ventes d’opioïdes sous forme orale solide en 2017 par payeur. Les résultats sont présentés pour les payeurs publics, privés et particuliers de chaque province.
Ordonnances
| |
Colombie-Britannique |
Alberta |
Saskatchewan |
Manitoba |
Ontario |
Québec |
Nouveau-Brunswick |
Nouvelle-Écosse |
Île-du-Prince-Édouard |
Terre-Neuve-et-Labrador |
| Publics |
41 % |
45 % |
37 % |
38 % |
52 % |
51 % |
38 % |
44 % |
25 % |
35 % |
| Privés |
28 % |
32 % |
25 % |
28 % |
30 % |
22 % |
35 % |
39 % |
40 % |
36 % |
| Particuliers |
31 % |
23 % |
38 % |
34 % |
18 % |
28 % |
27 % |
17 % |
35 % |
29 % |
Ventes
| |
Colombie-Britannique |
Alberta |
Saskatchewan |
Manitoba |
Ontario |
Québec |
Nouveau-Brunswick |
Nouvelle-Écosse |
Île-du-Prince-Édouard |
Terre-Neuve-et-Labrador |
| Publics |
33 % |
45 % |
54 % |
38 % |
48 % |
46 % |
39 % |
39 % |
22 % |
24 % |
| Privés |
35 % |
37 % |
23 % |
28 % |
34 % |
26 % |
42 % |
48 % |
50 % |
52 % |
| Particuliers |
32 % |
18 % |
23 % |
34 % |
17 % |
29 % |
18 % |
13 % |
27 % |
23 % |
* Les ordonnances des SSNA ne sont pas incluses.
Sources des données : Base de données Payer Insight d’IQVIA sur les payeurs, 2017. Inclut les ventes au détail dans les marchés publics, privés et des particuliers.
Le Québec affiche la plus faible proportion d’utilisation d’ordonnances d’opioïde relativement aux ordonnances et aux ventes au détail, tandis que l’Alberta présente le taux le plus élevé
En pourcentage de tous les médicaments, les ordonnances et les ventes au détail des opioïdes sous forme orale solide au Québec représentent moins de la moitié des proportions observées dans toute autre province en 2017.
Figure 2.4 Part des opioïdes sous forme orale solide dans les ordonnances et les ventes au détail totales, 2017
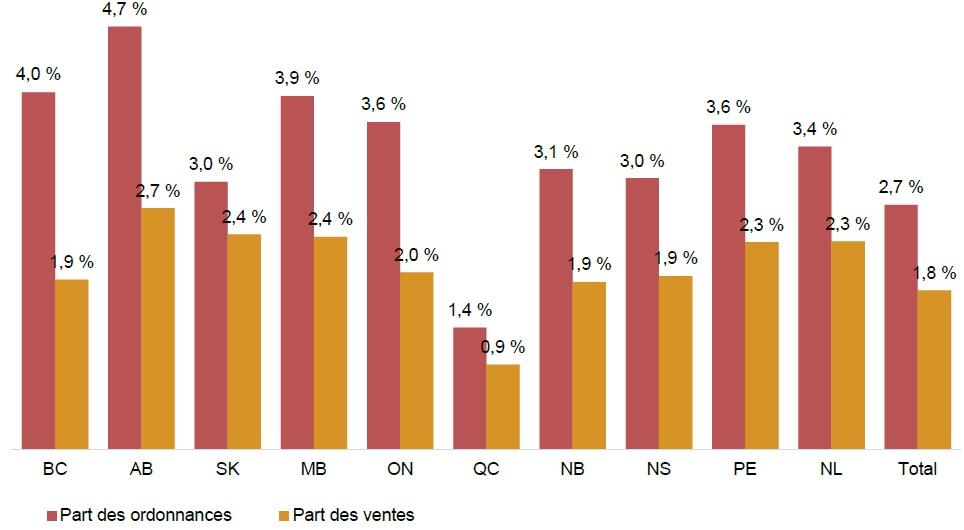
Description de la figure
La figure comporte un histogramme à barres indiquant la part des ordonnances et des ventes de 2017 pour chaque province. Les résultats totaux pour toutes les provinces sont également indiqués.
blank
| Province |
Part des ordonnances |
Part des ventes |
| Colombie-Britannique |
4,0 % |
1,9 % |
| Alberta |
4,7 % |
2,7 % |
| Saskatchewan |
3,0 % |
2,4 % |
| Manitoba |
3,9 % |
2,4 % |
| Ontario |
3,6 % |
2,0 % |
| Québec |
1,4 % |
0,9 % |
| Nouveau-Brunswick |
3,1 % |
1,9 % |
| Nouvelle-Écosse |
3,0 % |
1,9 % |
| Île-du-Prince-Édouard |
3,6 % |
2,3 % |
| Terre-Neuve-et-Labrador |
3,4 % |
2,3 % |
| Total |
2,7 % |
1,8 % |
Sources des données : Base de données Payer Insight d’IQVIA sur les payeurs, 2017. Inclut les ventes au détail dans les marchés publics, privés et des particuliers.
Les opioïdes représentent une part importante des ordonnances et des coûts des médicaments et leur part est plus élevée dans les régimes privés
La part des ordonnances d’opioïdes était de 4,4 %. dans les régimes privés et de 2,9 % dans les régimes publics en 2017.
Figure 2.5 Part des opioïdes sous forme orale solide dans le total des coûts des médicaments* et des ordonnances, régimes publics du SNIUMP et régimes privés, 2017
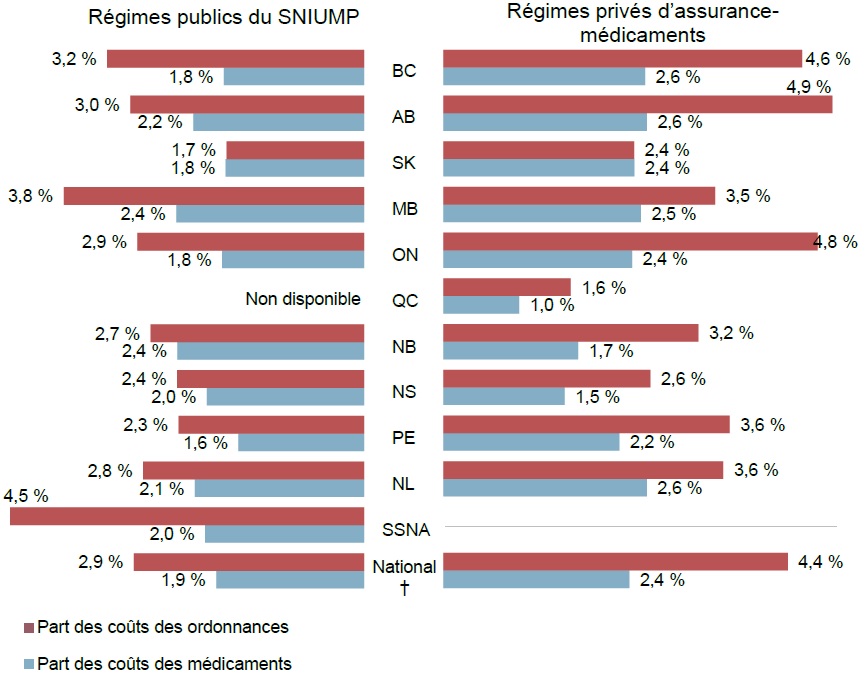
Description de la figure
L’histogramme à barres « en double » compare la part des ordonnances et des coûts des médicaments dans les régimes publics et privés d’assurance-médicaments. Les résultats de chacun des régimes sont présentés par province et les totaux sont inclus pour les provinces ayant des données sur les régimes publics et privés en 2017.
blank
| |
Colombie-Britannique |
Alberta |
Saskatchewan |
Manitoba |
Ontario |
Québec |
Nouveau-Brunswick |
Nouvelle-Écosse |
Île-du-Prince-Édouard |
Terre-Neuve-et-Labrador |
Programme des services de santé non assurés |
National† |
| Régimes publics du SNIUMP |
| Part des ordonnances |
3,2 % |
3,0 % |
1,7 % |
3,8 % |
2,9 % |
Non disponible |
2,7 % |
2,4 % |
2,3 % |
2,8 % |
4,5 % |
2,9 % |
| Part des coûts des médicaments |
1,8 % |
2,2 % |
1,8 % |
2,4 % |
1,8 % |
Non disponible |
2,4 % |
2,0 % |
1,6 % |
2,1 % |
2,0 % |
1,9 % |
| Régimes privés d’assurance-médicaments |
| Part des ordonnances |
4,6 % |
4,9 % |
2,4 % |
3,5 % |
4,8 % |
1,6 % |
3,2 % |
2,6 % |
3,6 % |
3,6 % |
- |
4,4 % |
| Part des coûts des médicaments |
2,6 % |
2,6 % |
2,4 % |
2,5 % |
2,4 % |
1,0 % |
1,7 % |
1,5 % |
2,2 % |
2,6 % |
- |
2,4 % |
* Incluent le coût des médicaments et la marge bénéficiaire. Les coûts d’exécution d’ordonnance sont exclus.
† Inclut seulement les administrations qui ont des données sur les régimes publics et privés; les SSNA (régime public seulement) et le Québec (régime privé seulement) sont exclus de ces résultats.
Sources des données : Base de données nationale sur l’utilisation des médicaments prescrits, Institut canadien d’information sur la santé, 2017; vase de données Private Pay Direct Drug Plan d’IQVIA, 2017.
Le nombre d’ordonnances d’hydromorphone a triplé dans les régimes publics depuis 2010 et a presque doublé dans les régimes privés
Les ordonnances de tramadol et de morphine dans les régimes privés sont aussi en hausse.
Figure 2.6 Nombre d’ordonnances indexé sur 2010 d’opioïdes sous forme orale solide des régimes publics du SNIUMP et des régimes privés, de 2010 à 2017
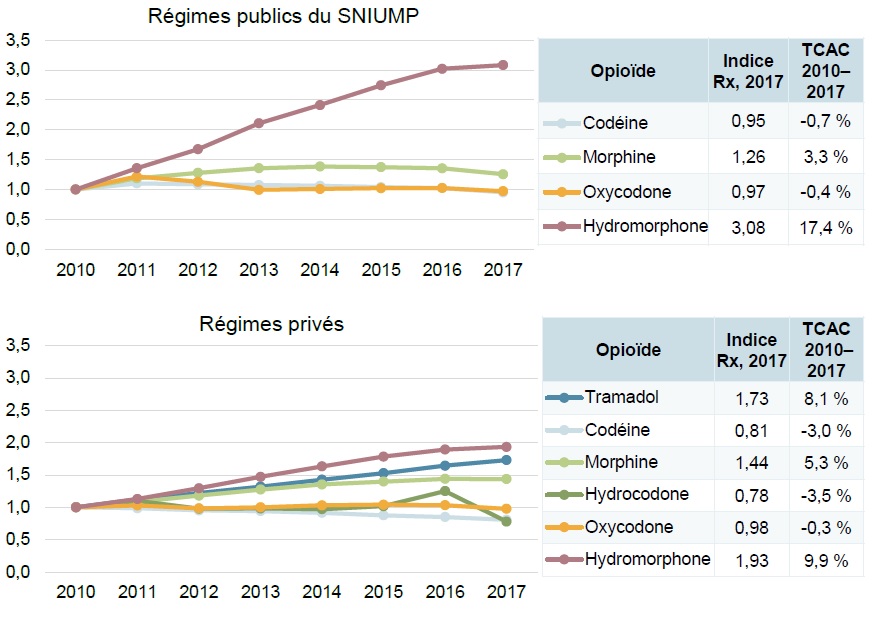
Description de la figure
Deux graphiques linéaires accompagnés de tableaux indiquent le nombre d’ordonnances d’opioïdes sous forme orale solide de 2010 à 2017, indexé sur 2010. Le premier illustre les résultats des régimes publics du SNIUMP et le deuxième, ceux des régimes privés. Les taux de croissance annuels composés sont également indiqués pour chaque opioïde.
Régimes publics du SNIUMP
|
2010 |
2011 |
2012 |
2013 |
2014 |
2015 |
2016 |
2017 |
Taux de croissance annuel composé, de 2010 à 2017 |
| Codéine |
1,00 |
1,10 |
1,09 |
1,08 |
1,06 |
1,04 |
1,03 |
0,95 |
-0,7 % |
| Morphine |
1,00 |
1,19 |
1,28 |
1,36 |
1,38 |
1,37 |
1,36 |
1,26 |
3,3 % |
| Oxycodone |
1,00 |
1,22 |
1,13 |
1,00 |
1,01 |
1,02 |
1,03 |
0,97 |
-0,4 % |
| Hydromorphone |
1,00 |
1,36 |
1,68 |
2,11 |
2,41 |
2,74 |
3,02 |
3,08 |
17,4 % |
Régimes privés
| |
2010 |
2011 |
2012 |
2013 |
2014 |
2015 |
2016 |
2017 |
Taux de croissance annuel composé, de 2010 à 2017 |
| Tramadol |
1,00 |
1,12 |
1,22 |
1,32 |
1,43 |
1,53 |
1,64 |
1,73 |
8,1 % |
| Codéine |
1,00 |
0,99 |
0,95 |
0,94 |
0,92 |
0,88 |
0,85 |
0,81 |
-3,0 % |
| Morphine |
1,00 |
1,08 |
1,18 |
1,27 |
1,35 |
1,40 |
1,44 |
1,44 |
5,3 % |
| Hydrocodone |
1,00 |
1,10 |
0,98 |
0,98 |
0,97 |
1,02 |
1,25 |
0,78 |
-3,5 % |
| Oxycodone |
1,00 |
1,03 |
0,98 |
1,00 |
1,03 |
1,04 |
1,03 |
0,98 |
-0,3 % |
| Hydromorphone |
1,00 |
1,13 |
1,29 |
1,47 |
1,63 |
1,78 |
1,89 |
1,93 |
9,9 % |
Remarque : Les régimes publics n’ont couvert aucune ordonnance d’hydrocodone sous forme orale solide entre 2010 et 2017. Les données du tramadol dans les régimes publics ne peuvent être déclarées en raison des exigences de confidentialité liées aux faibles valeurs.
TCAC : Taux de croissance annuel composé.
Source des données : Base de données du Système national d’information sur l’utilisation des médicaments prescrits, Institut canadien d’information sur la santé, de 2010 à 2017; base de données Private Pay Direct Drug Plan d’IQVIA, de 2010 à 2017.
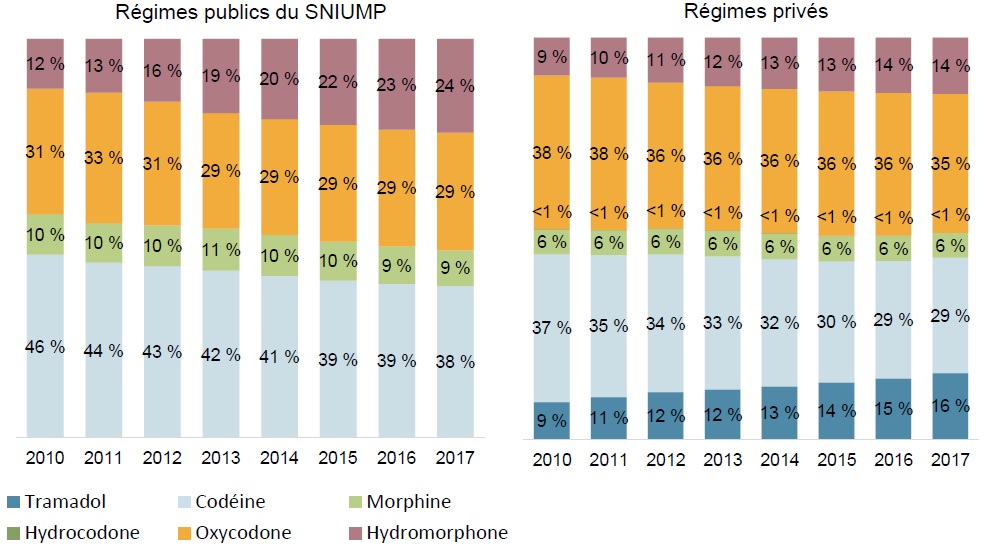
L’hydromorphone représente maintenant le tiers du marché des ordonnances du régime public d’assurance-médicaments,car son utilisation a augmenté de façon marquée au cours des récentes années
L’utilisation de l’hydromorphone et du tramadol a augmenté de façon constante de 2010 à 2017 dans les régimes privés, même si la codéine et l’oxycodone restent en tête du marché.
Les figures A3 et A4 de l’annexe fournissent des renseignements semblables sur les unités et les coûts des médicaments, respectivement.
Figure 2.7 Répartition des ordonnances par opioïde sous forme orale solide, régimes publics du SNIUMP et régimes privés, de 2010 à 2017
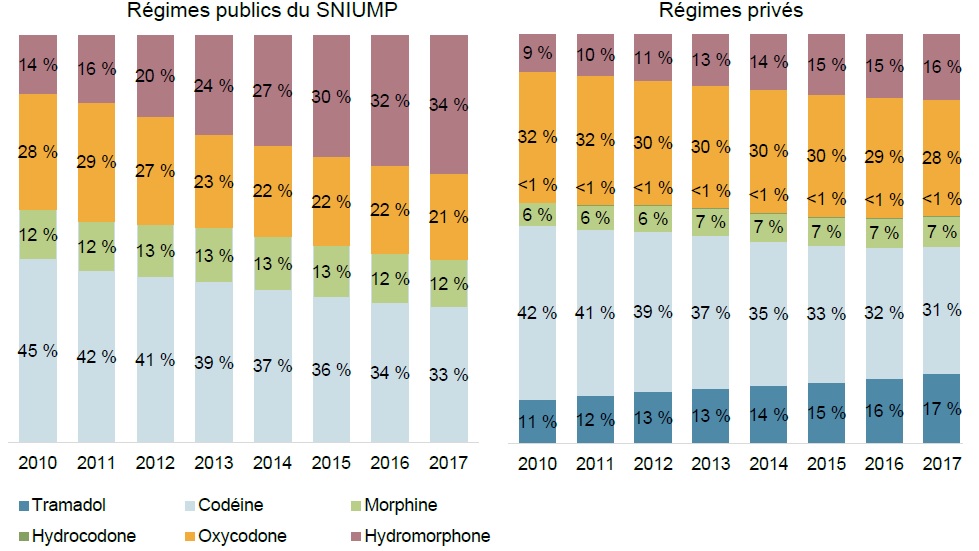
Description de la figure
La figure comprend deux histogrammes empilés ventilant les ordonnances par opioïde pour chaque année de 2010 à 2017. Le premier histogramme montre les résultats des régimes publics d’assurance-médicaments du SNIUMP et le deuxième, ceux des régimes privés d’assurance-médicaments.
Régimes publics du SNIUMP
|
2010 |
2011 |
2012 |
2013 |
2014 |
2015 |
2016 |
2017 |
| Codéine |
45 % |
42 % |
41 % |
39 % |
37 % |
36 % |
34 % |
33 % |
| Morphine |
12 % |
12 % |
13 % |
13 % |
13 % |
13 % |
12 % |
12 % |
| Oxycodone |
28 % |
29 % |
27 % |
23 % |
22 % |
22 % |
22 % |
21 % |
| Hydromorphone |
14 % |
16 % |
20 % |
24 % |
27 % |
30 % |
32 % |
34 % |
Régimes privés
| |
2010 |
2011 |
2012 |
2013 |
2014 |
2015 |
2016 |
2017 |
| Tramadol |
11 % |
12 % |
13 % |
13 % |
14 % |
15 % |
16 % |
17 % |
| Codéine |
42 % |
41 % |
39 % |
37 % |
35 % |
33 % |
32 % |
31 % |
| Morphine |
6 % |
6 % |
6 % |
7 % |
7 % |
7 % |
7 % |
7 % |
| Hydrocodone |
<1 % |
<1 % |
<1 % |
<1 % |
<1 % |
<1 % |
<1 % |
<1 % |
| Oxycodone |
32 % |
32 % |
30 % |
30 % |
30 % |
30 % |
29 % |
28 % |
| Hydromorphone |
9 % |
10 % |
11 % |
13 % |
14 % |
15 % |
15 % |
16 % |
Remarque : Les régimes publics n’ont couvert aucune ordonnance d’hydrocodone sous forme orale solide entre 2010 et 2017. Les données du tramadol dans les régimes publics ne peuvent être déclarées en raison des exigences de confidentialité liées aux faibles.
Sources des données : Base de données nationale sur l’utilisation des médicaments prescrits, Institut canadien d’information sur la santé, de 2010 à 2017; base de données Private Pay Direct Drug Plan d’IQVIA, de 2010 à 2017.
En raison de la forte croissance du nombre d’ordonnances dans les régimes publics, l’hydromorphone représente maintenant la plus grande part des ordonnances et des coûts des médicaments
Dans les régimes privés, l’oxycodone arrive toujours en tête pour les coûts des médicaments, suivie du tramadol, alors que la codéine est l’opioïde le plus prescrit.
Figure 2.8 Répartition du marché par unités, ordonnances et coûts des médicaments*, opioïdes sous forme orale solide, régimes publics du SNIUMP et régimes privés, 2017
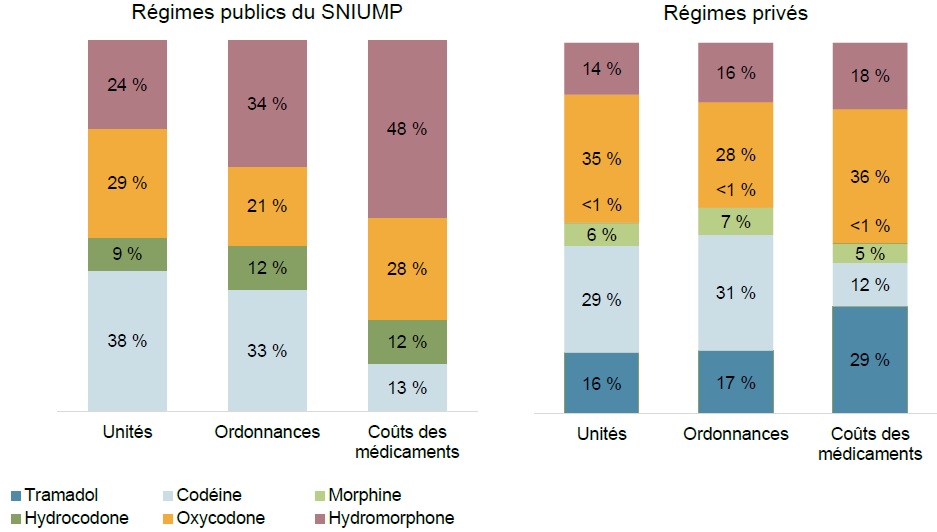
Description de la figure
Deux histogrammes empilés indiquent la répartition des unités, des ordonnances et des coûts des médicaments entre les opioïdes sous forme orale solide. Le premier donne la répartition au sein des régimes publics d’assurance-médicaments du SNIUMP et le second, celle pour les régimes privés d’assurance-médicaments.
Régimes publics du SNIUMP
| |
Unités |
Ordonnances |
Coûts des médicaments |
| Codéine |
38 % |
33 % |
13 % |
| Morphine |
9 % |
12 % |
12 % |
| Oxycodone |
29 % |
21 % |
28 % |
| Hydromorphone |
24 % |
34 % |
48 % |
Régimes privés
Ventes
| |
Unités physiques |
Ordonnances |
Coûts des médicaments |
| Tramadol |
16 % |
17 % |
29 % |
| Codéine |
29 % |
31 % |
12 % |
| Morphine |
6 % |
7 % |
5 % |
| Hydrocodone |
<1 % |
<1 % |
<1 % |
| Oxycodone |
35 % |
28 % |
26 % |
| Hydromorphone |
14 % |
16 % |
18 % |
Remarque : Les régimes publics n’ont couvert aucune ordonnance d’hydrocodone sous forme orale solide entre 2010 et 2017. Les données du tramadol dans les régimes publics ne peuvent être déclarées en raison des exigences de confidentialité liées aux faibles valeurs.
* Incluent le coût des médicaments et la marge bénéficiaire. Les coûts d’exécution d’ordonnance sont exclus.
Sources des données : Base de données nationale sur l’utilisation des médicaments prescrits, Institut canadien d’information sur la santé, 2017; base de données Private Pay Direct Drug Plan d’IQVIA, 2017.
Les femmes représentent plus de la moitié des ordonnances d’opioïdes traitées dans les régimes publics et privés, ce qui est semblable à la tendance observée pour l’ensemble des ordonnances de médicaments
Aucune différence significative n’a été observée dans la répartition des opioïdes selon le sexe.
Figure 2.9 Nombre d’ordonnances selon le sexe, opioïdes* comparativement à tous les médicaments, régimes publics du SNIUMP et régimes privés†, 2017
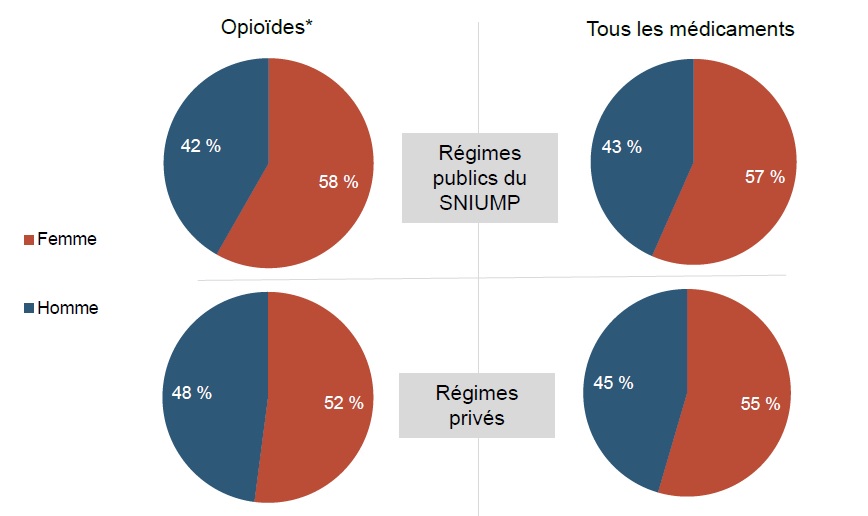
Description de la figure
Les quatre diagrammes circulaires de cette figure ventilent les ordonnances d’opioïdes sous forme orale solide selon le sexe en pourcentage des ordonnances pour tous les médicaments et des ordonnances d’opioïdes sous forme orale solide. Les résultats sont présentés séparément pour les régimes publics d’assurance-médicaments du SNIUMP et les régimes privés d’assurance-médicaments.
blank
| |
Femmes |
Hommes |
| Régimes publics du SNIUMP |
| Opioïdes* |
58 % |
42 % |
| Tous les médicaments |
57 % |
43 % |
| Régimes privés |
| Opioïdes sous forme orale solide |
52 % |
48 % |
| Tous les médicaments |
55 % |
45 % |
* Les résultats sont fondés sur les données des régimes publics du SNIUMP portant sur les opioïdes sous forme orale solide, tandis que ceux fondés sur les données des régimes privés incluent les formulations solides autres qu’orales.
† Comprend uniquement les administrations qui disposent de données publiques et privées; les données sur les SSNA et le Québec ne sont pas incluses dans ces résultats.
Sources des données : Base de données nationale sur l’utilisation des médicaments prescrits, Institut canadien d’information sur la santé, 2017; base de données Private Pay Direct Drug Plan d’IQVIA, 2017.
Les bénéficiaires âgés de 65 ans et plus, qui constituent le groupe démographique le plus important dans les régimes publics, représentent la majorité des ordonnances orales d’opioïdes solides, mais sont proportionnellement moins nombreux que leur part pour toutes les ordonnances de médicaments
Les données relatives aux régimes privés, qui ne se limitaient pas aux formes solides orales, présentent une plus grande concordance entre les parts d’ordonnances d’opioïdes par groupe d’âge et les parts de tous les médicaments.
Figure 2.10 Ordonnances d’opioïdes* selon l’âge, régimes publics du SNIUMP et régimes privés d’assurance-médicaments†, 2017
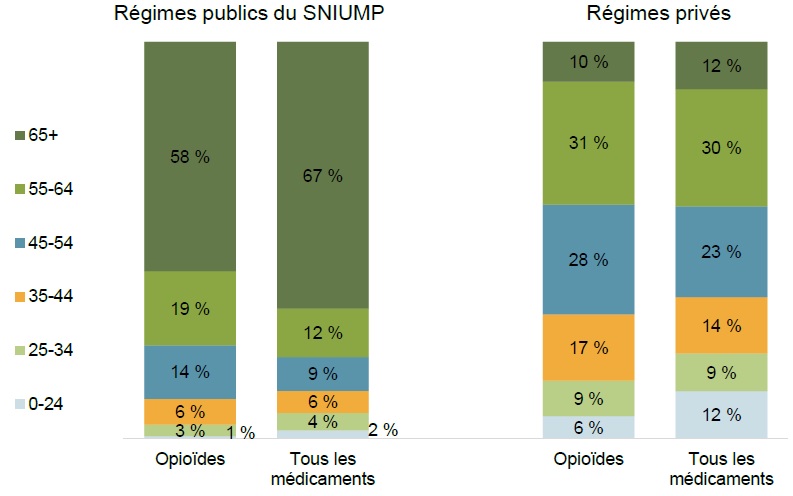
Description de la figure
Cette figure se compose de deux histogrammes empilés, contenant de l’information sur la répartition des ordonnances d’opioïdes sous forme orale solide selon le groupe d’âge en 2017. Les parts sont présentées pour chaque groupe d’âge en pourcentage des ordonnances d’opioïdes et en pourcentage de tous les médicaments. Le premier graphique donne les résultats pour les régimes publics d’assurance-médicaments du SNIUMP et le second, pour les régimes privés d’assurance-médicaments.
blank
|
Régimes publics du SNIUMP |
Régimes privés |
| |
Opioïdes |
Tous les médicaments |
Opioïdes |
Tous les médicaments |
| 0-24 |
1 % |
2 % |
6 % |
12 % |
| 25-34 |
3 % |
4 % |
9 % |
9 % |
| 35-44 |
6 % |
6 % |
17 % |
14 % |
| 45-54 |
14 % |
9 % |
28 % |
23 % |
| 55-64 |
19 % |
12 % |
31 % |
30 % |
| 65+ |
58 % |
67 % |
10 % |
12 % |
* Les résultats fondés sur les données des régimes publics du SNIUMP portent sur les opioïdes sous forme orale solide, tandis que ceux fondés sur les données des régimes privés comprennent des formulations solides autres qu’orales
† Inclut seules les administrations qui ont des données sur les régimes publics et privés sont incluses; les SSNA (régime public seulement) et le Québec (régime privé seulement) sont exclus de ces résultats.
Sources des données : Base de données nationale sur l’utilisation des médicaments prescrits, Institut canadien d’information sur la santé, 2017; base de données Private Pay Direct Drug Plan d’IQVIA, 2017.
L’hydromorphone est l’opioïde le plus couramment utilisé par les aînés dans les régimes publics, et sa part d’utilisation dans presque tous les groupes d’âge est plus élevée dans les régimes publics que dans les régimes privés. Le tramadol est l’opioïde le plus utilisé par les aînés dans les régimes privés, et sa part d’utilisation est importante dans tous les groupes d’âge
L’hydromorphone représentait jusqu’à 41 % des ordonnances d’opioïdes sous forme orale solide délivrées aux patients de 65 ans et plus dans les régimes publics. Dans les régimes privés, le tramadol était plus couramment utilisé par les aînés que la codéine, représentant 33 % de toutes les ordonnances d’opioïdes, y compris celles des formes solides non orales.
Figure 2.11 Répartition des ordonnances d’opioïdes* par tranches d’âge, régimes publics du SNIUMP et régimes privés, 2017
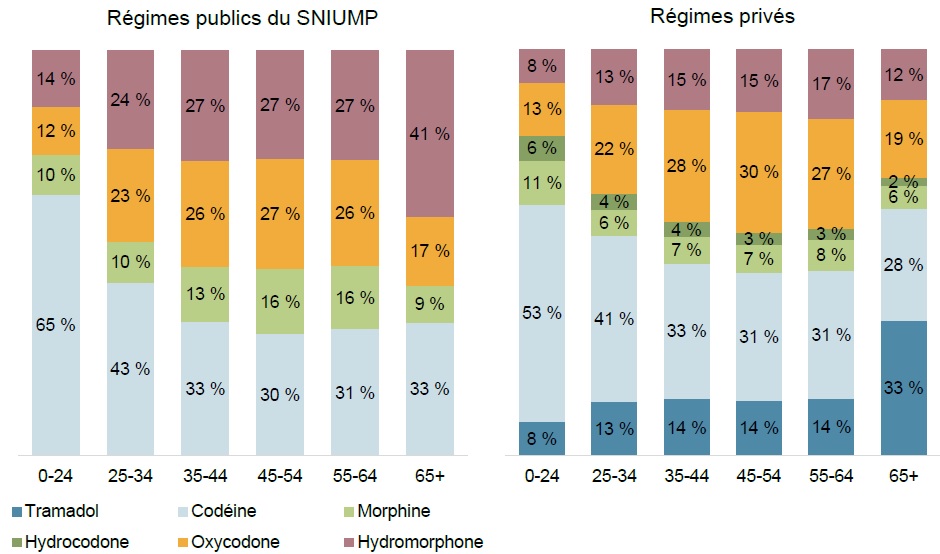
Description de la figure
Deux histogrammes empilés montrent la part des ordonnances pour chaque opioïde selon l’âge. Le premier graphique donne les résultats pour les régimes publics d’assurance-médicaments du SNIUMP et le second, pour les régimes privés d’assurance-médicaments.
Régimes publics du SNIUMP
| |
0-24 |
25-34 |
35-44 |
45-54 |
55-64 |
65+ |
| Codéine |
65 % |
43 % |
33 % |
30 % |
31 % |
33 % |
| Morphine |
10 % |
10 % |
13 % |
16 % |
16 % |
9 % |
| Oxycodone |
12 % |
23 % |
26 % |
27 % |
26 % |
17 % |
| Hydromorphone |
14 % |
24 % |
27 % |
27 % |
27 % |
41 % |
Régimes privés
| |
0-24 |
25-34 |
35-44 |
45-54 |
55-64 |
65+ |
| Tramadol |
8 % |
13 % |
14 % |
14 % |
14 % |
33 % |
| Codéine |
53 % |
41 % |
33 % |
31 % |
31 % |
28 % |
| Morphine |
11 % |
6 % |
7 % |
7 % |
8 % |
6 % |
| Hydrocodone |
6 % |
4 % |
4 % |
3 % |
3 % |
2 % |
| Oxycodone |
13 % |
22 % |
28 % |
30 % |
27 % |
19 % |
| Hydromorphone |
8 % |
13 % |
15 % |
15 % |
17 % |
12 % |
Remarque : Les régimes publics n’ont couvert aucune ordonnance d’hydrocodone sous forme orale solide entre 2010 et 2017. Les données du tramadol dans les régimes publics ne peuvent être déclarées en raison des exigences de confidentialité liées aux faibles valeurs.
* Les résultats fondés sur les données des régimes publics du SNIUMP portent sur les opioïdes sous forme orale solide, tandis que ceux fondés sur les données des régimes privés comprennent des formulations solides autres qu’orales.
Sources des données : Base de données nationale sur l’utilisation des médicaments prescrits, Institut canadien d’information sur la santé, 2017; base de données Private Pay Direct Drug Plan d’IQVIA, 2017.
Bien que les résultats varient d’un régime à l’autre, en moyenne, les coûts d’exécution des opioïdes représentent près d’un tiers des coûts d’ordonnance dans les régimes publics et moins du quart dans les régimes privés
Les écarts entre les provinces et les territoires dans la part des coûts d’ordonnance totaux peuvent être attribuables à un certain nombre de facteurs, dont le profil démographique et le profil pathologique, ainsi que la quantité délivrée pour chaque ordonnance.
Figure 2.12 Coûts des médicaments* et part des coûts d’exécution d’ordonnance totaux des opioïdes sous forme orale solide, régimes publics du SNIUMP et régimes privés, 2017
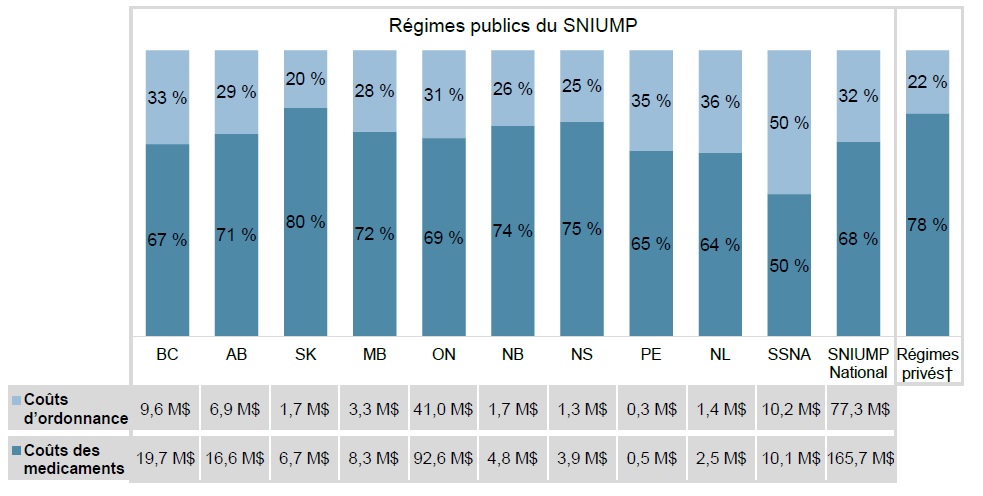
Description de la figure
Un histogramme empilé montre les parts des coûts des médicaments et des coûts d’exécution de toutes les dépenses relatives aux opioïdes sous forme orale solide dans les régimes publics d’assurance-médicaments du SNIUMP en 2017. Le graphique indique les pourcentages pour chaque administration ainsi que la part pour le total de tous les régimes publics du SNIUMP et un tableau complémentaire indique les dépenses correspondantes en millions de dollars. Les parts des régimes privés sont également indiquées dans une barre distincte.
blank
| |
Régimes publics du SNIUMP |
Régimes privés† |
| Colombie-Britannique |
Alberta |
Saskatchewan |
Manitoba |
Ontario |
Nouveau-Brunswick |
Nouvelle-Écosse |
Île-du-Prince-Édouard |
Terre-Neuve-et-Labrador |
Services de santé non assurés |
Tous les régimes du SNIUMP |
| Coûts d’ordonnance (part) |
33 % |
29 % |
20 % |
28 % |
31 % |
26 % |
25 % |
35 % |
36 % |
50 % |
32 % |
22 % |
| Coût des médicaments (part) |
67 % |
71 % |
80 % |
72 % |
69 % |
74 % |
75 % |
65 % |
64 % |
50 % |
68 % |
78 % |
| Coûts d’ordonnance (en millions) |
9,6 $ |
6,9 $ |
1,7 $ |
3,3 $ |
41,0 $ |
1,7 $ |
1,3 $ |
0,3 $ |
1,4 $ |
10,2 $ |
77,3 $ |
- |
| Coûts des médicaments (en millions) |
19,7 $ |
16,6 $ |
6,7 $ |
8,3 $ |
92,6 $ |
4,8 $ |
3,9 $ |
0,5 $ |
2,5 $ |
10,1 $ |
165,7 $ |
- |
* Incluent le coût des médicaments et la marge bénéficiaire.
† La moyenne des régimes privés exclut le Québec à des fins de comparaison.
Source des données : Base de données nationale sur l’utilisation des médicaments prescrits, Institut canadien d’information sur la santé, 2017; base de données Private Pay Direct Drug Plan d’IQVIA, 2017.
Les régimes d’assurance-médicaments assument la majorité des coûts d’ordonnance liés aux opioïdes sous forme orale solide , quoique la part payée par le régime varie entre les administrations
Les bénéficiaires de régimes publics ont payé en moyenne 15 % du total des coûts d’ordonnance pour les opioïdes sous forme orale solide en 2017, comparativement à 12 % pour les bénéficiaires de régimes privés. Les variations entre les administrations peuvent être dues au modèle du régime et aux politiques de remboursement, ainsi qu’aux profils démographiques et pathologiques des bénéficiaires.
Figure 2.13 Part payée par le patient et part payée par le régime du coût total des ordonnances, opioïdes sous forme orale solide, régimes publics du SNIUMP et régimes privés, 2017
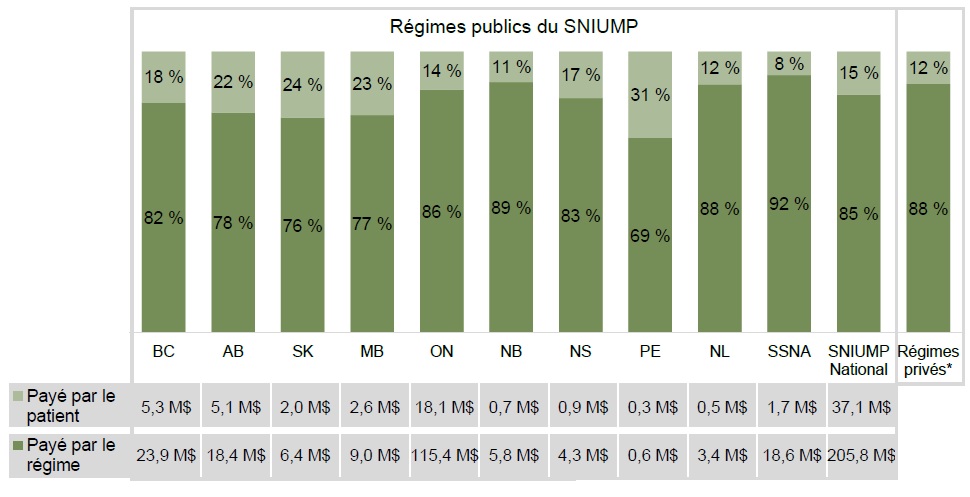
Description de la figure
Cet histogramme empilé montre la ventilation des coûts des opioïdes sous forme orale solide dans les régimes publics du SNIUMP et dans les régimes privés d’assurance-médicaments entre les parts payées par le régime et celles payées par les patients. Les résultats sont fournis par administration pour les régimes publics et comprennent le total des parts pour toutes les administrations. Un tableau complémentaire présente en millions de dollars les montants en millions payés par les patients et payés par les régimes publics pour chaque régime.
blank
| |
Régimes publics du SNIUMP |
Régimes privés* |
| Colombie-Britannique |
Alberta |
Saskatchewan |
Manitoba |
Ontario |
Nouveau-Brunswick |
Nouvelle-Écosse |
Île-du-Prince-Édouard |
Terre-Neuve-et-Labrador |
Services de santé non assurés |
SNIUMP Échelle nationale |
| Payé par le régime (part) |
82 % |
78 % |
76 % |
77 % |
86 % |
89 % |
83 % |
69 % |
88 % |
92 % |
85 % |
88 % |
| Payé par le patient (part) |
18 % |
22 % |
24 % |
23 % |
14 % |
11 % |
17 % |
31 % |
12 % |
8 % |
15 % |
12 % |
| Payé par le régime (en millions) |
23,9 $ |
18,4 $ |
6,4 $ |
9,0 $ |
115,4 $ |
5,8 $ |
4,3 $ |
0,6 $ |
3,4 $ |
18,6 $ |
205,8 $ |
- |
| Payé par le patient (en millions) |
5,3 $ |
5,1 $ |
2,0 $ |
2,6 $ |
18,1 $ |
0,7 $ |
0,9 $ |
0,3 $ |
0,5 $ |
1,7 $ |
37,1 $ |
- |
* La moyenne des régimes privés exclut le Québec à des fins de comparaison.
Sources des données : Base de données nationale sur l’utilisation des médicaments prescrits, Institut canadien d’information sur la santé, 2017; base de données Private Pay Direct Drug Plan d’IQVIA, 2017.
En Colombie-Britannique, le coût annuel moyen des médicaments par patient a diminué pour la plupart des opioïdes
Une analyse des données des régimes publics et privés montre que les opioïdes les plus concentrés présentent les baisses les plus fortes coût par patient entre 2010 et 2017 : -26 % pour l’hydromorphone; -21 % pour l’oxycodone; et -43 % pour la morphine. Le tramadol a également connu une baisse de 9 %; alors que la codéine a augmenté de 20 %.
Figure 2.14 Coût moyen des opioïdes* par patient, régimes publics et privés de la Colombie-Britannique, de 2010 à 2017
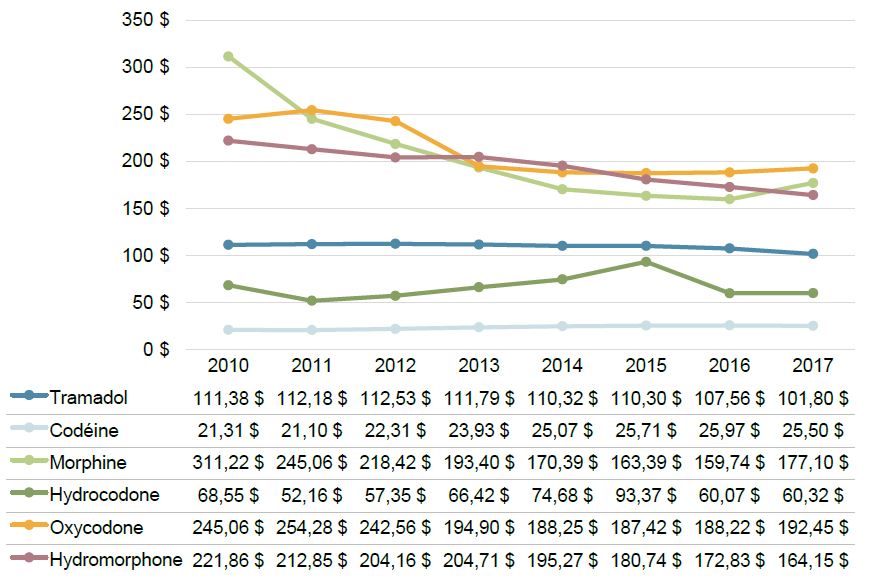
Description de la figure
Un graphique linéaire illustre le coût moyen des médicaments par demandeur dans les régimes publics d’assurance-médicaments de la Colombie-Britannique. Les résultats sont donnés par opioïde pour chaque année de 2010 à 2017.
blank
|
2010 |
2011 |
2012 |
2013 |
2014 |
2015 |
2016 |
2017 |
| Tramadol |
111 $ |
112 $ |
113 $ |
112 $ |
110 $ |
110 $ |
108 $ |
102 $ |
| Codéine |
21 $ |
21 $ |
22 $ |
24 $ |
25 $ |
26 $ |
26 $ |
25 $ |
| Morphine |
311 $ |
245 $ |
218 $ |
193 $ |
170 $ |
163 $ |
160 $ |
177 $ |
| Hydrocodone |
69 $ |
52 $ |
57 $ |
66 $ |
75 $ |
93 $ |
60 $ |
60 $ |
| Oxycodone |
245 $ |
254 $ |
243 $ |
195 $ |
188 $ |
187 $ |
188 $ |
192 $ |
| Hydromorphone |
222 $ |
213 $ |
204 $ |
205 $ |
195 $ |
181 $ |
173 $ |
164 $ |
* Les résultats comprennent les formulations solides orales et non orales.
Sources des données : Institut canadien d’information sur la santé, de 2010 à 2017.
Annexe
Figure A1 Répartition des parts de marché par unités, opioïdes sous forme orale solide, Canada et États-Unis, de 2010 à 2017
Description de la figure
Deux histogrammes empilés, pour le marché canadien et pour le marché américain respectivement, indiquent la répartition annuelle des unités par opioïde de 2010 à 2017, en pourcentage du total des unités d’opioïdes sous forme orale solide.
Canada
| |
2010 |
2011 |
2012 |
2013 |
2014 |
2015 |
2016 |
2017 |
| Tramadol |
3 % |
4 % |
6 % |
6 % |
5 % |
5 % |
6 % |
6 % |
| Codéine |
63 % |
56 % |
47 % |
46 % |
57 % |
55 % |
53 % |
52 % |
| Morphine |
5 % |
6 % |
7 % |
7 % |
6 % |
5 % |
6 % |
6 % |
| Hydrocodone |
- |
- |
- |
- |
- |
- |
- |
- |
| Oxycodone |
21 % |
25 % |
28 % |
27 % |
21 % |
21 % |
22 % |
21 % |
| Oxymorphone |
- |
- |
- |
- |
- |
- |
- |
- |
| Hydromorphone |
8 % |
10 % |
13 % |
14 % |
12 % |
13 % |
14 % |
14 % |
États-Unis
| |
2010 |
2011 |
2012 |
2013 |
2014 |
2015 |
2016 |
2017 |
| Tramadol |
17 % |
17 % |
17 % |
18 % |
19 % |
20 % |
20 % |
19 % |
| Codéine |
3 % |
3 % |
3 % |
3 % |
3 % |
4 % |
4 % |
4 % |
| Morphine |
4 % |
4 % |
4 % |
4 % |
4 % |
4 % |
4 % |
4 % |
| Hydrocodone |
45 % |
45 % |
45 % |
45 % |
43 % |
39 % |
38 % |
38 % |
| Oxycodone |
28 % |
28 % |
29 % |
28 % |
29 % |
30 % |
32 % |
32 % |
| Oxymorphone |
0 % |
1 % |
1 % |
1 % |
1 % |
1 % |
1 % |
0 % |
| Hydromorphone |
2 % |
2 % |
2 % |
2 % |
2 % |
2 % |
2 % |
2 % |
Sources des données : Base de données MIDAS™ d’IQVIA, marchés de la vente au détail et des hôpitaux des médicaments d’ordonnance, de 2010 à 2017. Tous droits réservés.
Figure A2 Répartition des ventes par opioïde sous forme orale solide, Canada et États-Unis, de 2010 à 2017
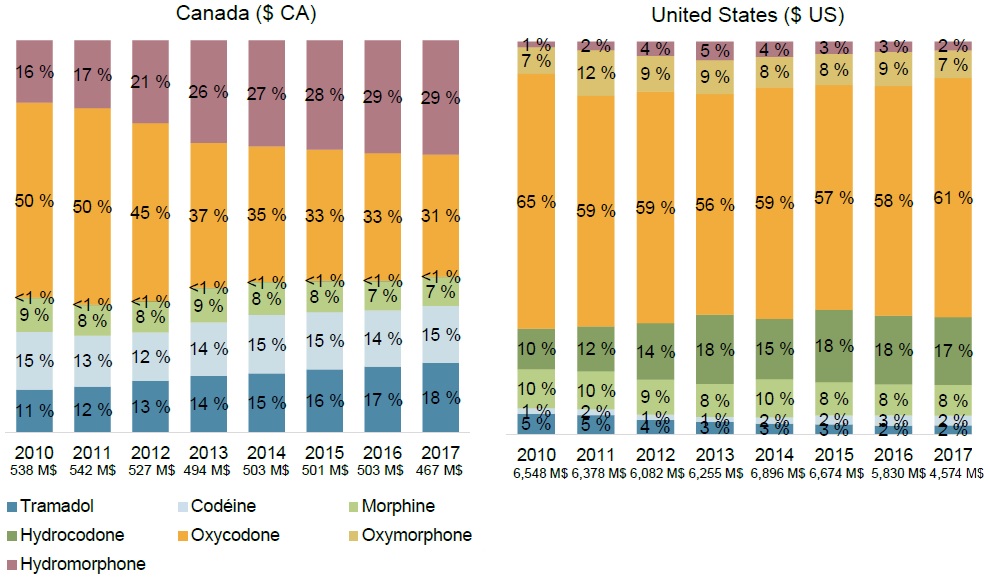
Description de la figure
La figure se compose de deux histogrammes empilés, l’un pour le marché canadien et l’autre pour le marché américain, avec des renseignements sur la répartition annuelle des ventes d’opioïdes sous forme orale solide de 2010 à 2017. Le montant total des ventes est également indiqué en millions de dollars pour chaque année.
Canada
| |
2010 |
2011 |
2012 |
2013 |
2014 |
2015 |
2016 |
2017 |
| Hydromorphone |
16 % |
17 % |
21 % |
26 % |
27 % |
28 % |
29 % |
29 % |
| Oxycodone |
50 % |
50 % |
45 % |
37 % |
35 % |
33 % |
33 % |
31 % |
| Hydrocodone |
<1 % |
<1 % |
<1 % |
<1 % |
<1 % |
<1 % |
<1 % |
<1 % |
| Morphine |
9 % |
8 % |
8 % |
9 % |
8 % |
8 % |
7 % |
7 % |
| Codéine |
15 % |
13 % |
12 % |
14 % |
15 % |
15 % |
14 % |
15 % |
| Tramadol |
11 % |
12 % |
13 % |
14 % |
15 % |
16 % |
17 % |
18 % |
| Ventes totales (en M$ CA) |
538 $ |
542 $ |
527 $ |
494 $ |
503 $ |
501 $ |
503 $ |
467 $ |
États-Unis
| |
2010 |
2011 |
2012 |
2013 |
2014 |
2015 |
2016 |
2017 |
| Hydromorphone |
1 % |
2 % |
4 % |
5 % |
4 % |
3 % |
3 % |
2 % |
| Oxymorphone |
7 % |
12 % |
9 % |
9 % |
8 % |
8 % |
9 % |
7 % |
| Oxycodone |
65 % |
59 % |
59 % |
56 % |
59 % |
57 % |
58 % |
61 % |
| Hydrocodone |
10 % |
12 % |
14 % |
18 % |
15 % |
18 % |
18 % |
17 % |
| Morphine |
10 % |
10 % |
9 % |
8 % |
10 % |
8 % |
8 % |
8 % |
| Codéine |
1 % |
2 % |
1 % |
1 % |
2 % |
2 % |
3 % |
2 % |
| Tramadol |
5 % |
5 % |
4 % |
3 % |
3 % |
3 % |
2 % |
2 % |
| Ventes totales (en M$ US) |
6 548 $ |
6 378 $ |
6 082 $ |
6 255 $ |
6 896 $ |
6 674 $ |
5 830 $ |
4 574 $ |
Sources des données : Base de données MIDAS™ d’IQVIA, marchés de la vente au détail et des hôpitaux des médicaments d’ordonnance, de 2010 à 2017. Tous droits réservés.
Figure A3 Répartition des unités par opioïde sous forme orale solide, régimes publics du SNIUMP et régimes privés, de 2010 à 2017
Description de la figure
La figure se compose de deux histogrammes empilés, l’un pour les régimes publics d’assurance-médicaments du SNIUMP et l’autre pour les régimes privés, avec des renseignements sur la répartition des unités physiques d’opioïdes vendus de 2010 à 2017. Les résultats pour chaque opioïde sous forme orale solide sont exprimés en pourcentage du total des unités vendues.
Régimes publics du SNIUMP
| |
2010 |
2011 |
2012 |
2013 |
2014 |
2015 |
2016 |
2017 |
| Hydromorphone |
12 % |
13 % |
16 % |
19 % |
20 % |
22 % |
23 % |
24 % |
| Oxycodone |
31 % |
33 % |
31 % |
29 % |
29 % |
29 % |
29 % |
29 % |
| Morphine |
10 % |
10 % |
10 % |
11 % |
10 % |
10 % |
9 % |
9 % |
| Codéine |
46 % |
44 % |
43 % |
42 % |
41 % |
39 % |
39 % |
38 % |
Régimes privés
| |
2010 |
2011 |
2012 |
2013 |
2014 |
2015 |
2016 |
2017 |
| Hydromorphone |
9 % |
10 % |
11 % |
12 % |
13 % |
13 % |
14 % |
14 % |
| Oxycodone |
38 % |
38 % |
36 % |
36 % |
36 % |
36 % |
36 % |
35 % |
| Hydrocodone |
<1 % |
<1 % |
<1 % |
<1 % |
<1 % |
<1 % |
<1 % |
<1 % |
| Morphine |
6 % |
6 % |
6 % |
6 % |
6 % |
6 % |
6 % |
6 % |
| Codéine |
37 % |
35 % |
34 % |
33 % |
32 % |
30 % |
29 % |
29 % |
| Tramadol |
9 % |
11 % |
12 % |
12 % |
13 % |
14 % |
15 % |
16 % |
Remarque : Les régimes publics n’ont couvert aucune ordonnance d’hydrocodone sous forme orale solide entre 2010 et 2017. Les données du tramadol dans les régimes publics ne peuvent être déclarées en raison des exigences de confidentialité liées aux faibles valeurs.
Sources des données : Base de données du Système national d’information sur l’utilisation des médicaments prescrits, Institut canadien d’information sur la santé, de 2010 à 2017; base de données Private Pay Direct Drug Plan d’IQVIA, de 2010 à 2017.
Figure A4 Part des coûts par opioïde sous forme orale solide*, régimes publics du SNIUMP et régimes privés, de 2010 à 2017
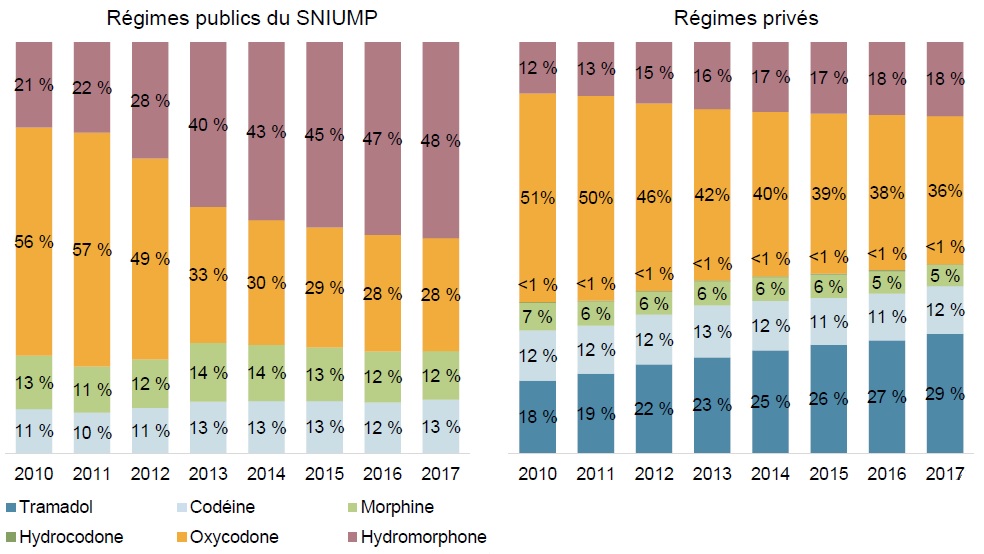
Description de la figure
Deux histogrammes empilés, l’un pour les régimes publics d’assurance-médicaments du SNIUMP et l’autre, pour les régimes privés, présentent la ventilation des coûts annuels des médicaments entre les opioïdes sous forme orale solide de 2010 à 2017. Les résultats pour chaque opioïde sont exprimés en pourcentage du coût total des opioïdes sous forme orale solide.
Régimes publics du SNIUMP
| |
2010 |
2011 |
2012 |
2013 |
2014 |
2015 |
2016 |
2017 |
| Hydromorphone |
21 % |
22 % |
28 % |
40 % |
43 % |
45 % |
47 % |
48 % |
| Oxycodone |
56 % |
57 % |
49 % |
33 % |
30 % |
29 % |
28 % |
28 % |
| Morphine |
13 % |
11 % |
12 % |
14 % |
14 % |
13 % |
12 % |
12 % |
| Codéine |
11 % |
10 % |
11 % |
13 % |
13 % |
13 % |
12 % |
13 % |
Régimes privés
| |
2010 |
2011 |
2012 |
2013 |
2014 |
2015 |
2016 |
2017 |
| Hydromorphone |
12 % |
13 % |
15 % |
16 % |
17 % |
17 % |
18 % |
18 % |
| Oxycodone |
51 % |
50 % |
46 % |
42 % |
40 % |
39 % |
38 % |
36 % |
| Hydrocodone |
<1 % |
<1 % |
<1 % |
<1 % |
<1 % |
<1 % |
<1 % |
<1 % |
| Morphine |
7 % |
6 % |
6 % |
6 % |
6 % |
6 % |
5 % |
5 % |
| Codéine |
12 % |
12 % |
12 % |
13 % |
12 % |
11 % |
11 % |
12 % |
| Tramadol |
18 % |
19 % |
22 % |
23 % |
25 % |
26 % |
27 % |
29 % |
Remarque : Les régimes publics n’ont couvert aucune ordonnance d’hydrocodone sous forme orale solide entre 2010 et 2017. Les données du tramadol dans les régimes publics ne peuvent être déclarées en raison des exigences de confidentialité liées aux faibles valeurs.
* Incluent le coût des médicaments et la marge bénéficiaire. Coûts d’ordonnance exclus.
Sources des données : Base de données du Système national d’information sur l’utilisation des médicaments prescrits, Institut canadien d’information sur la santé, de 2010 à 2017; base de données Private Pay Direct Drug Plan d’IQVIA, de 2010 à 2017.
Figure A5 Ventes totales, opioïdes sous forme orale solide, Canada et États-Unis, de 2010 à 2017
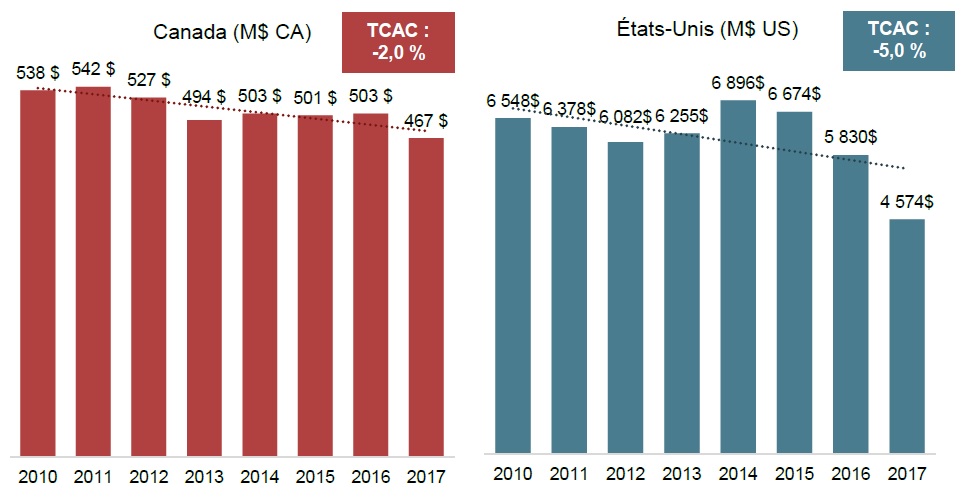
Description de la figure
Deux histogrammes à barres présentent les ventes annuelles totales d’opioïdes sous forme orale solide de 2010 à 2017. Le premier graphique indique les totaux pour le Canada en millions de dollars canadiens, et le deuxième, pour les États-Unis, en millions de dollars américains. Un taux de croissance annuel composé est également donné pour chacun.
blank
| |
Canada
(en M$ CA) |
États-Unis (en M$ US) |
| 2010 |
538 $ |
6 548 $ |
| 2011 |
542 $ |
6 378 $ |
| 2012 |
527 $ |
6 082 $ |
| 2013 |
494 $ |
6 255 $ |
| 2014 |
503 $ |
6 896 $ |
| 2015 |
501 $ |
6 674 $ |
| 2016 |
503 $ |
5 830 $ |
| 2017 |
467 $ |
4 574 $ |
| Taux de croissance annuel composé |
-2,0 % |
-5,0 % |
TCAC : taux de croissance annuel composé, de 2010 à 2017.
Sources des données : Base de données MIDAS™ d’IQVIA, marchés de la vente au détail et des hôpitaux des médicaments d’ordonnance, de 2010 à 2017. Tous droits réservés.
Figure A6 Ventes de tramadol par montant absolu et nombre de milligrammes, Canada et États-Unis, de 2010 à 2017
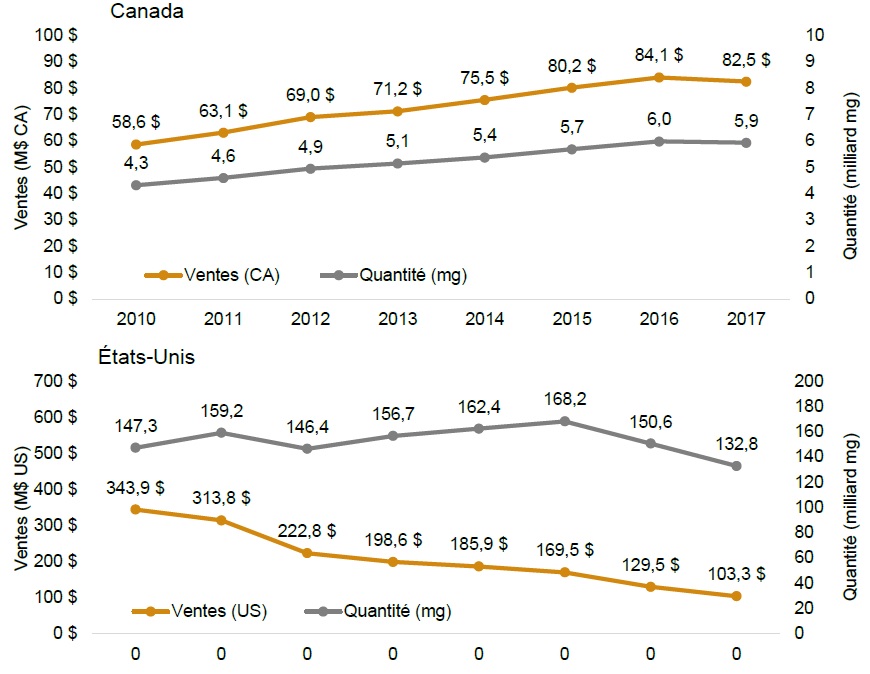
Description de la figure
Deux graphiques linéaires présentent les ventes et les unités de tramadol vendues au Canada et aux États-Unis. Les résultats sont donnés pour chaque année de 2010 à 2017. Les totaux des unités sont donnés en milligrammes. Les ventes au Canada sont exprimées en millions de dollars canadiens et celles aux États-Unis, en millions de dollars américains.
blank
|
2010 |
2011 |
2012 |
2013 |
2014 |
2015 |
2016 |
2017 |
| Canada |
| Ventes (en M$ CA) |
58,6 $ |
63,1 $ |
69,0 $ |
71,2 $ |
75,5 $ |
80,2 $ |
84,1 $ |
82,5 $ |
| Quantité (mg) |
4,3 |
4,6 |
4,9 |
5,1 |
5,4 |
5,7 |
6,0 |
5,9 |
| États-Unis |
| Ventes (en M$ US) |
343,9 $ |
313,8 $ |
222,8 $ |
198,6 $ |
185,9 $ |
169,5 $ |
129,5 $ |
103,3 $ |
| Quantité (mg) |
147,3 |
159,2 |
146,4 |
156,7 |
162,4 |
168,2 |
150,6 |
132,8 |
Sources des données : Base de données MIDAS™ d’IQVIA, marchés de la vente au détail et des hôpitaux des médicaments d’ordonnance, de 2010 à 2017. Tous droits réservés.
Figure A7 Prix moyen par milligramme, opioïdes sous forme orale solide, Canada, de 2010 à 2017
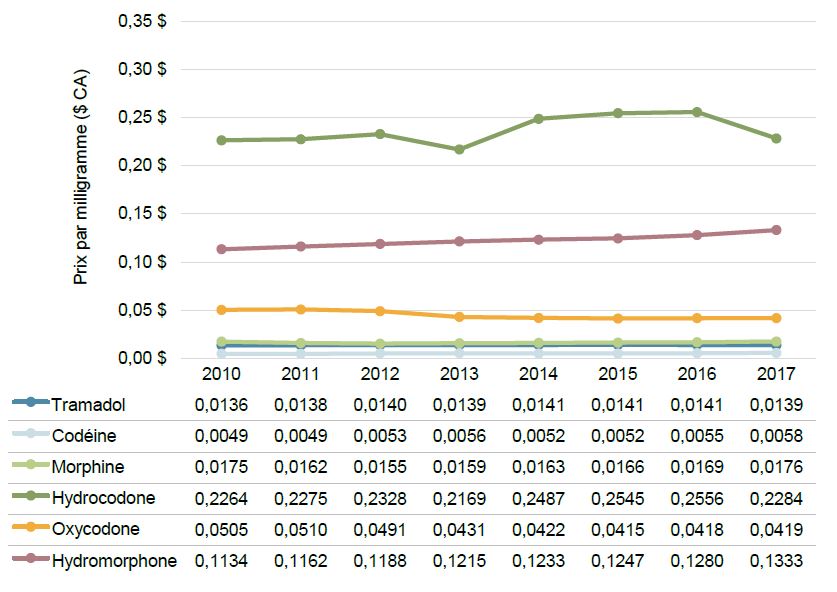
Description de la figure
Un graphique linéaire décrit la tendance du prix annuel moyen par unité d’opioïdes sous forme orale solide au Canada de 2010 à 2017. Les prix sont donnés en dollars canadiens par milligramme pour chaque molécule.
blank
|
2010 |
2011 |
2012 |
2013 |
2014 |
2015 |
2016 |
2017 |
| Tramadol |
0,0136 $ |
0,0138 $ |
0,0140 $ |
0,0139 $ |
0,0141 $ |
0,0141 $ |
0,0141 $ |
0,0139 $ |
| Codéine |
0,0049 $ |
0,0049 $ |
0,0053 $ |
0,0056 $ |
0,0052 $ |
0,0052 $ |
0,0055 $ |
0,0058 $ |
| Morphine |
0,0175 $ |
0,0162 $ |
0,0155 $ |
0,0159 $ |
0,0163 $ |
0,0166 $ |
0,0169 $ |
0,0176 $ |
| Hydrocodone |
0,2264 $ |
0,2275 $ |
0,2328 $ |
0,2169 $ |
0,2487 $ |
0,2545 $ |
0,2556 $ |
0,2284 $ |
| Oxycodone |
0,0505 $ |
0,0510 $ |
0,0491 $ |
0,0431 $ |
0,0422 $ |
0,0415 $ |
0,0418 $ |
0,0419 $ |
| Oxymorphone |
- |
- |
- |
- |
- |
- |
- |
- |
| Hydromorphone |
0,1134 $ |
0,1162 $ |
0,1188 $ |
0,1215 $ |
0,1233 $ |
0,1247 $ |
0,1280 $ |
0,1333 $ |
Sources des données : Base de données MIDAS™ d’IQVIA, marchés de la vente au détail et des hôpitaux des médicaments d’ordonnance, de 2010 à 2017. Tous droits réservés.
Figure A8 Prix moyen par milligramme, opioïdes sous forme orale solide, É.-U., de 2010 à 2017
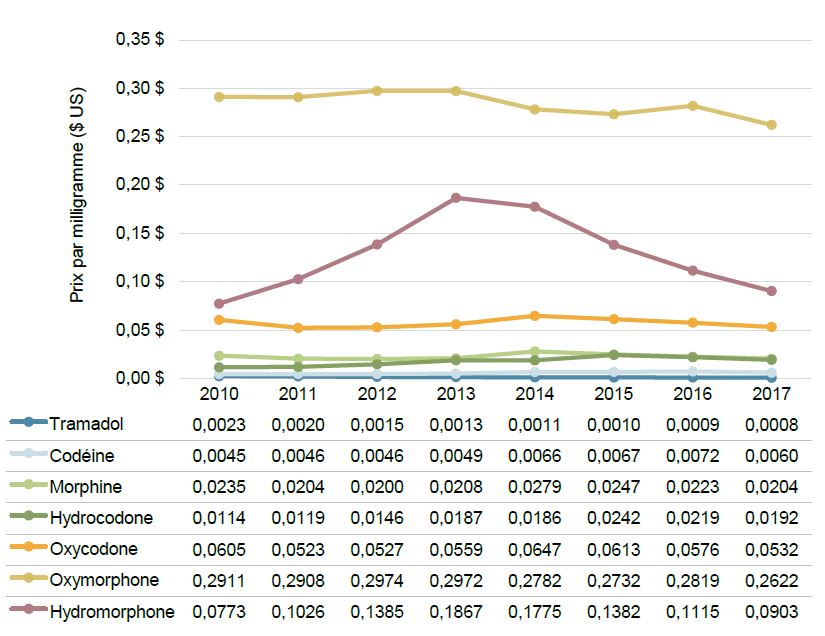
Description de la figure
Un graphique linéaire décrit la tendance du prix annuel moyen par unité d’opioïdes sous forme orale solide aux États-Unis de 2010 à 2017. Les prix sont donnés en dollars américains par milligramme pour chaque molécule.
blank
| |
2010 |
2011 |
2012 |
2013 |
2014 |
2015 |
2016 |
2017 |
| Tramadol |
0,0023 |
0,0020 |
0,0015 |
0,0013 |
0,0011 |
0,0010 |
0,0009 |
0,0008 |
| Codéine |
0,0045 |
0,0046 |
0,0046 |
0,0049 |
0,0066 |
0,0067 |
0,0072 |
0,0060 |
| Morphine |
0,0235 |
0,0204 |
0,0200 |
0,0208 |
0,0279 |
0,0247 |
0,0223 |
0,0204 |
| Hydrocodone |
0,0114 |
0,0119 |
0,0146 |
0,0187 |
0,0186 |
0,0242 |
0,0219 |
0,0192 |
| Oxycodone |
0,0605 |
0,0523 |
0,0527 |
0,0559 |
0,0647 |
0,0613 |
0,0576 |
0,0532 |
| Oxymorphone |
0,2911 |
0,2908 |
0,2974 |
0,2972 |
0,2782 |
0,2732 |
0,2819 |
0,2622 |
| Hydromorphone |
0,0773 |
0,1026 |
0,1385 |
0,1867 |
0,1775 |
0,1382 |
0,1115 |
0,0903 |
Sources des données : Base de données MIDAS™ d’IQVIA, marchés de la vente au détail et des hôpitaux des médicaments d’ordonnance, de 2010 à 2017. Tous droits réservés.
Figure A9 Ventes par habitant par opioïde sous forme orale solide, Canada, de 2010 à 2017
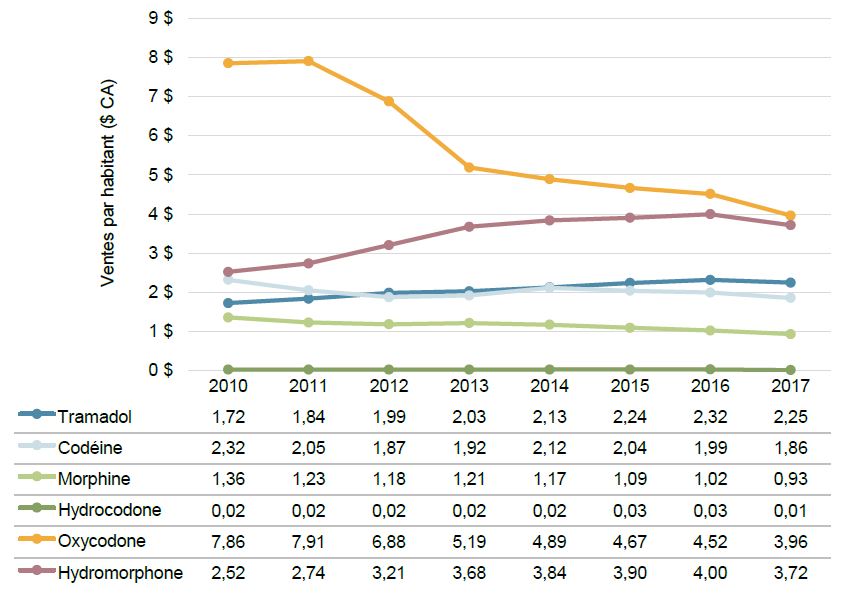
Description de la figure
Un graphique linéaire décrit la tendance des ventes canadiennes par habitant entre 2010 et 2017. Les ventes par habitant pour chaque opioïde sont exprimées en dollars canadiens et sont présentées dans un tableau sous le graphique.
blank
| |
2010 |
2011 |
2012 |
2013 |
2014 |
2015 |
2016 |
2017 |
| Tramadol |
1,72 |
1,84 |
1,99 |
2,03 |
2,13 |
2,24 |
2,32 |
2,25 |
| Codéine |
2,32 |
2,05 |
1,87 |
1,92 |
2,12 |
2,04 |
1,99 |
1,86 |
| Morphine |
1,36 |
1,23 |
1,18 |
1,21 |
1,17 |
1,09 |
1,02 |
0,93 |
| Hydrocodone |
0,02 |
0,02 |
0,02 |
0,02 |
0,02 |
0,03 |
0,03 |
0,01 |
| Oxycodone |
7,86 |
7,91 |
6,88 |
5,19 |
4,89 |
4,67 |
4,52 |
3,96 |
| Hydromorphone |
2,52 |
2,74 |
3,21 |
3,68 |
3,84 |
3,90 |
4,00 |
3,72 |
Sources des données : Base de données MIDAS™ d’IQVIA, marchés de la vente au détail et des hôpitaux des médicaments d’ordonnance, de 2010 à 2017. Tous droits réservés.
Figure A10 Ventes par habitant par opioïde sous forme orale solide, É.-U., de 2010 à 2017
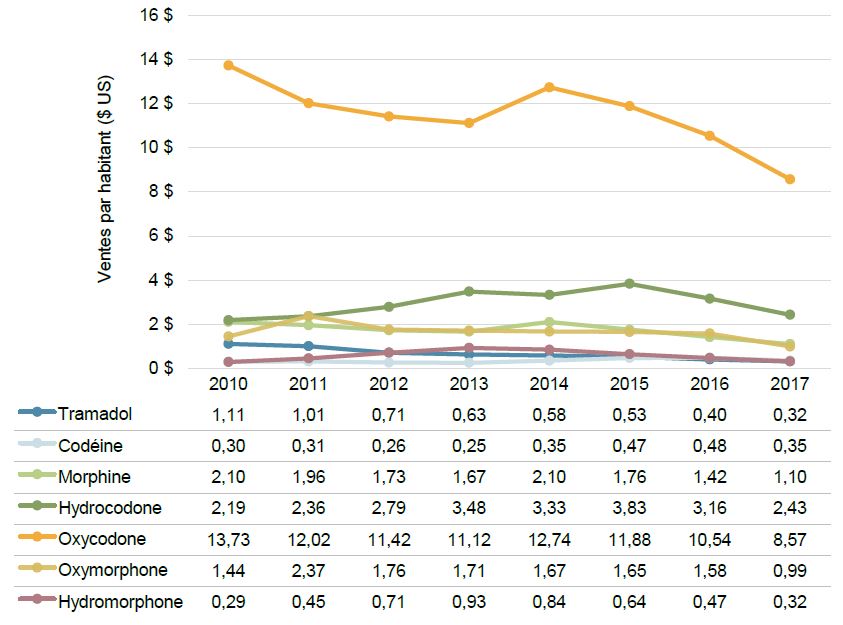
Description de la figure
Un graphique linéaire décrit la tendance des ventes par habitant aux États-Unis de 2010 à 2017. Les ventes par habitant pour chaque opioïde sont exprimées en dollars américains et sont présentées dans un tableau sous le graphique.
blank
| |
2010 |
2011 |
2012 |
2013 |
2014 |
2015 |
2016 |
2017 |
| Tramadol |
1,11 |
1,01 |
0,71 |
0,63 |
0,58 |
0,53 |
0,40 |
0,32 |
| Codéine |
0,30 |
0,31 |
0,26 |
0,25 |
0,35 |
0,47 |
0,48 |
0,35 |
| Morphine |
2,10 |
1,96 |
1,73 |
1,67 |
2,10 |
1,76 |
1,42 |
1,10 |
| Hydrocodone |
2,19 |
2,36 |
2,79 |
3,48 |
3,33 |
3,83 |
3,16 |
2,43 |
| Oxycodone |
13,73 |
12,02 |
11,42 |
11,12 |
12,74 |
11,88 |
10,54 |
8,57 |
| Oxymorphone |
1,44 |
2,37 |
1,76 |
1,71 |
1,67 |
1,65 |
1,58 |
0,99 |
| Hydromorphone |
0,29 |
0,45 |
0,71 |
0,93 |
0,84 |
0,64 |
0,47 |
0,32 |
Sources des données : Base de données MIDAS™ d’IQVIA, marchés de la vente au détail et des hôpitaux des médicaments d’ordonnance, de 2010 à 2017. Tous droits réservés.
Figure A11 Milligrammes par habitant vendus par opioïde sous forme orale solide, Canada, de 2010 à 2017
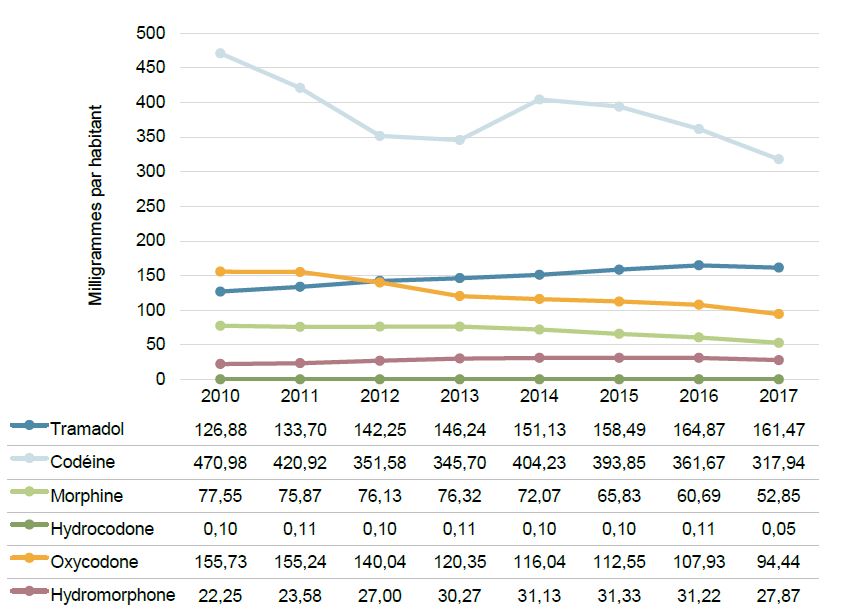
Description de la figure
Un graphique linéaire décrit la tendance des milligrammes d’opioïdes sous forme orale solide vendus par habitant au Canada. Les milligrammes par habitant sont indiqués pour chaque année et pour chaque opioïde vendu et sont présentés dans un tableau sous le graphique.
blank
| |
2010 |
2011 |
2012 |
2013 |
2014 |
2015 |
2016 |
2017 |
| Tramadol |
126,88 |
133,70 |
142,25 |
146,24 |
151,13 |
158,49 |
164,87 |
161,47 |
| Codéine |
470,98 |
420,92 |
351,58 |
345,70 |
404,23 |
393,85 |
361,67 |
317,94 |
| Morphine |
77,55 |
75,87 |
76,13 |
76,32 |
72,07 |
65,83 |
60,69 |
52,85 |
| Hydrocodone |
0,10 |
0,11 |
0,10 |
0,11 |
0,10 |
0,10 |
0,11 |
0,05 |
| Oxycodone |
155,73 |
155,24 |
140,04 |
120,35 |
116,04 |
112,55 |
107,93 |
94,44 |
| Hydromorphone |
22,25 |
23,58 |
27,00 |
30,27 |
31,13 |
31,33 |
31,22 |
27,87 |
Sources des données : Base de données MIDAS™ d’IQVIA, marchés de la vente au détail et des hôpitaux des médicaments d’ordonnance, de 2010 à 2017. Tous droits réservés.
Figure A12 Milligrammes par habitant vendus par opioïde sous forme orale solide, É.-U., de 2010 à 2017
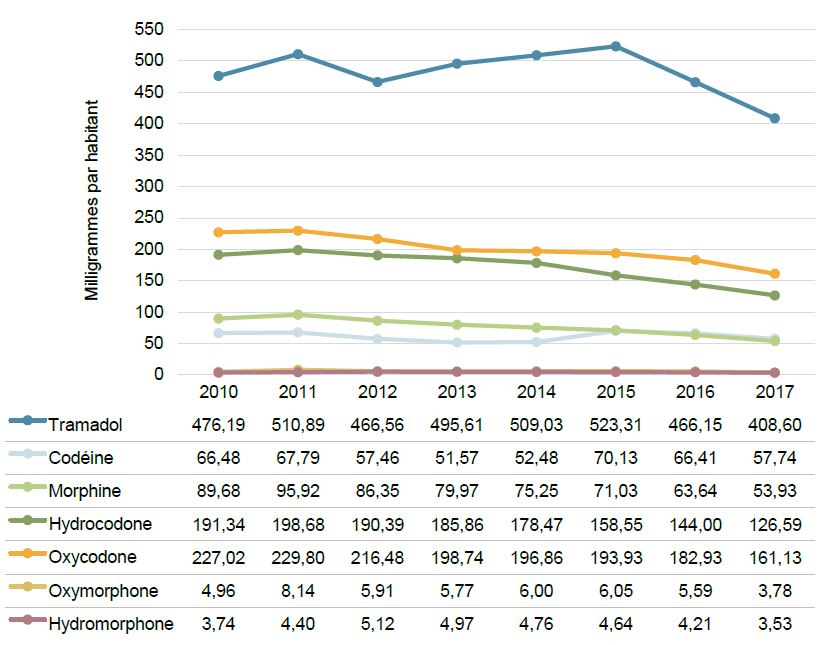
Description de la figure
Un graphique linéaire décrit la tendance des milligrammes d’opioïdes sous forme orale solide vendus par habitant aux États-Unis. Les milligrammes par habitant sont donnés pour chaque année et pour chaque opioïde et sont présentés dans un tableau sous le graphique.
| |
2010 |
2011 |
2012 |
2013 |
2014 |
2015 |
2016 |
2017 |
| Hydromorphone |
3,74 |
4,40 |
5,12 |
4,97 |
4,76 |
4,64 |
4,21 |
3,53 |
| Oxymorphone |
4,96 |
8,14 |
5,91 |
5,77 |
6,00 |
6,05 |
5,59 |
3,78 |
| Oxycodone |
227,02 |
229,80 |
216,48 |
198,74 |
196,86 |
193,93 |
182,93 |
161,13 |
| Hydrocodone |
191,34 |
198,68 |
190,39 |
185,86 |
178,47 |
158,55 |
144,00 |
126,59 |
| Morphine |
89,68 |
95,92 |
86,35 |
79,97 |
75,25 |
71,03 |
63,64 |
53,93 |
| Codéine |
66,48 |
67,79 |
57,46 |
51,57 |
52,48 |
70,13 |
66,41 |
57,74 |
| Tramadol |
476,19 |
510,89 |
466,56 |
495,61 |
509,03 |
523,31 |
466,15 |
408,60 |
Sources des données : Base de données MIDAS™ d’IQVIA, marchés de la vente au détail et des hôpitaux des médicaments d’ordonnance, de 2010 à 2017. Tous droits réservés.