Coût des médicaments utilisés dans le traitement de la dégénérescence maculaire liée à l’âge au Canada et à l’échelle internationale
PDF - 821 ko
La dégénérescence maculaire liée à l’âge (DMLA) est la principale cause de cécité irréversible au Canada, et touche approximativement 2 millions de CanadiensNote de bas de page 1. De nouveaux inhibiteurs du facteur de croissance de l’endothélium vasculaire (médicaments anti-VEGF) ont été mis en marché pour traiter la forme dite néovasculaire (exsudative) de la DMLA, ainsi qu’un certain nombre d’autres affections rétiniennes. Bien qu’ils aient amélioré les résultats thérapeutiques pour ces affections, les médicaments anti-VEGF sont très coûteux. En 2017, les ventes de ces médicaments représentaient 2,8 % du marché pharmaceutique canadien. La présente analyse offre un aperçu des ventes, de l'utilisation et des prix de cette classe de médicaments au Canada et à l'échelle internationale.
Les conclusions présentées serviront de point de départ à une étude plus approfondie sur les médicaments anti-VEGF qui sera publiée dans le cadre de la série de rapports sur la situation du marché du CEPMB. Cette série de rapports présente des renseignements détaillés sur des segments précis du marché thérapeutique qui sont importants pour la population canadienne afin de guider les discussions stratégiques et d’appuyer un processus décisionnel fondé sur les données probantes.
L’analyse porte sur le ranibizumab (Lucentis), dont la mise en marché a été approuvée au Canada en 2007, et sur l’aflibercept (Eylea), qui a été lancé en 2013. Les marchés internationaux examinés comprennent les sept pays pris en considération par le CEPMB lorsqu’il évalue les prix des médicaments brevetés (CEPMB7), soit la France, l’Allemagne, l’Italie, la Suède, la Suisse, le Royaume-Uni et les États-Unis; de même que d’autres pays membres de l’Organisation de coopération et de développement économiques (OCDE).
1. Médicaments anti-VEGF utilisés pour traiter les affections rétiniennes dont la vente a connu une croissance rapide au cours de la dernière décennie
En 2007, Lucentis est devenu le premier médicament anti-VEGF lancé au Canada à être approuvé pour traiter la DMLA exsudative ainsi que d’autres maladies rétiniennes importantes. Il a rapidement été reconnu comme le nouveau traitement de référence. En 2013, Eylea a également été approuvé pour traiter la DMLA et lancé à un prix légèrement inférieur; d’autres indications ont été ajoutées par la suite.
Les ventes combinées de ces deux médicaments ont atteint 692 M$ en 2017. Jusqu’à 2013, en l’absence de concurrence, Lucentis avait dominé le marché et connu une solide croissance; cependant, en 2017, Eylea l’avait surpassé au chapitre des ventes annuelles. En 2017, les ventes d’Eylea représentaient 56 % des ventes combinées de ces deux médicaments, ce qui correspond à une part légèrement supérieure du nombre d’unités réelles vendues (59 %) en raison de son coût moins élevé.
Tendances relatives aux ventes Canadiennes des médicaments Lucentis et Eylea, 2008-2017
Cliquer sur l'image pour l'agrandir
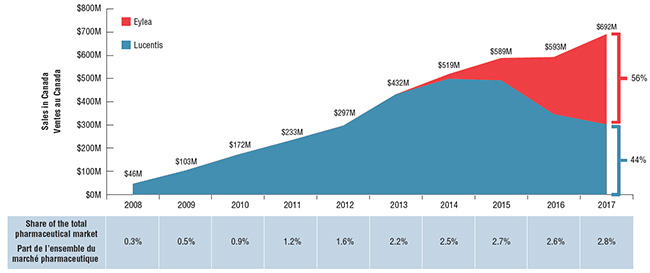
Description de la figure
Ce graphique à deux dimensions montre le total des ventes annuelles combinées des médicaments Lucentis et Eylea au Canada de 2008 à 2017. En 2017, le médicament Eylea représentait 56 % des ventes combinées, et Lucentis, 44 %. Les valeurs des ventes sont exprimées en millions de dollars. Le tableau ci-dessous montre les ventes combinées en tant que pourcentage de la part totale du marché pharmaceutique canadien.
blank
| Année |
Lucentis |
Eylea |
Total |
| 2008 |
46 $ |
0 $ |
46 $ |
| 2009 |
103 $ |
0 $ |
103 $ |
| 2010 |
172 $ |
0 $ |
172 $ |
| 2011 |
233 $ |
0 $ |
233 $ |
| 2012 |
297 $ |
0 $ |
297 $ |
| 2013 |
432 $ |
0 $ |
432 $ |
| 2014 |
499 $ |
20 $ |
519 $ |
| 2015 |
492 $ |
97 $ |
589 $ |
| 2016 |
346 $ |
247 $ |
593 $ |
| 2017 |
302 $ |
389 $ |
692 $ |
blank
| Année |
Part totale du marché pharmaceutique canadien |
| 2008 |
0,30 % |
| 2009 |
0,50 % |
| 2010 |
0,90 % |
| 2011 |
1,20 % |
| 2012 |
1,60 % |
| 2013 |
2,20 % |
| 2014 |
2,50 % |
| 2015 |
2,70 % |
| 2016 |
2,60 % |
| 2017 |
2,80 % |
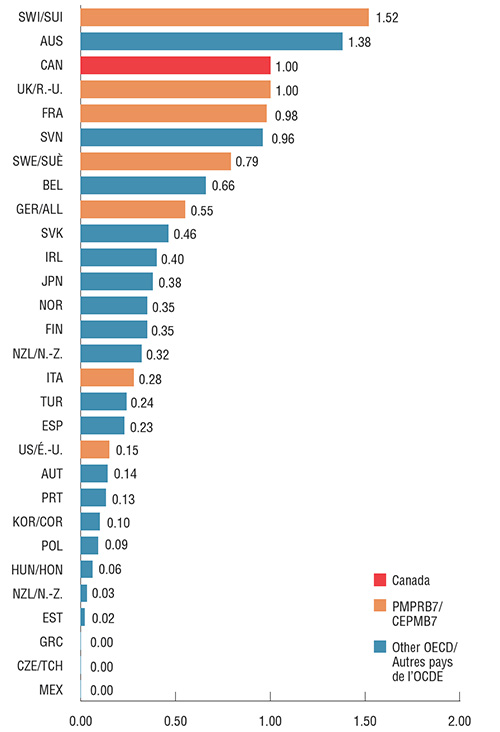
2. La part du marché pharmaceutique détenue par Lucentis et Eylea est plus importante au Canada que dans la plupart des autres pays de l’OCDE
Lucentis et Eylea représentaient 2,8 % des ventes totales de produits pharmaceutiques au Canada en 2017, ce qui correspond au septième rang parmi les pays de l’OCDE. Parmi les pays du CEPMB7, le Canada se classait au quatrième rang derrière le Royaume-Uni, la Suisse et la France. De façon générale, une part de marché comparative supérieure pourrait signifier un taux de consommation plus élevé, des prix plus élevés ou une combinaison de ces deux facteurs, bien qu’elle puisse également varier en fonction des ventes relatives dans l'ensemble du marché des produits pharmaceutiques.
Les ventes d’Eylea étaient plus élevées que celles de Lucentis dans 17 des 29 pays de l’OCDE pour lesquels des données étaient disponibles, ce qui est comparable à la répartition observée au Canada. Dans les 10 principaux pays où la part de marché combinée de ces produits était la plus élevée, Eylea représentait au moins 40 % des ventes. En particulier, Eylea occupait moins de 0,1 % de l’ensemble du marché des produits pharmaceutiques aux États-Unis, soit la part la plus faible de tous les pays du CEPMB7. La faible consommation aux États Unis pourrait être due, en partie, à l’utilisation hors indication d’Avastin pour les maladies rétiniennes.
Part de marché de Lucentis et d’Eylea par rapport aux ventes totales de produits pharmaceutiques, pays de l’OCDE, 2017
Cliquer sur l'image pour l'agrandir

Description de la figure
Ce diagramme en barres montre la part de marché combinée des ventes des médicaments Lucentis et Eylea en 2017 au Canada, dans les sept pays de comparaison du CEPMB et dans d’autres pays membres de l’Organisation de coopération et de développement économiques (OCDE). La composition du chiffre des ventes de Lucentis et d’Eylea est également présentée pour chaque pays.
blank
| Pays |
Lucentis |
Eylea |
Total |
| Royaume-Uni |
1,6 % |
3,5 % |
5,1 % |
| Suisse |
1,8 % |
2,5 % |
4,3 % |
| Australie |
1,6 % |
2,2 % |
3,8 % |
| Slovénie |
1,5 % |
2,2 % |
3,7 % |
| France |
1,8 % |
1,4 % |
3,2 % |
| Slovaquie |
1,6 % |
1,3 % |
2,8 % |
| Canada |
1,2 % |
1,6 % |
2,8 % |
| Allemagne |
1,3 % |
1,2 % |
2,5 % |
| Belgique |
1,3 % |
0,9 % |
2,3 % |
| Pays-Bas |
0,0 % |
2,1 % |
2,1 % |
| Espagne |
1,2 % |
0,6 % |
1,8 % |
| Irlande |
1,0 % |
0,7 % |
1,7 % |
| Finlande |
0,0 % |
1,2 % |
1,2 % |
| Portugal |
0,5 % |
0,5 % |
1,0 % |
| Italie |
0,5 % |
0,4 % |
0,9 % |
| Autriche |
0,0 % |
0,4 % |
0,5 % |
| États-Unis |
0,4 % |
0,0 % |
0,4 % |
| Turquie |
0,2 % |
0,2 % |
0,4 % |
| Nouvelle-Zélande |
0,3 % |
0,0 % |
0,3 % |
| Suède |
0,1 % |
0,1 % |
0,2 % |
| Estonie |
0,0 % |
0,2 % |
0,2 % |
| Pologne |
0,0 % |
0,1 % |
0,2 % |
| Norvège |
0,0 % |
0,1 % |
0,1 % |
| Grèce |
0,0 % |
0,0 % |
0,0 % |
| Japon |
0,0 % |
0,0 % |
0,0 % |
| Mexique |
0,0 % |
0,0 % |
0,0 % |
| Hongrie |
0,0 % |
0,0 % |
0,0 % |
| République tchèque |
0,0 % |
0,0 % |
0,0 % |
| Corée du Sud |
0,0 % |
0,0 % |
0,0 % |
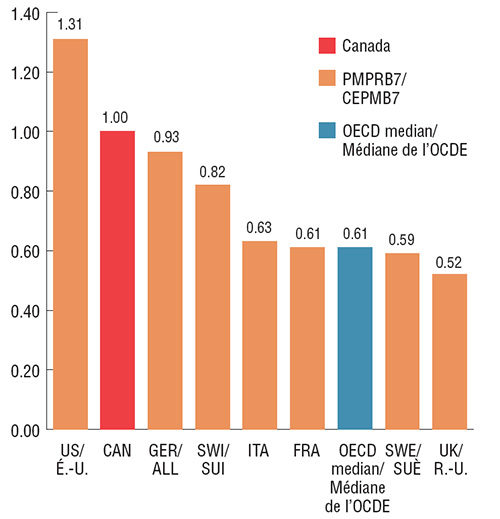
3. Le Canada affiche l’un des plus hauts taux de consommation de Lucentis et d’Eylea parmi les pays de l’OCDE
Le Canada se situe au troisième rang parmi les pays de l’OCDE en ce qui concerne le taux de consommation par habitant de Lucentis et d’Eylea. Les résultats sont présentés sous forme d’indices : le taux de consommation au Canada a été fixé à 1 et les taux des autres pays ont été établis en fonction de cette valeur.
Parmi les pays du CEPMB7, seule la Suisse présente un taux de consommation supérieur au Canada. À l’instar de la Suisse, de l’Australie, du Royaume-Uni et de la France, le Canada affiche à la fois un taux de consommation élevé et une part combinée élevée des ventes totales de produits pharmaceutiques, ce qui indique que la situation au Canada est semblable à celle des autres pays développés en ce qui concerne Lucentis et Eylea. La faible consommation aux États-Unis et sur d'autres marchés pourrait être due, en partie, à l’utilisation hors indication d’Avastin pour les maladies rétiniennes. En raison de limites de données, ce phénomène n'est pas examiné dans la présente analyse.
Taux de consommation* annuelle combinée de Lucentis et d’Eylea indexé en fonction du Canada, pays de l’OCDE, 2017
Cliquer sur l'image pour l'agrandir
*Fondé sur la dose d’entretien annuelle par patient établie par le Groupe consultatif sur les médicaments pour usage humain (GCMUH) au CEPMB. On a supposé l'utilisation d’une dose de 0,5 mg pour Lucentis et de 2 mg (0,05 ml) pour Eylea, peu importe le volume normalisé inscrit pour chaque pays dans la base de données MIDAS.
Description de la figure
Ce diagramme en barres compare le taux de consommation combinée de Lucentis et d’Eylea par million d’habitants en 2017 dans les sept pays de comparaison du CEPMB et dans d’autres pays membres de l’OCDE. Les résultats sont indexés à la consommation canadienne, établie à 1,00.
blank
| Pays |
Rapport de dose total annuel |
| Mexique |
0,00 |
| République tchèque |
0,00 |
| Grèce |
0,00 |
| Estonie |
0,02 |
| Nouvelle-Zélande |
0,03 |
| Hongrie |
0,06 |
| Pologne |
0,09 |
| Corée du Sud |
0,10 |
| Portugal |
0,13 |
| Autriche |
0,14 |
| États-Unis |
0,15 |
| Espagne |
0,23 |
| Turquie |
0,24 |
| Italie |
0,28 |
| Pays-Bas |
0,32 |
| Finlande |
0,35 |
| Norvège |
0,35 |
| Japon |
0,38 |
| Irlande |
0,40 |
| Slovaquie |
0,46 |
| Allemagne |
0,55 |
| Belgique |
0,66 |
| Suède |
0,79 |
| Slovénie |
0,96 |
| France |
0,98 |
| Royaume-Uni |
1,00 |
| Canada |
1,00 |
| Australie |
1,38 |
| Suisse |
1,52 |
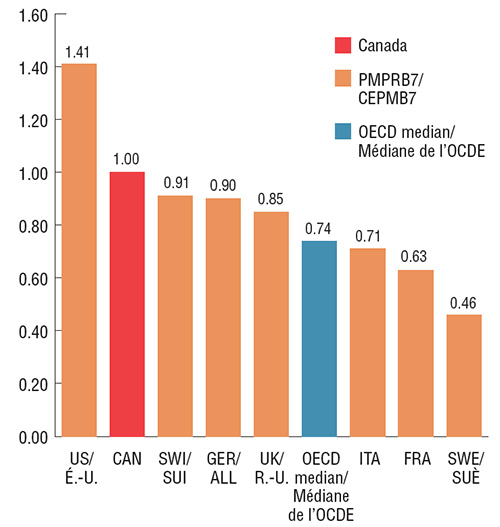
4. Les prix de Lucentis et d’Eylea au Canada comptent parmi les plus élevés des pays de l’OCDE
Au cours du dernier trimestre de 2017, les prix de Lucentis et d’Eylea au Canada se classaient au deuxième rang derrière les États-Unis parmi les pays de comparaison du CEPMB7, et étaient considérablement plus élevés que le prix médian dans les pays de l’OCDE. Le prix médian du CEPMB7 pour Lucentis, soit celui de l’Italie, était 37 % inférieur à celui du Canada; le prix médian du CEPMB7 pour Eylea, soit celui du Royaume-Uni, était 15 % inférieur à celui du Canada. Comme ces résultats l’indiquent, si les prix du Canada étaient plus proches des prix médians internationaux, les répercussions éventuelles sur les coûts seraient considérables.
Ratio des prix pratiqués à l’étranger par rapport au prix pratiqué au Canada pour Lucentis, T4 2017
Cliquer sur l'image pour l'agrandir
Description de la figure
4. Ces deux diagrammes à barres côte à côte présentent le ratio des prix pratiqués à l’étranger par rapport au prix pratiqué au Canada pour Lucentis et Eylea au quatrième trimestre de 2017. Les résultats sont fournis pour chacun des sept pays de comparaison du CEPMB ainsi que la valeur médiane pour les pays de l’OCDE.
Lucentis
Lucentis
| Pays |
Ratio des prix étrangers par rapport aux prix canadiens |
| Royaume-Uni |
0,52 |
| Suède |
0,59 |
| Médiane de l’OCDE |
0,61 |
| France |
0,61 |
| Italie |
0,63 |
| Suisse |
0,82 |
| Allemagne |
0,93 |
| Canada |
1,00 |
| États-Unis |
1,31 |
Ratio des prix pratiqués à l’étranger par rapport au prix pratiqué au Canada pour Eylea, T4 2017
Cliquer sur l'image pour l'agrandir
Description de la figure
Eylea
| Pays |
Ratio des prix étrangers par rapport aux prix canadiens |
| Suède |
0,46 |
| France |
0,63 |
| Italie |
0,71 |
| Médiane de l’OCDE |
0,74 |
| Royaume-Uni |
0,85 |
| Allemagne |
0,90 |
| Suisse |
0,91 |
| Canada |
1,00 |
| États-Unis |
1,41 |
5. Les prix plus élevés de Lucentis et d’Eylea se sont traduits par des coûts d’environ 168 millions de dollars pour les payeurs canadiens en 2017
Les différences de prix entre les marchés canadien et étrangers ont des répercussions considérables sur les coûts au Canada. Si les prix canadiens des médicaments anti-VEGF étaient harmonisés avec le prix médian du CEPMB7 au dernier trimestre (T4) de 2017, les ventes nationales canadiennes de Lucentis auraient été jusqu’à 110,4 millions de dollars (36,5 %) inférieures en 2017, tandis que les ventes d’Eylea auraient été inférieures de 57,9 millions de dollars (14,9 %). De manière semblable, les répercussions sur les coûts des régimes publics auraient été de 79,7 millions de dollars pour Lucentis et de 26,5 millions de dollars pour Eylea au cours de l’exercice 2016-2017.
Répercussions sur les coûts des prix plus Canadiens plus élevés de Lucentis et d’Eylea, d’après le prix médian du CEPMB7 au T4 de 2017
| |
Marché national canadien (tous les payeurs) 2017 |
Régimes publics d’assurance-médicaments canadiens, 2016-2017 |
| BC |
AB |
SK |
MB |
ON |
NB |
NS |
PE |
NL |
YK |
SSNA |
Total - régimes publics |
| Lucentis |
Coût total
du médicament |
302,3 M $ |
ND |
11,1 M $ |
2,2 M $ |
ND |
195,7 M $ |
4,1 M $ |
ND |
0,2 M $ |
2,4 M $ |
<0,1 M $ |
2,6 M $ |
218,3 M $ |
| Répercussions sur les coûts (part du coût total) |
110,4 M $
(0,45 %) |
ND |
4,1 M $
(0,55 %) |
0,8 M $
(0,24 %) |
ND |
71,5 M $
(1,55 %) |
1,5 M $
(0,79 %) |
ND |
0,1 M $
(0,21 %) |
0,9 M $
(0,75 %) |
<0,1 M $
(<0,01 %) |
1,0 M $
(0,21 %) |
79,7 M $
(0,99 %) |
| Eylea |
Coût total du médicament |
389,4 M $ |
NL |
ND |
3,1 M $ |
NL |
170,3 M $ |
3,1 M $ |
NL |
0,4 M $ |
0,3M |
<0,1 M $ |
0,6 M $ |
177,8 M $ |
| Répercussions sur les coûts (part du coût total) |
57,9 M $
(0,24 %) |
NL |
ND |
0,5 M $
(0,41 %) |
NL |
25,3 M $
(0,55 %) |
0,5 M $
(0,25 %) |
NL |
0,1 M $
(0,19 %) |
<0,1 M $
(0,04 %) |
<0,1 M $
(<0,01 %) |
0,1 M $
(0,02 %) |
26,5 M $
(0,33 %) |
ND: Le produit est remboursé, mais aucune donnée n'est disponible. Il est possible que le produit ait été remboursé dans le cadre d'un régime spécial de soins de la vue.
NL: Le produit n'est pas remboursé.
Remarque : Le bévacizumab (Avastin), qui a été lancé en 2005 et qui est utilisé à des fins non indiquées sur l’étiquette comme thérapie intravitréenne dans le traitement de
certaines affections rétiniennes, n’a pas été pris en compte dans la présente analyse. Santé Canada et d’autres organismes de réglementation internationaux, notamment
l’Agence européenne des médicaments (AEM) et la Food and Drug Administration (FDA) ont approuvé Avastin uniquement dans le traitement de certains types de cancers.
Bien que ce produit soit prescrit à des fins non indiquées sur l’étiquette pour traiter des affections rétiniennes, les données ne permettent pas de distinguer les indications et
c’est pourquoi elles n’ont pas été prises en compte dans l’étude. L’étendue de l’utilisation d’Avastin varie considérablement selon le territoire.
Limites : Les données sur les ventes canadiennes et internationales ainsi que les prix catalogue disponibles dans la base de données MIDASMC d’IQVIA sont des estimations des prix catalogue départ-usine du fabricant et ne tiennent pas compte des rabais et remises accordés sur une base confidentielle, d’ententes de gestion de
lancement, ou de programmes d’accès aux patients.
Sources : Les renseignements sur la disponibilité, l’utilisation et les prix présentés dans cette analyse reposent sur la base de données MIDASMC d’IQVIA (tous droits réservés); les coûts des régimes publics d’assurance-médicaments proviennent de la base de données du SNIUMP de l’Institut canadien d’information sur la santé.
Avis de non-responsabilité : Bien qu’ils soient fondés en partie sur des données autorisées provenant de la base de données de MIDASMC d’IQVIA, les déclarations, les conclusions, les opinions et les avis exprimés dans le présent rapport sont exclusivement ceux du CEPMB et ne peuvent être attribués à IQVIA.
Le SNIUMP est une initiative de recherche qui fonctionne indépendamment des activités de réglementation du CEPMB.