Le paysage des nouveaux médicaments : disponibilité et prix à l’échelle internationale
PDF - 375 kb
De nouveaux médicaments importants ont été lancés depuis 2009, générant près du quart des ventes de médicaments de marque au Canada en 2016. Il s’agissait notamment de nombreux nouveaux médicaments anticancéreux et d’un nombre croissant de médicaments orphelins à coût élevé. Dans l’ensemble, le nombre de médicaments dont la mise en marché a été approuvée était plus faible au Canada qu’aux États-Unis et en Europe, bien que le Canada se classe toujours bien au niveau international sur le plan des ventes.
La publication annuelle du CEPMB, Veille des médicaments mis en marché, examine la dynamique de mise en marché des nouveaux médicaments au Canada et sur d’autres marchés étrangers. L’édition la plus récente porte sur les nouvelles substances actives (NSA) qui ont été approuvées par la Food and Drug Administration américaine (FDA), l’Agence européenne des médicaments (EMA) ou Santé Canada (SC) en 2015 et 2016, et analyse leur adoption, leurs prix, les ventes et leur disponibilité au dernier trimestre de 2016 (T4-2016).
Le CEPMB tient compte de sept pays lorsqu’il examine les prix des médicaments brevetés sur le marché international (CEPMB7) : la France, l’Allemagne, l’Italie, la Suède, la Suisse, le Royaume-Uni (R.-U.) et les États-Unis (É.-U.); ainsi que d’autres pays de l’Organisation de coopération et de développement économiques (OCDE).
1. Les médicaments orphelins à coût élevé dominent de plus en plus le paysage des nouveaux médicaments
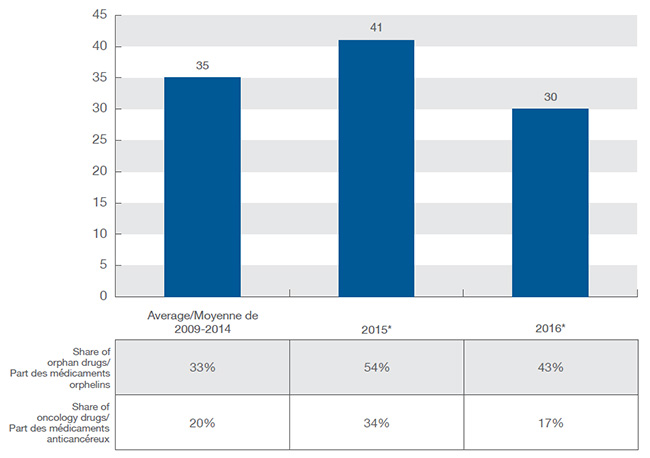
En 2015, 41 nouveaux médicaments ont reçu une approbation de mise en marché au Canada et dans le CEPMB7, dépassant la moyenne annuelle de 35 lancements de nouveaux médicaments de 2009 à 2014. L’année 2016 a été beaucoup moins active, avec 30 nouvelles substances actives approuvées. Une part croissante des nouveaux médicaments a reçu une désignation d’orphelin de la FDA ou de l’EMA, atteignant 54 % en 2015 et 43 % en 2016, ce qui représente une proportion beaucoup plus élevée que la moyenne de 33 % des années précédentes. Les traitements anticancéreux ont continué de représenter une grande proportion des nouveaux médicaments : 27 % de tous les nouveaux médicaments lancés sur le marché en 2015 et 2016.
Nouveaux médicaments lancés au Canada et dans le CEPMB7, de 2009 à 2016
Cliquer sur l'image pour l'agrandir
Description de la figure
Ce diagramme à colonnes et le tableau qui l’accompagne illustrent le nombre de nouveaux médicaments lancés au Canada et dans sept pays de comparaison de 2009 à 2016, de même que la part des médicaments orphelins et des médicaments anticancéreux.
De 2009 à 2014, 35 molécules ont été lancées en moyenne chaque année : parmi celles-ci, 33 % étaient des médicaments orphelins et 20 %, des médicaments anticancéreux.
En 2015, 41 nouvelles molécules ont été approuvées par la Food and Drug Administration des États-Unis, l’Agence européenne des médicaments ou Santé Canada : parmi celles-ci, 54 % étaient des médicaments orphelins et 34 %, des médicaments anticancéreux.
En 2016, 30 nouvelles molécules ont été approuvées par la Food and Drug Administration des États-Unis, l’Agence européenne des médicaments ou Santé Canada : parmi celles-ci, 43 % étaient des médicaments orphelins et 17 %, des médicaments anticancéreux.
2. Les médicaments lancés depuis 2009 représentaient environ le quart de toutes les ventes de médicaments de marque au T4-2016
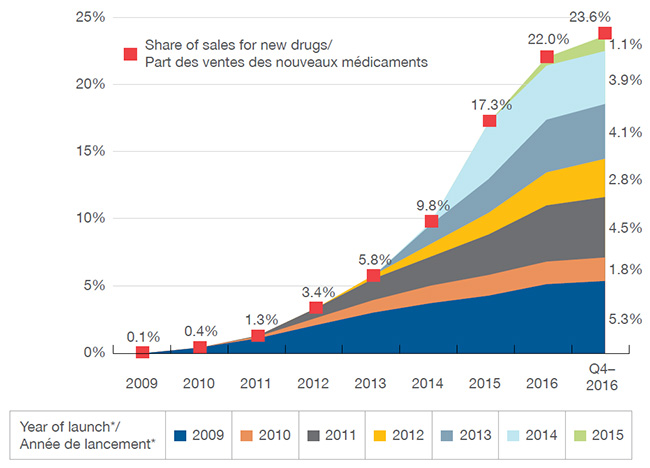
Les nouveaux médicaments ont connu une forte progression d’une année sur l’autre dans les ventes. Au T4-2016, les médicaments lancés sur les marchés du Canada et du CEPMB7 depuis 2009 représentaient 23,8 % du marché total des médicaments de marque au Canada. L’impact sur les ventes de produits pharmaceutiques variait selon le nombre et la pertinence thérapeutique des médicaments lancés chaque année. Par exemple, les médicaments lancés en 2014, qui comprenaient les nouveaux médicaments contre l’hépatite C, ont eu un effet plus important sur les ventes que les médicaments lancés les années précédentes. Dans l’ensemble, les ventes des médicaments lancés en 2015 étaient grandement concentrées : ensemble, les antinéoplasiques et les antiviraux comptaient pour plus de 60 % des ventes de nouveaux médicaments au Canada et dans le CEPMB7 au T4-2016.
Part cumulative des nouvelles substances actives dans les ventes de médicaments de marque, 2009-2015, canada
Cliquer sur l'image pour l'agrandir
*Année du premier lancement au Canada ou dans le CEPMB7.
Description de la figure
Ce graphique en aires illustre la part cumulative des nouvelles substances actives lancées de 2009 à 2015 par rapport à l’ensemble des ventes de médicaments de marque au Canada. Le tableau fournit en outre le pourcentage des ventes annuelles correspondantes jusqu’au quatrième trimestre de 2016. La part des ventes est donnée pour le Canada et les pays de comparaison du CEPMB.
blank
| Année d’introduction |
2009 |
2010 |
2011 |
2012 |
2013 |
2014 |
2015 |
2016 |
Quatrième trimestre de 2016 |
| 2009 |
0,05 % |
0,4 % |
1,1 % |
2,1 % |
3,0 % |
3,8 % |
4,4 % |
5,1 % |
5,3 % |
| 2010 |
|
0,0 % |
0,1 % |
0,5 % |
0,9 % |
1,3 % |
1,5 % |
1,7 % |
1,8 % |
| 2011 |
|
|
0,03 % |
0,7 % |
1,6 % |
2,2 % |
3,0 % |
4,2 % |
4,5 % |
| 2012 |
|
|
|
0,01 % |
0,2 % |
0,9 % |
1,6 % |
2,5 % |
2,8 % |
| 2013 |
|
|
|
|
0,02 % |
1,5 % |
2,5 % |
3,9 % |
4,1 % |
| 2014 |
|
|
|
|
|
0,1 % |
4,2 % |
4,0 % |
3,9 % |
| 2015 |
|
|
|
|
|
|
0,1 % |
0,6 % |
1,1 % |
| Total |
0,1 % |
0,4 % |
1,3 % |
3,4 % |
5,8 % |
9,8 % |
17,3 % |
22,0 % |
23,6 % |
3. Moins de médicaments sont lancés au Canada que dans les pays de comparaison du CEPMB
En 2015, Santé Canada a approuvé la mise en marché de 20 nouveaux médicaments, un nombre moins élevé que la FDA aux États-Unis (40) et l’EMA en Europe (31), les deux plus grands marchés.
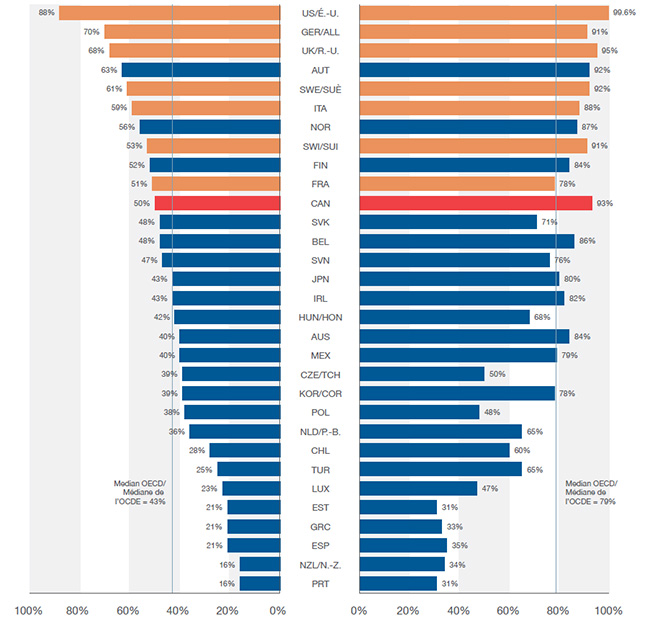
Les tendances à plus long terme montrent également qu’il y a eu moins de lancements au Canada que dans la plupart des pays de comparaison du CEPMB, dont beaucoup avaient des prix moyens des médicaments brevetés inférieurs. La moitié des nouveaux médicaments lancés de 2009 à 2015 étaient vendus au Canada au cours du T4-2016, ce qui place le Canada au onzième rang des pays de l’OCDE. Malgré cela, le Canada s’est classé au troisième rang pour ce qui est des ventes de ces médicaments par l’OCDE (93 %), ce qui indique que les médicaments les plus vendus ont été lancés.
Bien que cette comparaison reflète la position internationale relative du Canada en ce qui concerne les médicaments vendus, elle ne caractérise pas complètement la disponibilité des nouveaux médicaments. Comme d’autres pays, le Canada a approuvé au cours de cette période d’autres médicaments qui n’avaient pas encore enregistré de ventes dans MIDAS au T4-2016; si ces derniers avaient été inclus, la part des nouveaux médicaments lancés au Canada aurait augmenté pour atteindre 62 %.
Part des nouveaux médicaments lancés* de 2009 à 2015 et leur part respective des ventes de l’OCDE, T4-2016
Cliquer sur l'image pour l'agrandir
*Comprend tous les nouveaux médicaments lancés au Canada et dans le CEPMB7 au cours de cette période.
Description de la figure
Cette figure est un diagramme à barres en deux parties. Pour chaque pays de l’Organisation de coopération et de développement économiques, l’un des côtés du diagramme illustre la part des nouveaux médicaments lancés au Canada et dans les sept pays de comparaison du CEPMB de 2009 à 2015. L’autre côté montre la part respective des ventes au sein de l’Organisation de coopération et de développement économiques pour le quatrième trimestre de 2016.
blank
| Pays |
Part des médicaments lancés |
Part des ventes |
| États-Unis |
88 % |
99,6 % |
| Allemagne |
70 % |
91 % |
| Royaume-Uni |
68 % |
95 % |
| Autriche |
63 % |
92 % |
| Suède |
61 % |
92 % |
| Italie |
59 % |
88 % |
| Norvège |
56 % |
87 % |
| Suisse |
53 % |
91 % |
| Finlande |
52 % |
84 % |
| France |
51 % |
78 % |
| Canada |
50 % |
93 % |
| Slovaquie |
48 % |
71 % |
| Belgique |
48 % |
86 % |
| Slovénie |
47 % |
76 % |
| Japon |
43 % |
80 % |
| Irlande |
43 % |
82 % |
| Hongrie |
42 % |
68 % |
| Australie |
40 % |
84 % |
| Mexique |
40 % |
79 % |
| République tchèque |
39 % |
50 % |
| Corée du Sud |
39 % |
78 % |
| Pologne |
38 % |
48 % |
| Pays-Bas |
36 % |
65 % |
| Chili |
28 % |
60 % |
| Turquie |
25 % |
65 % |
| Luxembourg |
23 % |
47 % |
| Estonie |
21 % |
31 % |
| Grèce |
21 % |
33 % |
| Espagne |
21 % |
35 % |
| Nouvelle-Zélande |
16 % |
34 % |
| Portugal |
16 % |
31 % |
| Médiane |
43 % |
79 % |
4. De nombreux médicaments lancés en 2015 ont entraîné des coûts de traitement élevés, mais peu ont démontré un niveau d’amélioration thérapeutique plus que modéré
Plus de la moitié des 41 nouveaux médicaments approuvés au Canada et dans le CEPMB7 en 2015 avaient une désignation de médicaments orphelins et entraînaient pour la plupart des coûts de traitement très élevés. Bon nombre de ces médicaments orphelins étaient utilisés dans le traitement du cancer. Au total, les médicaments anticancéreux représentaient environ le tiers de tous les nouveaux médicaments en 2015, à un coût moyen de 12 000 $ par traitement de 28 jours.
Vingt des 41 nouveaux médicaments lancés en 2015 ont reçu une approbation de mise en marché au Canada, représentant 80 % du total des ventes de nouveaux médicaments au T4-2016. Conformément à la tendance observée au cours des années précédentes, seulement quelques-uns des nouveaux médicaments ont été évalués par le CEPMB comme des découvertes ou comme offrant un niveau important d’amélioration thérapeutique.
Cliquer sur l'image pour l'agrandir
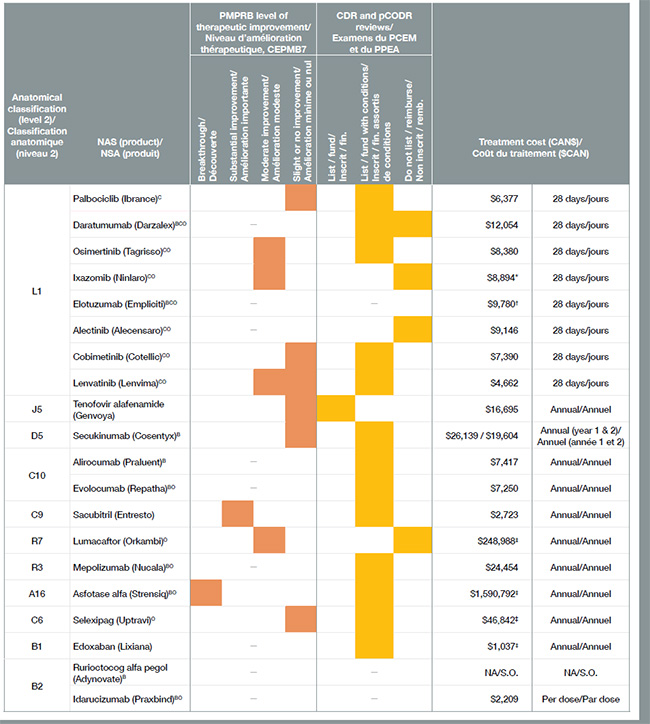
Remarque : Coûts de traitement fondés sur les prix courants au Canada, sauf indication : * PPEA; † prix international médian; ‡ ACMTS.
PCEM, Programme commun d’examen des médicaments; PPEA, programme pancanadien d’évaluation des anticancéreux.
Médicament biologique (B), anticancéreux (C) ou orphelin (O).
Description de la figure
Ce tableau contient de l’information sur les 20 nouveaux médicaments qui ont reçu une approbation de mise en marché au Canada en 2015.
blank
| Classification anatomique (niveau 2) |
Nouvelle substance active (produit) |
Niveau d’amélioration thérapeutique, CEPMB |
Programme commun d’évaluation des médicaments ou Examen pancanadien des médicaments oncologiques |
Coût du traitement ($CAN) |
| Découverte |
Amélioration importante |
Amélioration modeste |
Amélioration minime ou nulle |
Inscription ou financement |
Inscription ou financement assortis de conditions |
Non inscrit ou remboursé |
| L1 |
Palbociclib (Ibrance)C |
|
|
|
X |
|
X |
|
6 377 $ |
28 jours |
| L1 |
Daratumumab (Darzalex)BCO |
― |
|
X |
X |
12 054 $ |
28 jours |
| L1 |
Osimertinib (Tagrisso)CO |
|
|
X |
|
|
X |
|
8 380 $ |
28 jours |
| L1 |
Ixazomib (Ninlaro)CO |
|
|
X |
|
|
|
X |
8 894 $* |
28 jours |
| L1 |
Élotuzumab (Empliciti)BCO |
― |
― |
9 780 $† |
28 jours |
| L1 |
Alectinib (Alecensaro)CO |
―
|
|
|
X |
9 146 $ |
28 jours |
| L1 |
Cobimétinib (Cotellic)CO |
|
|
|
X |
|
X |
|
7 390 $ |
28 jours |
| L1 |
Lenvatinib (Lenvima)CO |
|
|
X |
X |
|
X |
|
4 662 $ |
28 jours |
| J5 |
Ténofovir alafénamide (Genvoya) |
|
|
|
X |
X |
|
|
16 695 $ |
Annuel |
| D5 |
Sécukinumab (Cosentyx)B |
|
|
|
X |
|
X |
|
26 139 $/19 604 $ |
Annuel (années 1 et 2) |
| C10 |
Alirocumab (Praluent)B |
― |
|
X |
|
7 417 $ |
Annuel |
| C10 |
Évolocumab (Repatha)BO |
― |
|
X |
|
7 250 $ |
Annuel |
| C9 |
Sacubitril (Entresto) |
|
X |
|
|
|
X |
|
2 723 $ |
Annuel |
| R7 |
Lumacaftor (Orkambi)O |
|
|
X |
|
|
|
X |
248 988 $‡ |
Annuel |
| R3 |
Mépolizumab (Nucala)BO |
―
|
|
X |
|
24 454 $ |
Annuel |
| A16 |
Asfotase alfa (Strensiq)BO |
X |
|
|
|
|
X |
|
1 590 792 $‡ |
Annuel |
| C6 |
Séléxipag (Uptravi)O |
|
|
|
X |
|
X |
|
46 842 $‡ |
Annuel |
| B1 |
Édoxaban (Lixiana) |
― |
|
X |
|
1 037 $‡ |
Annuel |
| B2 |
Rurioctocog alfa pégol (Adynovate)B |
― |
― |
N/D |
N/D |
| B2 |
Idarucizumab (Praxbind)BO |
― |
― |
2 209 $ |
Par dose |
Remarque : Coûts de traitement fondés sur les prix courants au Canada, sauf indication : * PPEA; † prix international médian; ‡ ACMTS.
PCEM, Programme commun d’examen des médicaments; PPEA, programme pancanadien d’évaluation des anticancéreux.
Médicament biologique (B), anticancéreux (C) ou orphelin (O).
Remarque : Le coût des médicaments ne tient pas compte des rabais découlant des ententes confidentielles d’inscription des produits.
Source : Données sur les ventes de la base de données MIDASMC de QuintilesIMS. Tous droits réservés.
Avis de non-responsabilité : Bien qu’ils soient en partie fondés sur des données obtenues sous licence à partir de la base de données MIDASMC de QuintilesIMS, les énoncés, les résultats, les conclusions, les points de vue et les opinions présentés dans ce rapport sont exclusivement ceux du CEPMB et ne sont pas imputables à QuintilesIMS.
Le SNIUMP est une initiative de recherche qui fonctionne indépendamment des activités de réglementation du CEPMB.