Concordance des listes de médicaments des régimes publics au Canada
Partie 1 : Aperçu général
Remerciements
Le présent rapport a été rédigé par le Conseil d’examen du prix des médicaments brevetés (CEPMB) dans le cadre du Système national d’information sur l’utilisation des médicaments prescrits (SNIUMP).
Le CEPMB tient à souligner la contribution des personnes suivantes :
- les membres du Comité consultatif du SNIUMP pour leur supervision et leurs orientations spécialisées lors de la rédaction du présent rapport;
- M. Steven Morgan, Université de la Colombie-Britannique, pour sa révision spécialisée de la méthodologie et du contenu analytique du présent rapport;
- les membres du personnel du SNIUMP qui ont contribué au contenu analytique de ce rapport :
- Nevzeta Bosnic – analyste économique principale
- Tanya Potashnik – directrice, Politiques et analyse économique
- Elena Lungu – gestionnaire, SNIUMP
- Karine Landry – analyste économique principale
- Yvonne Zhang – analyste économique
- Carol McKinley – conseillère en publications
Avertissement
Le SNIUMP est une initiative de recherche indépendante des activités réglementaires du Conseil du CEPMB. Les priorités de recherche, les données, les déclarations et les opinions présentées ou reproduites dans les rapports du SNIUMP ne reflètent pas la position du CEPMB au sujet des questions réglementaires. Les rapports du SNIUMP ne contiennent pas d’information confidentielle ou protégée en vertu des articles 87 et 88 de la Loi sur les brevets, et la mention d’un médicament dans un rapport du SNIUMP ne revient pas à reconnaître ou à nier que le médicament fait l’objet d’une demande de brevet en vertu des articles 80, 81 ou 82 de la Loi sur les brevets ou que son prix est ou n’est pas excessif au sens de l’article 85 de la Loi sur les brevets.
Bien qu’ils s’appuient en partie sur des données fournies par l’Institut canadien d’information sur la santé (ICIS) et des données obtenues aux termes de la licence de la base de données Payer Insights de QuintilesIMS, les déclarations, les résultats, les conclusions, les opinions et les avis exprimés dans ce rapport sont exclusivement ceux du CEPMB et ne peuvent être attribués à l’ICIS ou à QuintilesIMS.
Renseignements connexes
Conseil d’examen du prix des médicaments brevetés
Centre Standard Life
C. P. L40
333, avenue Laurier Ouest
Bureau 1400
Ottawa (Ontario) K1P 1C1
Tél. : 1-877-861-2350
ATS : 613-288-9654
Courriel : PMPRB.Information-Renseignements.CEPMB@pmprb-cepmb.gc.ca
Sommaire
Chacun des régimes d’assurance-médicaments financés par l’État au Canada offre une couverture à sa population admissible selon une conception, une liste de médicaments approuvés et des coûts des médicaments remboursés qui lui sont propres. Cette série en trois parties du CEPMB analyse les lacunes et les chevauchements entre les listes de médicaments des régimes publics provinciaux et fédéraux. L'information contenue dans ces rapports éclairera le dialogue sur la question de rendre les médicaments sur ordonnance essentiels plus abordables et accessibles, notamment en examinant la nécessité d'une liste de médicaments nationale.
Ce premier rapport de la série donne un aperçu du degré d’harmonisation entre les listes de médicaments. L’analyse se fonde sur les données de 2015 pour comparer ces listes, et décompose certains segments de marché, notamment les médicaments à une ou plusieurs sources, les médicaments onéreux et une liste particulière de médicaments essentiels. Les parties 2 et 3 de la série porteront plus particulièrement sur les nouveaux médicaments évalués dans le cadre du Programme commun d'évaluation des médicaments (PCEM) et les médicaments oncologiques évalués dans le cadre du Programme d'examen conjoint des médicaments oncologiques (PECMO), respectivement.
Les listes comprennent des milliers de médicaments ainsi que d’autres produits de santé connexes. Pour cette analyse, tous les produits de marque et les produits génériques contenant le même ingrédient actif ont été regroupés et considérés comme un seul médicament, quel que soit la force, la formulation ou le fabricant.
En décembre 2015, on comptait 1 456 médicaments, regroupés selon l’ingrédient actif, inscrits sur au moins une des listes de médicaments provinciales ou sur celle du Programme des soins de santé non assurés de Santé Canada. Parmi ceux-ci, 729 médicaments, représentant 82 % du coût total des médicaments en 2015Note de bas de page 1, ont été sélectionnés pour analyse. Afin d’assurer une meilleure uniformité des comparaisons entre les listes, les catégories de médicaments couvertes par des programmes spécialisés, les médicaments en vente libre et les médicaments pour lesquels aucune donnée d’utilisation n’était disponible en 2015 ont été exclus de l’échantillon analysé.
Un lien vers la liste complète des médicaments inclus dans l’analyse est donné à la page Études analytiques du site Web du CEPMB (voir le document Listes de médicaments au Canada dans les Séries de rapports).
Principales conclusions
Le degré d’harmonisation entre les listes de médicaments des régimes publics d’assurance-médicaments du Canada est raisonnablement élevé.
- La liste de chaque régime public incluait, en moyenne, 79 % des 729 médicaments sélectionnés en 2015.
- En tenant compte du coût relatif des médicaments, le taux moyen d’inscription à la liste des médicaments augmentait à 95 %, ce qui laisse croire que les médicaments non couverts par les régimes ne représentaient qu’une petite part des coûts.
- La comparaison de chaque paire de listes de médicaments a révélé un taux bilatéral moyen de concordance de 82 % pour l’ensemble des régimes, taux qui augmentait à 93 % lorsque les coûts des médicaments étaient pris en considération.
L’harmonisation entre les régimes publics est élevée pour les médicaments de source multiple, qui ont généralement une utilisation élevée et un coût inférieur.
- En moyenne, 86 % des 467 médicaments de source multiple sélectionnés pour l’analyse sont inscrits aux listes de médicaments des régimes publics, ce qui représente 97 % des coûts respectifs.
- Les taux d’inscription des médicaments de source multiple n’étaient que modérément variables, passant de 78 % à 92 % selon le régime.
- Les régimes publics d’assurance-médicaments couvraient généralement les médicaments de source multiple sans restriction, bien que pour environ un tiers de ces médicaments, la décision d’inscrire avec ou sans restriction n’ait pas été totalement unanime entre les régimes.
Les décisions d’inscription des régimes publics sont moins bien harmonisées en ce qui concerne les médicaments de source unique, et la variabilité est plus marquée pour les médicaments onéreux.
- Les régimes publics couvraient en moyenne 67 % des 262 médicaments de source unique sélectionnés pour l’analyse, ce qui représente 93 % des coûts respectifs.
- Les taux d’inscription pour les médicaments de source unique variaient considérablement selon les régimes, allant de 51 % à 80 %, et la plage était encore plus large pour les médicaments onéreux, soit de 37 % à 90 %.
- Les régimes publics d’assurance-médicaments imposaient généralement des restrictions sur les médicaments de source unique, en particulier ceux qui ont des coûts élevés, bien que pour 36 % de ces médicaments, la décision d’inscrire un médicament donné avec ou sans restriction n’a pas été totalement unanime entre les régimes.
Presque tous les médicaments essentiels figurant sur la liste du projet CLEAN MedsNote de bas de page 2 sont inscrits aux listes des régimes publics d’assurance-médicaments, et la majorité est couverte sans restriction.
- Les régimes publics couvraient en moyenne 92 % des 125 médicaments essentiels, ce qui représente 98 % des coûts respectifs.
- Les taux d’inscription des médicaments essentiels variaient entre 85 % et 97 % selon le régime.
- Étant donné que de nombreux médicaments essentiels sont des médicaments de source multiple, ils étaient généralement couverts sans restriction, bien que pour environ un quart des médicaments, la décision d’inscrire un médicament donné avec ou sans restriction n’ait pas été totalement unanime entre les régimes.
Les écarts dans la couverture des médicaments d’un régime public à l’autre peuvent s’expliquer par des différences au chapitre de la conception des régimes ainsi que des profils démographiques et pathologiques des populations de bénéficiaires admissibles.
Sources de données :
Les principales sources de données pour ce rapport ont été la base de données du Système national d’information sur l’utilisation des médicaments prescrits (SNIUMP) de l’Institut canadien d’information sur la santé (ICIS) et la Liste des médicaments publiée par la Régie de l’assurance maladie du Québec (RAMQ).
Définitions
Conception du régime d’assurance-médicaments : ensemble unique de programmes, de critères d’admissibilité et de structures de partage des coûts de chaque régime public d’assurance-médicaments. Pour obtenir un aperçu des régimes publics d’assurance-médicaments du SNIUMP, consultez le document de référence Conception des régimes publics d’assurance-médicaments à la page Études analytiques du SNIUMP sur le site Web du CEPMB.
Couverture restreinte : médicament bénéficiant d’une couverture restreinte répondant à des critères spécifiques, par exemple une indication précise. Dans la présente analyse, un médicament est considéré comme étant à couverture restreinte si toutes les versions disponibles (force, formulation, fabricant) figurant sur une liste de médicaments bénéficient d’une couverture restreinte.
Couverture sans restriction : médicament dont la couverture n’est pas soumise à des critères de restriction. Dans la présente analyse, un médicament est considéré comme couvert sans restriction si au moins une des versions (force, formulation ou fabricant) figurant sur une liste est classée comme sans restriction.
Liste de médicaments : liste de médicaments couverts pour les bénéficiaires admissibles; chaque régime d’assurance-médicaments détermine sa propre liste de médicaments approuvés.
Médicament : comprend toutes les forces et formulations d’une substance active donnée. Dans ce rapport, les médicaments sont définis au niveau ATC 5 tel que rapporté par l'ICIS et englobent tous les produits de marque et les produits génériques contenant le même ingrédient actif.
Médicament de source multiple : médicament fabriqué par au moins deux entreprises; cela comprend le médicament de marque original ou son équivalent générique.
Médicament de source unique : médicament fabriqué par une seule entreprise. Dans le présent rapport, il s’agit des médicaments de marque pour lesquels aucune version générique n’existe.
Médicaments essentiels : définis par l’Organisation mondiale de la santé (OMS) comme des « médicaments qui répondent aux besoins de santé prioritaires d’une population ». La présente analyse a pris en considération les 125 médicaments figurant sur la liste des médicaments essentiels pour les soins primaires au Canada identifiés par le projet CLEAN MedsNote de bas de page 3 en 2016.
Médicament onéreux : médicament dont le coût annuel moyen par patient dépasse 10 000 $.
Programmes spécialisés : les régimes publics d’assurance-médicaments ont parfois des programmes distincts pour des groupes de patients bien définis tels que ceux ayant le cancer, le VIH, une maladie rare, etc. Les médicaments utilisés pour traiter ces conditions peuvent ou non être inscrits à la liste du régime d’assurance-médicaments, selon l’administration.
Régimes publics d’assurance-médicaments du SNIUMP : régimes publics d’assurance-médicaments participant à l’initiative du Système national d’information sur l’utilisation des médicaments prescrits (SNIUMP). Cela comprend tous les régimes provinciaux (à l’exception du Québec) ainsi que le Programme d’assurance-médicaments pour soins de santé non assurés de Santé Canada.
Taux d’inscription pondéré : calculé comme la somme des taux d’inscription pour chaque médicament multipliée par la part correspondante du coût total du médicament pour les régimes publics d’assurance-médicaments du SNIUMP.
Taux d’inscription : pourcentage de médicaments sélectionnés figurant sur une liste par rapport au nombre total de médicaments sélectionnés pour l’analyse (729).
Taux de concordance : pourcentage de concordance entre deux listes de médicaments sur le plan de l’inscription de certains médicaments; les régimes ont été considérés comme concordants s’ils ont pris la même décision pour un médicament donné, soit l’inscrire ou ne pas l’inscrire.
Introduction
En 2014, les Canadiens ont consacré 29,4 milliards de dollars aux médicaments sur ordonnance : de cette somme, 12,5 milliards, soit 42,6 %, ont été financés par le secteur public, tandis que 16,9 milliards, ou 57,4 %, ont été payés par le secteur privé par l’entremise d’assureurs ou de particuliers (Institut canadien d'information sur la santé, 2016).
Au Canada, les régimes publics couvrent les médicaments sur ordonnance d’environ 29 % de la population (Coalition canadienne de la Santé, 2016), notamment les personnes âgées, les personnes à faible revenu ou les personnes dont les frais de médicaments sont élevés par rapport à leur revenu. Les dix provinces et les trois territoires offrent tous une couverture à leurs résidents admissibles. De plus, des régimes fédéraux assurent la couverture des anciens combattants, des membres de Premières Nations et des Inuits, des membres de la Gendarmerie royale du Canada ainsi que des militaires.
Au Canada, le coût des médicaments sur ordonnance est couvert par une combinaison de régimes d’assurance-médicaments publics et privés, de même que par les particuliers. Bien qu’il existe des similitudes entre les différents régimes financés par l’État, chacun est unique et possède une conception, une liste de médicaments approuvés et des coûts remboursés qui lui sont propres. L’Alliance pancanadienne pharmaceutique travaille depuis 2010 à négocier le coût des médicaments de marque et des produits génériques pour tous les programmes d’assurance-médicaments financés par l’État. Cela a permis d’obtenir une meilleure harmonisation entre les administrations en ce qui a trait au prix remboursé des médicaments. Cependant, il existe encore des différences entre les conceptions et les listes de médicaments des régimes.
Étant donné les différences de couverture entre les régimes d’assurance-médicaments et l’augmentation des coûts des nouveaux médicaments, la demande pour un programme national d’assurance-médicaments au Canada a augmenté. Le Conseil d’examen du prix des médicaments brevetés, par l’entremise du Système national d’information sur l’utilisation des médicaments prescrits (SNIUMP), a donc élaboré une série de rapports en trois volets qui explore les lacunes et les chevauchements actuels entre les listes de médicaments des régimes publics canadiens d’assurance-médicaments. Ces documents serviront de fondement aux discussions.
Ce premier rapport de la série donne un aperçu du degré d’harmonisation entre les listes de médicaments. Il se fonde sur les données de 2015 pour comparer ces listes, et décompose certains segments de marché, notamment les médicaments à une ou plusieurs sources, les médicaments onéreux et une liste particulière de médicaments essentiels. Les parties 2 et 3 de la série porteront sur les nouveaux médicaments évalués dans le cadre du Programme commun d'évaluation des médicaments (PCEM) et les médicaments oncologiques évalués dans le cadre du Programme d'examen conjoint des médicaments oncologiques (PECMO), respectivement.
Méthodologie
Les listes de médicaments comprennent des milliers de médicaments ainsi que d’autres produits de santé connexes identifiés par leur principe actif, leur fabricant, leur nom de produit, leur force, leur forme et leur voie d’administration. Les médicaments analysés dans cette étude ont été regroupés en fonction de l’ingrédient actif au niveau ATC 5 tel que rapporté par l'ICIS.
Des 1 456 médicaments inscrits aux listes des régimes publics canadiens en 2015, 729 ont été sélectionnés pour l’analyse, dont 262 produits de marque de source unique et 467 produits de sources multiples. Les médicaments sélectionnés étaient inscrits sur au moins une des onze listes des régimes publics canadiens d’assurance-médicaments pour lesquels des données étaient disponibles au 31 décembre 2015 : Colombie-Britannique, Alberta, Saskatchewan, Manitoba, Ontario, Québec, Nouveau-Brunswick, Nouvelle-Écosse, Île-du-Prince-Édouard, Terre-Neuve-et-Labrador et Programme des soins de santé non assurés de Santé Canada (SSNA). La liste complète des médicaments inclus dans l’analyse est disponible sur la page Études analytiques du site Web du CEPMB (voir le document Listes de médicaments au Canada dans les Séries de rapports).
Les médicaments pour lesquels les données disponibles étaient limitées, par exemple ceux qui sont couverts par des programmes spécialisés, ont été exclus de l’analyse afin d’assurer une comparaison uniforme entre les administrations. Il s’agissait notamment de médicaments utilisés pour traiter la dégénérescence maculaire liée à l’âge, de médicaments contre le cancer, d’agents diagnostiques, de médicaments contre le VIH, d’époétines et de certains médicaments pour soigner des maladies rares. Les médicaments en vente libre et les médicaments pour lesquels aucune donnée d’utilisation n’était disponible ou les données étaient limitées ont également été exclus. Certains de ces médicaments seront traités dans les parties 2 et 3 de la série, qui porteront sur les nouveaux médicaments évalués dans le cadre du PCEM et les médicaments oncologiques évalués dans le cadre du PECMO, respectivement. Vous trouverez d’autres renseignements sur les médicaments exclus à l’annexe A.
Les principales sources de données pour les listes de médicamentsNote de bas de page 4 sont la base de données du Système national d’information sur l’utilisation des médicaments prescrits (SNIUMP), élaborée par l’Institut canadien d’information sur la santé (ICIS), et la Liste des médicaments publiée par la Régie de l’assurance maladie du Québec (RAMQ). L’information sur les coûts des médicaments pour chaque régime est extraite de la base de données du SNIUMP 2015 de l’ICIS, qui regroupe les données de tous les régimes publics sauf celui du Québec. Les résultats rapportés à l’annexe C sont basés sur les données sur les ventes nationales tirées de la base de données QuintilesIMS Payer Insights pour 2015 et comprennent toutes les ventes dans les segments de marché public et privé ainsi que les coûts payés par les particuliers.
Prix des médicaments couverts par les régimes publics d’assurance-médicaments du SNIUMP
Les régimes publics canadiens d’assurance-médicaments participant à l’initiative du SNIUMP comprennent tous les régimes provinciaux (à l’exception du Québec) et les SSNA. Les 729 médicaments sélectionnés pour cette analyse représentent des coûts de 6,6 milliards de dollars, soit 82 % du total des coûts des médicaments du SNIUMP pour l’année 2015 (8 milliards de dollars).
blank
| |
BC |
AB |
SK |
MB |
ON |
NB |
NS |
PE |
NL |
SSNA |
Total |
| Coût total des médicaments |
1,37 G$ |
0,73 G$ |
0,41 G$ |
0,48 G$ |
4,19 G$ |
0,16 G$ |
0,16 G$ |
0,03 $ |
0,11 G$ |
0,39 G$ |
8 G$ |
| Coût des médicaments sélectionnés (pourcentage du coût total) |
1,24 G$
(90 %) |
0,64 G$
(88 %) |
0,36 G$
(89 %) |
0,4 G$
(84 %) |
3,24 G$
(77 %) |
0,14 G$
(85 %) |
0,14 G$
(85 %) |
0,02 G$
(85 %) |
0,09 G$
(79 %) |
0,3 G$
(76 %) |
6,56 G$
(82 %) |
Sources des données : Système national d’information sur l’utilisation des médicaments prescrits, Institut canadien d’information sur la santé.
Les segments de marché donnés analysés dans ce rapport comprennent les médicaments de source unique ou multiple, les médicaments onéreux et les médicaments essentiels :
- Les médicaments de source unique désignent les médicaments de marque produits par un fabricant pour lesquels aucune version générique n’est disponible sur le marché.
- Les médicaments onéreux sont un sous-ensemble important de médicaments de source unique et sont définis comme des produits dont le coût annuel moyen par bénéficiaire actif dépasse 10 000 $. Au total, 80 médicaments onéreux remboursés par les régimes publics d’assurance-médicaments du SNIUMP ont été identifiés en 2015. De ceux-ci, 41 répondaient aux critères de sélection précédemment décrits et ont été inclus dans l’analyse. Les autres médicaments ont été exclus de cette analyse parce qu’ils étaient couverts par des programmes spécialisés, notamment les traitements contre le cancer de la bouche, qui seront analysés dans la partie 3 de la série.
- Les médicaments de source multiple sont produits par au moins deux fabricants et comprennent le médicament de marque original ou son ou ses équivalents génériques.
- La liste des médicaments essentielsNote de bas de page 5 publiée dans ce rapport comporte 125 médicaments de source unique ou multiple figurant sur la liste de médicaments essentiels pour les soins de santé primaires au Canada du projet CLEAN MedsNote de bas de page 6. Les médicaments utilisés pour cette étude sont énumérés à l’annexe D, accompagnés des dépenses correspondantes des régimes publics et des ventes nationales.
Les taux d’inscription aux listes sont la principale mesure rapportée dans cette étude. Ces taux sont déclarés pour chacun des régimes d’assurance-médicaments analysés sur le plan du nombre de médicaments et du coût correspondant.
- Les taux d’inscription des médicaments ont été calculés en divisant le nombre de médicaments inscrits à la liste par le nombre total de médicaments sélectionnés pour l’analyse (729).
- Les taux d’inscription sur le plan du coût des médicaments ont été calculés en fonction de la part relative de chaque médicament dans le coût total du régime public d’assurance-médicaments du SNIUMP pour les 729 médicaments sélectionnés en 2015. La pondération a été basée sur le total de tous les régimes publics d’assurance-médicaments analysés afin de réduire tout biais résultant de la pondération individuelle par administration.
- Les résultats pour les 20 principales catégories thérapeutiques définies au niveau ATC 2 ont également été mesurés.
Dans ce rapport, le statut de couverture (avec ou sans restriction) figurant sur les listes est également analysé en fonction des renseignements disponibles dans la base de données du SNIUMP. Un médicament a été considéré comme ayant un statut de couverture sans restriction dans un régime donné si au moins une version y était classée comme étant sans restriction. Si toutes les versions disponibles dans un régime étaient à couverture restreinte, il était considéré comme ayant le statut de couverture restreinte. La terminologie varie selon les administrations : on parle de « Special Authority » en Colombie-Britannique; de « Restricted Benefit » et « Special Authorization » en Alberta; des parties 2 ou 3 au Manitoba; d’« Exception Drug Status » en Saskatchewan; du programme « Usage limité » ou « Accès exceptionnel » en Ontario; de « Médicament d’exception » au Québec; d’« Autorisation spéciale » au Nouveau-Brunswick; d’« Exceptional Status » en Nouvelle-Écosse; de « Special Authorization » à l’Île-du-Prince-Édouard; de « Special Authorization » à Terre-Neuve-et-Labrador; et d’« Usage limité » dans les SSNA. En outre, la couverture d’un médicament peut comporter d’autres critères cliniques propres à chaque régime.
Les taux de concordance mesurant le degré d’harmonisation pour les décisions d’inscription entre chaque paire de régimes publics d’assurance-médicaments sont également indiqués pour les 729 médicaments sélectionnés. Au total, on a comparé 55 combinaisons interadministrations sur la base du nombre de médicaments et des coûts de médicaments correspondants. Les régimes étaient considérés comme concordants si la même décision d’inscription avait été prise : soit inscrire un médicament à la liste (oui-oui), soit ne pas l’inscrire (non-non). Des moyennes et des fourchettes simples sont mentionnées pour les paires de régimes.
Limites
Le but du présent rapport est d’évaluer les chevauchements et les écarts généraux entre les listes de médicaments couverts par les régimes publics d’assurance-médicaments au Canada; il ne s’agit pas d’évaluer dans quelle mesure les médicaments approuvés au Canada sont ou ne sont pas inscrits dans les listes de médicaments de ces régimes.
Bien que les médicaments analysés dans ce rapport incluent une grande partie de ceux qui sont remboursés par les régimes publics et leurs coûts connexes, ils ne donnent pas une image complète du remboursement par ces régimes. Certains médicaments peuvent être couverts dans la liste générale de certaines provinces, tandis que dans d’autres, ils sont couverts par des programmes spécialisés qui ne sont généralement pas inclus dans la base de données du SNIUMPNote de bas de page 7. En conséquence, d’importantes catégories thérapeutiques de médicaments, comme ceux utilisés pour traiter la dégénérescence maculaire liée à l’âge, les produits d’oncologieNote de bas de page 8, les médicaments anti-VIH et certains médicaments pour les maladies rares, ont été exclues de l’analyse. Elles seront couvertes dans les parties 2 et 3 de la série.
Le présent rapport fournit un aperçu des médicaments couverts pour l’année civile 2015 et n’inclut pas ceux qui ont pu être inscrits ultérieurement aux listes.
Une analyse simple du nombre de médicaments inscrits pose certaines limites lors de la comparaison des listes. En effet, ce nombre peut dépendre des besoins thérapeutiques de la population admissible ainsi que des décisions relatives à l’inscription; on peut, par exemple, choisir les médicaments les plus rentables dans les catégories thérapeutiques où l’on trouve plusieurs possibilités de traitement.
Les écarts dans la couverture des médicaments d’un régime public à l’autre peuvent s’expliquer par des différences au chapitre de la conception des régimes ainsi que des profils démographiques et pathologiques des populations de bénéficiaires admissibles. Ainsi, les régimes publics d’assurance-médicaments de la Colombie-Britannique, de la Saskatchewan et du Manitoba, qui fournissent une couverture universelle fondée sur le revenu, peuvent inscrire des médicaments répondant aux besoins thérapeutiques d’une population plus générale alors que d’autres régimes publics provinciaux d’assurance-médicaments peuvent offrir une liste adaptée aux populations visées par leurs programmes précis. Le Programme des SSNA offre une couverture universelle des médicaments aux membres des Premières nations et aux Inuits, qui possèdent un profil démographique et pathologique distinct.
Il existe également des variations entre les administrations concernant la définition des médicaments à couverture avec et sans restriction. Bien que la plupart des régimes définissent le statut sans restriction de la même manière, il existe diverses définitions d’une couverture restreinte ainsi que des différences dans les critères cliniques servant à déterminer si un médicament est couvert (voir l’annexe B).
Les taux pondérés d’inscription aux listes de médicaments sont basés sur les coûts globaux des médicaments dans les régimes publics d’assurance-médicaments du SNIUMP qui ont été analysés. Ces taux peuvent dépendre du coût des médicaments disponibles dans la majorité des régimes ou de leur coût dans les régimes les plus gros. Ainsi, les médicaments qui ne sont généralement pas remboursés, ou qui sont remboursés par des petits régimes, peuvent avoir des coûts connexes bas et, par conséquent, un poids inférieur dans les résultats globaux. En outre, les données sur le régime public d’assurance-médicaments du Québec ne sont pas versées dans la base de données du SNIUMP et, par conséquent, l’importance des coûts au Québec n’est pas reflétée dans les résultats pondérés.
Les données sur les ventes nationales (payeurs publics, privés et particuliers qui paient eux-mêmes) ont également été utilisées à des fins de pondération afin de déterminer dans quelle mesure ces limites ont une incidence sur les résultats (voir l’annexe C). Bien que les taux d’inscription aient légèrement diminué lorsque les pondérations des ventes nationales ont été appliquées, les résultats sont comparables et ne modifient pas les résultats généraux de l’étude.
La part des coûts correspondant à l’écart entre les listes de médicaments des régimes ne doit pas être interprétée comme le coût qu’aurait l’harmonisation des listes. Si tous les régimes inscrivaient un médicament qui n’est actuellement couvert que par quelques-unes des administrations, (i) la pondération des coûts changerait, puisque de nouveaux coûts seraient associés à ce médicament; (ii) le coût ne serait pas nécessairement un ajout complet, mais représenterait parfois le passage d’un médicament à un autre, car certains régimes couvrent peut-être d’autres traitements pour une même maladie. Ces éléments n’ont pas été évalués dans l’analyse.
1. Vue d’ensemble des listes de médicaments inscrits des régimes publics canadiens d’assurance-médicaments
Il existe un degré d’harmonisation raisonnablement élevé entre les listes de médicaments de chaque régime public d’assurance-médicaments au Canada, lesquels couvrent une grande partie de tous les médicaments couverts par les régimes publics. Lorsque les coûts connexes des médicaments sont pris en compte, le taux d’inscription aux listes est encore plus élevé, ce qui laisse croire que les médicaments non couverts par les régimes ne représentent qu’une petite part des coûts. Une comparaison directe des décisions d’inscription entre les régimes par paire vient renforcer ce résultat : elle montre que, s’il existe des variations, les régimes s’entendent généralement.
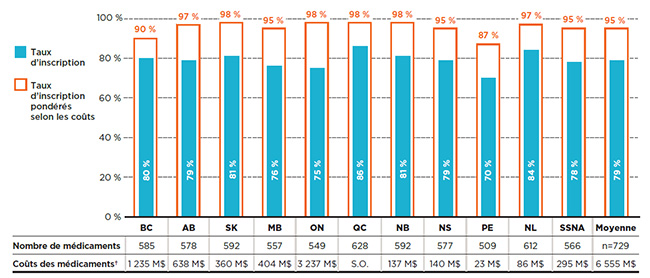
La plupart des 729 médicaments sélectionnés pour cette analyseNote de bas de page 9 étaient inscrits aux listes de médicaments couverts par chaque régime d’assurance-médicaments public en 2015. Les taux d’inscription étaient relativement élevés, allant de 70 % à l’Île-du-Prince-Édouard à 86 % au Québec, avec une moyenne de 79 % pour l’ensemble des régimes analysés.
Lorsque les médicaments ont été pondérés selon le coût, le taux d’inscription s’est avéré encore plus élevé et uniforme à la grandeur des administrations, allant de 87 % à l’Île-du-Prince-Édouard à 98 % dans plusieurs régimes publics, pour une moyenne de 95 %. Étant donné la forte concentration des coûts généralement observée sur le marché pharmaceutique, un petit nombre de médicaments représentent une part importante des coûts. Cela explique l’augmentation de la concordance des décisions d’inscription lorsque les coûts des médicaments sont pris en compte.
La figure 1.1 montre les taux d’inscription aux listes par régime public d’assurance-médicaments en fonction du nombre de médicaments ainsi que du pourcentage de coûts correspondant dans les régimes publics d’assurance-médicaments du SNIUMP en 2015. Ainsi, en 2015, la Colombie-Britannique couvrait 585 ou 80 % des 729 médicaments, ce qui représente 1 235 millions de dollars en coûts de médicaments. Lorsque ces 585 médicaments ont été pondérés en fonction de leurs coûts dans tous les régimes publics analysés (à l’exception du Québec), le taux d’inscription de la Colombie-Britannique a augmenté à 90 %.
Figure 1.1 Taux d’inscription aux listes des régimes publics d’assurance-médicaments, médicaments sélectionnés*, 2015
Cliquer sur l'image pour l'agrandir
Description de la figure
Ce graphique à barres présente les taux d’inscription et les taux d’inscription pondérés selon les coûts pour chaque régime public analysé. Le tableau qui l’accompagne donne le nombre absolu de médicaments sélectionnés inscrits sur chaque liste ainsi que les coûts des médicaments pour les médicaments inscrits.
Au total, les 729 médicaments sélectionnés pour l’étude représentaient 6 555 millions de dollars en coûts de médicaments pour les régimes publics d’assurance-médicaments du SNIUMP en 2015.
blank
| Régime public d’assurance-médicaments |
Taux d’inscription |
Taux d’inscription pondérés selon les coûts |
Nombre de médicaments |
Coûts des médicaments |
| Régime public d’assurance-médicaments |
Taux d’inscription |
Taux d’inscription pondérés selon les coûts |
Nombre de médicaments |
Coûts des médicaments |
| Colombie-Britannique |
80 % |
90 % |
585 |
1 235 millions $ |
| Alberta |
79 % |
97 % |
578 |
638 millions $ |
| Saskatchewan |
81 % |
98 % |
592 |
360 millions $ |
| Manitoba |
76 % |
95 % |
557 |
404 millions $ |
| Ontario |
75 % |
98 % |
549 |
3 237 millions $ |
| Québec |
86 % |
98 % |
628 |
Non disponible |
| Nouveau-Brunswick |
81 % |
98 % |
592 |
137 millions $ |
| Nouvelle-Écosse |
79 % |
95 % |
577 |
140 millions $ |
| Île-du-Prince-Édouard |
70 % |
87 % |
509 |
23 millions $ |
| Terre-Neuve-et-Labrador |
84 % |
97 % |
612 |
86 millions $ |
| Services de santé non assurés |
78 % |
95 % |
566 |
295 millions $ |
| Moyenne |
79 % |
95 % |
Sans objet |
Sans objet |
Remarque : Basé sur le nombre total de médicaments (729) sélectionnés pour l’étude.
* Médicaments inscrits à au moins une liste de médicaments d’un régime public, sous réserve des critères d’exclusion.
† Les coûts des médicaments sont les montants acceptés aux fins de remboursement par les régimes publics d’assurance-médicaments pour les médicaments analysés.
Sources des données : Système national d’information sur l’utilisation des médicaments prescrits, Institut canadien d’information sur la santé; Liste des médicaments, Régie de l’assurance maladie du Québec, 20 novembre 2015.
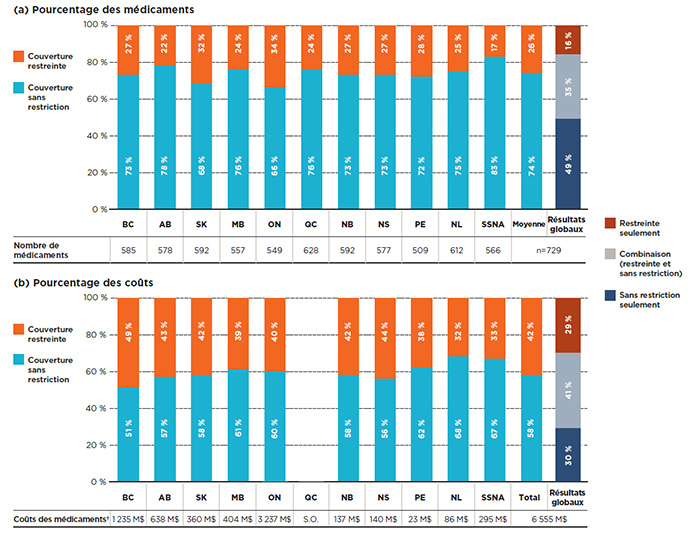
Chacun des régimes a été évalué pour déterminer le pourcentage de médicaments sélectionnés inscrits aux listes ayant été classés comme couverts avec ou sans restriction. Les résultats suggèrent qu’un pourcentage relativement élevé des médicaments sélectionnés étaient couverts sans restrictions, soit 74 % en moyenne pour tous les régimes. Cependant, le résultat global masque des variations importantes en fonction du segment de marché analysé; cette question sera abordée en détail dans les sections suivantes.
La figure 1.2 montre la répartition selon le statut d’admissibilité pour ce qui a trait (a) aux médicaments inscrits et (b) à leurs coûts respectifs pour chacun des régimes publics. Au total, 83 % des médicaments sont couverts sans restriction par le Programme des SSNA, proportion considérablement plus élevée que celle des autres régimes publics d’assurance-médicaments. L’Ontario et la Saskatchewan affichaient le taux de couverture sans restriction le plus bas, soit environ les deux tiers des médicaments. Tous les autres régimes se situaient entre 72 % et 78 %.
Bien qu’en moyenne, seulement 26 % des médicaments ont une couverture restreinte, ceux-ci représentaient plus de 40 % des coûts de médicaments correspondants dans les régimes publics d’assurance-médicaments. Cela indique que la couverture restreinte est généralement appliquée aux médicaments ayant des coûts élevés, conclusion étayée par les résultats présentés à la section 3.
Les résultats montrent que sur les 729 médicaments sélectionnés, 49 % étaient couverts sans restriction dans toutes les listes où ils étaient inscrits, pour une proportion de 30 % des coûts globaux des régimes publics du SNIUMP; 16 % étaient inscrits avec restrictions dans tous les régimes, pour 29 % des coûts; et 35 % faisaient l’objet d’une couverture avec ou sans restriction selon le régime, pour 41 % des coûts totaux.
Figure 1.2 Répartition des médicaments par statut de couverture, médicaments sélectionnés*, 2015
Cliquer sur l'image pour l'agrandir
Description de la figure
Cette figure se compose de deux parties : chaque partie comporte un graphique à barres et un tableau à une seule rangée présentant des renseignements supplémentaires. La partie A donne la part en pourcentage des médicaments sélectionnés inscrits avec une couverture sans restriction ou restreinte pour chaque régime public d’assurance-médicaments. La partie B donne la proportion des coûts pour les médicaments avec et sans restrictions inscrits. Les résultats globaux pour tous les régimes publics sont donnés pour les deux parties.
Au total, les 729 médicaments sélectionnés pour l’étude représentaient 6 555 millions de dollars en coûts de médicaments en 2015.
Partie A
blank
| Régime public d’assurance-médicaments |
Proportion des médicaments sélectionnés faisant l’objet d’une couverture sans restriction |
Proportion des médicaments sélectionnés faisant l’objet d’une couverture restreinte |
Nombre de médicaments |
| Colombie-Britannique |
73 % |
27 % |
585 |
| Alberta |
78 % |
22 % |
578 |
| Saskatchewan |
68 % |
32 % |
592 |
| Manitoba |
76 % |
24 % |
557 |
| Ontario |
66 % |
34 % |
549 |
| Québec |
76 % |
24 % |
628 |
| Nouveau-Brunswick |
73 % |
27 % |
592 |
| Nouvelle-Écosse |
73 % |
27 % |
577 |
| Île-du-Prince-Édouard |
72 % |
28 % |
509 |
| Terre-Neuve-et-Labrador |
75 % |
25 % |
612 |
| Services de santé non assurés |
83 % |
17 % |
566 |
| Moyenne |
74 % |
26 % |
Sans objet |
Les résultats globaux montrent que 49 % des médicaments sélectionnés étaient couverts sans restriction dans toutes les listes où ils étaient inscrits; 16 % étaient inscrits avec restrictions; et 35 % faisaient l’objet d’une couverture avec ou sans restriction selon le régime.
Partie B
blank
| Régime public d’assurance-médicaments |
Proportion des coûts des médicaments sélectionnés faisant l’objet d’une couverture sans restriction |
Proportion des coûts des médicaments sélectionnés faisant l’objet d’une couverture restreinte |
Coûts des médicaments |
| Colombie-Britannique |
51 % |
49 % |
1 235 millions $ |
| Alberta |
57 % |
43 % |
638 millions $ |
| Saskatchewan |
58 % |
42 % |
360 millions $ |
| Manitoba |
61 % |
39 % |
404 millions $ |
| Ontario |
60 % |
40 % |
3 237 millions $ |
| Québec |
Non disponible |
Non disponible |
Non disponible |
| Nouveau-Brunswick |
58 % |
42 % |
137 millions $ |
| Nouvelle-Écosse |
56 % |
44 % |
140 millions $ |
| Île-du-Prince-Édouard |
62 % |
38 % |
23 millions $ |
| Terre-Neuve-et-Labrador |
68 % |
32 % |
86 millions $ |
| Services de santé non assurés |
67 % |
33 % |
295 millions $ |
| Moyenne |
58 % |
42 % |
Sans objet |
Les résultats globaux montrent que 30 % des médicaments sélectionnés étaient couverts sans restriction dans toutes les listes où ils étaient inscrits; 29 % étaient inscrits avec restrictions; et 41 % faisaient l’objet d’une couverture avec ou sans restriction selon le régime.
Remarque : Basé sur le nombre total de médicaments (729) sélectionnés pour l’étude.
* Médicaments inscrits à au moins une liste de médicaments d’un régime public, sous réserve des critères d’exclusion.
† Les coûts des médicaments sont les montants acceptés aux fins de remboursement par les régimes publics d’assurance-médicaments pour les médicaments analysés.
Sources des données : Système national d’information sur l’utilisation des médicaments prescrits, Institut canadien d’information sur la santé; Liste des médicaments, Régie de l’assurance maladie du Québec, 20 novembre 2015.
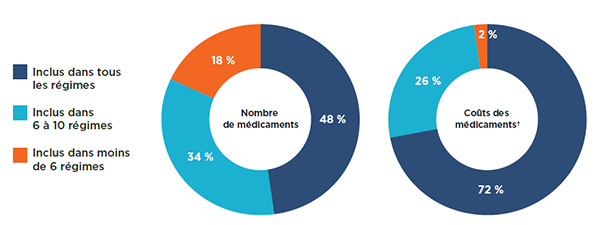
Une analyse de la couverture globale par les régimes publics d'assurance-médicaments a révélé que la plupart (82 %) des 729 médicaments sélectionnés figuraient sur au moins 6 des 11 listes étudiées : 48 % étaient inscrits à toutes les listes, tandis que 34 % étaient inscrits dans 6 à 10 d’entre elles (figure 1.3). Les médicaments inscrits aux listes de 6 régimes publics d’assurance-médicaments ou plus représentaient 98 % des coûts des médicaments sélectionnés.
Une faible proportion des médicaments (18 %) était inscrite aux listes de moins de 6 régimes. Ces médicaments représentaient une très faible proportion des coûts totaux des médicaments, soit seulement 2 %.
Figure 1.3 Médicaments inscrits aux listes selon le nombre de régimes publics, médicaments sélectionnés*, 2015
Cliquer sur l'image pour l'agrandir
Description de la figure
Ces deux graphiques en anneau donnent le pourcentage des 729 médicaments sélectionnés inclus dans (1) tous les régimes publics analysés, (2) dans six à dix régimes, et (3) dans moins de six régimes. Le premier graphique donne le pourcentage selon le nombre de médicaments et le second donne la part correspondante pour les coûts des médicaments.
blank
| Inscription |
Nombre de médicaments |
Coûts des médicaments |
| Tous les régimes |
48 % |
72 % |
| De six à dix régimes |
34 % |
26 % |
| Moins de six régimes |
18 % |
2 % |
Remarque : Basé sur le nombre total de médicaments (729) sélectionnés pour l’étude. Tous les régimes publics provinciaux d’assurance-médicaments et le Programme des soins de santé non assurés (SSNA) ont été inclus dans l’analyse.
* Médicaments inscrits à au moins une liste de médicaments d’un régime public, sous réserve des critères d’exclusion.
† Les coûts des médicaments sont les montants acceptés aux fins de remboursement par les régimes publics d’assurance-médicaments pour les médicaments analysés.
Sources des données : Système national d’information sur l’utilisation des médicaments prescrits, Institut canadien d’information sur la santé; Liste des médicaments, Régie de l’assurance maladie du Québec, 20 novembre 2015.
Les taux d’inscription indiqués à la figure 1.1 comparent chacune des listes au nombre total de médicaments sélectionnés. Pour obtenir un aperçu de la mesure dans laquelle les décisions d’inscription sont harmonisées entre les régimes, les taux de concordance ont également été mesurés. Ces taux ont été calculés pour chaque paire de régimes en examinant les décisions d’inscription pour chacun des 729 médicaments sélectionnés. Pour les 11 régimes analysés, 55 comparaisons interadministrations ont été évaluées, les décisions d’inscription à la liste « oui-oui » et « non-non » étant considérées comme concordantesNote de bas de page 10.
Le tableau 1.1 fournit les fourchettes pour les taux d’accord bilatéral dans tous les régimes analysés, tant en termes de nombre de médicaments (non pondéré) que de coûts correspondants (pondérés) pour les régimes publics d’assurance-médicaments du SNIUMP.
En ce qui concerne le nombre de médicaments, les taux de concordance variaient de 75 % (entre le Québec et l’Île-du-Prince-Édouard) à 89 % (entre la Nouvelle-Écosse et le Nouveau-Brunswick), avec un taux de concordance moyen et médian de 82 %. Lorsque le coût des médicaments était pris en compte, les taux de concordance moyens augmentaient fortement, passant de 81 % (entre la Colombie-Britannique et l’Île-du-Prince-Édouard) à 98 % (entre plusieurs paires de régimes), avec des taux de concordance moyen et médian de 93 % et 95 %, respectivement. Ces résultats laissent à nouveau croire que les médicaments qui ne sont pas inscrits aux listes de tous les régimes ne représentent qu’une petite part des coûts.
Tableau 1.1 Taux de concordance des listes entre les régimes publics d’assurance-médicaments, médicaments sélectionnés*, 2015
| |
Moyenne |
Médiane |
Minimum |
Maximum |
Écart-type |
| Taux de concordance (n=729 médicaments) |
82 % |
82 % |
75 % |
89 % |
3 % |
| Taux de concordance pondérés selon les coûts† |
93 % |
95 % |
81 % |
98 % |
4 % |
Remarque : Les taux de concordance étaient basés sur 55 combinaisons bilatérales pour les 11 régimes publics d’assurance-médicaments analysés, soit tous les régimes publics provinciaux et le Programme des soins de santé non assurés (SSNA).
* Médicaments inscrits à au moins une liste de médicaments d’un régime public, sous réserve des critères d’exclusion.
† Les coûts des médicaments sont les montants acceptés aux fins de remboursement par les régimes publics d’assurance-médicaments pour les médicaments analysés.
Sources des données : Système national d’information sur l’utilisation des médicaments prescrits, Institut canadien d’information sur la santé; Liste des médicaments, Régie de l’assurance maladie du Québec, 20 novembre 2015.
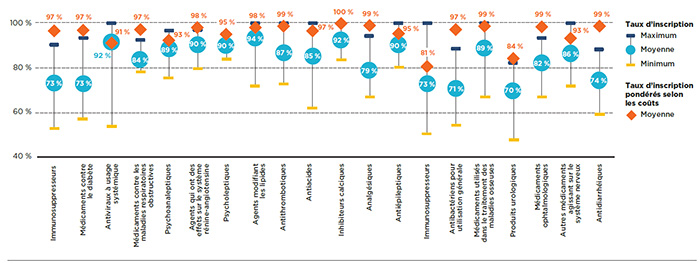
Le niveau d’harmonisation entre les régimes publics peut être étudié en tenant compte des taux moyens d’inscription par catégorie thérapeutique. La figure 1.4 présente les 20 principales catégories thérapeutiques sur le plan du coût en 2015, lesquelles comptaient pour 86 % du coût total des médicaments sélectionnés dans les régimes publics d’assurance-médicaments du SNIUMP. L’analyse a révélé que le pourcentage moyen de médicaments inscrits était relativement élevé pour la plupart des principales catégories thérapeutiques, bien qu’il existe des variations importantes dans les fourchettes.
Le taux d’inscription a été calculé séparément par catégorie thérapeutique pour chaque régime, et la moyenne a ensuite été calculée. Près du tiers des principales catégories thérapeutiques affichaient des taux d’inscription moyens de 90 % et plus, ce qui comprenait les antiviraux à usage systémique, les agents qui ont des effets sur le système rénine-angiotensine, les psycholeptiques et les agents modifiant les lipides. Alors que les trois dernières catégories étaient généralement composées de médicaments de source multiple, la catégorie antiviraux à usage systémique incluait les médicaments efficaces, mais plus coûteux utilisés pour le traitement de l’hépatite C. Même si le taux de couverture moyen pour cette catégorie était très élevé (92 %), les taux variaient de façon importante d'un régime à l'autre soit entre 53 % et 100 %. Cela pourrait être dû, en partie, à la décision de certains régimes de ne couvrir que certains médicaments donnés plutôt que tous les traitements disponibles en fonction de leur abordabilité ou de leur rentabilité.
Les taux d’inscription des médicaments ont augmenté lorsque les coûts des médicaments ont été pris en compte, mais il n’y a eu qu’un léger changement pour plusieurs catégories. Les taux d’inscription pour les catégories immunosuppresseurs et médicaments utilisés pour le diabète faisaient exception, puisqu’on y a remarqué des taux significativement plus élevés lorsqu’ils étaient pondérés par le coût.
Figure 1.4 Taux moyens d’inscription aux listes des régimes publics d’assurance-médicaments par catégorie thérapeutique, médicaments sélectionnés*, 2015
Cliquer sur l'image pour l'agrandir
Description de la figure
Ce graphique présente la fourchette des taux d’inscription aux listes des médicaments sélectionnés par catégorie thérapeutique, pour l’ensemble des régimes. On y trouve les taux d’inscription minimum, maximum et moyen pour chaque catégorie ainsi que le taux d’inscription moyen pondéré selon les coûts.
blank
| Catégorie thérapeutique |
Maximum |
Minimum |
Moyenne |
Moyenne pondérée selon les coûts |
| Immunosuppresseurs |
90 % |
52 % |
73 % |
97 % |
| Médicaments contre le diabète |
93 % |
57 % |
73 % |
97 % |
| Antiviraux à usage systémique |
100 % |
53 % |
92 % |
91 % |
| Médicaments contre les maladies respiratoires obstructives |
93 % |
78 % |
84 % |
97 % |
| Psychoanaleptiques |
97 % |
75 % |
89 % |
93 % |
| Agents qui ont des effets sur le système rénine-angiotensine |
97 % |
79 % |
90 % |
98 % |
| Psycholeptiques |
95 % |
84 % |
90 % |
95 % |
| Agents modifiant les lipides |
100 % |
71 % |
94 % |
98 % |
| Antithrombotiques |
100 % |
72 % |
87 % |
99 % |
| Antiacides |
100 % |
62 % |
85 % |
97 % |
| Inhibiteurs calciques |
100 % |
83 % |
92 % |
100 % |
| Analgésiques |
94 % |
67 % |
79 % |
99 % |
| Antiépileptiques |
100 % |
80 % |
90 % |
95 % |
| Immunostimulants |
100 % |
50 % |
73 % |
81 % |
| Antibactériens pour utilisation générale |
88 % |
54 % |
71 % |
97 % |
| Médicaments utilisés dans le traitement des maladies osseuses |
100 % |
67 % |
89 % |
99 % |
| Produits urologiques |
82 % |
47 % |
70 % |
84 % |
| Médicaments ophtalmologiques |
93 % |
67 % |
82 % |
99 % |
| Autres médicaments agissant sur le système nerveux |
100 % |
71 % |
86 % |
93 % |
| Antidiarrhéiques |
88 % |
59 % |
74 % |
99 % |
Remarque : Les taux d’inscription ont été calculés en fonction du nombre total de médicaments (729) de niveau ATC 2 sélectionnés pour l’étude.
* Médicaments inscrits à au moins une liste de médicaments d’un régime public, sous réserve des critères d’exclusion.
Sources des données : Système national d’information sur l’utilisation des médicaments prescrits, Institut canadien d’information sur la santé; Liste des médicaments, Régie de l’assurance maladie du Québec, 20 novembre 2015.
2. Inscription aux listes des médicaments de source unique et de sources multiples
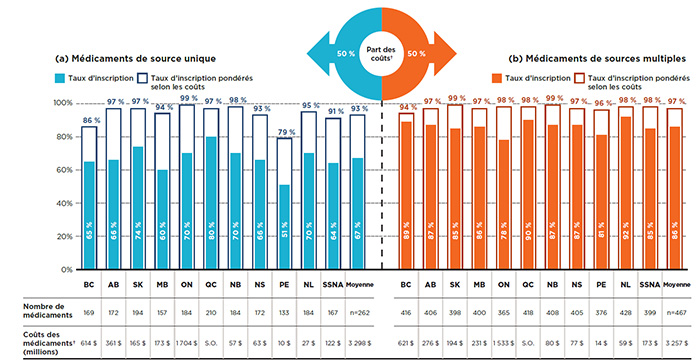
Bien que les taux globaux d’inscription aux listes soient relativement élevés et comparables pour tous les régimes publics, les résultats diffèrent pour les deux principaux segments de marché, les taux étant plus faibles et plus variables pour les médicaments de source unique et plus élevés et plus uniformes pour les médicaments de sources multiples. Néanmoins, lorsque les coûts des médicaments sont pris en compte, les taux d’inscription aux listes sont relativement élevés pour les deux segments de marché.
Sur les 729 médicaments sélectionnés pour l’analyse, 262 étaient de source unique et 467 étaient de sources multiplesNote de bas de page 11. Ces deux segments de marché ont chacun représenté un coût de 3,3 milliards de dollars pour les régimes publics d’assurance-médicaments en 2015. Alors que les provinces ont couvert en moyenne 67 % des médicaments de source unique, les taux d’inscription des médicaments de sources multiples ont été considérablement plus élevés, soit 86 % en moyenne.
Comme le montre la figure 2.1, les taux d’inscription pour les médicaments de source unique variaient, allant de 51 % à l’Île-du-Prince-Édouard à 80 % au Québec. Lorsque les coûts des médicaments étaient pris en compte, les taux d’inscription étaient significativement plus élevés dans tous les régimes publics d’assurance-médicaments, avec une moyenne de 93 % pour tous les régimes et un maximum de 99 % en Ontario. Ces résultats laissent croire que les médicaments non couverts par les régimes ne représentent qu’une petite part des coûts.
Les taux d’inscription pour les médicaments de sources multiples étaient plus élevés et plus uniformes que ceux des médicaments de source unique, allant de 78 % en Ontario à 92 % à Terre-Neuve-et-Labrador. Une fois pondérés selon le coût du médicament, les taux d’inscription augmentent, atteignant une moyenne de 97 % pour l’ensemble des régimes et dépassant 94 % dans tous les régimes publics d’assurance-médicaments.
Figure 2.1 Taux d’inscription aux listes des régimes publics d’assurance-médicaments, par segment de marché, médicaments sélectionnés*, 2015
Cliquer sur l'image pour l'agrandir
Description de la figure
Ce graphique à barres en deux parties illustre les taux d’inscription et les taux d’inscription pondérés selon les coûts pour les médicaments de source unique et de sources multiples analysés. Le tableau qui l’accompagne donne le nombre absolu de médicaments sélectionnés ainsi que les coûts des médicaments pour les médicaments inscrits.
Sur les 729 médicaments sélectionnés pour l’étude, 262 étaient des médicaments de source unique, représentant des coûts de 3 298 millions de dollars dans les régimes publics d’assurance-médicaments du SNIUMP en 2015, et 467 étaient des médicaments de sources multiples, représentant des coûts de 3 257 millions de dollars.
Partie A : Médicaments de source unique
blank
| Régime public d’assurance-médicaments |
Taux d’inscription |
Taux d’inscription pondérés selon les coûts |
Nombre de médicaments |
Coûts des médicaments |
| Colombie-Britannique |
65 % |
86 % |
169 |
614 millions $ |
| Alberta |
66 % |
97 % |
172 |
361 millions $ |
| Saskatchewan |
74 % |
97 % |
194 |
165 millions $ |
| Manitoba |
60 % |
94 % |
157 |
173 millions $ |
| Ontario |
70 % |
99 % |
184 |
1 704 millions $ |
| Québec |
80 % |
97 % |
210 |
Non disponible |
| Nouveau-Brunswick |
70 % |
98 % |
184 |
57 millions $ |
| Nouvelle-Écosse |
66 % |
93 % |
172 |
63 millions $ |
| Île-du-Prince-Édouard |
51 % |
79 % |
133 |
10 millions $ |
| Terre-Neuve-et-Labrador |
70 % |
95 % |
184 |
27 millions $ |
| Services de santé non assurés |
64 % |
91 % |
167 |
122 millions $ |
| Moyenne |
67 % |
93 % |
Sans objet |
Sans objet |
Partie B : Médicaments de sources multiples
blank
| Régime public d’assurance-médicaments |
Taux d’inscription |
Taux d’inscription pondérés selon les coûts |
Nombre de médicaments |
Coûts des médicaments |
| Colombie-Britannique |
89 % |
94 % |
416 |
621 millions $ |
| Alberta |
87 % |
97 % |
406 |
276 millions $ |
| Saskatchewan |
85 % |
99 % |
398 |
194 millions $ |
| Manitoba |
86 % |
97 % |
400 |
231 millions $ |
| Ontario |
78 % |
98 % |
365 |
1 533 millions $ |
| Québec |
90 % |
98 % |
418 |
Non disponible |
| Nouveau-Brunswick |
87 % |
99 % |
408 |
80 millions $ |
| Nouvelle-Écosse |
87 % |
97 % |
405 |
77 millions $ |
| Île-du-Prince-Édouard |
81 % |
96 % |
376 |
14 millions $ |
| Terre-Neuve-et-Labrador |
92 % |
98 % |
428 |
59 millions $ |
| Services de santé non assurés |
85 % |
98 % |
399 |
173 millions $ |
| Moyenne |
86 % |
97 % |
Sans objet |
Sans objet |
Remarque : Les taux d’inscription étaient basés sur le nombre de médicaments sélectionnés pour l’étude (467 médicaments de sources multiples et 262 médicaments de source unique).
* Médicaments inscrits à au moins une liste de médicaments d’un régime public, sous réserve des critères d’exclusion.
† Les coûts des médicaments sont les montants acceptés aux fins de remboursement par les régimes publics d’assurance-médicaments pour les médicaments analysés.
Sources des données : Système national d’information sur l’utilisation des médicaments prescrits, Institut canadien d’information sur la santé; Liste des médicaments, Régie de l’assurance maladie du Québec, 20 novembre 2015.
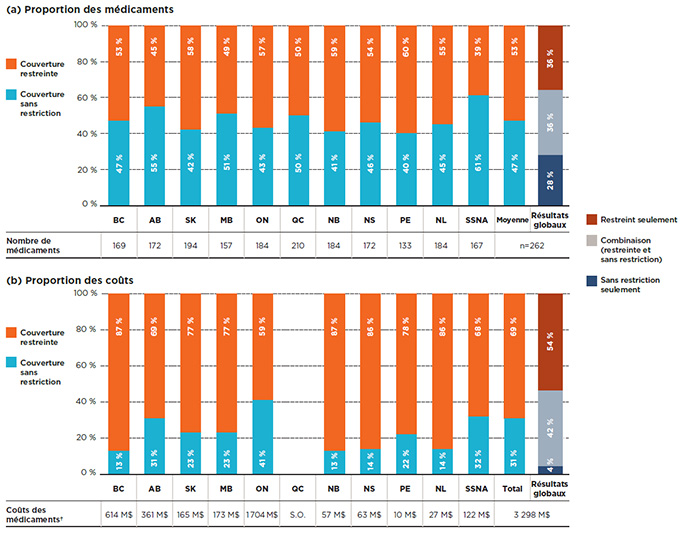
Une analyse du statut de couverture montre qu’en moyenne, plus de la moitié des médicaments de source unique figurant sur la liste d’un régime public d’assurance-médicaments étaient couverts avec restrictions. En revanche, la plupart des médicaments de sources multiples étaient couverts sans restriction, ce qui indique que la couverture des médicaments récents et onéreux est soumise à un plus grand nombre de conditions dans les régimes publics d’assurance-médicaments.
La figure 2.2 met l’accent sur les médicaments de source unique et précise leur répartition selon le statut de couverture a) des médicaments inscrits et b) leurs coûts respectifs pour chacun des régimes publics. En moyenne, 53 % des médicaments inscrits dans un régime particulier étaient couverts avec restrictions et comptaient pour plus des deux tiers (69 %) des coûts des régimes publics liés aux médicaments de source unique.
Les résultats globaux (barre de droite de la figure 2.2) montrent que sur les 262 médicaments de source unique, plus d’un tiers (36 %) bénéficiaient d’une couverture restreinte par tous les régimes pour lesquels ils étaient inscrits aux listes, et que ceux-ci représentaient 54 % des coûts globaux dans les régimes publics du SNIUMP. Par ailleurs, la couverture de 36 % de ces médicaments pouvait comporter des restrictions selon les régimes, et ceux-ci pesaient pour 42 % des coûts totaux. Les 28 % restants de médicaments étaient couverts sans restriction et représentaient seulement une part minimale de 4 % des coûts.
Figure 2.2 Répartition des médicaments de source unique par statut de couverture, médicaments sélectionnés*, 2015
Cliquer sur l'image pour l'agrandir
Description de la figure
Cette figure se compose de deux parties : chaque partie comporte un graphique à barres et un tableau à une seule rangée présentant des renseignements supplémentaires. La partie A donne la part en pourcentage des médicaments de source unique inscrits avec une couverture sans restriction ou restreinte pour chaque régime. La partie B donne la proportion des coûts pour les médicaments avec et sans restrictions inscrits. Les résultats globaux pour tous les régimes publics sont donnés pour les deux parties.
Sur les 729 médicaments sélectionnés pour l’étude, 262 étaient des médicaments de source unique, représentant des coûts de 3 298 millions de dollars pour les régimes publics d’assurance-médicaments du SNIUMP en 2015.
Partie A : Proportion des médicaments
blank
| Régime public d’assurance-médicaments |
Proportion des médicaments sélectionnés faisant l’objet d’une couverture sans restriction |
Proportion des médicaments sélectionnés faisant l’objet d’une couverture restreinte |
Nombre de médicaments |
| Colombie-Britannique |
47 % |
53 % |
169 |
| Alberta |
55 % |
45 % |
172 |
| Saskatchewan |
42 % |
58 % |
194 |
| Manitoba |
51 % |
49 % |
157 |
| Ontario |
43 % |
57 % |
184 |
| Québec |
50 % |
50 % |
210 |
| Nouveau-Brunswick |
41 % |
59 % |
184 |
| Nouvelle-Écosse |
46 % |
54 % |
172 |
| Île-du-Prince-Édouard |
40 % |
60 % |
133 |
| Terre-Neuve-et-Labrador |
45 % |
55 % |
184 |
| Services de santé non assurés |
61 % |
39 % |
167 |
| Moyenne |
47 % |
53 % |
Sans objet |
Les résultats globaux montrent que 28 % des médicaments de source unique étaient couverts sans restriction dans toutes les listes où ils étaient inscrits; 36 % étaient inscrits avec restrictions; et 36 % faisaient l’objet d’une couverture avec ou sans restriction selon le régime.
Partie B : Proportion des coûts
blank
| Régime public d’assurance-médicaments |
Proportion des coûts des médicaments sélectionnés faisant l’objet d’une couverture sans restriction |
Proportion des coûts des médicaments sélectionnés faisant l’objet d’une couverture restreinte |
Coûts des médicaments |
| Colombie-Britannique |
13 % |
87 % |
614 millions $ |
| Alberta |
31 % |
69 % |
361 millions $ |
| Saskatchewan |
23 % |
77 % |
165 millions $ |
| Manitoba |
23 % |
77 % |
173 millions $ |
| Ontario |
41 % |
59 % |
1 704 millions $ |
| Québec |
Non disponible |
Non disponible |
Non disponible |
| Nouveau-Brunswick |
13 % |
87 % |
57 millions $ |
| Nouvelle-Écosse |
14 % |
86 % |
63 millions $ |
| Île-du-Prince-Édouard |
22 % |
78 % |
10 millions $ |
| Terre-Neuve-et-Labrador |
14 % |
86 % |
27 millions $ |
| Services de santé non assurés |
32 % |
68 % |
122 millions $ |
| Moyenne |
31 % |
69 % |
Sans objet |
Les résultats globaux pour les coûts en médicaments montrent que 4 % des médicaments de source unique étaient couverts sans restriction dans toutes les listes où ils étaient inscrits; 54 % étaient inscrits avec restrictions; et 42 % faisaient l’objet d’une couverture avec ou sans restriction selon le régime.
Remarque : Basé sur le nombre total de médicaments de source unique (262) sélectionnés pour l’étude.
* Médicaments inscrits à au moins une liste de médicaments d’un régime public, sous réserve des critères d’exclusion.
† Les coûts des médicaments sont les montants acceptés aux fins de remboursement par les régimes publics d’assurance-médicaments pour les médicaments analysés. La base de données du SNIUMP n'inclut pas de données pour le Québec.
Source des données : Système national d’information sur l’utilisation des médicaments prescrits, Institut canadien d’information sur la santé.
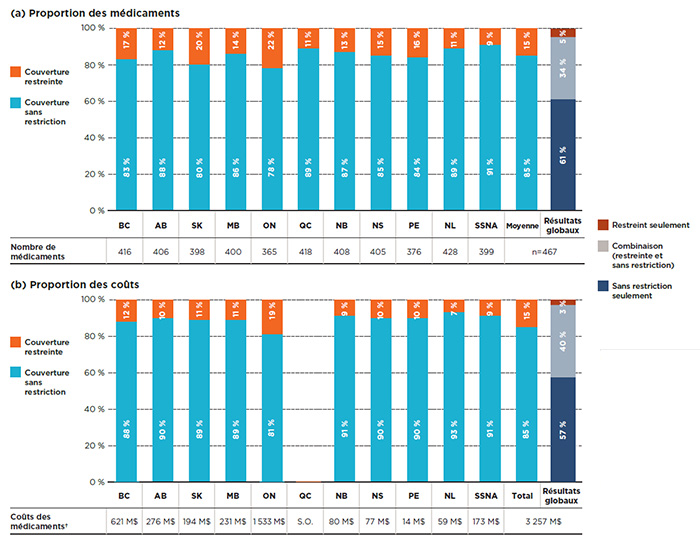
Contrairement aux médicaments de source unique, les médicaments de sources multiples étaient généralement couverts sans restriction, en moyenne à 85 %. La figure 2.3 montre la répartition selon le statut de couverture des médicaments de sources multiples en ce qui concerne a) les médicaments inscrits et b) leurs coûts respectifs pour chacun des régimes publics.
Les résultats globaux montrent que sur les 467 médicaments de sources multiples, 61 % avaient un statut de couverture sans restriction dans toutes les listes auxquelles ils étaient inscrits. La couverture de 34 % de ces médicaments pouvait comporter des restrictions selon les régimes, et 5 % avaient une couverture restreinte partout. Une répartition similaire a été constatée lorsque les coûts des médicaments ont été pris en considération.
Figure 2.3 Répartition des médicaments de sources multiples par statut de couverture, médicaments sélectionnés*, 2015
Cliquer sur l'image pour l'agrandir
Description de la figure
Cette figure se compose de deux parties : chaque partie comporte un graphique à barres et un tableau à une seule rangée présentant des renseignements supplémentaires. La partie A donne la part en pourcentage des médicaments de sources multiples inscrits avec une couverture sans restriction ou restreinte pour chaque régime public. La partie B donne la proportion des coûts pour les médicaments avec et sans restrictions inscrits. Les résultats globaux pour tous les régimes publics sont donnés pour les deux parties.
Sur les 729 médicaments sélectionnés pour l’étude, 467 étaient des médicaments de sources multiples, représentant des coûts de 3 257 millions de dollars.
Partie A : Proportion des médicaments
blank
| Régime public d’assurance-médicaments |
Proportion des médicaments sélectionnés faisant l’objet d’une couverture sans restriction |
Proportion des médicaments sélectionnés faisant l’objet d’une couverture restreinte |
Nombre de médicaments |
| Colombie-Britannique |
83 % |
17 % |
416 |
| Alberta |
88 % |
12 % |
406 |
| Saskatchewan |
80 % |
20 % |
398 |
| Manitoba |
86 % |
14 % |
400 |
| Ontario |
78 % |
22 % |
365 |
| Québec |
89 % |
11 % |
418 |
| Nouveau-Brunswick |
87 % |
13 % |
408 |
| Nouvelle-Écosse |
85 % |
15 % |
405 |
| Île-du-Prince-Édouard |
84 % |
16 % |
376 |
| Terre-Neuve-et-Labrador |
89 % |
11 % |
428 |
| Services de santé non assurés |
91 % |
9 % |
399 |
| Moyenne |
85 % |
15 % |
Sans objet |
Les résultats globaux montrent que 61 % des médicaments de sources multiples étaient couverts sans restriction dans toutes les listes où ils étaient inscrits; 5 % étaient inscrits avec restrictions; et 34 % faisaient l’objet d’une couverture avec ou sans restriction selon le régime.
Partie B : Proportion des coûts
blank
| Régime public d’assurance-médicaments |
Proportion des coûts des médicaments sélectionnés faisant l’objet d’une couverture sans restriction |
Proportion des coûts des médicaments sélectionnés faisant l’objet d’une couverture restreinte |
Coûts des médicaments |
| Colombie-Britannique |
88 % |
12 % |
621 millions $ |
| Alberta |
90 % |
10 % |
276 millions $ |
| Saskatchewan |
89 % |
11 % |
194 millions $ |
| Manitoba |
89 % |
11 % |
231 millions $ |
| Ontario |
81 % |
19 % |
1 533 millions $ |
| Québec |
Non disponible |
Non disponible |
Non disponible |
| Nouveau-Brunswick |
91 % |
9 % |
80 millions $ |
| Nouvelle-Écosse |
90 % |
10 % |
77 millions $ |
| Île-du-Prince-Édouard |
90 % |
10 % |
14 millions $ |
| Terre-Neuve-et-Labrador |
93 % |
7 % |
59 millions $ |
| Services de santé non assurés |
91 % |
9 % |
173 millions $ |
| Moyenne |
85 % |
15 % |
Sans objet |
Les résultats globaux pour les coûts en médicaments montrent que 57 % des médicaments de sources multiples étaient couverts sans restriction dans toutes les listes où ils étaient inscrits; 3 % étaient inscrits avec restrictions; et 40 % faisaient l’objet d’une couverture avec ou sans restriction selon le régime.
Remarque : Basé sur le nombre total de médicaments de sources multiples (467) sélectionnés pour l’étude.
* Médicaments inscrits à au moins une liste de médicaments d’un régime public, sous réserve des critères d’exclusion.
† Les coûts des médicaments sont les montants acceptés aux fins de remboursement par les régimes publics d’assurance-médicaments pour les médicaments analysés. La base de données du SNIUMP n'inclut pas de données pour le Québec.
Sources des données : Système national d’information sur l’utilisation des médicaments prescrits, Institut canadien d’information sur la santé; Liste des médicaments, Régie de l’assurance maladie du Québec, 20 novembre 2015.
Une comparaison des décisions d’inscription dans plusieurs régimes montre que les deux tiers des médicaments de source unique sélectionnés étaient inscrits à au moins 6 des 11 listes des régimes publics d’assurance-médicaments, alors qu’un pourcentage nettement plus élevé des médicaments de sources multiples (88 %) étaient couvert par au moins 6 régimes. Lorsque les coûts étaient pris en compte, un pourcentage encore plus important de médicaments de source unique ou de sources multiples était remboursé par la majorité des régimes (97 % et 99 %, respectivement).
La mesure dans laquelle les décisions d’inscription concordaient entre les paires de régimes a également été mesurée pour les médicaments de source unique ou de sources multiples. Le tableau 2.1 indique les fourchettes des taux de concordance bilatéraux dans tous les régimes analysés, tant en termes de nombre de médicaments (non pondéré) que de coûts correspondants (pondérés) dans les régimes publics d’assurance-médicaments du SNIUMP. Les résultats semblent indiquer que les taux de concordance étaient plus élevés et plus uniformes pour les médicaments de sources multiples.
Tableau 2.1 Taux de concordance des listes des régimes publics d’assurance-médicaments, médicaments sélectionnés* de source unique ou de sources multiples, 2015
| Type de médicament |
Taux |
Moyenne |
Médiane |
Minimum |
Maximum |
Écart-type
deviation |
Source unique
(n=262) |
Taux de concordance |
74 % |
76 % |
62 % |
84 % |
6 % |
| Taux de concordance pondérés selon les coûts† |
90 % |
93 % |
71 % |
98 % |
7 % |
Sources multiples
(n=467) |
Taux de concordance |
86 % |
86 % |
78 % |
91 % |
3 % |
| Taux de concordance pondérés selon les coûts† |
96 % |
97 % |
91 % |
99 % |
2 % |
Remarque : Les taux de concordance étaient basés sur 55 combinaisons bilatérales pour les 11 régimes publics d’assurance-médicaments analysés, soit tous les régimes publics provinciaux et le Programme des soins de santé non assurés (SSNA).
* Médicaments inscrits à au moins une liste de médicaments d’un régime public, sous réserve des critères d’exclusion.
† Les coûts des médicaments sont les montants acceptés aux fins de remboursement par les régimes publics d’assurance-médicaments pour les médicaments analysés.
Sources des données : Système national d’information sur l’utilisation des médicaments prescrits, Institut canadien d’information sur la santé; Liste des médicaments, Régie de l’assurance maladie du Québec, 20 novembre 2015.
Médicaments onéreux
Les médicaments onéreux sont un sous-ensemble important du segment de marché des médicaments de source unique. Sur les 262 médicaments de source unique sélectionnés pour l’analyse, 41 ont été identifiés comme étant onéreuxNote de bas de page 12, soit ceux dont le coût annuel moyen par bénéficiaire dépassait 10 000 $. En 2015, ces médicaments représentaient une part importante des coûts des régimes publics d’assurance-médicaments, soit 1,5 milliard de dollars.
Alors que les taux d’inscription des médicaments onéreux variaient considérablement selon les régimes, allant de 37 % à 90 %, le taux moyen d’inscription était le même que le taux général pour les médicaments de source unique (67 %). Lorsque les coûts des médicaments étaient pris en compte, les taux d’inscription étaient plus élevés et plus uniformes, tous les régimes ayant des taux de 90 % ou plus, sauf l’Île-du-Prince-Édouard (65 %) et les SSNA (83 %). Presque tous les médicaments onéreux (96 %) bénéficiaient d’une couverture restreinte.
À l’instar d’autres médicaments de source unique, plus des deux tiers (71 %) des médicaments onéreux sélectionnés ont été inscrits à au moins 6 des 11 listes des régimes publics d’assurance-médicaments, ce qui représentait 96 % des coûts respectifs des médicaments. Toutefois, les taux de concordance bilatéraux étaient généralement inférieurs à ceux des médicaments de source unique en général, les taux moyen et médian étant de 60 % et 63 %, respectivement. Lorsque le coût des médicaments était pris en compte, les taux de concordance moyen et médian augmentaient sensiblement, à 89 % et 94 %.
3. Médicaments essentiels
Presque tous les médicaments essentiels sont inscrits aux listes des régimes publics d’assurance-médicaments, et les taux d’inscription sont uniformes pour l’ensemble des régimes. La majorité de ces médicaments sont couverts sans restriction, et on observe une variation très faible entre les listes. Une comparaison des décisions d’inscription entre les régimes par paire montre un degré élevé de concordance.
Cette section évalue l’harmonisation de la couverture des médicaments essentiels entre les administrations. La liste des 125 médicaments utilisés pour cette analyse était basée sur la liste des médicaments essentiels pour les soins de santé primaires au Canada du projet CLEAN Meds; elle comprend à la fois des médicaments de source unique et des médicaments de sources multiples (respectivement 16 et 109 médicaments). Deux des médicaments de source unique sont des médicaments onéreux, comme définis précédemment (adalimumab et emtricitabine/disoproxil de ténofovir/éfavirenz). Consultez l’annexe D pour obtenir une liste complète des médicaments essentiels analysés ainsi que leurs coûts pour les régimes publics d’assurance-médicaments et les ventes nationales pour 2015.
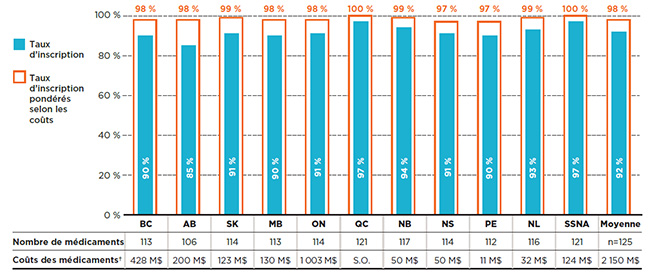
Ce segment de marché représentait 2,2 milliards de dollars en coûts de médicaments pour les régimes publics en 2015. Presque tous les médicaments essentiels étaient inscrits aux listes des régimes publics d’assurance-médicaments. Comme le montre la figure 3.1, les taux d’inscription à chaque liste variaient entre 85 % en Alberta et 97 % au Québec et dans les SSNA, la moyenne étant de 92 % dans l’ensemble des régimes analysés pour 2015. Lorsque les coûts des médicaments étaient pris en compte, les taux d’inscription atteignaient près de 100 % pour l’ensemble des listes.
Figure 3.1 Coût des médicaments inscrits aux listes des régimes publics d’assurance-médicaments, médicaments essentiels*, 2015
Cliquer sur l'image pour l'agrandir
Description de la figure
Ce graphique à barres donne les taux d’inscription et les taux d’inscription pondérés selon les coûts pour les médicaments figurant sur la liste des médicaments essentiels qui ont été analysés. Le tableau qui l’accompagne donne le nombre absolu de médicaments essentiels inscrits sur chaque liste ainsi que les coûts des médicaments pour les médicaments inscrits.
Au total, les 125 médicaments essentiels sélectionnés pour l’étude représentaient 2 150 millions de dollars en coûts de médicaments pour les régimes publics d’assurance-médicaments du SNIUMP en 2015.
blank
| Régime public d’assurance-médicaments |
Taux d’inscription |
Taux d’inscription pondérés selon les coûts |
Nombre de médicaments |
Coûts des médicaments |
| Colombie-Britannique |
90 % |
98 % |
113 |
428 millions $ |
| Alberta |
85 % |
98 % |
106 |
200 millions $ |
| Saskatchewan |
91 % |
99 % |
114 |
123 millions $ |
| Manitoba |
90 % |
98 % |
113 |
130 millions $ |
| Ontario |
91 % |
98 % |
114 |
1 003 millions $ |
| Québec |
97 % |
100 % |
121 |
Non disponible |
| Nouveau-Brunswick |
94 % |
99 % |
117 |
50 millions $ |
| Nouvelle-Écosse |
91 % |
97 % |
114 |
50 millions $ |
| Île-du-Prince-Édouard |
90 % |
97 % |
112 |
11 millions $ |
| Terre-Neuve-et-Labrador |
93 % |
99 % |
116 |
32 millions $ |
| Services de santé non assurés |
97 % |
100 % |
121 |
124 millions $ |
| Moyenne |
92 % |
98 % |
Sans objet |
Sans objet |
Remarque : Les taux d’inscription étaient basés sur le nombre total de médicaments essentiels (125).
* La sélection des médicaments reposait sur la liste des médicaments essentiels pour les soins de santé primaires au Canada du projet CLEAN Meds en 2016.
† Les coûts des médicaments sont les montants acceptés aux fins de remboursement par les régimes publics d’assurance-médicaments pour les médicaments analysés.
Sources des données : Système national d’information sur l’utilisation des médicaments prescrits, Institut canadien d’information sur la santé; Liste des médicaments, Régie de l’assurance maladie du Québec, 20 novembre 2015.
Une analyse du statut de couverture montre qu’en moyenne, 86 % des médicaments essentiels inscrits à un régime donné étaient couverts sans restriction. Bien que seulement 14 % des médicaments aient été couverts avec des restrictions, ils représentaient 25 % des coûts des médicaments des régimes publics.
La figure 3.2 illustre la répartition du statut d’admissibilité selon a) les médicaments inscrits et b) leurs coûts respectifs pour chacun des régimes publics. Les SSNA et le Québec ont inscrit 90 % des médicaments sans restriction, une moyenne légèrement supérieure à celle des autres régimes publics d’assurance maladie (82 % à 88 %).
Les résultats globaux montrent que, sur les 125 médicaments essentiels, 68 % avaient un statut de couverture sans restriction pour toutes les listes sur lesquelles ils étaient inscrits, et représentaient 57 % des coûts globaux dans les plans publics du SNIUMP; 27 % étaient inscrits avec couverture restreinte ou non selon le régime, pour 26 % des coûts totaux; 5 % étaient inscrits avec restrictions dans tous les régimes, pour 17 % des coûts.
Figure 3.2 Répartition des médicaments selon le statut de couverture, médicaments essentiels*, 2015
Cliquer sur l'image pour l'agrandir
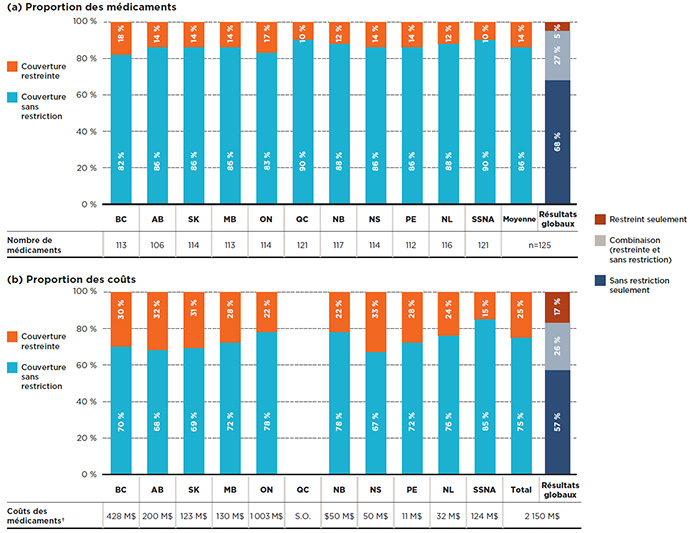
Description de la figure
Cette figure se compose de deux parties : chaque partie comporte un graphique à barres et un tableau à une seule rangée présentant des renseignements supplémentaires. La partie A donne la part en pourcentage des médicaments essentiels inscrits avec une couverture sans restriction ou restreinte pour chaque régime public. La partie B donne la proportion des coûts pour les médicaments avec et sans restrictions inscrits. Les résultats globaux pour tous les régimes publics sont donnés pour les deux parties.
Au total, les 125 médicaments essentiels sélectionnés pour l’étude représentaient 2 150 millions de dollars en coûts de médicaments pour les régimes publics d’assurance-médicaments du SNIUMP en 2015.
Partie A : Proportion des médicaments
blank
| Régime public d’assurance-médicaments |
Proportion des médicaments sélectionnés faisant l’objet d’une couverture sans restriction |
Proportion des médicaments sélectionnés faisant l’objet d’une couverture restreinte |
Nombre de médicaments |
| Colombie-Britannique |
82 % |
18 % |
113 |
| Alberta |
86 % |
14 % |
106 |
| Saskatchewan |
86 % |
14 % |
114 |
| Manitoba |
86 % |
14 % |
113 |
| Ontario |
83 % |
17 % |
114 |
| Québec |
90 % |
10 % |
121 |
| Nouveau-Brunswick |
88 % |
12 % |
117 |
| Nouvelle-Écosse |
86 % |
14 % |
114 |
| Île-du-Prince-Édouard |
86 % |
14 % |
112 |
| Terre-Neuve-et-Labrador |
88 % |
12 % |
116 |
| Services de santé non assurés |
90 % |
10 % |
121 |
| Moyenne |
86 % |
14 % |
Sans objet |
Les résultats globaux montrent que 68 % des médicaments essentiels étaient couverts sans restriction dans toutes les listes où ils étaient inscrits; 5 % étaient inscrits avec restrictions; et 27 % faisaient l’objet d’une couverture avec ou sans restriction selon le régime.
Partie B : Proportion des coûts
blank
| Régime public d’assurance-médicaments |
Proportion des coûts des médicaments sélectionnés faisant l’objet d’une couverture sans restriction |
Proportion des coûts des médicaments sélectionnés faisant l’objet d’une couverture restreinte |
Coûts des médicaments |
| Colombie-Britannique |
70 % |
30 % |
428 millions $ |
| Alberta |
68 % |
32 % |
200 millions $ |
| Saskatchewan |
69 % |
31 % |
123 millions $ |
| Manitoba |
72 % |
28 % |
130 millions $ |
| Ontario |
78 % |
22 % |
1 003 millions $ |
| Québec |
Non disponible |
Non disponible |
Non disponible |
| Nouveau-Brunswick |
78 % |
22 % |
50 millions $ |
| Nouvelle-Écosse |
67 % |
33 % |
50 millions $ |
| Île-du-Prince-Édouard |
72 % |
28 % |
11 millions $ |
| Terre-Neuve-et-Labrador |
76 % |
24 % |
32 millions $ |
| Services de santé non assurés |
85 % |
15 % |
124 millions $ |
| Moyenne |
75 % |
25 % |
Sans objet |
Les résultats globaux montrent que 57 % des médicaments essentiels étaient couverts sans restriction dans toutes les listes où ils étaient inscrits; 17 % étaient inscrits avec restrictions; et 26 % faisaient l’objet d’une couverture avec ou sans restriction selon le régime.
Remarque : Basé sur le nombre total de médicaments essentiels (125).
* La sélection des médicaments reposait sur la liste des médicaments essentiels pour les soins de santé primaires au Canada du projet CLEAN Meds en 2016.
† Les coûts des médicaments sont les montants acceptés aux fins de remboursement par les régimes publics d’assurance-médicaments pour les médicaments analysés.
Sources des données : Système national d’information sur l’utilisation des médicaments prescrits, Institut canadien d’information sur la santé; Liste des médicaments, Régie de l’assurance maladie du Québec, 20 novembre 2015.
En ce qui a trait aux décisions d’inscription pour l’ensemble des régimes, 94 % des médicaments essentiels étaient répertoriés dans au moins 6 des 11 listes des régimes publics d’assurance-médicaments, pour 99 % des coûts respectifs des médicaments.
Le tableau 3.1 indique les fourchettes des taux de concordance bilatéraux entre les régimes analysés, tant sur le plan du nombre de médicaments (non pondéré) que des coûts correspondants (pondérés) dans les régimes publics d’assurance-médicaments du SNIUMP. Les résultats montrent un haut degré d’harmonisation entre les régimes.
Tableau 3.1Taux de concordance des listes entre les régimes publics d’assurance-médicaments, médicaments essentiels*, 2015
| |
Moyenne |
Médiane |
Minimum |
Maximum |
Écart-type |
| Taux de concordance (n=125 médicaments) |
93 % |
94 % |
87 % |
98 % |
2 % |
| Taux de concordance pondérés selon les coûts† |
98 % |
98 % |
96 % |
100 % |
1 % |
Remarque : Les taux de concordance étaient basés sur 55 combinaisons bilatérales pour les 11 régimes publics d’assurance-médicaments analysés : tous les régimes publics provinciaux et le Programme des soins de santé non assurés (SSNA).
* La sélection des médicaments reposait sur la liste des médicaments essentiels pour les soins de santé primaires au Canada du projet CLEAN Meds en 2016.
† Les coûts des médicaments sont les montants acceptés aux fins de remboursement par les régimes publics d’assurance-médicaments pour les médicaments analysés.
Sources des données : Système national d’information sur l’utilisation des médicaments prescrits, Institut canadien d’information sur la santé; Liste des médicaments, Régie de l’assurance maladie du Québec, 20 novembre 2015.
Références
CEPMB. 2017. CompasRx : Rapport annuel sur les dépenses des régimes publics d’assurance-médicaments, 2015-2016. Ottawa : Conseil d’examen du prix des médicaments brevetés. Disponible au : http://www.pmprb-cepmb.gc.ca/view.asp?ccid=1314&lang=fr.
CLEAN Meds Project. Carefully Selected and Easily Accessible at No Charge Medications. Toronto : Fondation de l’Hôpital St. Michael’s, Disponible au : http://cleanmeds.ca (en anglais seulement, consulté en août 2017).
Coalition canadienne de la santé. 2016. Un régime public universel d’assurances-médicaments pour tous. Ottawa (Ontario).
Institut canadien d’information sur la santé. 2016. Dépenses en médicaments prescrits au Canada, 2016 : regard sur les régimes publics d'assurance-médicaments. Ottawa (Ontario) : ICIS.
Morgan S., G. Hanley, C. Raymond, R. Blais. 2009. Breadth, Depth and Agreement among Provincial Formularies in Canada. Healthcare Policy 4(4):162-84.
Morgan S.G., W. Li, B. Yau, N. Persaud. 2017. Estimated effects of adding universal public coverage of an essential medicines list to existing public drug plans in Canada. CMAJ 189(8). DOI : 10.1503/cmaj.161082.
Annexe A : Médicaments exclus
Le présent rapport compare les médicaments inscrits à la liste des médicaments assurés de chaque régime public. Selon la structure du régime, certaines catégories de médicaments sont couvertes par l’entremise de programmes spécialisés et, par conséquent, ne sont pas incluses dans la liste de médicaments. Afin d’améliorer l’uniformité des comparaisons entre les régimes publics d’assurance-médicaments, ces médicaments ont été exclus de l’analyse. De plus, les médicaments en vente libre et ceux pour lesquels il n’y avait pas de données sur l’utilisation en 2015 ont été exclus de l’échantillon analysé. Le tableau A1 donne un aperçu des médicaments exclus, ainsi que la part correspondante de l’ensemble des coûts associés aux médicaments pour les régimes publics d’assurance-médicaments du SNIUMP en 2015.
Tableau A1 Médicaments exclus de l’analyse
| Désignation |
ATC niveau 2 |
Part des coûts des médicaments pour les régimes publics d’assurance-médicaments du SNIUMP* |
| Médicaments pour traiter la dégénérescence maculaire liée à l’âge |
S01 |
5,1 % |
| Médicaments contre le cancer |
L01, L02 et L04 |
3,8 % |
| Agents diagnostiques |
S.O. |
3,8 % |
| Traitement du VIH |
J05 |
2,3 % |
| Médicaments en vente libre |
Divers |
1,0 % |
| Epoétines |
B03 |
0,5 % |
| Médicaments sélectionnés pour les maladies rares |
A16 |
0,2 % |
| Autres médicaments† |
Divers |
0,7 % |
| Total |
|
17,4 % |
* Comprend les coûts des médicaments pour les régimes publics de toutes les provinces, sauf le Québec, ainsi que le Programme des SSNA.
† Comprend, par exemple, les médicaments sans code de marque ou code générique dans la base de données du SNIUMP.
Source de données : Système national d’information sur l’utilisation des médicaments prescrits, Institut canadien d’information sur la santé.
Annexe B : Listes accordant une couverture restreinte ou sans restriction
Dans cette analyse, un médicament est considéré comme étant à couverture restreinte si toutes les versions disponibles (force, forme ou fabricant) figurant sur une liste ont le statut de médicament à couverture restreinte. À l’opposé, on considère qu’un médicament est couvert sans restriction si au moins une de ses versions fait partie des produits couverts sans restriction. Bien que la majorité des régimes définissent pareillement le statut de médicament couvert sans restriction, il existe des différences entre les définitions de la couverture restreinte et les critères cliniques qui entourent le paiement des médicaments. Le tableau B1 indique les catégories de statut de couverture sur la liste de chaque régime selon le groupement l’ICIS, ainsi que le statut de couverture correspondant (restreinte ou sans restriction) utilisé dans le cadre de la présente étude. Les médicaments d’exception au Québec étaient désignés comme ayant un statut de couverture restreinte; tous les autres médicaments sur la liste étaient sans restriction.
Tableau B1 Couverture restreinte ou sans restriction par régime public d’assurance-médicaments du SNIUMP
| Administration |
Statut de couverture sur la liste |
Statut d’admissibilité du SNIUMP |
Statut de couverture utilisé pour l’étude |
| Colombie-Britannique |
Full Benefit |
R (remboursé)* |
Sans restriction |
| Special Authority |
L (limitée) * |
Restreinte |
| Special Authority |
R (restreinte)* |
Restreinte |
| Alberta |
Regular Benefit |
R (remboursé)* |
Sans restriction |
| Restricted Benefit |
L (limitée) * |
Restreinte |
| Optional Special Authorization |
L (limitée) * |
Restreinte |
| Special Authorization |
R (restreinte)* |
Restreinte |
| Saskatchewan |
Full Formulary Benefit |
R (remboursé)* |
Sans restriction |
| EDS (Exception Drug Status) |
R (restreinte)* |
Restreinte |
| Manitoba |
Part 1 (Open - benefits under all prescribed circumstances) |
R (remboursé)* |
Sans restriction |
| Part 2 (Open - prescribed for the terms and conditions indicated in the Formulary) |
L (limitée) * |
Restreinte |
| Part 3 (Exception Drug Status) |
R (restreinte) |
Restreinte |
| Ontario |
Remboursé |
R (remboursé)* |
Sans restriction |
| MUL (médicament à usage limité) |
L (limitée) |
Restreinte |
| PAE (Programme d’accès exceptionnel) |
R (restreinte) |
Restreinte |
| Nouveau-Brunswick |
Couverture complète |
R (remboursé)* |
Sans restriction |
| AS (Autorisation spéciale) |
L (limitée) * |
Restreinte |
| AS (Autorisation spéciale) |
R (restreinte) |
Restreinte |
| Nouvelle-Écosse |
S (Seniors' Pharmacare)
F (Community Services, Under 65 LTC, Family Pharmacare)
C (Drug Assistance for Cancer Patients)
D (Diabetes Assistance Program) |
R (remboursé) |
Sans restriction |
|
Île-du-Prince-Édouard
|
Le nom de marque de produit ne se termine pas par « (SA) » |
R (remboursé)* |
Sans restriction |
| Le titre du texte dans la liste en format PDF précise que les critères d’autorisation spéciale s’appliquent; la marque de produit se termine par « (SA) » |
R (restreinte) |
Restreinte |
| Terre-Neuve et Labrador |
OPEN |
R (remboursé)* |
Sans restriction |
| SPEC AUTH |
R (restreinte) |
Restreinte |
| SSNA |
Médicaments couverts sans restriction |
R (remboursé)* |
Sans restriction |
| Médicament à usage limité (approbation préalable nécessaire) |
R (restreinte) |
Restreinte |
| Médicament à usage limité (approbation préalable non nécessaire) |
L (limitée) |
Restreinte |
* Le statut de couverture déclaré dans le SNIUMP est tel qu’il a été soumis par l’administration visée.
Source des données : Système national d’information sur l’utilisation des médicaments prescrits, Institut canadien d’information sur la santé.
Annexe C : Taux d’inscription pondérés selon les ventes nationales
Les taux d’inscription sur la liste des médicaments qui sont indiqués dans le rapport sont pondérés en fonction des coûts totaux en médicaments assumés par les régimes publics du SNIUMP, lesquels n’incluent pas de données pour le Québec. En outre, ces taux peuvent être influencés par les coûts des médicaments dans les régimes de plus grande envergure, ou encore par le nombre de régimes qui remboursent un médicament particulier. Ainsi, les médicaments qui ne sont généralement pas remboursés, ou qui sont remboursés par les petits régimes, peuvent avoir un poids inférieur dans les résultats globaux.
Afin d’évaluer l’incidence de ces limites sur les résultats, la figure C1 montre les résultats correspondant aux taux d’inscription de la figure 1.1 pondérés en fonction des coûts au moyen des données sur les ventes nationales, y compris les régimes publics et privés et les dépenses directes des particuliers. Bien que les taux d’inscription pondérés en fonction des ventes soient légèrement plus bas, avec une moyenne de 91 % contre 95 %, les résultats sont comparables et ne modifient pas les constatations globales de l’étude.
Figure C1 Taux d’inscription pondérés en fonction des ventes nationales, médicaments choisis*, 2015
Cliquer sur l'image pour l'agrandir
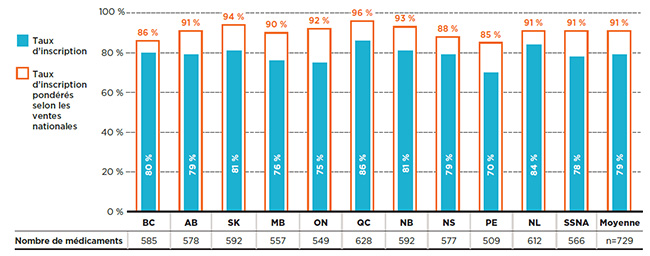
Description de la figure
Ce graphique à barres présente les taux d’inscription non pondérés et les taux d’inscription pondérés selon les coûts pour chaque régime public analysé selon les ventes à l’échelle nationale. Le tableau qui l’accompagne donne le nombre absolu de médicaments inscrits sur chaque liste.
Au total, les 729 médicaments sélectionnés pour l’étude représentaient 6 555 millions de dollars en coûts de médicaments pour les régimes publics d’assurance-médicaments du SNIUMP en 2015.
blank
| Régime public d’assurance-médicaments |
Taux d’inscription |
Taux d’inscription pondéré selon les ventes nationales |
Nombre de médicaments |
| Colombie-Britannique |
80 % |
86 % |
585 |
| Alberta |
79 % |
91 % |
578 |
| Saskatchewan |
81 % |
94 % |
592 |
| Manitoba |
76 % |
90 % |
557 |
| Ontario |
75 % |
92 % |
549 |
| Québec |
86 % |
96 % |
628 |
| Nouveau-Brunswick |
81 % |
93 % |
592 |
| Nouvelle-Écosse |
79 % |
88 % |
577 |
| Île-du-Prince-Édouard |
70 % |
85 % |
509 |
| Terre-Neuve-et-Labrador |
84 % |
91 % |
612 |
| Services de santé non assurés |
78 % |
91 % |
566 |
| Moyenne |
79 % |
91 % |
Sans objet |
Remarque : Les taux d’inscription reposaient sur le nombre total de médicaments (729) sélectionnés pour l’étude.
* Médicaments inscrits à au moins une liste de médicaments d’un régime public, sous réserve des critères d’exclusion.
Sources des données : Système national d’information sur l’utilisation des médicaments prescrits, Institut canadien d’information sur la santé; Liste des médicaments, Régie de l’assurance maladie du Québec, 20 novembre 2015.
Annexe D : Liste des médicaments essentiels
Selon la définition de l’Organisation mondiale de la Santé (OMS), les médicaments essentiels sont ceux qui répondent aux besoins de santé prioritaires d’une population. Ces médicaments devraient être disponibles en permanence dans le cadre de systèmes de santé opérationnels, en quantité suffisante, sous la forme galénique qui convient, avec une qualité assurée et à un prix abordable au niveau individuel comme à celui de la communauté.
Le présent rapport a pris en considération 125 médicaments provenant de la liste des médicaments essentiels pour les soins primaires au Canada du projet CLEAN Meds en 2016. La liste du projet CLEAN Meds s’inspire de la liste des médicaments essentiels publiée par l’OMS et a été adaptée au contexte des soins primaires au Canada par l’entremise d’un examen par les pairs effectué par des cliniciens, en tenant compte des habitudes de prescription au Canada. Les médicaments ayant servi à cette analyse sont indiqués dans le tableau D1, de même que les dépenses en médicaments correspondantes au sein des régimes publics du SNIUMP et les ventes nationales.
Tableau D1 Liste des médicaments essentiels, coûts pour les régimes publics d’assurance-médicaments et ventes nationales au Canada, 2015
| Médicament |
Coûts des médicaments pour les régimes publics d’assurance-médicaments du SNIUMP* |
Ventes nationales† |
| Abacavir |
1,0 M$ |
68,9 M$ |
| Acétaminophène (paracétamol) |
5,2 M$ |
356,9 M$ |
| Acide acétylsalicylique |
1,1 M$ |
77,7 M$ |
| Acide alendronique |
9,2 M$ |
34,0 M$ |
| Acide folique |
0,5 M$ |
64,5 M$ |
| Acide fusidique |
9,6 M$ |
29,6 M$ |
| Acide tranexamique |
0,6 M$ |
4,1 M$ |
| Acide valproïque |
12,5 M$ |
S.O. |
| Adalimumab |
219,4 M$ |
560,8 M$ |
| Adrénaline |
15,7 M$ |
82,4 M$ |
| Allopurinol |
9,9 M$ |
17,3 M$ |
| Amiodarone |
4,5 M$ |
7,4 M$ |
| Amlodipine |
63,3 M$ |
154,2 M$ |
| Amoxicilline |
17,9 M$ |
76,7 M$ |
| Amoxicilline et inhibiteur d’enzyme |
6,8 M$ |
18,9 M$ |
| Analgésique/anti-inflammatoire |
18,0 M$ |
40,7 M$ |
| Anneau vaginal avec estrogènes et progestérone |
0,6 M$ |
13,1 M$ |
| Atomoxétine |
1,9 M$ |
31,3 M$ |
| Atorvastatine |
121,3 M$ |
285,4 M$ |
| Azathioprine |
4,0 M$ |
9,6 M$ |
| Azithromycine |
7,7 M$ |
21,9 M$ |
| Baclofène |
8,0 M$ |
13,0 M$ |
| Béclométhasone |
2,3 M$ |
9,6 M$ |
| Benzatropine |
0,4 M$ |
0,7 M$ |
| Bêtaméthasone |
9,8 M$ |
54,7 M$ |
| Bisoprolol |
9,3 M$ |
18,2 M$ |
| Bromure d’ipratropium |
13,6 M$ |
34,1 M$ |
| Budésonide |
13,3 M$ |
228,0 M$ |
| Calcitriol |
6,2 M$ |
11,2 M$ |
| Candésartan |
15,5 M$ |
48,8 M$ |
| Carbamazépine |
6,6 M$ |
14,4 M$ |
| Céfalexine |
14,8 M$ |
29,0 M$ |
| Cétirizine |
2,6 M$ |
66,5 M$ |
| Chlortalidone |
0,5 M$ |
2,9 M$ |
| Chlorure de potassium |
4,0 M$ |
55,2 M$ |
| Ciprofloxacine |
9,4 M$ |
43,3 M$ |
| Clindamycine |
5,1 M$ |
39,9 M$ |
| Clopidogrel |
30,6 M$ |
67,1 M$ |
| Clotrimazole |
2,2 M$ |
38,8 M$ |
| Cloxacilline |
1,4 M$ |
3,8 M$ |
| Clozapine |
20,9 M$ |
55,1 M$ |
| Cyanocobalamine |
1,3 M$ |
80,7 M$ |
| Dabigatran étexilate |
42,9 M$ |
81,7 M$ |
| Dexaméthasone |
3,2 M$ |
31,5 M$ |
| Diltiazem |
43,8 M$ |
78,3 M$ |
| Disoproxil de ténofovir |
33,9 M$ |
252,1 M$ |
| DIU de plastique avec progestatif |
13,9 M$ |
65,2 M$ |
| Dolutégravir |
4,3 M$ |
40,6 M$ |
| Dompéridone |
4,0 M$ |
7,5 M$ |
| Donézépil |
23,8 M$ |
35,5 M$ |
| Doxycyclin |
3,9 M$ |
20,0 M$ |
| Éfavirenz |
1,0 M$ |
56,7 M$ |
| Élétriptan |
<0,1 M$ |
16,5 M$ |
| Emtricitabine, disoproxil de ténofovir et éfavirenz |
26,1 M$ |
53,9 M$ |
| Estradiol |
19,1 M$ |
91,5 M$ |
| Estrogènes conjugués |
7,9 M$ |
18,5 M$ |
| Finastéride |
8,0 M$ |
25,4 M$ |
| Fluconazole |
3,2 M$ |
23,7 M$ |
| Fluoxétine |
16,8 M$ |
43,9 M$ |
| Fluticasone |
58,9 M$ |
452,2 M$ |
| Fumarate ferreux |
6,1 M$ |
54,1 M$ |
| Furosémide |
10,0 M$ |
15,4 M$ |
| Gabapentine |
43,7 M$ |
68,8 M$ |
| Gliclazide |
19,4 M$ |
37,3 M$ |
| Glycosides de séné |
3,7 M$ |
13,5 M$ |
| Halopéridol |
2,8 M$ |
3,4 M$ |
| Hydrocortisone |
10,0 M$ |
59,7 M$ |
| Hydroxychloroquine |
7,3 M$ |
17,4 M$ |
| Ibuprofène |
3,3 M$ |
149,9 M$ |
| Insuline, action prolongée‡ |
154,7 M$ |
301,1 M$ |
| Insuline, autres‡ |
136,8 M$ |
310,5 M$ |
| Labétalol |
4,6 M$ |
9,1 M$ |
| Lamivudine |
3,0 M$ |
74,5 M$ |
| Latanoprost |
7,4 M$ |
25,8 M$ |
| Lévodopa et inhibiteur de la décarboxylase |
28,3 M$ |
54,2 M$ |
| Lévofloxacine |
2,5 M$ |
7,0 M$ |
| Lévonorgestrel et estrogène |
11,2 M$ |
151,1 M$ |
| Lévothyroxine sodique |
25,2 M$ |
59,3 M$ |
| Lithium |
1,2 M$ |
3,7 M$ |
| Lopéramide |
1,0 M$ |
21,6 M$ |
| Médroxyprogestérone |
4,3 M$ |
11,4 M$ |
| Metformine |
35,2 M$ |
272,5 M$ |
| Méthimazole |
1,0 M$ |
3,3 M$ |
| Méthotrexate |
13,1 M$ |
30,8 M$ |
| Méthylprednisolone |
2,1 M$ |
6,0 M$ |
| Métoclopramide |
1,6 M$ |
2,4 M$ |
| Métronidazole |
5,9 M$ |
21,7 M$ |
| Mupirocine |
1,8 M$ |
6,0 M$ |
| Naltrexone |
1,1 M$ |
6,8 M$ |
| Naproxène |
10,6 M$ |
79,8 M$ |
| Nicotine |
7,8 M$ |
88,7 M$ |
| Nitrofurantoïne |
7,9 M$ |
15,3 M$ |
| N-Nitrosodiphénylamine |
15,8 M$ |
24,2 M$ |
| Nortriptyline |
7,2 M$ |
12,9 M$ |
| Nystatine |
1,8 M$ |
8,2 M$ |
| Olopatadine |
0,4 M$ |
17,9 M$ |
| Pantoprazole |
122,5 M$ |
269,1 M$ |
| Perméthrine |
1,6 M$ |
6,7 M$ |
| Peroxyde de benzoyle |
0,3 M$ |
61,9 M$ |
| Phénytoïne |
3,7 M$ |
6,0 M$ |
| Pilocarpine |
0,6 M$ |
3,5 M$ |
| Polyéthylène glycol 3350 |
0,5 M$ |
49,9 M$ |
| Pravastatine |
11,4 M$ |
23,8 M$ |
| Prednisone |
3,5 M$ |
6,2 M$ |
| Préparations d’acide salicylique |
<0,1 M$ |
48,3 M$ |
| Propylthiouracile |
0,4 M$ |
0,9 M$ |
| Ramipril |
44,2 M$ |
82,2 M$ |
| Rispéridone |
46,1 M$ |
72,1 M$ |
| Rivaroxaban |
68,7 M$ |
141,6 M$ |
| Salbutamol |
23,2 M$ |
54,4 M$ |
| Salmétérol |
2,3 M$ |
321,7 M$ |
| Sertraline |
21,6 M$ |
52,3 M$ |
| Spironolactone |
4,6 M$ |
8,1 M$ |
| Sulfaméthoxazole et triméthoprime |
1,6 M$ |
4,4 M$ |
| Sulfasalazine |
5,1 M$ |
10,0 M$ |
| Tadalafil |
3,7 M$ |
125,2 M$ |
| Tamsulosine |
14,1 M$ |
26,6 M$ |
| Thiamine (vitamine B1) |
0,1 M$ |
42,7 M$ |
| Tiotropium |
99,5 M$ |
183,1 M$ |
| Trétinoïne |
0,9 M$ |
9,1 M$ |
| Triméthoprime |
0,2 M$ |
4,4 M$ |
| Urée |
2,2 M$ |
35,1 M$ |
| Valaciclovir |
35,5 M$ |
129,1 M$ |
| Varénicline |
13,0 M$ |
35,8 M$ |
| Warfarine |
11,9 M$ |
18,0 M$ |
| Total |
2 166,2 M$§ |
8 102,5 M$ |
Remarque : La sélection des médicaments repose sur la liste des médicaments essentiels pour les soins de santé primaires au Canada du projet CLEAN Meds en 2016 (http://cleanmeds.ca). Certains des médicaments figurant sur cette liste ne font pas partie de la liste des médicaments analysés à la section 1 et 2.
* Coûts totaux des médicaments pour les régimes publics de toutes les provinces (sauf le Québec) ainsi que le Programme des SSNA.
† Ventes nationales au Canada pour tous les payeurs (publics, privés et particuliers).
‡ Les insulines à action prolongée comprennent l’insuline glargine et l’insuline détemir, c’est-à-dire celles qui couvrent les besoins en insuline pendant environ un jour complet. Toutes les autres insulines sont regroupées sous insuline, autres.
§ Ce total comprend les coûts de médicaments qui ne figurent peut-être pas dans certaines listes de régimes publics.
Sources de données : Base de données du Système national d’information sur l’utilisation des médicaments prescrits, Institut canadien d’information sur la santé pour les coûts des régimes publics d’assurance-médicaments; QuintilesIMS MIDASMC, 2015 (tous droits réservés) pour les ventes nationales. Faute de données, certains médicaments peuvent être sous-déclarés dans les deux ensembles de données.