Économies potentielles associées aux biosimilaires au Canada*
PDF - 440 ko
Les médicaments biologiques, qui représentent un des segments de marché ayant la plus forte croissance au Canada, font aujourd’hui face à la concurrence de nouveaux produits biosimilaires. À l’inverse des médicaments génériques, les biosimilaires ne sont pas identiques à leurs produits médicamenteux de référence; ils constituent plutôt des versions ultérieures de produits biologiques novateurs du Canada qui ont été approuvés et dont la similarité avec un médicament biologique de référence a été établie. Néanmoins, la pénétration du marché par les biosimilaires laisse présager d’importantes économies.
Cette analyse explore les économies que pourraient générer les biosimilaires d’un certain nombre de médicaments biologiques qui ont récemment perdu leur exclusivité sur le marché ou qui devraient la perdre au cours des prochaines années. Les estimations des économies potentielles sont fondées sur divers scénarios de pénétration du marché, d’utilisation et de remises, sur la base des observations faites sur les marchés canadiens (pour les produits biosimilaires existants) et étrangers.
L’offre, l’utilisation et le prix des biosimilaires à l’échelle internationale ont été déterminés d’après les données de la base de données MIDASMC d’IMS pour les pays membres de l’Organisation de coopération et de développement économiques (OCDE).
Résultats clés
1. La liste des produits biologiques sélectionnés comprend un certain nombre de médicaments importants
L’analyse porte sur 13 produits biologiques pour lesquels des produits biosimilaires ont été lancés ou devraient l’être dans les trois prochaines années. Les estimations des économies potentielles sont établies pour chacun de ces médicaments pour la troisième année suivant leur lancement.
Les médicaments sont classés d’après le type de traitement, soit aigu ou chronique. Les scénarios analytiques diffèrent pour chaque catégorie.
Médicaments ciblés - biosimilaires attendus sur le marché canadien
| Médicament (nom commercial) |
Offre de biosimilaires sur le marché |
| OCDE |
Canada |
| Année |
Nbre de pays |
AC |
Période prévue |
| Époétine alfa (Eprex)* |
2007 |
20 |
|
2019‒2021 |
| Filgrastim (Neupogen)* |
2008 |
26 |
2015 |
2017‒2019 |
| Infliximab (Remicade)† |
2012 |
24 |
2014 |
2016‒2018 |
| Follitropine alfa (Gonal-f)* |
2014 |
18 |
|
2020‒2022 |
| Insuline glargine (Lantus)† |
2015 |
20 |
2015 |
2017‒2019 |
| Étanercept (Enbrel)† |
2016 |
12 |
2016 |
2018‒2020 |
| Adalimumab (Humira)† |
|
|
|
2019‒2021 |
| Bévacizumab (Avastin)† |
|
|
|
2020‒2022 |
| Natalizumab (Tysabri)† |
|
|
|
2020‒2022 |
| Omalizumab (Xolair)† |
|
|
|
2019‒2021 |
| Ranibizumab (Lucentis)† |
|
|
|
2019‒2021 |
| Rituximab (Rituxan)† |
|
|
|
2019‒2021 |
| Trastuzumab (Herceptin)† |
|
|
|
2019‒2021 |
*Aigu; †Chronique
2. Les médicaments biologiques choisis affichent des ventes accrues et occupent une part relativement importante du marché canadien
Le marché des produits biologiques choisis a connu une évolution rapide au cours des dernières années. En effet, les ventes de ces produits au Canada sont passées de 0,8 milliard de dollars en 2006 à 3,6 milliards de dollars en 2016, ce qui représente 15,9 % des ventes de produits pharmaceutiques au Canada. La part de marché qu’occupent ces produits est plus grande au Canada que dans d’autres pays, comme les États-Unis (12,6 %), les autres pays du Conseil d’examen des prix des médicaments brevetés (CEPMB7) (10,9 %) ou d’autres pays de l’OCDE (6,9 %). Le marché canadien est également très concentré : en 2016, les cinq meilleurs vendeurs, soit l’infliximab, l’adalimumab, le ranibizumab, l’étanercept et l’insuline glargine, représentaient 11,4 % des ventes de produits pharmaceutiques au Canada.
Part des médicaments choisis dans l’ensemble du marché des produits pharmaceutiques au Canada et dans les pays de l’OCDE
Cliquer sur l'image pour l'agrandir
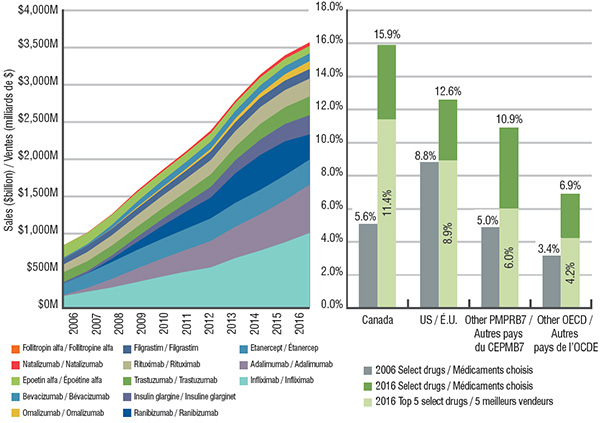
Description de la figure
Cette figure comprend deux graphiques. Le premier est un graphique à aires empilées montrant les ventes annuelles cumulatives de chacun des produits biologiques choisis entre 2006 et 2016. Les chiffres représentent des millions de dollars.
blank
| Médicament |
2006 |
2007 |
2008 |
2009 |
2010 |
2011 |
2012 |
2013 |
2014 |
2015 |
2016 |
| Infliximab |
160 M $ |
219 M $ |
277 M $ |
348 M $ |
421 M $ |
489 M $ |
545 M $ |
672 M $ |
771 M $ |
883 M $ |
1 008 M $ |
| Adalimumab |
11 M $ |
50 M $ |
115 M $ |
182 M $ |
239 M $ |
292 M $ |
355 M $ |
420 M $ |
487 M $ |
563 M $ |
649 M $ |
| Étanercept |
154 M $ |
196 M $ |
227 M $ |
248 M $ |
265 M $ |
284 M $ |
305 M $ |
322 M $ |
330 M $ |
337 M $ |
337 M $ |
| Ranibizumab |
0 M $ |
2 M $ |
45 M $ |
105 M $ |
172 M $ |
231 M $ |
279 M $ |
398 M $ |
467 M $ |
456 M $ |
337 M $ |
| Insuline glargine |
18 M $ |
30 M $ |
44 M $ |
68 M $ |
89 M $ |
113 M $ |
143 M $ |
175 M $ |
206 M $ |
232 M $ |
259 M $ |
| Trastuzumab |
133 M $ |
132 M $ |
132 M $ |
136 M $ |
143 M $ |
150 M $ |
168 M $ |
181 M $ |
210 M $ |
225 M $ |
251 M $ |
| Rituximab |
103 M $ |
124 M $ |
140 M $ |
157 M $ |
170 M $ |
180 M $ |
193 M $ |
211 M $ |
227 M $ |
230 M $ |
241 M $ |
| Filgrastim |
76 M $ |
85 M $ |
88 M $ |
90 M $ |
94 M $ |
106 M $ |
116 M $ |
119 M $ |
126 M $ |
128 M $ |
128 M $ |
| Omalizumab |
0 M $ |
0 M $ |
5 M $ |
17 M $ |
20 M $ |
25 M $ |
35 M $ |
48 M $ |
59 M $ |
85 M $ |
106 M $ |
| Bévacizumab |
16 M $ |
20 M $ |
46 M $ |
73 M $ |
90 M $ |
94 M $ |
97 M $ |
104 M $ |
105 M $ |
107 M $ |
104 M $ |
| Époétine alfa |
167 M $ |
151 M $ |
135 M $ |
126 M $ |
116 M $ |
114 M $ |
113 M $ |
107 M $ |
107 M $ |
101 M $ |
99 M $ |
| Natalizumab |
0 M $ |
5 M $ |
9 M $ |
22 M $ |
25 M $ |
27 M $ |
36 M $ |
32 M $ |
40 M $ |
46 M $ |
50 M $ |
| Follitropine alfa |
4 M $ |
6 M $ |
6 M $ |
7 M $ |
8 M $ |
14 M $ |
18 M $ |
18 M $ |
18 M $ |
21 M $ |
14 M $ |
| Totale |
844 M $ |
1 021 M $ |
1 269 M $ |
1 578 M $ |
1 852 M $ |
2 119 M $ |
2 404 M $ |
2 808 M $ |
3 152 M $ |
3 412 M $ |
3 583 M $ |
Le graphique à barres décrit quant à lui la part des ventes des produits biologiques choisis en 2006 et en 2016 en pourcentage du marché total des produits pharmaceutiques.
blank
| Pays |
Tous les médicaments biologiques choisis en 2006 |
Tous les médicaments biologiques choisis en 2016 |
Les cinq meilleurs vendeurs en 2016 |
| Canada |
5,6 % |
15,9 % |
11,4 % |
| États-Unis |
8,8 % |
12,6 % |
8,9 % |
| Autres pays du CEPMB7 |
5,0 % |
10,9 % |
6,0 % |
| Autres pays de l’OCDE |
3,4 % |
6,9 % |
4,2 % |
3. L’utilisation des biosimilaires varie d’un pays à l’autre et dépend du type de traitement
Pour chaque type de traitement (aigu et chronique), on a tenu compte de deux scénarios d’utilisation (élevée et moyenne) selon l’utilisation observée dans les pays de l’OCDE, comme le montre le tableau.
Utilisation de produits biosimilaires par type de traitement dans les marchés de l’OCDE
Cliquer sur l'image pour l'agrandir
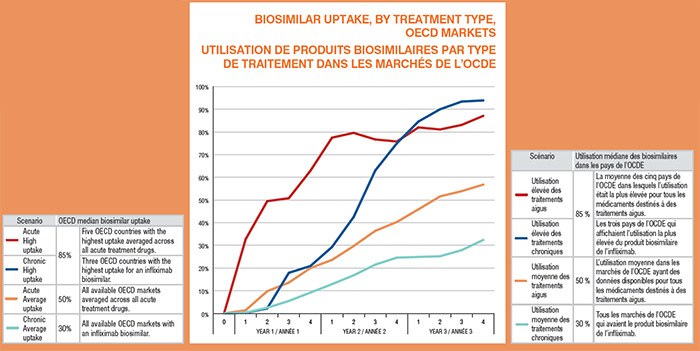
Description de la figure
Ce graphique linéaire décrit deux scénarios relativement à l’utilisation des biosimilaires dans les pays de l’OCDE : moyenne et élevée. Chaque scénario d’utilisation est à son tour subdivisé en type de traitement : aigu et chronique, tel que décrit ci-dessous.
blanc
| Scénario |
Utilisation médiane des biosimilaires dans les pays de l’OCDE |
| Utilisation élevée des traitements aigus |
85 % |
La moyenne des cinq pays de l’OCDE dans lesquels l’utilisation était la plus élevée pour tous les médicaments destinés à des traitements aigus. |
| Utilisation élevée des traitements chroniques |
85 % |
Les trois pays de l’OCDE qui affichaient l’utilisation la plus élevée du produit biosimilaire de l’infliximab. |
| Utilisation moyenne des traitements aigus |
50 % |
L’utilisation moyenne dans les marchés de l’OCDE ayant des données disponibles pour tous les médicaments destinés à des traitements aigus. |
| Utilisation moyenne des traitements chroniques |
30 % |
Tous les marchés de l’OCDE qui avaient le produit biosimilaire de l’infliximab. |
Les chiffres représentent une utilisation estimée sur 3 ans ou 12 trimestres.
blanc
| Trimestre annuel |
Traitement chronique, utilisation moyenne |
Traitement chronique, utilisation élevée |
Traitement aigu, utilisation moyenne |
Traitement aigu, utilisation élevée |
| Année 0 |
0 |
0 |
0 |
0 |
| Année 1, 1er trimestre |
0,4 % |
0,3 % |
1,4 % |
32,7 % |
| Année 1, 2e trimestre |
2,5 % |
2,2 % |
9,8 % |
49,5 % |
| Année 1, 3e trimestre |
5,5 % |
17,9 % |
13,6 % |
50,8 % |
| Année 1, 4e trimestre |
9,2 % |
20,9 % |
20,0 % |
62,9 % |
| Année 2, 1er trimestre |
12,9 % |
29,3 % |
23,6 % |
77,5 % |
| Année 2, 2e trimestre |
16,8 % |
42,5 % |
29,7 % |
79,6 % |
| Année 2, 3e trimestre |
21,5 % |
63,0 % |
36,4 % |
76,7 % |
| Année 2, 4e trimestre |
24,6 % |
75,0 % |
40,3 % |
75,8 % |
| Année 3, 1er trimestre |
24,9 % |
84,6 % |
45,9 % |
82,0 % |
| Année 3, 2e trimestre |
25,2 % |
90,0 % |
51,6 % |
81,1 % |
| Année 3, 3e trimestre |
27,9 % |
93,4 % |
53,9 % |
83,1 % |
| Année 3, 4e trimestre |
32,4 % |
93,9 % |
56,8 % |
87,1 % |
4. Les prix des biosimilaires sur les marchés de l’OCDE sont généralement inférieurs aux prix au Canada
Un examen des prix connus des produits biosimilaires sur les marchés de l’OCDE donne à entendre que les rabais médians par rapport aux médicaments biologiques de référence sont relativement modestes; ils varient de 13 % à 34 %. Cependant, les prix des produits biologiques de référence sont nettement plus élevés au Canada que dans la plupart des pays de l’OCDE. Pour harmoniser les prix des biosimilaires canadiens avec ceux de l’OCDE, les rabais devraient se situer entre 39 % et 61 %. L’expérience limitée avec les biosimilaires en vente au Canada laisse croire que la réduction de prix réelle est sensiblement inférieure dans certains cas, soit entre 12 % et 23 %. Remicade est le seul médicament au Canada dont le produit biosimilaire au Canada est réduit de près de la moitié (47 %), ce qui correspond aux prix à l’échelle internationale.
Deux hypothèses concernant les rabais offerts pour les biosimilaires ont été prises en compte pour les traitements aigus et chroniques : un rabais supérieur de 50 % et un rabais inférieur de 25 %.
Prix des produits biosimilaires au Canada et dans les pays de l’OCDE
| |
OCDE |
Canada |
Rabais médian dans les pays de l’OCDE
par rapport au prix du médicament de référence canadien |
| Médicament (concentration) |
Prix courant médian |
Rabais médian |
Prix courant |
Prix réduit canadien |
| Aigu |
Époétine alfa,
10 k/ml |
84 $ |
34 % |
‒ |
‒ |
60 % |
Filgrastim,
300 Y/ml |
71 $ |
30 % |
143 $ |
21 % |
61 % |
Follitropine alfa,
600 IU/ml |
228 $ |
13 % |
‒ |
‒ |
59 % |
| Chronique |
Infliximab,
100 mg |
521 $ |
24 % |
525 $ |
47 % |
47 % |
Insuline glargine,
100 IU/ml |
3,78 $ |
16 % |
5,39 $ |
12 % |
39 % |
Étanercept,
50 mg/ml |
‒ |
‒ |
305 $* |
23 % |
‒ |
* Selon la valeur déclarée dans les recommandations finales du Comité canadien d’expertise sur les médicaments à l’intention de l’ACMTS.
5. Une fourchette supérieure et inférieure du taux d’utilisation des biosimilaires et des rabais a été prise en considération pour estimer les économies potentielles
En ce qui concerne les produits biologiques destinés à un traitement aigu, la fourchette supérieure suppose un taux d’utilisation élevé combiné à un rabais important : 85 % et 50 %, respectivement. La fourchette inférieure présume un taux d’utilisation moyen combiné à un faible rabais : 50 % et 25 %, respectivement.
Dans le même ordre d’idées, en ce qui a trait aux produits biologiques destinés à un traitement chronique, la fourchette supérieure suppose un taux d’utilisation élevé combiné à un rabais important : 85 % et 50 %, respectivement; tandis que la fourchette inférieure présume un taux d’utilisation moyen combiné à un faible rabais : 30 % et 25 %, respectivement.
Hypothèses sur le taux d’utilisation des produits biosimilaires et les rabais selon différents scénarios
Cliquer sur l'image pour l'agrandir
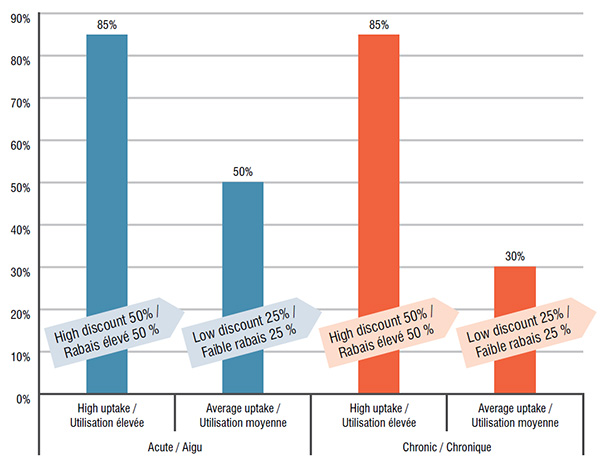
Description de la figure
Ce graphique à barres décrit les hypothèses sur le taux d’utilisation des biosimilaires qui ont été utilisées dans l’analyse : pour chaque type de traitement, aigu ou chronique, un scénario d’utilisation élevée et de rabais important et un scénario d’utilisation moyenne et de faible rabais sont illustrés. Les taux d’utilisation sont donnés en pourcentage de la part de marché, et les rabais sont donnés en pourcentage du prix du produit de référence.
blank
| |
Traitement aigu, utilisation élevée |
Traitement aigu, utilisation moyenne |
Traitement chronique, utilisation élevée |
Traitement chronique, utilisation moyenne |
| Utilisation |
85 % |
50 % |
85 % |
30 % |
| Rabais |
50 % |
25 % |
50 % |
25 % |
6. Les économies potentielles engendrées par les produits qui concurrencent les biosimilaires varient largement en fonction de la taille du marché, du calendrier de disponibilité des biosimilaires, du taux d’utilisation et du rabais
Des économies potentielles variées ont été estimées en s’appuyant sur le marché anticipé pour chaque médicament au cours de la troisième année suivant le lancement ainsi que pour les scénarios avec la fourchette supérieure et inférieure. Les prévisions font appel à des données historiques qui s’étendent jusqu’à cinq ans ainsi qu’à des projets qui remontent jusqu’à trois ans au-delà de la date de lancement prévue des produits biosimilaires afin de pouvoir faire des projections sur la pénétration du marché. Les économies estimées sont exprimées en dollars absolus pour la troisième année.
Les économies potentielles varient du seuil de 8 %, pour les médicaments destinés à un traitement chronique dans le scénario d’utilisation moyenne et de faible rabais, jusqu’au sommet de 43 %, pour les médicaments destinés à un traitement aigu ou chronique dans le scénario d’utilisation élevée et de rabais important. Les économies potentielles dépendent de la taille du marché du produit biologique de référence. Le calendrier de disponibilité des biosimilaires déterminera le moment où les économies potentielles pourront être réalisées.
Économies potentielles estimées la troisième année suivant l’arrivée des produits biosimilaires, Canada
| Médicament |
Ventes en 2016* |
Prévision |
Estimation basse |
Estimation élevée |
| Année 3 |
Ventes† |
|
|
| Traitement aigu |
Économies de 13 % |
Économies de 43 % |
| Filgrastim |
126 M $ |
2019 |
145 M $ |
18 M $ |
62 M $ |
| Époétine alfa |
99 M $ |
2021 |
75 M $ |
10 M $ |
32 M $ |
| Follitropine alfa |
14 M $ |
2022 |
20 M $ |
3 M $ |
8 M $ |
| Traitement chronique |
Économies de 8 % |
Économies de 43 % |
| Infliximab |
1004 M $ |
2018 |
1 210 M $ |
91 M $ |
514 M $ |
| Adalimumab |
649 M $ |
2021 |
974 M $ |
73 M $ |
414 M $ |
| Étanercept |
337 M $ |
2020 |
347 M $ |
26 M $ |
147 M $ |
| Ranibizumab |
337 M $ |
2021 |
337 M $ |
25 M $ |
143 M $ |
| Insuline glargine |
241 M $ |
2019 |
306 M $ |
23 M $ |
130 M $ |
| Rituximab |
241 M $ |
2021 |
286 M $ |
21 M $ |
122 M $ |
| Trastuzumab |
180 M $ |
2021 |
202 M $ |
15 M $ |
86 M $ |
| Bévacizumab |
104 M $ |
2022 |
110 M $ |
8 M $ |
47 M $ |
| Omalizumab |
106 M $ |
2021 |
184 M $ |
14 M $ |
78 M $ |
| Natalizumab |
50 M $ |
2022 |
62 M $ |
5 M $ |
27 M $ |
*Pour le produit de marque.
†En supposant qu’aucun biosimilaire n’est disponible.
Remarque : Les sept pays du CEPMB comprennent les sept pays de comparaison que le CEPMB prend en considération lorsqu’il examine les prix des médicaments brevetés : la France, l’Allemagne, l’Italie, la Suède, la Suisse, le Royaume-Uni et les États-Unis.
Limites : Les ventes canadiennes et internationales et les prix courants accessibles dans la base de données MIDASMC d’IMS sont les prix courants estimés des fabricants à la sortie de l’usine et ils ne tiennent pas compte des rabais et des remises déduites des factures, des accords de gestion de lancement ou des régimes d’accès des patients.
Source des données : Sauf indication contraire, les renseignements sur la disponibilité, l’utilisation et les prix contenus dans cette analyse ont été déterminés d’après la base de données MIDASMC d’IMS (Tous droits réservés).
Avis de non-responsabilité : Bien qu’ils soient fondés, en partie, sur des données obtenues sous licence qui proviennent de la base de données MIDASMC d’IMS AG, les déclarations, constatations, conclusions, points de vue et opinions exprimés dans ce rapport appartiennent exclusivement au CEPMB et ils ne peuvent pas être attribués à IMS AG.
Le SNIUMP est une initiative de recherche qui fonctionne indépendamment des activités de réglementation du CEPMB.
* Mise à jour selon les données de 2016.