L’observateur des nouveaux médicaments lancés sur le marché, 2009–2015
PDF - 373 ko
D’importants nouveaux médicaments ont été mis en marché au cours des dernières années, ce qui a alimenté la croissance des ventes de produits pharmaceutiques. L'Observateur des nouveaux médicaments lancés sur le marché (ONMLM), qui sera bientôt publié par le CEPMB, indique les dernières mises en marché des médicaments à l’étranger et fournit aux décideurs, à l’industrie et aux patients de précieux renseignements sur l’ouverture du marché et l’établissement des prix, ainsi que sur les préavis sur les médicaments qui seront bientôt mis en marché au Canada.
La première édition de cette publication annuelle dresse la liste de tous les nouveaux ingrédients actifs (NIA) qui ont été mis en marché entre 2009 et 2014 ainsi que des rapports sur les ventes connexes pendant le second trimestre de 2015 (T2-2015) au Canada et dans les sept pays de comparaison du CEPMB (CEPMB7 : France, Allemagne, Italie, Suède, Suisse, Royaume-Uni et États-Unis).
Résultats clés
1. Plus de 30 nouveaux ingrédients actifs ont été mis en marché chaque année de 2009 à 2014.
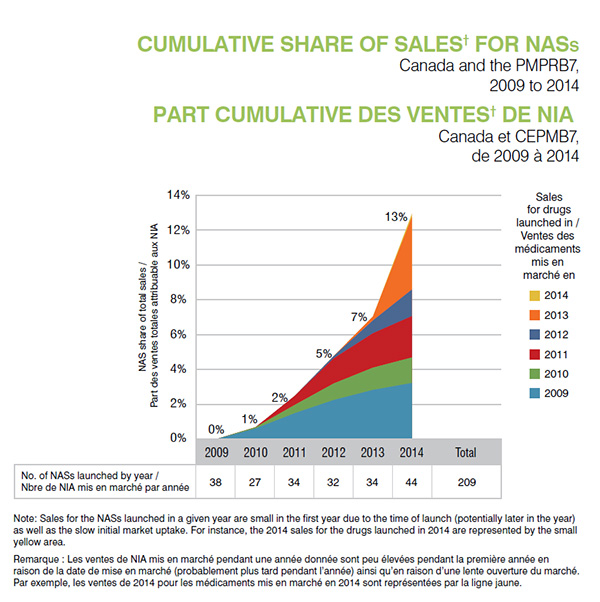
De 2009 à 2014, 209 NIA ont été mis en marché, avec des ventes s’élevant à 13 % du marché des produits pharmaceutiques au Canada et dans les CEPMB7 en 2014.
Section 1
Cliquer sur l'image pour l'agrandir
Description de la figure
Ce graphique à zones empilées illustre la part cumulative des ventes totales pour les nouveaux ingrédients actifs lancés pour chaque année de 2009 à 2014.
Part cumulative des ventes par année
| Année de mise en marché médicament |
2009 |
2010 |
2011 |
2012 |
2013 |
2014 |
| 2009 |
0,11 % |
0,59 % |
1,44 % |
2,18 % |
2,74 % |
3,13 % |
| 2010 |
|
0,07 % |
0,46 % |
0,92 % |
1,24 % |
1,42 % |
| 2011 |
|
|
0,50 % |
1,40 % |
1,92 % |
2,31 % |
| 2012 |
|
|
|
0,13 % |
0,71 % |
1,48 % |
| 2013 |
|
|
|
|
0,22 % |
4,05 % |
Remarque : Les ventes de NIA mis en marché pendant une année donnée sont peu élevées pendant la première année en raison de la date de mise en marché (probablement plus tard pendant l’année) ainsi qu’en raison d’une lente ouverture du marché.
En tout, 209 nouveaux ingrédients actifs ont été mis en marché entre 2009 et 2014. Le tableau sous le graphique présente le nombre de nouveaux ingrédients actifs lancés par année : 2009, 38; 2010, 27; 2011, 34; 2012, 32; 2013, 34; 2014, 44.
2. Le Canada représente une part significative du marché international des nouveaux ingrédients actifs, particulièrement ce qui a trait à l’utilisation.
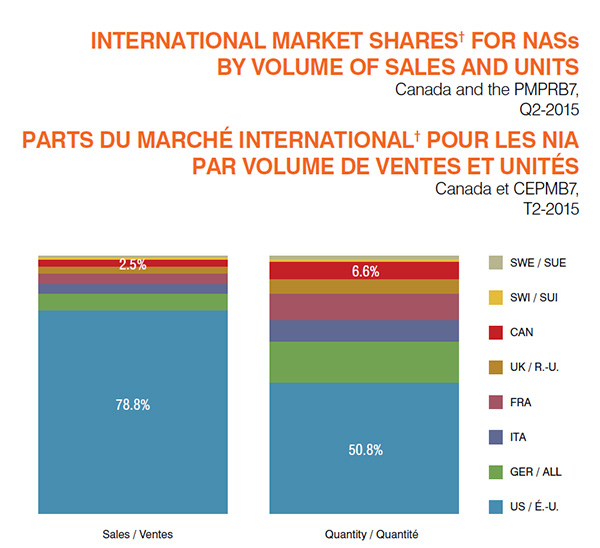
Bien que le Canada représente une part de 2,5 % des ventes internationales de NIA dans les pays analysés, il représente une part de 6,6 % du volume d’utilisation, puisque les prix américains élevés supplantent la part de marché relative aux ventes de tous les pays.
Section 2
Cliquer sur l'image pour l'agrandir
Description de la figure
Cette illustration contient deux graphiques à barres. La barre de gauche présente les parts du marché international pour le volume de ventes de nouveaux ingrédients actifs au deuxième trimestre de 2015, et la barre de droite présente les parts du marché international pour le volume d’unités.
Barre de gauche (ventes)
Suède : 0,7 %; Suisse : 1,0 %; Canada : 2,5 %; Royaume-Uni : 2,8 %; France : 3,9 %; Italie : 4,0 %; Allemagne : 6,4 %; États-Unis : 78,8 %.
Barre de droite (quantité)
Suède : 1,3 %; Suisse : 1,1 %; Canada : 6,6 %; Royaume-Uni : 5,7 %; France : 10,3 %; Italie : 8,4 %; Allemagne : 15,8 %; États-Unis : 50,8 %.
3. Les ventes de nouveaux ingrédients actifs sont fortement concentrées et un petit nombre de médicaments représente une large part des ventes de nouveaux médicaments à l’étranger.
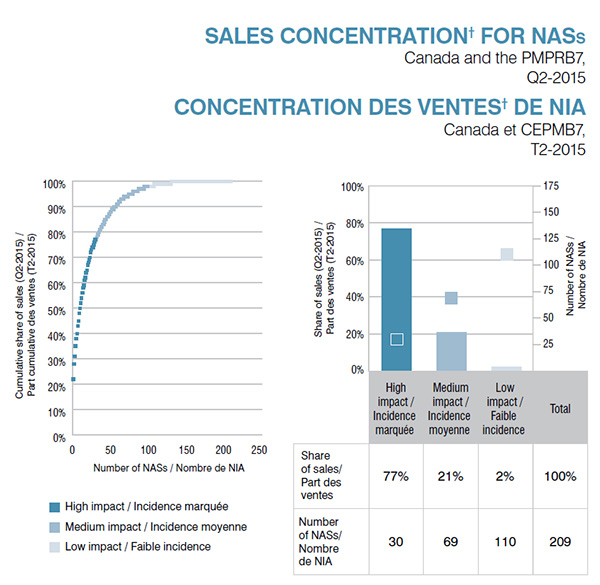
Les 30 principaux NIA (représentés par les points et la barre les plus foncés) sont des médicaments susceptibles d’avoir une incidence marquée, avec des ventes cumulatives annuelles s’élevant à 77 % de toutes les ventes de NIA. Inversement, plus de la moitié des NIA sont des médicaments susceptibles d’avoir une faible incidence, avec des ventes cumulatives de 2,1 % (points et barre les plus pâles).
Section 3
Cliquer sur l'image pour l'agrandir
Description de la figure
Cette illustration dépeint la concentration des ventes pour les nouveaux ingrédients actifs susceptibles d’avoir une incidence marquée, moyenne et faible au deuxième trimestre de 2015. Le graphique droit présente la part des ventes et le nombre d’ingrédients pour chacune des trois catégories, ce qui représente un total de 209 nouveaux ingrédients actifs.
Incidence marquée : part des ventes de 77 %; 30 nouveaux ingrédients actifs.
Incidence moyenne : part des ventes de 21 %; 69 nouveaux ingrédients actifs.
Faible incidence : part des ventes de 2,1 %; 110 nouveaux ingrédients actifs.
Le graphique droit illustre cette information sous forme de part cumulative des ventes selon le nouvel ingrédient actif.
4. Le Canada a mis en marché la plupart des nouveaux ingrédients actifs les plus vendus.
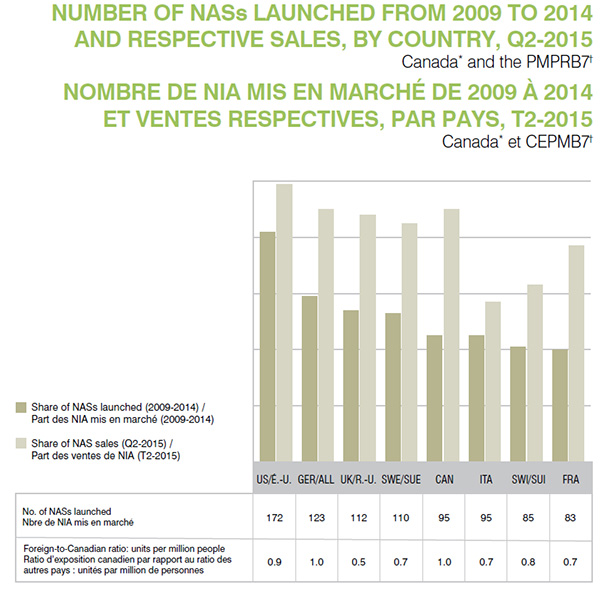
Le Canada a mis en marché près de la moitié (95 médicaments) des NIA disponibles au Canada et dans les CEPMB7. Ces médicaments représentent 90 % des ventes de NIA pendant le deuxième trimestre de 2015. Le Canada utilise également le plus de NIA relativement à la taille de sa population, puisque le ratio canadien de l’exposition aux médicaments par rapport au ratio des autres pays, exprimé en unités par million de personnes, est l’un des plus élevés.
Section 4
Cliquer sur l'image pour l'agrandir
Description de la figure
Cette illustration consiste en un graphique à barres et un tableau distinct.
Un ensemble de barres dans le graphique illustre la part de tous les nouveaux ingrédients actifs mis en marché au Canada et dans les sept pays de comparaison du CEPMB, de 2009 à 2014, par pays. Un deuxième ensemble de barres illustre les ventes respectives au deuxième trimestre de 2015. Le tableau connexe présente le nombre de nouveaux ingrédients actifs mis en marché entre 2009 et 2014, ainsi que le ratio d’exposition canadien par rapport au ratio des autres pays des unités utilisés par million de personnes.
| |
Part des nouveaux ingrédients actifs mis en marché de 2009 à 2014 |
Part des ventes des nouveaux ingrédients actifs pour le deuxième trimestre de 2015 |
Nombre de nouveaux ingrédients actifs mis en marché |
Ratio d’exposition canadien par rapport au ratio des autres pays : unités par million de personnes |
| États-Unis |
82 % |
99 % |
172 |
0,9 |
| Allemagne |
59 % |
90 % |
123 |
1,0 |
| Royaume-Uni |
54 % |
88 % |
112 |
0,5 |
| Suède |
53 % |
85 % |
110 |
0,7 |
| Canada |
45 % |
90 % |
95 |
1,0 |
| Italie |
45 % |
57 % |
95 |
0,7 |
| Suisse |
41 % |
63 % |
85 |
0,8 |
| France |
40 % |
77 % |
83 |
0,7 |
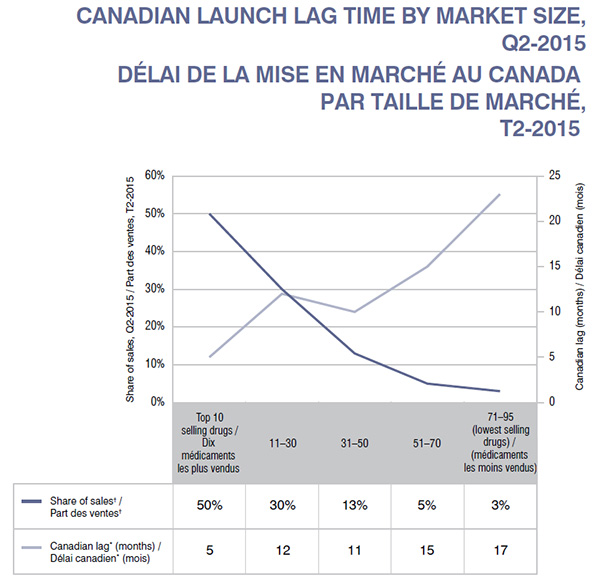
5. Les nouveaux ingrédients actifs dont le chiffre de ventes est élevé sont associés à de moins longs délais de mise en marché au Canada.
Les États-Unis ont été le premier pays à mettre en marché la majorité des NIA (68 %), ce qui représente une part importante des ventes (85 %) pendant le T2-2015. La Suède a été le deuxième pays à mettre en marché presque tous les autres NIA. Deux médicaments ont d’abord été mis en marché au Canada. Un de ces médicaments faisait partie des médicaments les plus vendus.
Bien que les 10 NIA les plus vendus, qui représentent 50 % de toutes les ventes de NSA pendant le T2-2015, aient été mis en marché au Canada dans les cinq mois suivant la première mise en marché à l’étranger, le délai moyen a augmenté alors que la part des ventes de ces médicaments a diminué.
Section 5
Cliquer sur l'image pour l'agrandir
Description de la figure
Ce graphique linéaire illustre le délai de mise en marché au Canada des d nouveaux ingrédients actifs selon la taille du marché au deuxième trimestre de 2015. La taille du marché est établie en fonction des ventes de médicaments : dix médicaments les plus vendus; de 11 à 30; de 31 à 50; de 51 à 70; et de 70 à 95 (médicaments les moins vendus). Une ligne sur le graphique illustre la part des ventes pour chaque groupe au deuxième trimestre de 2015 et l’autre ligne illustre le délai. En général, alors que la part des ventes diminue, le délai augmente. Les valeurs exactes sont présentées dans le tableau ci-dessous.
| |
Dix médicaments les plus vendus |
11‒30 |
31‒50 |
51‒70 |
71‒95 (médicaments les moins vendus) |
| Part des ventes† |
50 % |
30 % |
13 % |
5 % |
3 % |
| Délai canadien* (mois) |
5 |
12 |
10 |
15 |
23 |
6. Les médicaments contre l’hépatite C dominent les ventes de nouveaux ingrédients actifs.
Deux nouveaux médicaments contre l’hépatite C qui ont été mis en marché en 2013 (Sovaldi) et en 2014 (Harvoni) représentaient 28 % des ventes de NIA et 5 % de toutes les ventes de médicaments au Canada et dans les CEPMB7 pendant le deuxième trimestre de 2015. Au Canada, ces deux médicaments représentaient 30 % des ventes de NIA et 5 % des ventes de tous les médicaments. Après les États Unis et la Suède, le Canada enregistre le haut taux d’utilisation et de ventes pour ces médicaments relativement à la taille de sa population.
Le tableau ci après présente les dix médicaments les plus vendus au Canada et dans les CEPMB7 pendant le deuxième trimestre de 2015. La plupart des médicaments ont d’abord été mis en marché aux États-Unis (7), puis en Suède (2). Un médicament (Stelara) a été mis en marché au Canada en premier.
| Rang |
Médicament |
Part des ventes
T2-2015 |
Année de la
première mise
en marché |
Pays de la
première mise
en marché |
Délai canadien
(mois) |
| 1 |
Sofosbuvir, Ledipasvir (Harvoni) |
22 % |
2013 |
États-Unis |
1 |
| 2 |
Sofosbuvir (Sovaldi) |
6 % |
2014 |
États-Unis |
1 |
| 3 |
Liraglutide (Victoza) |
3 % |
2009 |
Suède |
11 |
| 4 |
Fingolimod (Gilenya) |
2 % |
2010 |
États-Unis |
7 |
| 5 |
Denosumab (Prolia) |
2 % |
2010 |
Suède |
3 |
| 6 |
Ustekinumab (Stelara) |
2 % |
2009 |
Canada |
— |
| 7 |
Cobicistat (Tybost) |
2 % |
2012 |
États-Unis |
3 |
| 8 |
Elvitegravir (Stribild) |
2 % |
2012 |
États-Unis |
3 |
| 9 |
Abiraterone acetate (Zytiga) |
2 % |
2011 |
États-Unis |
3 |
| 10 |
Canagliflozin (Vokanamet) |
2 % |
2013 |
États-Unis |
13 |
Sources de données : *Base de données sur les produits pharmaceutiques de Santé Canada. † Base de données MIDASMC, détaillants et hôpitaux, ventes départ-usine, IMS AG. Tous droits réservés.
Avis de non-responsabilité : Bien qu’ils se fondent en partie sur les données obtenues aux termes de la licence de la base de données MIDASMC d’IMS AG, les énoncés, les constatations, les conclusions, les points de vue et les opinions exprimés dans le présent rapport sont exclusivement ceux du CEPMB et ne sont pas imputables à IMS AG.
Le SNIUMP est une initiative de recherche qui fonctionne indépendamment des activités de réglementation du CEPMB.