L’observation des nouveaux médicaments au canada : une stratégie à facettes multiples
Dans le contexte de l’initiative du SNIUMP, le CEPMB observe les nouveaux médicaments en développement, ainsi que les médicaments lancés à l’étranger, afin de déterminer ceux qui peuvent avoir un effet sur les dépenses futures au Canada. S’appuyant sur le succès que connaît sa publication établie, soit l’Observateur des médicaments émergents, le CEPMB ajoute maintenant à son éventail de produits l’Observateur des nouveaux médicaments et l’Observateur des médicaments orphelins.
Observateur des médicaments émergents (OMÉ)
L’OMÉ présente des renseignements sur les médicaments en développement qui peuvent avoir une incidence sur les dépenses futures des régimes d’assurance-médicaments au Canada.
Chaque rapport comprend une liste de médicaments émergents trouvés dans le cadre d’une recherche effectuée dans la base de données BioPharm InsightMC ainsi que dans des documents pharmaceutiques publiés, tout particulièrement des études canadiennes.
Les médicaments choisis en sont au stade des essais cliniques de la phase III ou de l’étude par la Food and Drug Administration (FDA) des États-Unis et sont susceptibles d’avoir une incidence clinique importante.
Chaque nouveau numéro de l’OMÉ met à jour la liste des médicaments inclus dans les livraisons antérieures et met en évidence ceux qui ont été approuvés ou qui ne soient plus à l’étude.
Six numéros de l’OMÉ ont paru jusqu’à maintenant. Le dernier, publié en décembre 2014, fait le point sur les 31 médicaments identifiés dans les livraisons précédentes et en ajoute 10 à la liste, dont 3 produits biologiques.
Parmi les 31 médicaments émergents reportés des éditions précédentes de l’OMÉ :
- 17 satisfont encore aux critères de sélection des médicaments,
- 3 ont obtenu une autorisation de mise en marché de Santé Canada (présentés dans le tableau qui suit);
- 11 ont été rayés de la liste compte tenu des critères de l’OMÉ.
Autorisation de mise en marché accordée par santé Canada
| Médicament (nom de marque) – Entreprise |
Domaine thérapeutique – Indication |
Date de l’AC / Date de la première vente |
Recommandations du Programme commun d’évaluation des médicaments (PCEM) |
Status de l’examen par le CEPMB |
Aflibercept (Eylea)
Bayer Inc. |
Ophtalmologie (S01)
Dégénérescence
maculaire
néovasculaire,
liée à l’âge
Médicament
biologique
|
AC accordé le :
2013-11-08
Date de la première vente :
2013-12-23
|
Le PCEM a recommandé l’inscription 2014-10-20, sous réserve de la condition suivante :
[Traduction] « Le coût du régime d’assurancemédicaments
pour le traitement de la
dégénérescence maculaire humide liée à l’âge par aflibercept devrait fournir des économies par rapport au traitement de la DMLA avec le ranibizumab. »
Deux nouvelles indications sont actuellement à l’étude : (i) oedème maculaire secondaire à une occlusion veineuse rétinienne et (ii) oedème maculaire diabétique.
|
Prix conforme aux Lignes directrices |
Macitentan (Opsumit)
Actelion Pharmaceuticals Ltd. |
Antihypertenseurs
(C02)
Hypertension
artérielle pulmonaire
|
AC accordé le :
2013-11-06
Date de la première vente :
2014-01-15
|
Sous examen
2014-11-05 : Période d’embargo et validation des rapports d’examen expurgés du PCEM.
Les fabricants peuvent présenter des demandes de réexamen et les régimes d’assurancemédicaments peuvent présenter des demandes de renseignements pour obtenir des précisions quant à la recommandation.
|
Prix conforme aux Lignes directrices |
Tofacitinib (Xeljanz)
Pfizer Canada Inc. |
Immunosuppresseurs
(L04)
Polyarthrite rhumatoïde
|
AC accordé le :
2013-04-17
Date de la première vente : 2014-06-06
|
Sous examen
2014-10-27: Réception du sommaire des commentaires sur la rétroaction des patients.
|
Pas actuellement sous examen |
Observateur des nouveaux médicaments (ONM)
L’ONM complète l’OMÉ en indiquant les médicaments lancés récemment à l’étranger et qui ne sont pas encore disponibles au Canada mais qui devraient l’être sous peu. Le rapport présente une première évaluation de la disponibilité à l’étranger, de la pénétration du marché et des prix.
L’analyse présente des données de vente tirées de la base de données MIDASMC d’IMS AG dans le cas de tous les médicaments lancés dans les sept pays dont le CEPMB tient compte dans ses examens et ses rapports sur les prix des médicaments brevetés : France, Allemagne, Italie, Suède, Suisse, Royaume-Uni et États-Unis.
Le premier numéro à venir de l’ONM analysera les nouveaux médicaments lancés à l’étranger depuis 2009 et abordera en détail les constatations clés suivantes :
- Moins de la moitié de ces médicaments ont été lancés au Canada et ces derniers représentent la majeure partie des ventes de médicaments nouveaux étrangers.
- Les États-Unis sont en général le premier pays où on lance des médicaments, mais le Canada suit habituellement de près, avec un peu de retard par rapport à d’autres marchés étrangers.
- Plus les médicaments produisent de revenus, plus le délai de lancement au Canada est court.
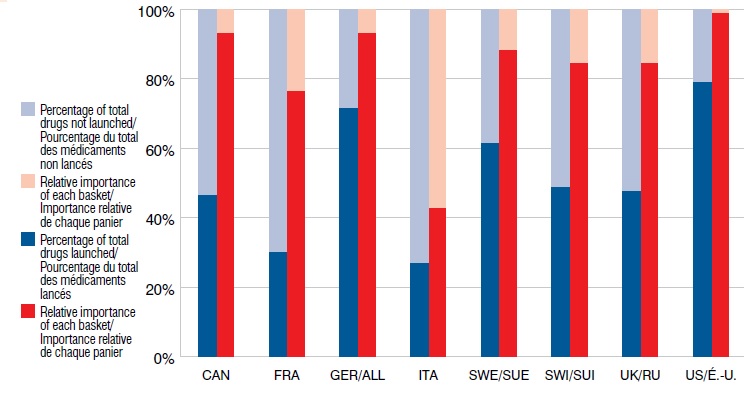
Nouveaux médicaments lancés depuis 2009 selon le marché et l’importance relative par rapport aux ventes à l’étranger, T1-2013
Le diagramme à bandes présente le pourcentage de nouveaux médicaments lancés depuis 2009 by selon le marché et l’importance relative par rapport aux ventes à l’étranger au T1-2013. Pour chaque pays, le pourcentage de médicaments lancés est indiqué avec l’importance relative du panier entre parenthèses. CAN : 46,7 % (93,3 %); FRA : 30,4 % (76,5 %); ALL : 71,7 % (93,3 %); ITA : 27,2 % (42,9 %); SUE : 62,0 % (88,5 %); SUI : 48,9 % (84,6 %); R.-U. : 47,8 % (84,7 %); É.-U. : 79,3 % (99,0 %).
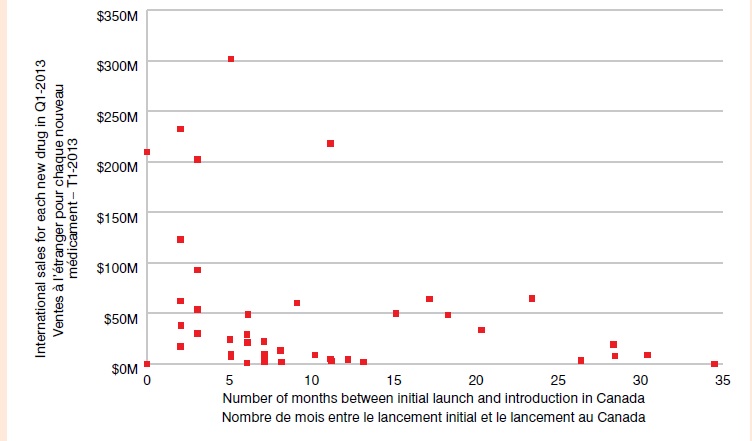
Délai de lancement au Canada — Nouveaux médicaments lancés depuis 2009
Le nuage de points illustre le délai de lancement de médicaments au Canada pour les nouveaux médicaments lancés depuis 2009. Les ventes à l’étranger pour chaque nouveau médicament au T1-2013 sont indiquées sur l’axe vertical (étendue de 0 M$ à 350 M$), et le nombre de mois entre le lancement initial et le lancement au Canada est indiqué sur l’axe horizontal (étendue de 0 à 35). Les médicaments affichant des ventes importantes avaient un délai de lancement plutôt court (< 5 mois). Un groupe de médicaments affiche des ventes de moins de 50 M$ et un délai de lancement allant de 3 à 13 mois, alors que le délai de lancement au Canada de certains médicaments à faibles ventes s’étendait à environ 35 mois.
Observateur des médicaments orphelins (OMO)
L’OMO vise principalement les médicaments orphelins dont la mise en marché a été approuvée aux États-Unis et dans l’Union européenne, évalue dans quelle mesure ils sont disponibles au Canada et présente des rapports sur l’établissement des prix, la pénétration des marchés, la disponibilité de brevets et les décisions sur le lancement.
Les données proviennent notamment de la base de données MIDASMC d’IMS AG pour les 7 pays du CEPMB et le Canada, de la base de données sur la désignation des produits pharmaceutiques orphelins de la FDA des É.‑U. et du registre des produits médicinaux orphelins de la Communauté européenne.
La première livraison à venir de l’OMO analysera les médicaments orphelins dont la mise en marché est approuvée aux É.‑U. et dans l’UE. On y abordera en détail les constatations clés suivantes :
- Les É.‑U. ont approuvé le plus grand nombre de médicaments orphelins.
- Les médicaments orphelins approuvés aux É.‑U. représentent un pourcentage important des ventes de médicaments, particulièrement aux É.‑U.
- Les médicaments officiellement orphelins aux É.‑U. et dans l’UE représentent de 3 à 6 % seulement des ventes de médicaments.
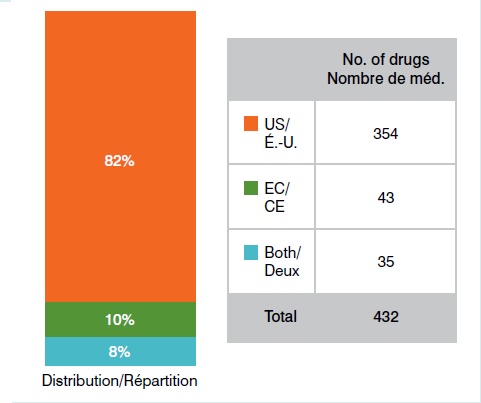
Médicaments orphelins approuvés aux É.U. et dans l’UE 1er octobre 2014
Le graphique présente le nombre de médicaments orphelins approuvés aux É.-U. et dans l’UE en date du 1er octobre 2014 : É-U : 354; CE : 43; É.-U. et CE : 35.
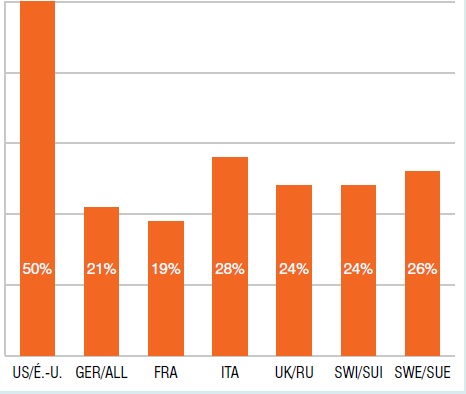
Part des ventes de médicaments orphelins don’t la désignation est approuvée par les É.-U., T1-2013
Le diagramme à bandes présente la part internationale des ventes de médicaments orphelins dont la désignation est approuvée par les É.-U. au T1-2013. É.-U. : 50 %; ALL : 21 %; FRA : 19 %; ITA : 28 %; R.-U. : 24 %; SUI : 24 %; SUE : 26 %.
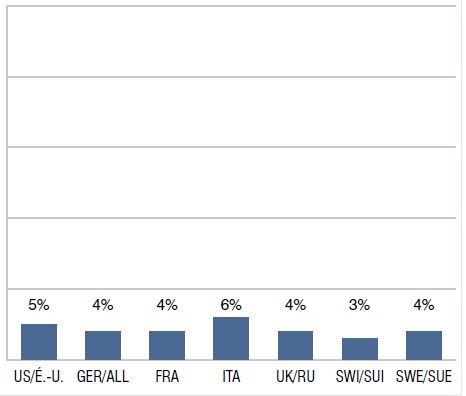
Part des ventes de médicaments orphelins dont la désignation est approuvée par les É.-U. et l’UE, T1-2013
Le diagramme à bandes présente la part internationale des ventes de médicaments orphelins dont la désignation est approuvée par les É.-U. et l’UE au T1-2013. É.-U. : 5 %; ALL : 4 %; FRA: 4 %; ITA: 6 %; R.-U. : 4 %; SUI : 3 %; SUE : 4 %.
Le SNIUMP est une initiative de recherche qui fonctionne indépendamment des activités de réglementation du CEPMB