Les inducteurs de coût des régimes privés d’assurance-médicaments au Canada, 2012-2013
La viabilité des régimes privés d’assurance-médicaments au Canada préoccupe depuis quelques années à cause du vieillissement de la population, de l’utilisation accrue des médicaments et du coût des nouveaux médicaments. Ce rapport à venir du SNIUMP analyse les tendances récentes des dépenses en médicaments prescrits des régimes privés d’assurance-médicaments et ouvre une fenêtre sur les facteurs du changement.
Le rapport complète le numéro à venir de CompassRx du SNIUMP, qui présente un tableau semblable du point de vue des régimes publics. La détermination des principaux facteurs du changement et la mesure de leur incidence sur les coûts permettent aux stratèges et aux chercheurs de comprendre les tendances de l’heure et de prévoir les pressions qui s’exerceront sur les coûts, ainsi que les niveaux de dépenses à venir.
Les taux de changement des coûts des médicaments des régimes privés à paiement direct reculent régulièrement depuis quelques années et ont atteint un plancher de 2,2 % en 2013. Ces taux constituent le résultat net d’effets de « poussée » et de « traction » importants et contraires.
D’un côté, des facteurs comme la croissance de la population, la consommation accrue de médicaments et l’utilisation de médicaments plus coûteux, par exemple, exercent une pression à la hausse (« poussée ») sur les dépenses en médicaments. Par contre, le remplacement par des médicaments génériques et les réductions de prix exercent une traction à la baisse sur les dépenses.
Le rapport utilise un modèle d’inducteurs de coût pour désagréger et quantifier l’impact d’un certain nombre d’effets (et de sous-effets) : démographie, volume, panier de médicaments, prix et remplacement par des médicaments génériques.
Effets de poussée et effets de traction
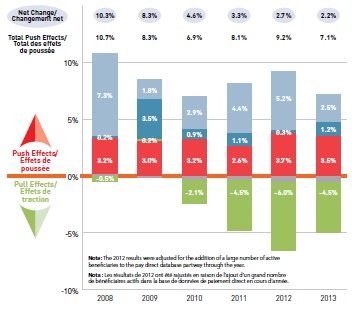
Le graphique décrit les facteurs qui ont eu une incidence sur les taux de changement des coûts des médicaments des régimes privés à paiement direct au Canada entre 2008 et 2013. Les résultats de 2012 ont été rajustés de façon à tenir compte de l’ajout, au cours de l’exercice, d’un nombre important de bénéficiaires actifs à la base de données sur le paiement direct.
Effets de poussée et effets de traction
|
2008 |
2009 |
2010 |
2011 |
2012 |
2013 |
| Changement net |
10,3 % |
8,3 % |
4,6 % |
3,3 % |
2,7 % |
2,2 % |
| Total des effets de poussée |
10,7 % |
8,3 % |
6,9 % |
8,1 % |
9,2 % |
7,1 % |
| Effet de la démographie |
7,3 % |
1,8 % |
2,9 % |
4,4 % |
5,2 % |
2,5 % |
| Effet du volume |
0,2 % |
3,5 % |
0,9 % |
1,1 % |
0,3 % |
1,2 % |
| Effet du panier |
3,2 % |
3,0 % |
3,2 % |
2,6 % |
3,7 % |
3,5 % |
| Effet du prix |
-0,5 % |
0,2 % |
-2,1 % |
-4,5 % |
-6,0 % |
-4,5 % |
Effet de la démographie en hausse de 2,5 %
Les effets démographiques propulsent le coût des médicaments vers le haut principalement à cause des augmentations des groupes de bénéficiaires. Il convient de signaler que ces augmentations pourraient être attribuables à l’ajout de régimes privés à paiement direct dans la base de données disponible. Les chiffres indiquent la taille de la population de bénéficiaires actifs.
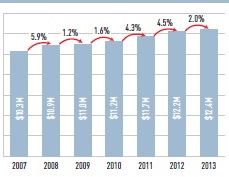
Nombre de bénéficiaires
Le graphique présente le nombre de bénéficiaires des régimes privés à paiement direct au Canada entre 2007 et 2013.
Le nombre de bénéficiaires
|
Bénéficiaires (millions) |
Taux de changement annuel |
|
| 10,3 |
blank |
| 2008 |
10,9 |
5,9 % |
| 2009 |
11,0 |
1,2 % |
| 2010 |
11,2 |
1,6 % |
| 2011 |
11,7 |
4,3 % |
| 2012 |
12.2 |
4,5 % |
| 2013 |
12,4 |
2,0 % |
Effet du volume en hausse de 1,2 %
L’effet du volume exerce une poussée sur les coûts des régimes privés, principalement à cause des augmentations du volume des ordonnances au niveau des bénéficiaires, qui ont reçu 10 % d’ordonnances de plus en 2013 qu’en 2007.
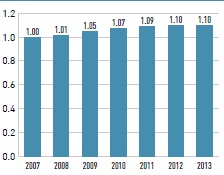
Nombre moyen indexé d’ordonnances par bénéficiaire
Le diagramme à bandes présente le nombre moyen indexé d’ordonnances par bénéficiaire des régimes privés à paiement direct au Canada entre 2007 et 2013. Ce chiffre a augmenté de 1,00 en 2007 à 1,10 en 2013.
Effet du panier en hausse de 3,5 %
L’effet du panier de médicaments exerce la pression la plus importante sur les coûts des médicaments, car on a remplacé des médicaments moins coûteux par d’autres plus coûteux, comme les produits biologiques. Ces médicaments engloutissent une part accrue des coûts et représentaient 20,1 % du marché privé en 2013.
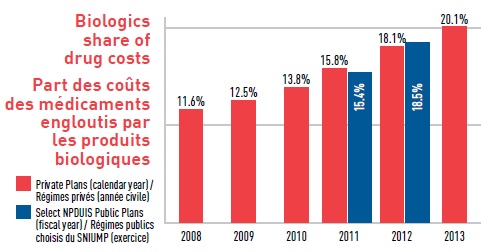
Part des coûts des médicaments engloutis par les produits biologiques
Le diagramme à bandes présente la part des coûts totaux des médicaments engloutie par les produits biologiques au sein des régimes privés entre 2008 et 2013. La part représentée par les produits biologiques a augmenté graduellement, passant de 11,6 % en 2008 à 20,1 % en 2013. Une comparaison entre les régimes privés et les régimes publics faisant rapport au SNIUMP est présentée pour 2011 et 2012. En 2011 : produits biologiques dans les régimes privés 15,8 %; dans les régimes publics du SNIUMP 15,4 %. En 2012 : produits biologiques dans les régimes privés 18,1 %; dans les régimes publics du SNIUMP 18,5 %.
Effet croisé
L’effet croisé est le résultat de l’interaction entre les effets individuels.
Effet du prix en baisse de 2,3 %
La baisse des prix des médicaments a exercé une traction vers le bas sur les niveaux des coûts au cours des dernières années lorsque les provinces ont commencé, en 2010, à appliquer des politiques sur l’établissement des prix des médicaments génériques. Ces politiques ont ramené de 0,61 en 2010 à 0,44 en 2013 les niveaux des prix des médicaments de marque de référence.
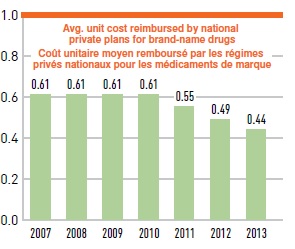
Coût unitaire moyen des medicaments génériques par rapport aux médicaments de marque de référence
Le diagramme à bandes présente le coût unitaire moyen des médicaments génériques dans les régimes privés relativement aux médicaments de marque correspondants entre 2007 et 2013. De 2007 à 2010, le coût unitaire moyen remboursé pour les médicaments génériques était de 0,61 du produit de marque. Ce chiffre a baissé à 0,55 en 2011, à 0,49 en 2012 et à 0,44 en 2013.
Effet du remplacement par des médicaments génériques en baisse de 2,2 %
Le remplacement de médicaments plus coûteux par des médicaments génériques moins coûteux a exercé un effet de traction vers le bas de 2,2 % sur les coûts des médicaments en 2013. La figure contre présente les médicaments qui réduisent le plus les dépenses.
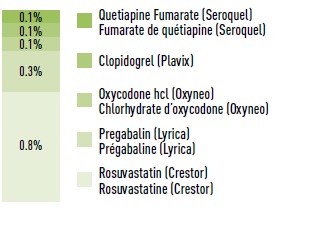
Nombre de bénéficiaires
Le graphique présente une estimation des économies réalisées suite à l’entrée sur le marché de médicaments génériques en 2012-2013: rosuvastatine (Crestor) : 0,8 %; prégabaline (Lyrica) : 0,3 %; chlorhydrate d’oxycodone (Oxyneo) : 0,1 %; clopidogrel (Plavix ): 0,1 %; fumarate de quétiapine (Seroquel) : 0,1 %.
Méthode : L’analyse des inducteurs de coût suit l’approche décrite en détail dans le rapport du CEPMB intitulé « Les facteurs de coût associés aux dépenses en médicaments d’ordonnance − un rapport méthodologique, 2013 ».
Source de données : Les données proviennent de la base de données sur les régimes privés d’assurance-médicaments à paiement direct d’IMS Brogan (taux de saisie de 85,7 % en août 2014).
Le SNIUMP est une initiative de recherche qui fonctionne indépendamment des activités de réglementation du CEPMB.