Rapport annuel 2011 : En bref
Le Conseil d´examen du prix des médicaments brevetés a pour mandat de veiller à ce que les brevetés ne vendent pas leurs médicaments brevetés au Canada à des prix excessifs ainsi que de faire rapport des tendances des prix de vente de tous les médicaments et des dépenses de R-D des brevetés.
Le Rapport annuel du CEPMB passe en revue les principales activités du CEPMB, présente des analyses des prix de produits médicamenteux brevetés et des tendances des prix de vente de tous les médicaments et fait rapport des dépenses de recherche et développement (R-D) déclarées par les brevetés.
Cette année, le Rapport annuel du CEPMB 2011 : En bref, une forme abrégée du rapport annuel, est publié et distribué aux abonnés en format électronique et en copie papier. Il a pour but de fournir aux intervenants et aux abonnés un sommaire de tous les renseignements pertinents compris dans le rapport annuel, tout en réduisant les coûts de distribution et notre empreinte carbone.
Vous pouvez consulter le Rapport annuel 2011 complet par voie électronique en formats PDF et HTML sur le site Web du CEPMB.
Le 31 mai 2012
L´honorable Leona Aglukkaq, C.P., députée
Ministre de la Santé
Chambre des communes
Ottawa (Ontario)
K1A 0A6
Madame la ministre,
J´ai le plaisir de vous présenter, conformément aux articles 89 et 100 de la Loi sur les brevets, le Rapport annuel du Conseil d´examen du prix des médicaments brevetés pour l´exercice terminé le 31 décembre 2011.
Croyant le tout conforme, je vous prie d´agréer, Madame la ministre, l´assurance de mes sentiments distingués.
Mary Catherine Lindberg
Présidente
Le CEPMB
Le Conseil d´examen du prix des médicaments brevetés (CEPMB) est un organisme indépendant qui détient des pouvoirs quasi judiciaires. Il a été créé par le Parlement en 1987 en vertu de la Loi sur les brevets (la Loi).
Le CEPMB est investi d´un double rôle :
- veiller à ce que les prix auxquels les brevetés vendent leurs médicaments brevetés au Canada ne soient pas excessifs;
- faire rapport des tendances des prix de vente de tous les médicaments et des dépenses de R-D des brevetés.
Le CEPMB n´est pas habilité à réglementer les prix des médicaments non brevetés. Il n´a aucun droit de regard sur les prix de vente au gros et au détail des médicaments brevetés et non brevetés ni sur les honoraires des pharmaciens.
À titre de source fiable et impartiale de renseignements exhaustifs sur les prix des médicaments, le CEPMB, comme il s´est engagé à le faire, ne ménage aucun effort pour faire preuve de transparence et demeurer accessible pour ses intervenants.
Gouvernance
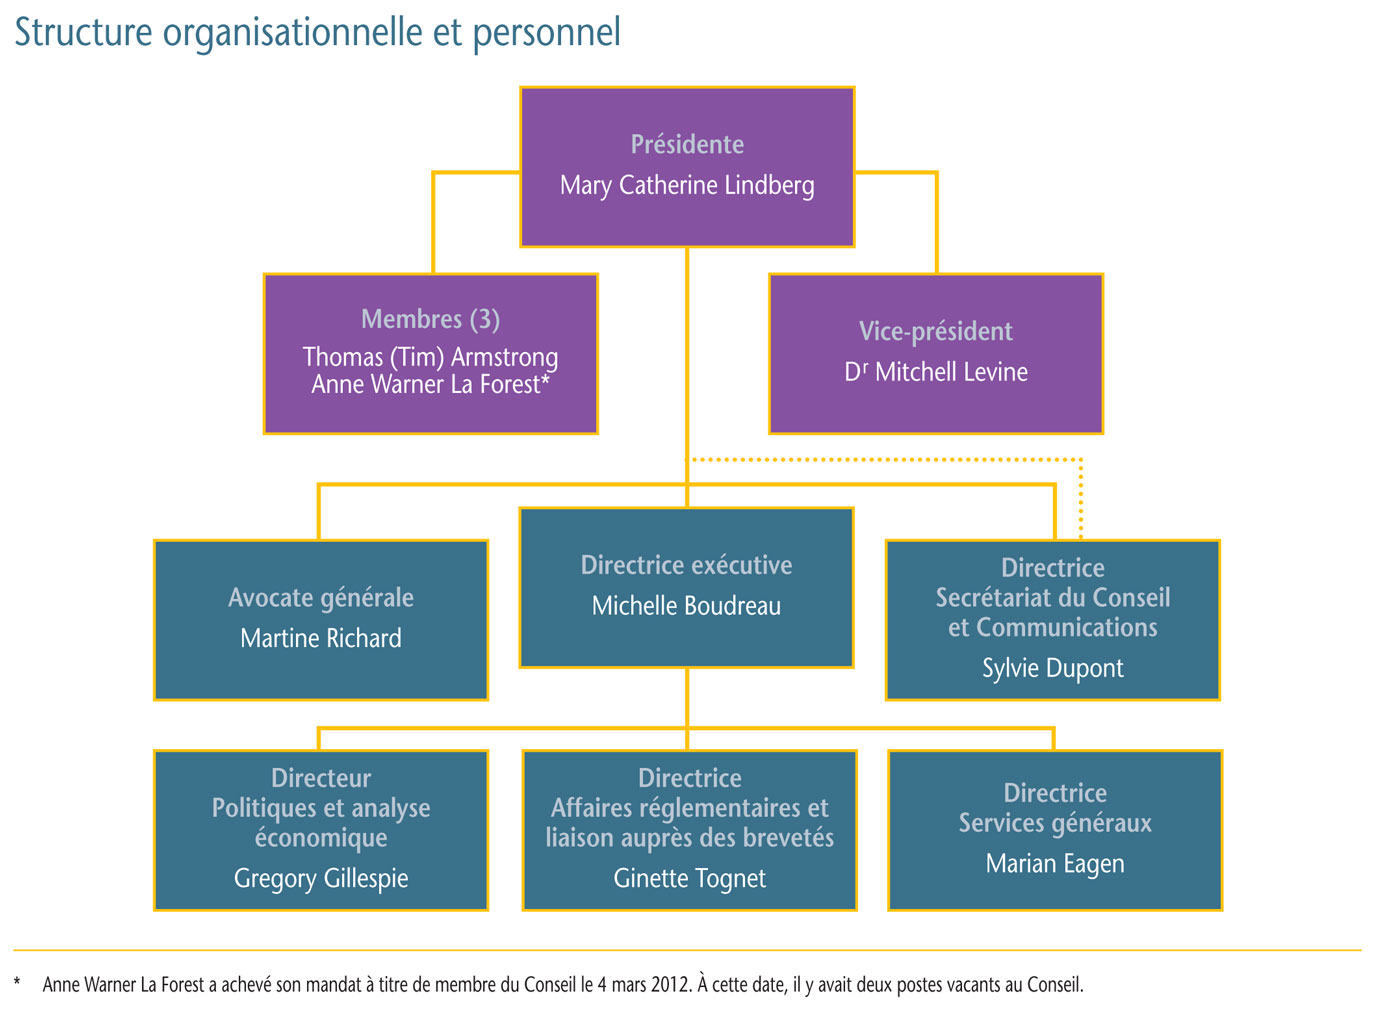
Le Conseil est composé d´au plus cinq membres siégeant à temps partiel, dont un président et un vice-président. Tous les membres du Conseil sont nommés par le gouverneur en conseil. En vertu de la Loi sur les brevets, le président du Conseil assume également les fonctions de chef de la direction et, en cette qualité, est chargé de la gouverne et de la supervision des activités du CEPMB.
Membres du Conseil
Présidente : Mary Catherine Lindberg, B. Sc. Pharm.
- Mary Catherine Lindberg a d´abord été nommée membre et vice-présidente du Conseil en juin 2006. Le 19 mai 2010, Mme Lindberg assumait les fonctions de la présidence pendant la vacance du poste. Elle a été officiellement nommée présidente du Conseil le 3 mars 2011.
Vice-président : Mitchell Levine, B. Sc, M. Sc, M.D., FRCPC, FISPE
- Le Dr Mitchell Levine a été nommé membre et vice-président du Conseil le 3 mars 2011. Avant sa nomination au Conseil, le Dr Levine était membre du Groupe consultatif sur les médicaments pour usage humain du CEPMB.
Membre : Thomas (Tim) Armstrong, QC, O. Ont.
- Tim Armstrong a été nommé membre du Conseil en octobre 2002 et a été reconduit dans ses fonctions en 2007.
Membre : Anne Warner La Forest, LL. B. (UNB), LL. M. (Cantab)
- Anne Warner La Forest siégeait au Conseil depuis mars 2007 jusqu´à la fin de son mandat le 4 mars 2012.
Budget
Pour l´exercice 2011-2012, le Conseil a disposé d´un budget de 11,8 millions de dollars et d´un effectif approuvé de 76 équivalents temps plein. Sur le budget total, une somme de 3,1 millions de dollars provenait d´une affectation à but spécial (ABS) réservée aux audiences. Les fonds de l´ABS non dépensés ont été retournés au Trésor.
Communications et liaison auprès des brevetés
Le CEPMB informe régulièrement ses intervenants sur ses activités par le truchement de ses publications, dont le Rapport annuel et La Nouvelle. Il publie également les résultats des rapports de recherche analytique du Système national d´information sur l´utilisation des médicaments prescrits (SNIUMP). En 2011, le CEPMB a commencé à publier ses documents uniquement en format électronique dans le but de réduire les coûts et l´incidence environnementale de l´imprimerie.
Le CEPMB consulte et informe régulièrement les intervenants de l´industrie et les intervenants non liés à l´industrie. Les intervenants de l´industrie sont rapidement informés de tout changement à l´environnement opérationnel et (ou) au processus de réglementation. Afin de faciliter l´accès à l´information par les brevetés, la Direction des affaires réglementaires et de la liaison auprès des brevetés tient régulièrement des séances d´information à l´intention des brevetés.
En 2011, le CEPMB a élaboré un plan visant à améliorer l´engagement auprès des intervenants non liés à l´industrie. Par l´entremise d´une série d´échanges bilatéraux avec des représentants des ministères fédéral, provinciaux et territoriaux de la santé, des consommateurs, des groupes de défense des droits des patients et autres, le CEPMB vise à améliorer la sensibilisation quant à son rôle et à sa contribution.
Afin d´accroître la communication et la liaison avec les brevetés, le CEPMB a réaménagé son site Web, a étendu sa portée grâce à l´utilisation de médias sociaux tels que Twitter et a lancé des webinaires comme moyen d´informer les brevetés.
Réglementation des prix des médicaments brevetés
Le CEPMB vérifie les prix auxquels les brevetés vendent leurs produits médicamenteux brevetés au Canada afin de s´assurer qu´ils ne sont pas excessifs.
Les brevetés sont tenus par la loi de produire des renseignements relatifs à la vente de leurs produits médicamenteux effectuée au Canada. La Loi sur les brevets (la Loi) et le Règlement sur les médicaments brevetés (le Règlement) dictent les rapports que doivent soumettre les brevetés, et le personnel du Conseil examine de façon continue les renseignements sur les prix. Le prix d´un produit médicamenteux breveté relève de la compétence du CEPMB jusqu´à l´expiration du ou des brevets du médicament.
Même s´ils ne sont pas tenus de faire approuver les prix de leurs produits médicamenteux brevetés avant de lancer leur produit sur le marché, les brevetés doivent veiller à ce que le prix ne soit pas excessif.
Le personnel du Conseil examine le prix de chaque concentration et chaque forme posologique d´un médicament breveté vendu au Canada. Différents facteurs sont utilisés afin de déterminer si un produit médicamenteux a un prix excessif, comme l´indique l´article 85 de la Loi. Le Compendium des politiques, des Lignes directrices et des procédures (Lignes directrices) indique en détail les diverses comparaisons du prix utilisées par le personnel du Conseil afin de déterminer si le prix exigé par un breveté est visé par le prix admissible maximal.
Lorsque le prix d´un produit semble plus élevé que ne l´autorisent les Lignes directrices et que les circonstances justifient une enquête, le personnel du Conseil mène une enquête. L´enquête peut mener à l´un des résultats suivants :
- la fermeture de l´enquête lorsqu´il apparaît que le prix est conforme aux Lignes directrices;
- un Engagement de conformité volontaire par lequel le breveté s´engage à réduire le prix de son produit à un niveau non excessif et à rembourser les recettes excessives qu´il a encaissées – les recettes excessives peuvent être remboursées au moyen d´un paiement et (ou) de la réduction supplémentaire du prix du produit médicamenteux breveté, ou d´une réduction du prix d´un autre produit médicamenteux breveté;
- une recommandation du personnel du Conseil à la présidente d´émettre un Avis d´audience pour tenir une audience publique sur le prix d´un médicament breveté.
Examen des prix des produits médicamenteux brevetés ayant fait l´objet d´un rapport au CEPMB
Le nombre total de produits médicamenteux brevetés pour usage humain en 2011 était de 1 282. Le tableau ci-dessous fournit une répartition des produits médicamenteux brevetés nouveaux et existants, ainsi qu´un sommaire de l´état d´avancement de l´examen du prix.
Produits médicamenteux brevetés pour usage humain vendus au Canada en 2011 – État d´avancement de l´examen du prix en date du 31 mars 2012
| |
Nouveaux produits médicamenteux lancés sur le marché en 2011 |
Produits médicamenteux brevetés existants |
Total |
| Total |
109 |
1173 |
1282 |
| Conformes aux Lignes directrices |
86 |
993 |
1079 |
| Sous examen |
0 |
0 |
0 |
| Ne justifient pas d´enquête |
10 |
124 |
134 |
| Sous enquête |
13 |
55 |
68 |
| Audiences sur le prix |
- |
1 |
1 |
Surveillance et évaluation des Lignes directrices
Les nouvelles Lignes directrices du Conseil, entrées en vigueur le 1er janvier 2010, fournissent une orientation aux brevetés et au personnel du Conseil concernant l´application des facteurs prévus à la Loi sur les brevets et au Règlement sur les médicaments brevetés pour déterminer si le prix d´un produit médicamenteux breveté vendu au Canada est excessif. Le CEPMB surveille et évalue de façon continue l´application des nouvelles Lignes directrices afin de s´assurer qu´elles demeurent pertinentes et efficaces.
Engagements de conformité volontaire et audiences
En 2011 et jusqu´au 31 mai 2012, la présidente a approuvé 15 Engagements de conformité volontaire afin de réduire le prix des produits médicamenteux brevetés à un niveau non excessif.
En plus de la réduction des prix, les recettes excessives totalisant 24 millions de dollars ont été remboursées au moyen de paiements au gouvernement du Canada sous forme d´Engagements de conformité volontaire et d´ordonnances du Conseil en 2011, jusqu´au 31 mai 2012.
Aucun nouvel Avis d´audience n´a été délivré en 2011.
Des décisions sont en instance dans l´affaire de Sandoz Canada Inc., pour défaut de soumettre ses rapports, et dans l´affaire de Pentacel et Quadracel, sur l´ordonnance corrective. Deux instances sont en cours : Apotex Inc., pour défaut de soumettre ses rapports, et Apo-Salvent exempt de CFC, sur le prix.
Depuis 1993, le président du Conseil a approuvé 87 Engagements de conformité volontaire et entamé 25 audiences publiques. Un montant d´environ 123 millions de dollars a été recueilli par l´entremise d´Engagements de conformité volontaire et d´ordonnances du Conseil, au moyen de paiements au gouvernement du Canada.
Affaires interjetés auprès de la Cour fédérale
Trois décisions du Conseil font actuellement l´objet de révision judiciaire par la Cour fédérale dans les affaires suivantes : ratio-Salbutamol HFA; ratiopharm Inc. (maintenant Teva Canada); Copaxone (réexamen). Dans les trois cas, les dates d´audience n´ont toujours pas été annoncées.
Affaire devant la Cour suprême du Canada
En janvier 2011, la Cour suprême a rejeté l´appel de Celgene Corporation, confirmant la compétence du Conseil sur le prix du Thalomid. La décision a reconnu que l´objet du mandat du Conseil prévu à la loi est la protection des consommateurs.
Principales tendances pharmaceutiques
Tendances observées au niveau des ventes des produits médicamenteux brevetés
Les ventes de produits médicamenteux brevetés ont totalisé 13,1 milliards de dollars en 2011, soit 1,7 % de plus qu´en 2010, où ce montant totalisait 12,9 milliards de dollars. En guise de comparaison, la croissance annuelle des ventes de produits médicamenteux brevetés était de 27,0 % en 1999 et s´est maintenue dans les deux chiffres jusqu´en 2003.
Au cours de la dernière partie des années 1990, la croissance des ventes a été associée à une succession de nouveaux « médicaments vedettes » qui ont donné lieu à des volumes de ventes très élevés. Depuis, l´industrie pharmaceutique n´a pas lancé sur le marché suffisamment de nouveaux « médicaments vedettes » pour soutenir le taux de croissance à deux chiffres. Les produits médicamenteux lancés sur le marché entre 1995 et 1999 représentent toujours près d´un quart des ventes de l´année 2011.
Le pourcentage des ventes de produits médicamenteux brevetés par rapport à l´ensemble des ventes de médicaments a également reculé depuis 2003, ce qui signifie que les ventes de produits médicamenteux génériques et de produits médicamenteux de marque non brevetés ont augmenté davantage que celles des produits médicamenteux brevetés.
En 2011, la part des ventes de produits médicamenteux brevetés était de 59,1 %, une augmentation de 1,7 % par rapport à l´année précédente. L´augmentation des ventes était essentiellement attribuable au lancement de nouveaux médicaments et à l´utilisation accrue des médicaments existants. Les variations des prix n´ont pas contribué à l´augmentation des ventes en 2011.
Les médicaments du groupe thérapeutique agissant sur le système cardiovasculaire représentaient la diminution la plus importante des ventes, alors que ceux du groupe des agents antinéoplasiques et immunomodulateurs représentaient l´augmentation la plus importante.
Tendances observées au niveau des prix
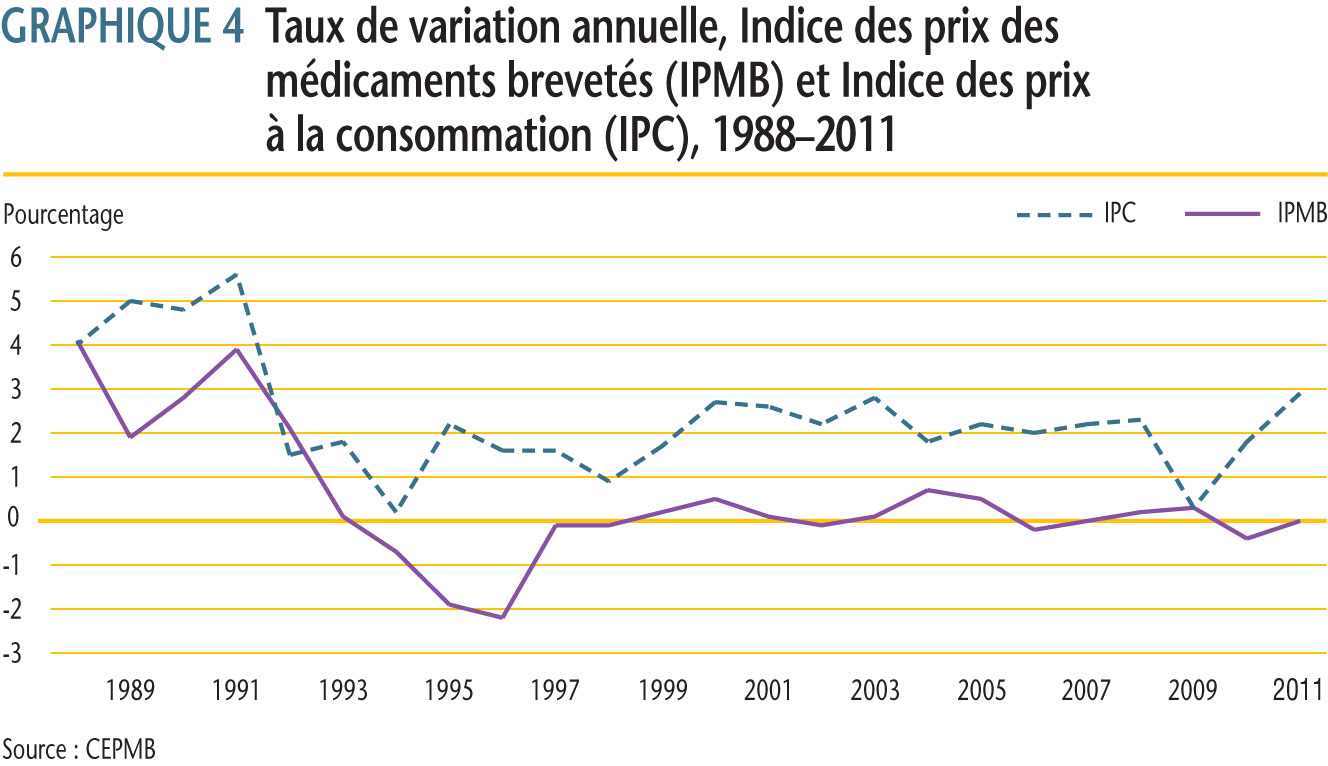
Le CEPMB utilise l´Indice des prix des médicaments brevetés (IPMB) pour faire le suivi des tendances des prix des produits médicamenteux brevetés vendus au Canada. L´IPMB mesure la variation moyenne des prix départ-usine par rapport à l´année précédente, à l´aide d´une formule qui correspond à la moyenne de la variation des prix au niveau du produit médicamenteux pondérée en fonction des ventes. La méthodologie rappelle celle utilisée pour compiler l´Indice des prix à la consommation (IPC). L´IPMB se situe constamment sous l´IPC.
Selon la mesure prise par l´IPMB, les prix des produits médicamenteux brevetés en moyenne n´ont enregistré aucune variation (0,0 %) entre 2010 et 2011.
Les taux moyens de variation des prix selon la catégorie de clients ont été obtenus en appliquant la méthodologie de l´IPMB aux données sur les ventes faites aux hôpitaux, aux pharmacies et aux grossistes. Pour 2011, les taux de variation des prix étaient de -2,2 %, 0,6 % et 0,9 %, respectivement.
Comparaisons internationales
La Loi et son Règlement obligent les brevetés à faire rapport au CEPMB des prix départ-usine de leurs produits médicamenteux brevetés accessibles au public qu´ils pratiquent dans les sept pays de comparaison, soit la France, l´Allemagne, l´Italie, la Suède, la Suisse, le Royaume-Uni et les États-Unis. Le CEPMB utilise ces données pour effectuer ses comparaisons des variations des prix à l´étranger.
Variation des prix selon le pays
En 2011, les prix aux États-Unis ont augmenté d´un taux moyen de 10,9 %. Les augmentations de prix ont été beaucoup plus modestes en Allemagne et au Royaume-Uni (2,1 % et 0,2 %, respectivement), alors que les prix en France, en Italie, en Suisse et en Suède ont enregistré un recul (-2,9 %, -1,1 %, -4,1 % et -0,7 %, respectivement).
Niveaux des prix par pays
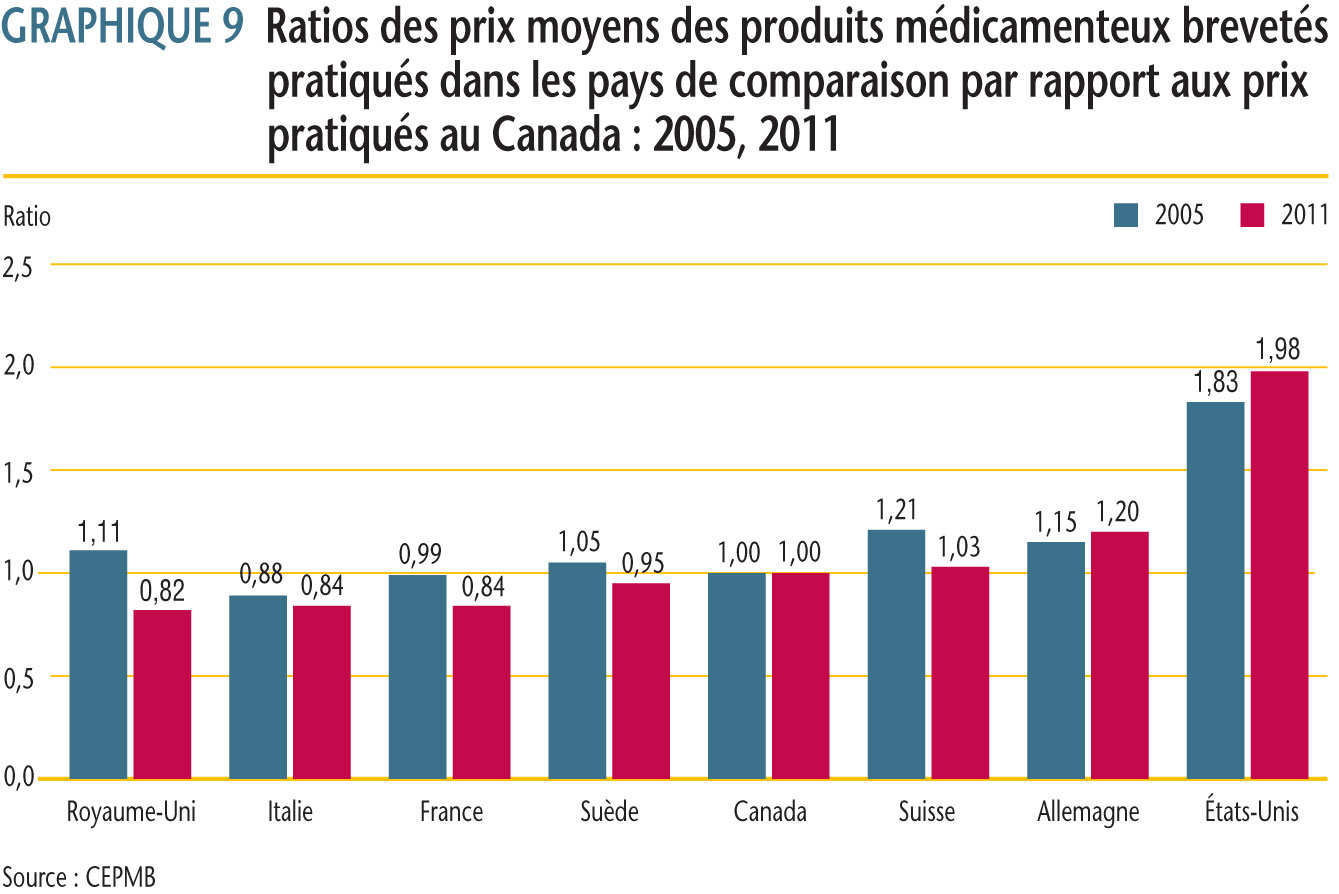
Chaque année, le CEPMB mène des comparaisons bilatérales et multilatérales de prix pour chacun des sept pays de comparaison en utilisant les taux d´échange du marché pour la conversion des devises.
Comme par les années antérieures, les prix pratiqués au Canada en 2011 se situaient habituellement dans la gamme des prix observés parmi les pays de comparaison. Les résultats indiquent que les prix pratiqués au Canada étaient plus ou moins semblables aux prix en Suède et en Suisse (5 % plus bas et 3 % plus élevés, respectivement). Les prix en Italie, en France et au Royaume-Uni étaient beaucoup moins élevés qu´au Canada (16 %, 16 % et 18 %, respectivement), alors que ceux en Allemagne et aux États-Unis étaient beaucoup plus élevés (20 % et 98 %, respectivement).
Le « prix international médian », qui correspond à la médiane des prix de vente des produits médicamenteux observés dans les sept pays de comparaison, est l´une des mesures utilisées dans les comparaisons multilatérales de prix. Le ratio de la médiane des prix pratiqués dans les pays de comparaison par rapport aux prix au Canada s´est maintenu à 1,05 en 2011. Cela indique que la moyenne des prix des produits médicamenteux brevetés pratiqués dans les sept pays de comparaison était 5 % plus élevée que ceux pratiqués au Canada l´année dernière. Depuis 2006, le ratio est demeuré quelque peu constant, se situant entre 1,07 et 1,03.
Dépenses en produits médicamenteux au Canada par rapport aux marchés mondiaux
Selon les données sur les ventes dans différents pays fournies par MIDAS©, 2005−2011, IMS Health Incorporated ou ses sociétés affiliées (tous droits réservés)1, le marché canadien a en 2011 représenté 2,6 % de l´ensemble des ventes sur les principaux marchés mondiaux. La part du Canada se situait entre 2,4 % et 2,7 % de 2005 à 2011.
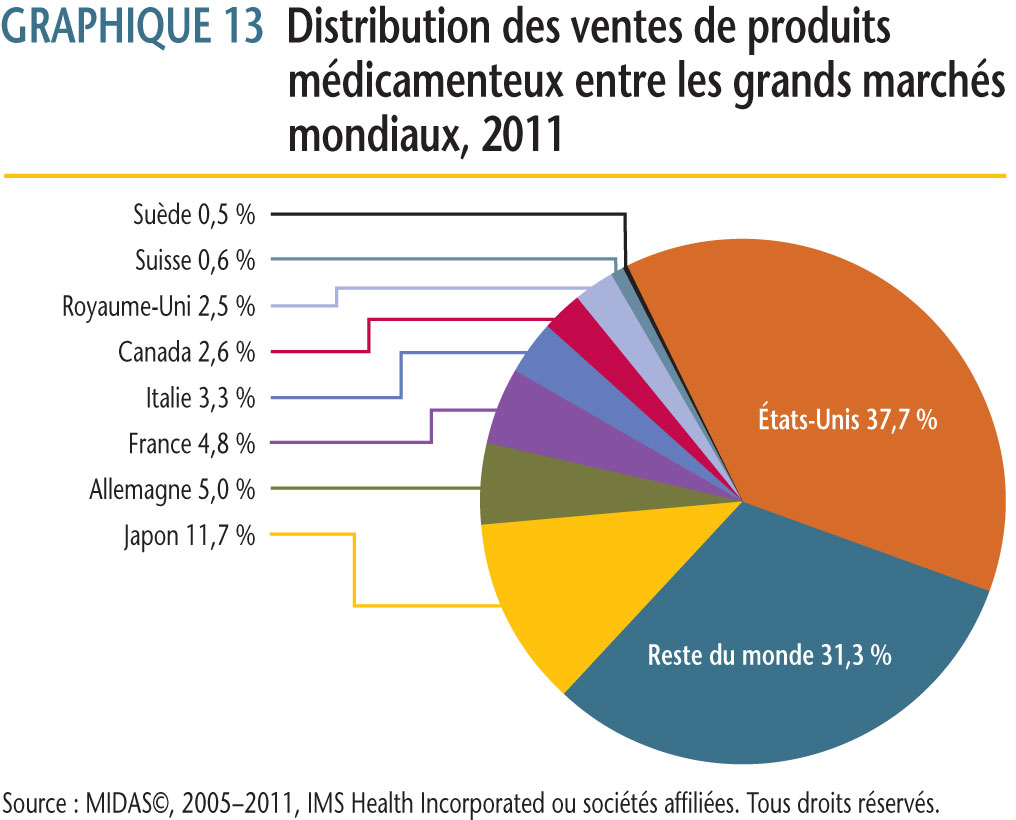
Au cours de la même période, les ventes au Canada de produits médicamenteux ont augmenté en moyenne de près de 5,2 % par année. Pour la même période, les ventes dans les sept pays de comparaison ont augmenté en moyenne de 4,2 % par année.
La comparaison des dépenses en produits médicamenteux peut aussi être faite à l´aide de la proportion du produit intérieur brut consacrée à l´achat de médicaments. Selon les données de 2009, dans les sept pays de comparaison, les dépenses en produits médicamenteux ont accaparé entre 1,1 % et 2,1 % du PIB. Sur cette échelle, la valeur du Canada (1,9 %) s´inscrit près de la limite supérieure.
Dépenses de R-D
La valeur des recettes brutes tirées des ventes de produits médicamenteux au Canada déclarées par les brevetés a totalisé 17,8 milliards de dollars en 2011, ce qui représente une augmentation de 4,7 % par rapport à 2010. Les recettes tirées des ventes déclarées par les brevetés membres de Rx&D ont totalisé 13,5 milliards de dollars pour la même période, soit 75,5 % de l´ensemble des recettes tirées des ventes.
Les dépenses en R-D déclarées par les brevetés ont totalisé 991,7 millions de dollars en 2011, ce qui représente un recul de 15,8 % par rapport à 2010. Les dépenses en R-D déclarées par les brevetés membres de Rx&D ont totalisé 901,2 millions de dollars en 2011, ce qui représente un recul de 9,9 % par rapport à l´année précédente. Les brevetés membres de Rx&D ont effectué 90,9 % de toutes les dépenses de R-D déclarées en 2011.
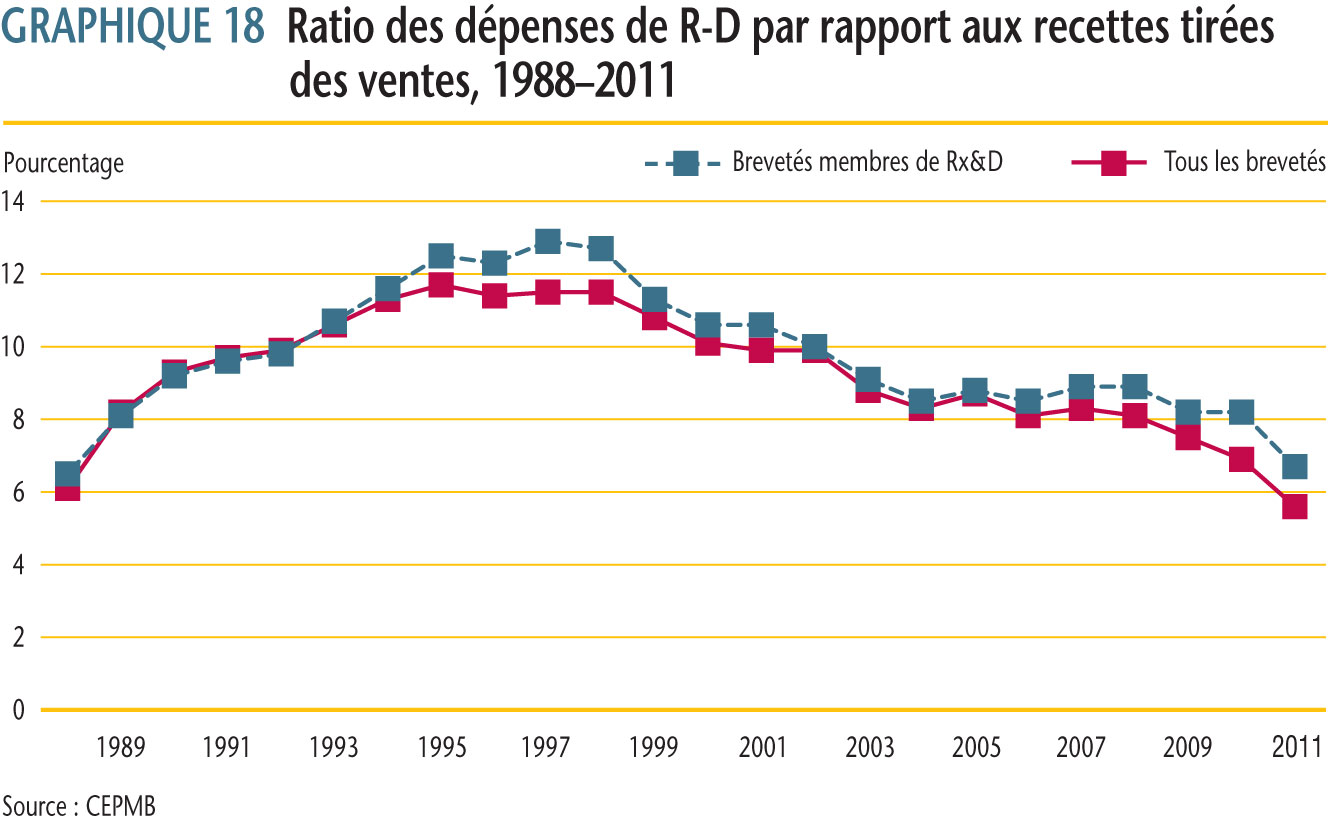
À la suite de modifications apportées à la Loi en 1987, Rx&D s´était engagé à augmenter ses dépenses annuelles de R-D pour qu´elles totalisent en 1996 au moins 10 % des recettes tirées des ventes. Ce niveau de dépenses de R-D a été atteint en 1993, ayant même dépassé 10 % certaines années. Depuis 2003, le ratio des dépenses de R-D de tous les brevetés et des membres de Rx&D a diminué. En 2011, le ratio des dépenses de R-D par rapport aux recettes tirées des ventes parmi les brevetés était de 5,6 %, un recul par rapport au ratio de 6,9 % en 2010. Ces valeurs ressemblent beaucoup aux données observées en 1988. Le ratio des brevetés membres de R&D était de 6,7 %, un recul par rapport au ratio de 8,2 % en 2010. Ces valeurs ressemblent beaucoup aux données observées en 1988. Le ratio des brevetés membres de Rx&D a été inférieur à 10 % pendant les neuf dernières années consécutives.
Pour 2011, les brevetés ont fait état de dépenses de recherche fondamentale totalisant 164,9 millions de dollars ou 17,3 % du total des dépenses de R-D, soit un recul de 30,1 % par rapport à l´année antérieure. Les brevetés ont déclaré des dépenses de recherche appliquée totalisant 525,1 millions de dollars ou, encore, 55,0 % des dépenses courantes de R-D. Les essais cliniques ont accaparé 75,2 % des dépenses de recherche appliquée.
Devant les sept pays de comparaison, le ratio du Canada des dépenses de R-D par rapport aux recettes tirées des ventes pour 2009 se classait deuxième parmi les ratios les moins élevés à 7,5 %, celui de l´Italie étant premier. Les ratios des autres pays de comparaison dépassaient de beaucoup celui du Canada. En moyenne, le ratio des dépenses de R-D par rapport aux recettes tirées des ventes pour tous les pays de comparaison était de 20,1 %.
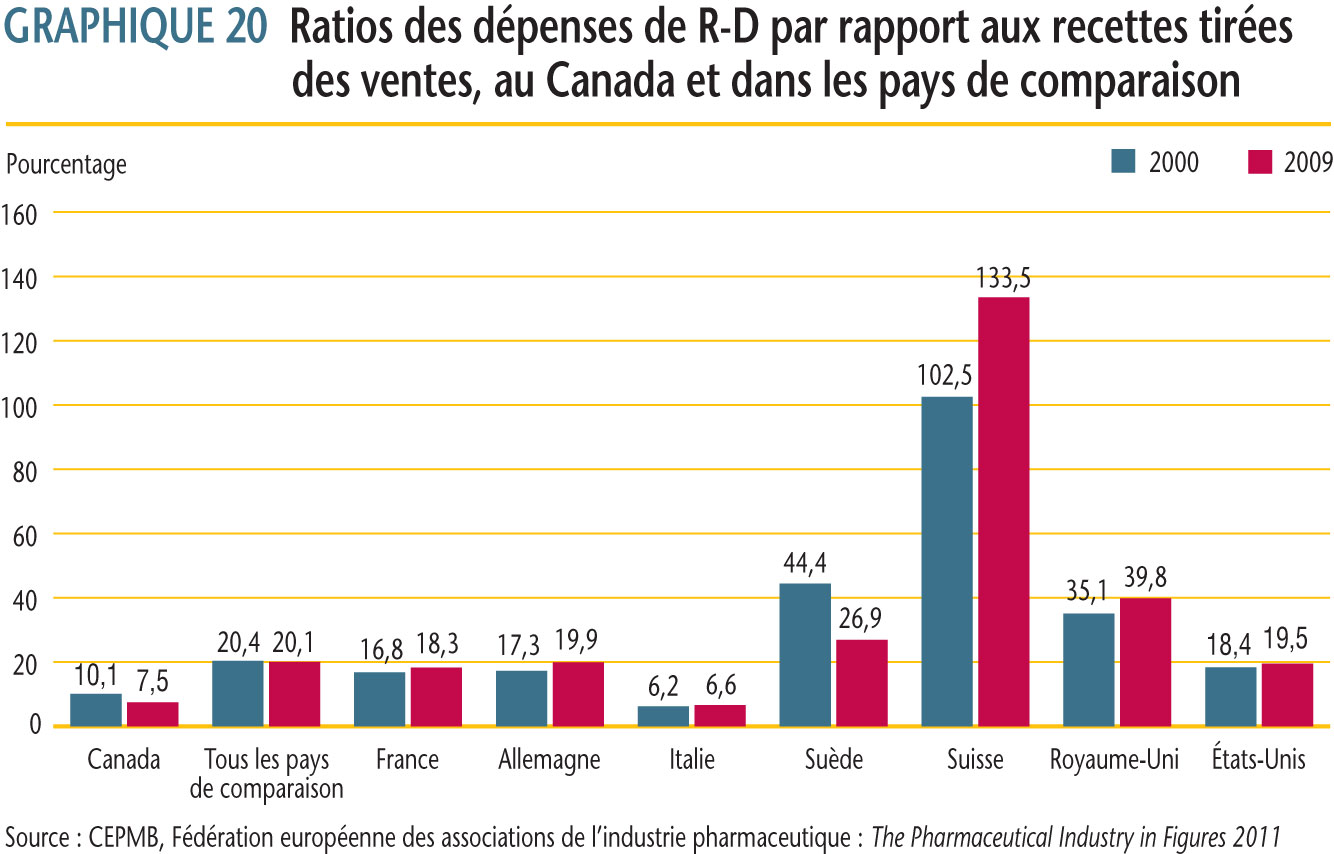
Il y a lieu de comparer les ratios des dépenses de R-D par rapport aux recettes tirées des ventes avec les ratios des prix moyens dans les pays de comparaison par rapport aux prix au pays Canada. Plusieurs pays de comparaison, dont les prix des produits médicamenteux brevetés sont en moyenne beaucoup moins élevés qu´au Canada, ont obtenu des ratios des dépenses de R-D par rapport aux recettes tirées des ventes grandement supérieurs à ceux au Canada.
Système national d´information sur l´utilisation des médicaments prescrits
Par l´entremise du Système national d´information sur l´utilisation des médicaments prescrits (SNIUMP), le CEPMB et l´Institut canadien d´information sur la santé effectuent en partenariat avec les gouvernements fédéral, provinciaux et territoriaux des analyses critiques des tendances des prix des produits médicamenteux d´ordonnance, de l´utilisation faite de ces produits et des coûts en produits médicamenteux. En 2010, le CEPMB a travaillé en étroite collaboration avec ses partenaires pour éclairer le processus de prise de décisions des régimes d´assurance-médicaments.
En 2011, le CEPMB a publié cinq rapports du SNIUMP.
- L´Observateur des médicaments émergents – troisième livraison
- Médicaments génériques au Canada : Comparaisons des prix internationaux et économies de coûts potentielles
- Analyse des facteurs de coût associés aux frais d´exécution d´ordonnance assumés par les régimes publics d´assurance-médicaments de 2001-2002 à 2007-2008
- Incidence de l´arrivée sur le marché de médicaments génériques sur l´utilisation de l´ingrédient
- Politiques sur les frais accessoires facturés par les grossistes des régimes publics d´assurance-médicaments du Canada
1 Although based in part on data obtained under license from the MIDAS IMS database, the statements, findings, conclusions, views and opinions expressed in this Annual Report are exclusively those of the PMPRB and are not attributable to IMS AG.