Tamper-Resistant Properties of Drugs Regulations (TRPDR)
Cost Impact Analysis, 2019
PMPRB presentation to federal, provincial and territorial public plan representatives on September 29, 2015.
Background
Tamper-Resistant Properties of Drugs Regulations
Health Canada published a pre-consultation notice on the proposed Tamper-Resistant Properties of Drugs Regulations in the Canada Gazette, Part I, on June 27, 2015:
- sought input from stakeholders and the general public, with a 45 day comment period.
Solid oral dosage forms of controlled-release oxycodone products, where oxycodone is the only medicinal ingredient, were proposed as the first category of substances required to have tamper-resistant properties – referred in this analysis as oxycodone CR.
The regulations propose a three-year coming-into-force period to provide time for product reformulation and supply chain adjustments.
More details on the proposed regulation are available at:
http://www.gazette.gc.ca/rp-pr/p1/2015/2015-06-27/html/notice-avis-eng.php#ne10
PMPRB role
The Patented Medicine Prices Review Board (PMPRB) is an independent quasi-judicial body established by Parliament in 1987.
The PMPRB has a dual role: to ensure that prices at which patentees sell their patented medicines in Canada are not excessive; and to report on pharmaceutical trends of all medicines and on R&D spending by patentees.
The PMPRB was asked by Health Canada (Controlled Substances and Tobacco Directorate) to estimate the potential impact of the proposed regulatory change on drug expenditures at the national level, as well as for public and private plans.
Acknowledgements
This analysis was prepared by the Patented Medicine Prices Review Board (PMPRB) as part of the National Prescription Drug Utilization Information System (NPDUIS).
This analytical work was done in consultation with the NPDUIS Advisory Committee.
The PMPRB NPDUIS staff contributed to the analytical content of the report:
- Tanya Potashnik – Director, Policy and Economic Analysis
- Elena Lungu – Manager, NPDUIS
- Gary Warwick – Senior Economic Analyst
- Karine Landry, Economic Analyst
- Carol McKinley – Communication Advisor
- The PMPRB scientific and editing groups
About NPDUIS
NPDUIS is a research initiative established by federal, provincial, and territorial Ministers of Health in September 2001. It is a partnership between the PMPRB and the Canadian Institute for Health Information (CIHI).
Its purpose is to provide policy makers and public drug plan managers with critical analyses of price, utilization and cost trends, so that Canada’s health care system has more comprehensive and accurate information on how prescription drugs are being used and on sources of cost pressures.
NPDUIS operates independently of the regulatory activities of the Board of the PMPRB. The statements and opinions expressed in this NPDUIS report do not represent the position of the PMPRB with respect to any regulatory matter.
The PMPRB conducts its NPDUIS analytical reporting under the guidance of the NPDUIS Advisory Committee. The Committee advises and supports the PMPRB in establishing research priorities, in the development of research methodologies and in the interpretation of analytical results.
The Advisory Committee is composed of representatives from public drug plans in British Columbia, Alberta, Saskatchewan, Manitoba, Ontario, New Brunswick, Nova Scotia, Prince Edward Island, Newfoundland and Labrador, the Yukon, and Health Canada. It also includes observers from CIHI and the Canadian Agency for Drugs and Technologies in Health (CADTH).
Outline
- Purpose of the analysis
- Data sources
- Opioid market considered
- Overview of the opioid market in Canada
- NPDUIS public plans
- Considerations and assumptions for the estimations
- Cost impact analysis of the TRPDR
- Limitations
Purpose of the analysis
- To provide a high-level overview of the opioid market in Canada that would be affected by the TRPDR.
- To estimate the cost impact of the TRPDR on drug sales/expenditures at the national level, as well as for the three market segments:
- Public
- Private
- Out-of-pocket.
Data sources
1. National market: MIDAS™, IMS AG. All rights reserved.
- Utilization and sales at manufacturer price levels for the retail sector for 2006–2014.
- Quarterly data available to Q4-2014 allowed for a detailed analysis of past trends and forecasting to 2019.
2. Public, private and out-of-pocket markets: IMS Brogan Payer Insight
- Breaks down the national market into the three market segments for 2013: public, private and out-of-pocket.
- Prescriptions are flagged as public, private or out-of-pocket based on who paid the largest portion of the cost.
- Assumptions of opioid market segmentation were based on this data.
- Estimates and projections of the Canadian market were based on the MIDAS database.
Although based in part on data obtained under license from the IMS Brogan Payer Insight and IMS AG’s MIDAS™ Database, the statements, findings, conclusions, views and opinions expressed in this report are exclusively those of the PMPRB and are not attributable to either IMS Brogan or IMS AG.
3. NPDUIS Public Plans: NPDUIS Database, Canadian Institute for Health Information (CIHI)
- Drug cost accepted for reimbursement by NPDUIS public drug plans for 2011/12 to 2013/14 fiscal years.
- The NPDUIS Database houses pan-Canadian information on public drug programs. It contains prescription claims-level data collected from publicly financed drug benefit programs, as well as formulary data, drug product information and information on public drug plan policies.
Parts of this material are based on data and information provided by the Canadian Institute for Health Information. However, the analyses, conclusions and/or statements expressed herein are not those of the Canadian Institute for Health Information.
Opioid market
The cost impact analysis focuses on the opioid drug market and considers the following drugs:
- Codeine
- Morphine
- Oxycodone
- Hydrocodone
- Hydromorphone
- Fentanyl
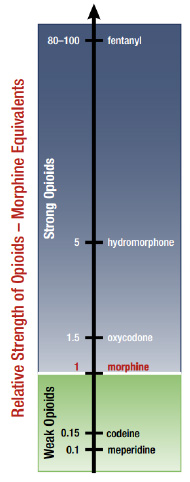
Relative Strength of Opioids - Morphine Equivalents
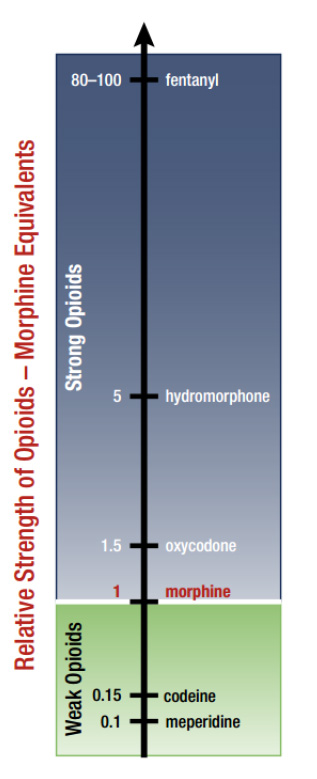
Figure description
This bar graph indicates the relative strength of various opioids using morphine equivalent measurements, where the strength of morphine is set to 1: meperidine, 0.1; codeine, 0.15; morphine, 1; oxycodone, 1.5; hydromorphone, 5; fentanyl, 80 to 100.
Oxycodone drugs considered
- Oxycontin (impact of the switch to OxyNEO)
- OxyNEO
- Oxycodone CR
- Target of the proposed regulations: solid oral dosage forms of controlled-release oxycodone products, where oxycodone is the only medicinal ingredient.
- Oxycodone - short acting (Oxy.IR and other non-patented versions)
- Oxycodone and Acetaminophen
- Oxycodone and ASA
- Oxycodone and Naloxone (Targin)
1. Overview of the opioid market in Canada: A retroactive look at the status quo
National sales for opioids, 2006–2014
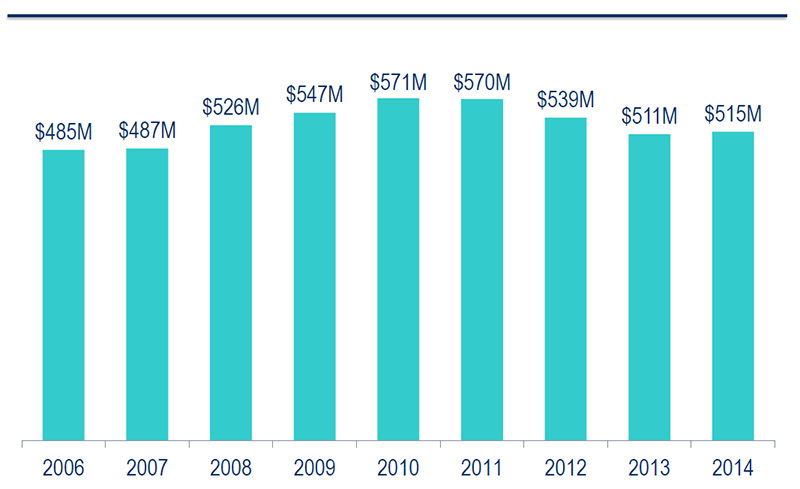
Source: MIDAS™, IMS AG. All rights reserved.
Figure description
This bar graph gives the annual national sales for opioids from 2006 to 2014 in millions of dollars: 2006, 485; 2007, 487; 2008, 526; 2009, 547; 2010, 571; 2011, 570; 2012, 539; 2013, 511; 2014, 515.
Units and sales of opioids in Canada, 2014
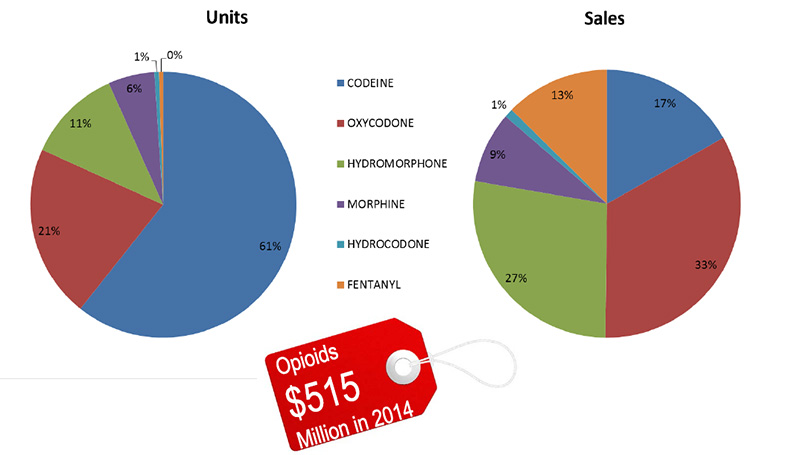
Source: MIDAS™, IMS AG. All rights reserved.
Figure description
These two pie charts give the share of units and sales of opioids in Canada in 2014. The total for all sales was $515 million.
Left-hand pie chart – share of units
Codeine, 61%; oxycodone, 21%; hydromorphone, 11%; morphine, 6%; hydrocodone, 1%; fentanyl, 0%.
Right-hand pie chart – share of sales
Codeine, 17%; oxycodone, 33%; hydromorphone, 27%; morphine, 9%; hydrocodone, 1%; fentanyl, 13%.
Canadian utilization of opioids, 2014 - Brand versus generic
With the exception of hydrocodone and hydromorphone, the market is primarily generic (units, 2014)
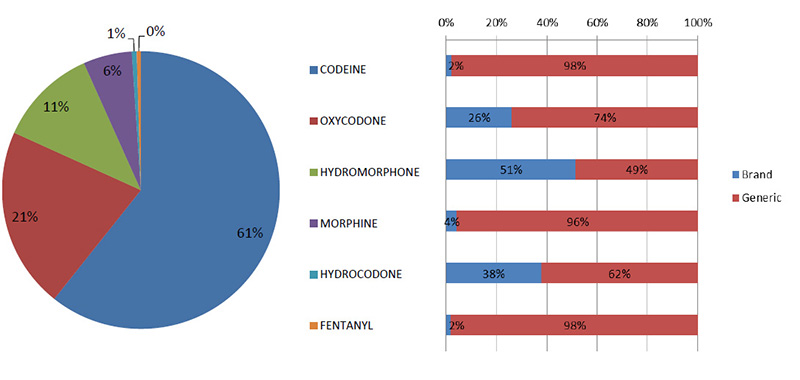
Source: MIDAS™, IMS AG. All rights reserved.
Figure description
This bar graph gives the brand-name and generic share of utilization each opioid in 2014. The accompanying pie chart gives the market share of units.
| Opioid |
Share of total units |
Brand-name drug share of total units |
Generic drug share of total units |
| Codeine |
61% |
2% |
98% |
| Oxycodone |
21% |
26% |
74% |
| Hydromorphone |
11% |
51% |
49% |
| Morphine |
6% |
4% |
96% |
| Hydrocodone |
1% |
38% |
62% |
| Fentanyl |
0% |
2% |
98% |
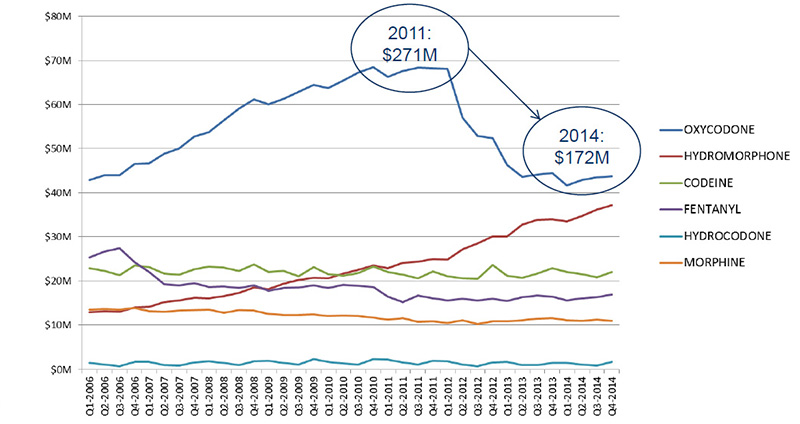
Trends in opioid sales, 2006–2014
The drop in sales for oxycodone reflects the switch to OxyNeo and the change in provincial benefit status.
Source: MIDAS™, IMS AG. All rights reserved.
Figure description
This line graph illustrates the trends in opioid sales for each quarter year from the first quarter of 2006 to the fourth quarter of 2014 in millions of dollars. Over this time period, sales of codeine, fentanyl, hydrocodone and morphine remained stable; sales of hydromorphone gradually increased; and sales of oxycodone increased gradually, reaching $271 million in 2001, before decreasing to $172 million in 2014.
|
Oxycodone |
Hydromorphone |
Codeine |
Fentanyl |
Hydrocodone |
Morphine |
| Q1-2006 |
42.9 |
12.9 |
22.9 |
25.4 |
1.6 |
13.5 |
| Q2-2006 |
44.1 |
13.1 |
22.3 |
26.7 |
1.2 |
13.7 |
| Q3-2006 |
44.1 |
13.1 |
21.3 |
27.4 |
0.8 |
13.6 |
| Q4-2006 |
46.6 |
14.0 |
23.5 |
24.2 |
1.8 |
13.9 |
| Q1-2007 |
46.7 |
14.2 |
23.2 |
22.1 |
1.8 |
13.1 |
| Q2-2007 |
48.9 |
15.3 |
21.8 |
19.3 |
1.1 |
13.1 |
| Q3-2007 |
50.1 |
15.5 |
21.4 |
19.0 |
1.0 |
13.3 |
| Q4-2007 |
52.8 |
16.2 |
22.7 |
19.5 |
1.7 |
13.4 |
| Q1-2008 |
53.8 |
16.1 |
23.2 |
18.7 |
2.0 |
13.5 |
| Q2-2008 |
56.5 |
16.6 |
23.0 |
18.8 |
1.6 |
12.8 |
| Q3-2008 |
59.1 |
17.4 |
22.3 |
18.4 |
1.1 |
13.4 |
| Q4-2008 |
61.2 |
18.5 |
23.7 |
19.0 |
2.0 |
13.2 |
| Q1-2009 |
60.1 |
18.2 |
22.1 |
17.8 |
2.1 |
12.6 |
| Q2-2009 |
61.4 |
19.3 |
22.3 |
18.4 |
1.6 |
12.3 |
| Q3-2009 |
62.9 |
20.3 |
21.0 |
18.5 |
1.2 |
12.3 |
| Q4-2009 |
64.6 |
20.7 |
23.1 |
19.0 |
2.4 |
12.4 |
| Q1-2010 |
63.7 |
20.6 |
21.6 |
18.5 |
1.8 |
12.1 |
| Q2-2010 |
65.5 |
21.7 |
21.2 |
19.2 |
1.5 |
12.2 |
| Q3-2010 |
67.3 |
22.5 |
21.8 |
18.8 |
1.2 |
12.0 |
| Q4-2010 |
68.5 |
23.5 |
23.2 |
18.6 |
2.4 |
11.6 |
| Q1-2011 |
66.4 |
22.9 |
22.1 |
16.5 |
2.3 |
11.2 |
| Q2-2011 |
67.6 |
24.2 |
21.5 |
15.3 |
1.7 |
11.5 |
| Q3-2011 |
68.4 |
24.4 |
20.6 |
16.6 |
1.2 |
10.8 |
| Q4-2011 |
68.2 |
25.0 |
22.2 |
16.1 |
2.0 |
10.9 |
| Q1-2012 |
68.1 |
24.9 |
21.1 |
15.6 |
1.9 |
10.4 |
| Q2-2012 |
57.0 |
27.2 |
20.6 |
15.9 |
1.2 |
11.1 |
| Q3-2012 |
53.0 |
28.5 |
20.5 |
15.6 |
0.9 |
10.3 |
| Q4-2012 |
52.5 |
30.1 |
23.6 |
15.9 |
1.7 |
10.9 |
| Q1-2013 |
46.3 |
30.1 |
21.2 |
15.4 |
1.8 |
10.8 |
| Q2-2013 |
43.6 |
32.8 |
20.7 |
16.3 |
1.2 |
11.1 |
| Q3-2013 |
44.1 |
33.9 |
21.7 |
16.7 |
1.1 |
11.5 |
| Q4-2013 |
44.5 |
34.0 |
22.9 |
16.5 |
1.6 |
11.5 |
| Q1-2014 |
41.7 |
33.5 |
22.1 |
15.6 |
1.6 |
11.1 |
| Q2-2014 |
42.9 |
34.7 |
21.6 |
16.1 |
1.2 |
11.0 |
| Q3-2014 |
43.6 |
36.2 |
20.8 |
16.3 |
0.9 |
11.2 |
| Q4-2014 |
43.7 |
37.2 |
22.0 |
16.9 |
1.8 |
11.0 |
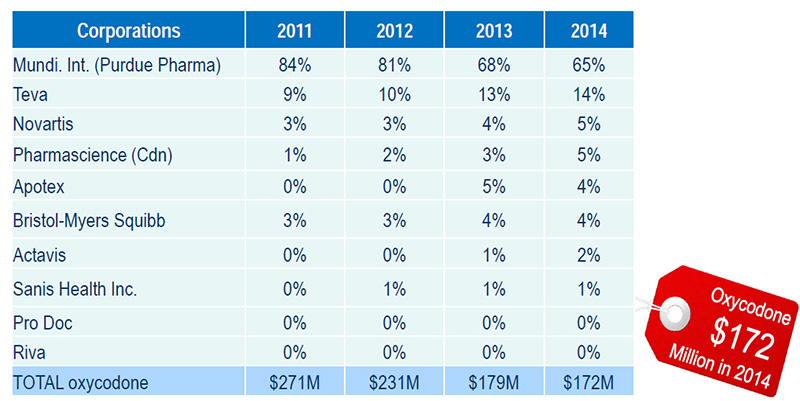
Purdue Pharma tops the list of corporations supplying oxycodone in Canada
Purdue Pharma produce(d): OxyNEO, Targin, Oxy.IR and OxyContin (discontinued)
Source: MIDAS™, IMS AG. All rights reserved.
Figure description
| Corporations |
2011 |
2012 |
2013 |
2014 |
| Mundi. Int. (Purdue Pharma) |
84% |
81% |
68% |
65% |
| Teva |
9% |
10% |
13% |
14% |
| Novartis |
3% |
3% |
4% |
5% |
| Pharmascience (Cdn) |
1% |
2% |
3% |
5% |
| Apotex |
0% |
0% |
5% |
4% |
| Bristol-Myers Squibb |
3% |
3% |
4% |
4% |
| Actavis |
0% |
0% |
1% |
2% |
| Sanis Health Inc. |
0% |
1% |
1% |
1% |
| Pro Doc |
0% |
0% |
0% |
0% |
| Riva |
0% |
0% |
0% |
0% |
| TOTAL oxycodone |
$271M |
$231M |
$179M |
$172M |
Units and sales of oxycodone in Canada, 2014
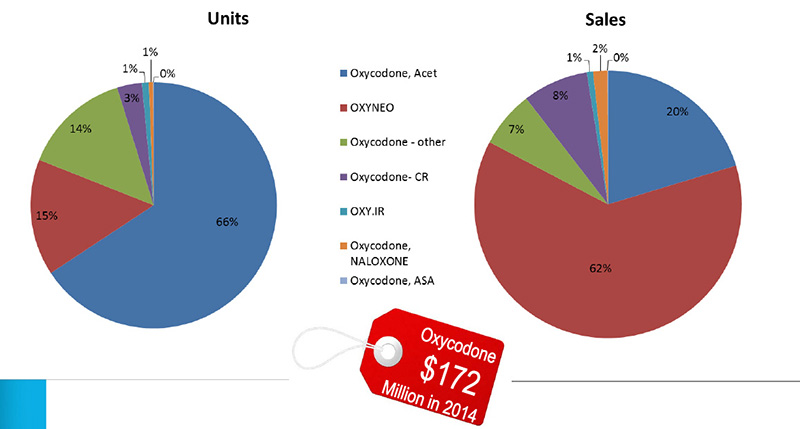
Oxycodone – other: SUPEUDOL, PMS-OXYCODONE, OXYCODONE (generic)
Source: MIDAS™, IMS AG. All rights reserved.
Figure description
These two pie charts give the share of units and sales for oxycodone in 2014. The total for all oxycodone sales was $172 million.
Left-hand pie chart – share of units
Oxycodone, Acet: 66%; OXYNEO: 15%; Oxycodone – other: 14%; Oxycodone-CR: 3%; OXY.IR: 1%; Oxycodone, NALOXONE: 1%; Oxycodone, ASA: 0%.
Right-hand pie chart – share of sales
Oxycodone, Acet: 20%; OXYNEO: 62%; Oxycodone – other: 7%; Oxycodone-CR: 8%; OXY.IR: 1%; Oxycodone, NALOXONE: 2%; Oxycodone, ASA: 0%.
Canadian utilization of oxycodone, 2014 - Brand versus generic
With the exception of Purdue Pharma products (OxyNEO, Oxy.IR and Targin), the oxycodone market is primarily generic (units, 2014)
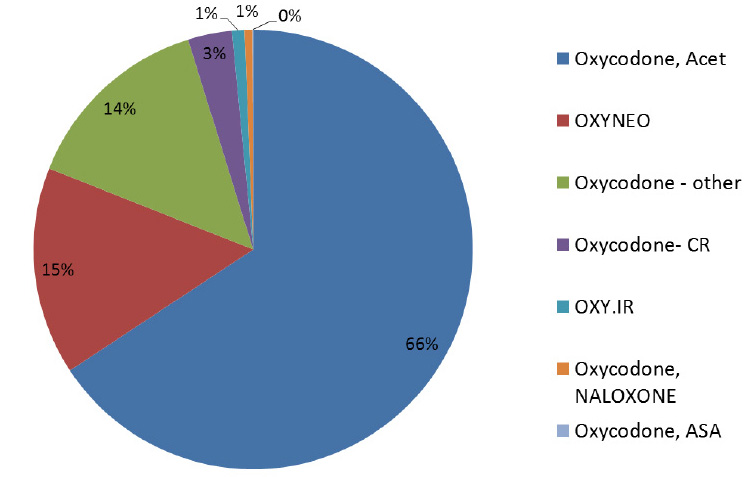
Oxycodone – other: SUPEUDOL, PMS-OXYCODONE, OXYCODONE (generic)
Source: MIDAS™, IMS AG. All rights reserved.
Figure description
This pie chart gives the share of units for oxycodone in 2014.
Oxycodone, Acet: 66%; OXYNEO: 15%; Oxycodone – other: 14%; Oxycodone-CR: 3%; OXY.IR: 1%; Oxycodone, NALOXONE: 1%; Oxycodone, ASA: 0%.
Switch from OxyContin to OxyNEO (units) - Units sold in Canada, by type of oxycodone drug
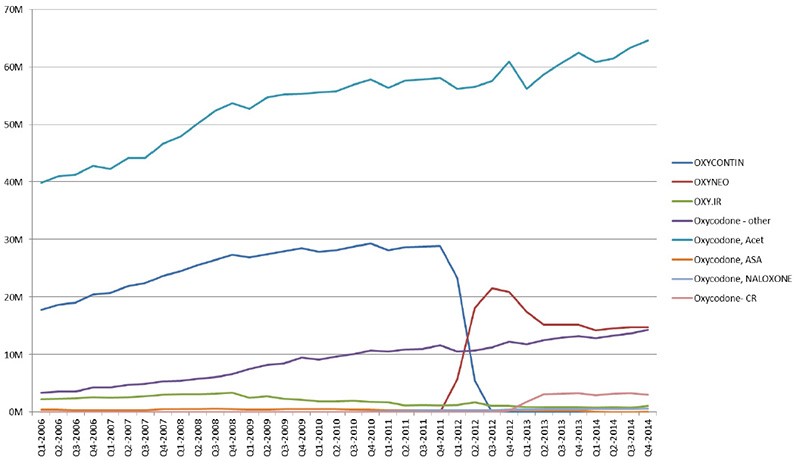
Oxycodone – other: SUPEUDOL, PMS-OXYCODONE, OXYCODONE (generic)
Source: MIDAS™, IMS AG. All rights reserved.
Figure description
This line graph illustrates the trends in oxycodone drugs sold for each quarter year from the first quarter of 2006 to the fourth quarter of 2014 in millions of units, highlighting the impact of the switch from OxyContin to OxyNEO.
Switch from OxyContin to OxyNEO (sales) - Sales in Canada, by type of oxycodone drug
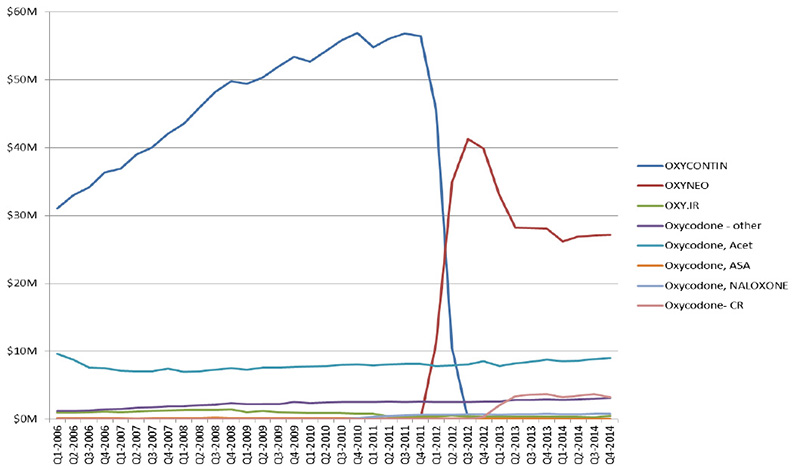
Oxycodone – other: SUPEUDOL, PMS-OXYCODONE, OXYCODONE (generic)
Source: MIDAS™, IMS AG. All rights reserved.
Figure description
This line graph illustrates the trends in oxycodone drug sales for each quarter year from the first quarter of 2006 to the fourth quarter of 2014 in millions of dollars, highlighting the impact of the switch from OxyContin to OxyNEO.
2. NPDUIS Public Plans
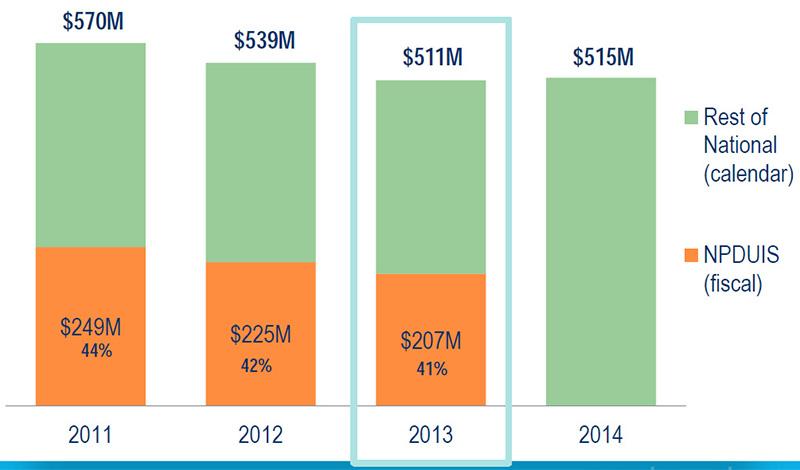
MIDAS vs. NPDUIS database - Drug cost in NPDUIS plans vs. national sales, opioids
Source: MIDAS™, IMS AG. All rights reserved.
National Prescription Drug Utilization Information System Database, Canadian Institute for Health Information.
NPDUIS plans include public plans in BC, AB, SK, MB, ON, NB, NS, PEI, NFL and the NIHB.
Figure description
This bar graph compares the proportion of the total drug sales for opioids in the NPDUIS public plans (based on fiscal year) with the national sales (based on calendar year) for each year from 2011 to 2014.
2011: total sales $570 million; NPDUIS plans $249 million (44% of the total).
2012: total sales $539 million; NPDUIS plans $225 million (42% of the total).
2013: total sales $511 million; NPDUIS plans $207 million (41% of the total).
2014: total sales $515 million; NPDUIS portion is not given for this year.
Opioid share of cost in NPDUIS plans, 2013/14
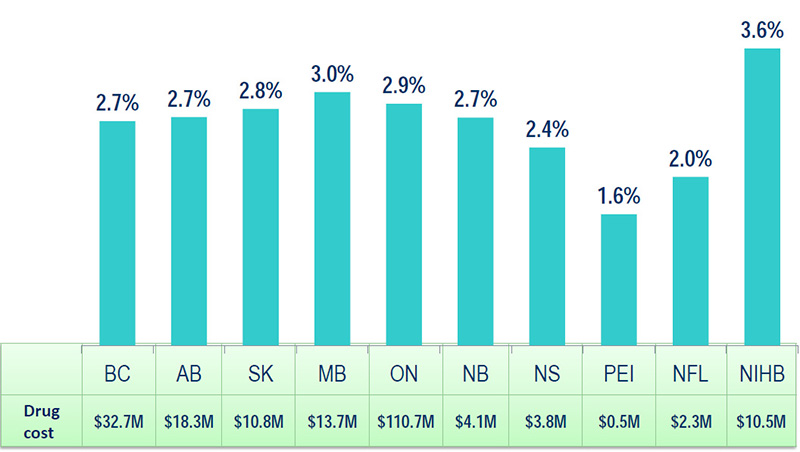
Source: National Prescription Drug Utilization Information System Database, Canadian Institute for Health Information.
NPDUIS plans include public plans in BC, AB, SK, MB, ON, NB, NS, PEI, NFL and the NIHB.
Figure description
| Public drug plan |
Drug cost in millions of dollars |
Opioid share of drug cost in percent |
| British Columbia |
32.7 |
2.7 |
| Alberta |
18.3 |
2.7 |
| Saskatchewan |
10.8 |
2.8 |
| Manitoba |
13.7 |
3.0 |
| Ontario |
110.7 |
2.9 |
| New Brunswick |
4.1 |
2.7 |
| Nova Scotia |
3.8 |
2.4 |
| Prince Edward Island |
0.5 |
1.6 |
| Newfoundland and Labrador |
2.3 |
2.0 |
| Non-Insured Health Benefits Program |
10.5 |
3.6 |
MIDAS and Payer Insight databases, 2013 - Opioid sales distribution by market segment
Sources:
MIDAS™, IMS AG. All rights reserved.
IMS Brogan Payer Insight
Figure description
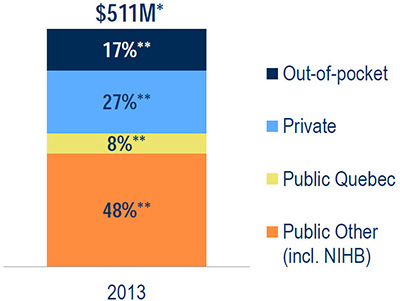
This bar graph gives the share**of total opioid sales ($511 million*) by market segment in 2013.
Out-of-pocket: 17%; private 27%; public Quebec: 8%; other public including the Non-Insured Health Benefits Program: 48%.
3. Considerations for the estimated cost impact of the TRPDR
Methodology - Two scenarios
STATUS QUO – Estimated 2019 sales assuming no TRPDR
- Projects the current trends assuming no tamper-resistant requirements.
TRPDR – Estimated 2019 sales under the proposed regulations
- Assumes that the tamper-resistant requirements come into effect starting in 2019 and all solid oral dosage forms of controlled-release oxycodone products, where oxycodone is the only medicinal ingredient, will only be available in tamper-resistant form.
Estimated Cost Impact – 2019
- The difference between the TRPDR 2019 sales and the STATUS QUO 2019 sales.
- The impact is determined by market segment: public, private and out-of-pocket.
- The impact is reported as an absolute amount and as relative amounts for the oxycodone market, as well as an amount for the entire opioid market, in 2019.
Methodology - Two sensitivity analyses
Given the limited historical trends for oxycodone CR (2 years: Q4-2012 to Q4-2014) and the difficulty in forecasting five years (2015–2019), two sensitivity analyses were conducted related to the expected future trends in oxycodone CR.
The results provide an interval of where the potential market for oxycodone CR may be in 5 years. The two scenarios are viewed as the upper and the lower limits for the size of the oxycodone CR market in 2019:
- Sensitivity Analysis 1 – No growth
- Oxycodone CR use remains at 2014 levels
- Sensitivity Analysis 2 – High growth
- Oxycodone CR continues to grow at the rate of growth observed since its introduction into the market in Q4-2012
Two sensitivity analyses - No growth vs. high growth in oxycodone CR

*MIDAS™, IMS AG. All rights reserved.
Figure description
This line graph forecasts the trends in the volume of Oxycodone CR units sold for the two sensitivity analyses (Sensitivity Analysis 1: No Growth and Sensitivity Analysis 2: High Growth) from the fourth quarter of 2012 to the fourth quarter of 2019 in millions of units, along with the actual growth from the fourth quarter of 2012 to the fourth quarter of 2014.
Methodology - Two assumptions
Oxycodone CR would be substituted for:
Assumption 1 – OxyNEO and hydromorphone LA
- The oxycodone CR use in public (mostly QC) (21%) and private (18%) plans will switch to OxyNEO
- Out-of-pocket* use of oxycodone CR (61%) will switch to:
- OxyNEO (11%)
- Hydromorphone (50%) – next potent opioid with comparable price
Assumption 2 – OxyNEO, hydromorphone LA and fentanyl
- Public and private use (same as in Assumption 1)
- Out-of-pocket* use of oxycodone CR (61%) will switch to:
- OxyNEO (11%) and hydromorphone (50%)
- Exception is oxycodone CR 80 mg, which will switch to OxyNEO (11%), hydromorphone (20%) and fentanyl (30%)
*Assignment based on observed distribution of opioids in the out-of-pocket market.
Relative Strength of Opioids - Morphine Equivalents
Source: Payer Insight, IMS Brogan. All rights reserved.
Figure description
This bar graph indicates the relative strength of various opioids using morphine equivalent measurements, where the strength of morphine is set to 1: meperidine, 0.1; codeine, 0.15; morphine, 1; oxycodone, 1.5; hydromorphone, 5; fentanyl, 80 to 100.
Oxycodone CR allocation to hydromorphone LA and fentanyl patch
Oxycodone CR use allocated to OxyNEO ensured the matching of strengths.
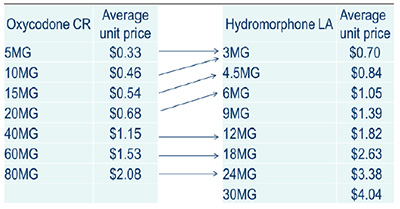
Oxycodone CR use was allocated to hydromorphone LA as presented
*MIDAS™, IMS AG. All rights reserved.
Figure description
Oxycodone CR use was allocated to hydromorphone LA:
- 5 mg oxycodone CR to 3 mg hydromorphone LA
- 10 mg oxycodone CR to 3 mg hydromorphone LA
- 15 mg oxycodone CR to 4.5 mg hydromorphone LA
- 20 mg oxycodone CR to 6 mg hydromorphone LA
- 40 mg oxycodone CR to 12 mg hydromorphone LA
- 60 mg oxycodone CR to 18 mg hydromorphone LA
- 80 mg oxycodone CR to 24 mg hydromorphone LA
| Oxycodone CR |
Average unit price |
Hydromorphone LA |
Average unit price |
| 5MG |
$0.33 |
3MG |
$0.70 |
| 10MG |
$0.46 |
4.5MG |
$0.84 |
| 15MG |
$0.54 |
6MG |
$1.05 |
| 20MG |
$0.68 |
9MG |
$1.39 |
| 40MG |
$1.15 |
12MG |
$1.82 |
| 60MG |
$1.53 |
18MG |
$2.63 |
| 80MG |
$2.08 |
24MG |
$3.38 |
| blank |
blank |
30MG |
$4.04 |
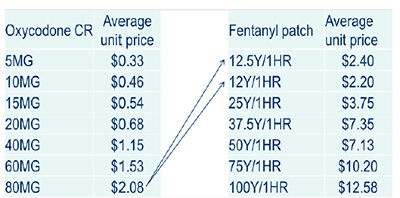
Oxycodone CR use was allocated to the fentanyl patch as presented
*MIDAS™, IMS AG. All rights reserved.
Figure description
Oxycodone CR use was allocated to the fentanyl patch
- 80 mg oxycodone CR to 12.5 Y/HR and 12 Y/HR fentanyl patch
| Oxycodone CR |
Average unit price |
Fentanyl patch |
Average unit price |
| 5MG |
$0.33 |
12.5Y1HR |
$2.40 |
| 10MG |
$0.46 |
12Y/1HR |
$2.20 |
| 15MG |
$0.54 |
25Y/1HR |
$3.75 |
| 20MG |
$0.68 |
37.5Y/1HR |
$7.35 |
| 40MG |
$1.15 |
50Y/1HR |
$7.13 |
| 60MG |
$1.53 |
75Y/1HR |
$10.20 |
| 80MG |
$2.08 |
100Y/1HR |
$12.58 |
Formulary listing – Oxycodone
Only Quebec lists oxycodone CR.
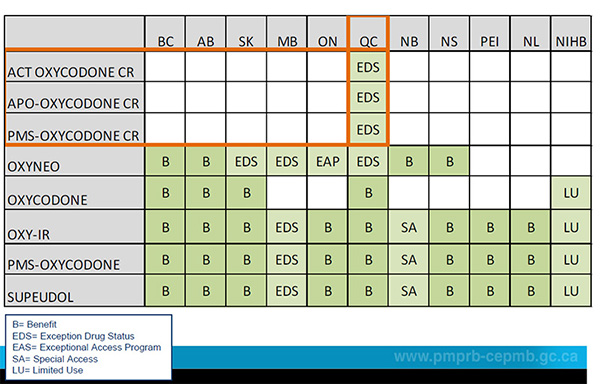
Figure description
|
BC |
AB |
SK |
MB |
ON |
QC |
NB |
NS |
PEI |
NL |
NIHB |
| ACT OXYCODONE CR |
blank |
blank |
blank |
blank |
blank |
EDS |
blank |
blank |
blank |
blank |
blank |
| APO-OXYCODONE CR |
blank |
blank |
blank |
blank |
blank |
EDS |
blank |
blank |
blank |
blank |
blank |
| PMS-OXYCODONE CR |
blank |
blank |
blank |
blank |
blank |
EDS |
blank |
blank |
blank |
blank |
blank |
| OXYNEO |
B |
B |
EDS |
EDS |
EAP |
EDS |
B |
B |
blank |
blank |
blank |
| OXYCODONE |
B |
B |
B |
blank |
blank |
B |
blank |
blank |
blank |
blank |
LU |
| OXY-IR |
B |
B |
B |
EDS |
B |
B |
SA |
B |
B |
B |
LU |
| PMS-OXYCODONE |
B |
B |
B |
EDS |
B |
B |
SA |
B |
B |
B |
LU |
| SUPEUDOL |
B |
B |
B |
EDS |
B |
B |
SA |
B |
B |
B |
LU |
- B = Benefit
- EDS = Exception Drug Status
- EAS = Exceptional Access Program
- SA = Special Access
- LU = Limited Use
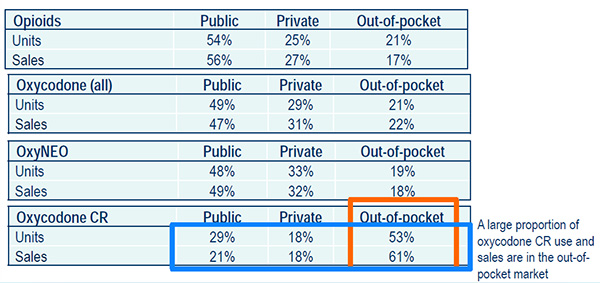
The distribution of units and sales by market segment, 2013
The 2019 markets for oxycodone products and other opioids were allocated to each of the three market segments (public, private and out-of-pocket) using the distribution observed in the 2013 Payer Insight databases.
Source: Payer Insight, IMS Brogan. All rights reserved.
Figure description
| Opioids |
Public |
Private |
Out-of-pocket |
| Units |
54% |
25% |
21% |
| Sales |
56% |
27% |
17% |
| Oxycodone (all) |
Public |
Private |
Out-of-pocket |
| Units |
49% |
29% |
21% |
| Sales |
47% |
31% |
22% |
| OxyNEO |
Public |
Private |
Out-of-pocket |
| Units |
48% |
33% |
19% |
| Sales |
49% |
32% |
18% |
| Oxycodone CR |
Public |
Private |
Out-of-pocket |
| Units |
29% |
18% |
53% |
| Sales |
21% |
18% |
61% |
A large proportion of oxycodone CR used and sales are in the out-of-pocket market.
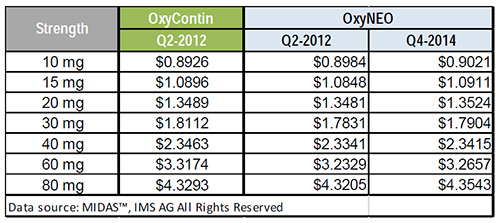
The price of OxyNEO
The average manufacture unit price for OxyNEO after market entry was in line with the corresponding price of OxyContin prior to market exit.
From a PMPRB regulatory standpoint:
- OxyNEO offered slight or no improvement over its comparator drugs.
- OxyContin was the only therapeutic class comparator for OxyNEO.
- The therapeutic class comparison conducted by the PMPRB established a ceiling price.
The average manufacture unit price of OxyNEO after market entry was comparable to the PMPRB ceiling price.
Over the period Q2-2014 to Q4-2014, the average manufacture unit price for OxyNEO increased slightly.
Average manufacture unit price: OxyNEO vs. OxyContin
Source: MIDAS™, IMS AG. All rights reserved.
Figure description
| Strength |
OxyContin
Q2-2012 |
OxyNEO
Q2-2012 |
OxyNEO
Q4-2014 |
| 10 mg |
$0.8926 |
$0.8984 |
$0.9021 |
| 15 mg |
$1.0896 |
$1.0848 |
$1.0911 |
| 20 mg |
$1.3489 |
$1.3481 |
$1.3524 |
| 30 mg |
$1.8112 |
$1.7831 |
$1.7904 |
| 40 mg |
$2.3463 |
$2.3341 |
$2.3415 |
| 60 mg |
$3.3174 |
$3.2329 |
$3.2657 |
| 80 mg |
$4.3293 |
$4.3205 |
$4.3543 |
MIDAS™, IMS AG. All rights reserved.
2019 prices – Assumptions in TRPDR
It is expected that in the coming years the price of OxyNEO will not markedly increase.
- The TRPDR cost impact analysis assumes an annual 1.3% CPI increase in determining the prices of OxyNEO in 2019.
For other opioids:
- For drugs that have had price increases in recent years, an annual 1.3% CPI increase was applied to estimate the 2019 prices.
4. Estimated cost impact of the TRPDR
Opioid market projections to 2019 - Status quo
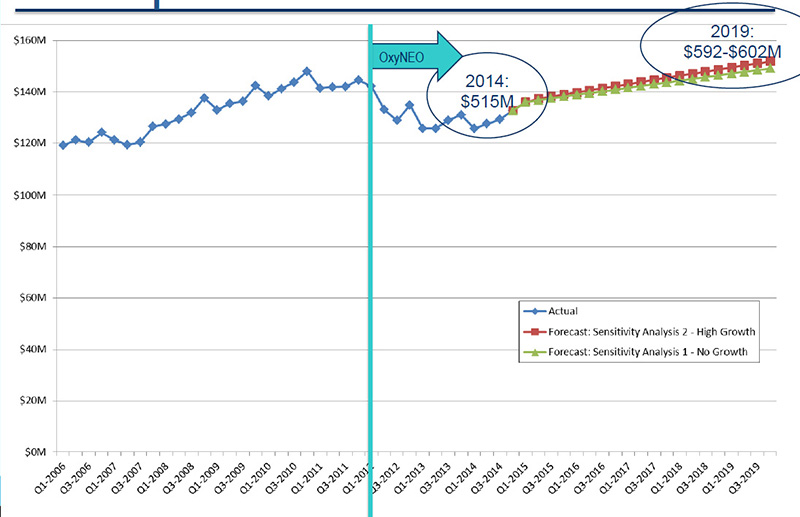
Source: MIDAS™, IMS AG. All rights reserved.
Figure description
This line graph illustrates opioid market projections for the two sensitivity analyses (Sensitivity Analysis 1: No Growth and Sensitivity Analysis 2: High Growth) from the fourth quarter of 2014 to the fourth quarter of 2019 in millions of dollars, along with the actual market growth from the first quarter of 2006 to the fourth quarter of 2014.
Opioid market projections to 2019 - Impact of TRPDR
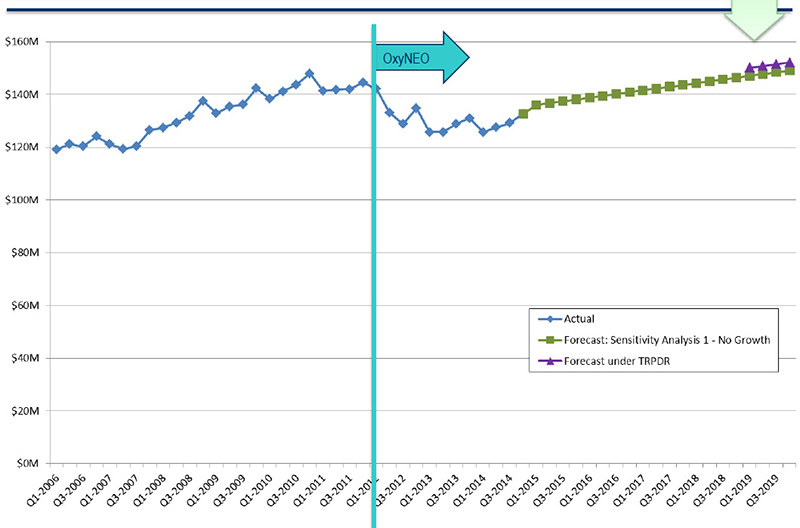
Source: MIDAS™, IMS AG. All rights reserved.
Figure description
This line graph illustrates opioid market projections to 2019 for two analyses (Sensitivity Analysis 1: No Growth and a forecast based on the impact of the Tamper-Resistant Properties of Drugs Regulations) in millions of dollars, along with the actual market growth from the first quarter of 2006 to the fourth quarter of 2014.
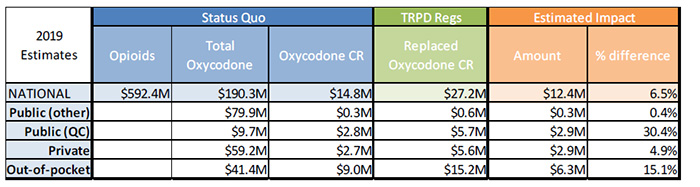
Estimated cost impact of the TRPDR
Assumption 1: Out-of-pocket market only switches to OxyNEO and hydromorphone LA
Sensitivity Analysis 1 – No growth in oxycodone CR
Sources:
MIDAS™, IMS AG. All rights reserved
IMS Brogan Payer Insight
Figure description
| 2019 Estimates |
Status Quo |
TRPD Regs |
Estimated Impact |
| Opioids |
Total Oxycodone |
Oxycodone CR |
Replaced Oxycodone CR |
Amount |
% difference |
| National |
$592.4M |
$190.3M |
$14.8M |
$27.2M |
$12.4M |
6.5% |
| Public (other) |
|
$79.9M |
$0.3M |
$0.6M |
$0.3M |
0.4% |
| Public (QC) |
|
$9.7M |
$2.8M |
$5.7M |
$2.9M |
30.4% |
| Private |
|
$59.2M |
$2.7M |
$5.6M |
$2.9M |
4.9% |
| Out-of-pocket |
|
$41.4M |
$9.0M |
$15.2M |
$6.3M |
15.1% |
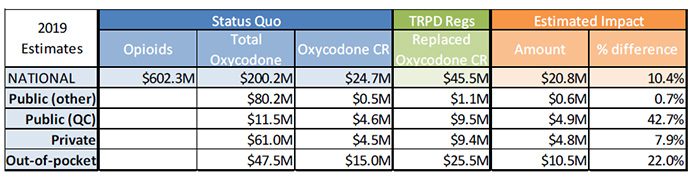
Sensitivity Analysis 2 – High growth in oxycodone CR
Sources:
MIDAS™, IMS AG. All rights reserved
IMS Brogan Payer Insight
Figure description
| 2019 Estimates |
Status Quo |
TRPD Regs |
Estimated Impact |
| Opioids |
Total Oxycodone |
Oxycodone CR |
Replaced Oxycodone CR |
Amount |
% difference |
| National |
$602.3M |
$200.2M |
$24.7M |
$45.5M |
$20.8M |
10.4% |
| Public (other) |
|
$80.2M |
$0.5M |
$1.1M |
$0.6M |
0.7% |
| Public (QC) |
|
$11.5M |
$4.6M |
$9.5M |
$4.9M |
42.7% |
| Private |
|
$61.0M |
$4.5M |
$9.4M |
$4.8M |
7.9% |
| Out-of-pocket |
|
$47.5M |
$15.0M |
$25.5M |
$10.5M |
22.0% |
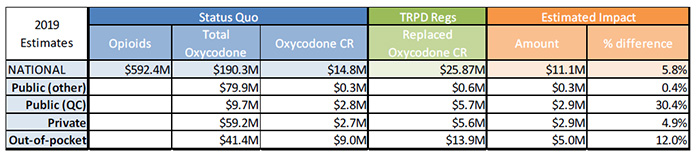
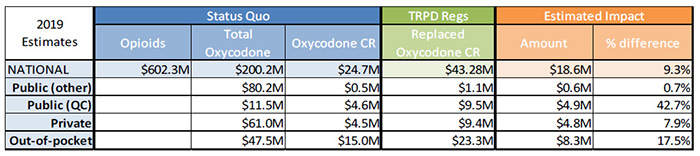
Estimated cost impact of the TRPDR
Assumption 2: Out-of-pocket market switches to OxyNEO, hydromorphone LA and fentanyl patch (minimal variation in impact compared to Assumption 1)
Sensitivity Analysis 1 – No growth in oxycodone CR
Sources:
MIDAS™, IMS AG. All rights reserved
IMS Brogan Payer Insight
Figure description
| 2019 Estimates |
Status Quo |
TRPD Regs |
Estimated Impact |
| Opioids |
Total Oxycodone |
Oxycodone CR |
Replaced Oxycodone CR |
Amount |
% difference |
| National |
$592.4M |
$190.3M |
$14.8M |
$25.87M |
$11.1M |
5.8% |
| Public (other) |
|
$79.9M |
$0.3M |
$0.6M |
$0.3M |
0.4% |
| Public (QC) |
|
$9.7M |
$2.8M |
$5.7M |
$2.9M |
30.4% |
| Private |
|
$59.2M |
$2.7M |
$5.6M |
$2.9M |
4.9% |
| Out-of-pocket |
|
$41.4M |
$9.0M |
$13.9M |
$5.0M |
12.0% |
Sensitivity Analysis 2 – High growth in oxycodone CR
Sources:
MIDAS™, IMS AG. All rights reserved
IMS Brogan Payer Insight
Figure description
| 2019 Estimates |
Status Quo |
TRPD Regs |
Estimated Impact |
| Opioids |
Total Oxycodone |
Oxycodone CR |
Replaced Oxycodone CR |
Amount |
% difference |
| National |
$602.3M |
$200.2M |
$24.7M |
$43.28M |
$18.6M |
9.3% |
| Public (other) |
|
$80.2M |
$0.5M |
$1.1M |
$0.6M |
0.7% |
| Public (QC) |
|
$11.5M |
$4.6M |
$9.5M |
$4.9M |
42.7% |
| Private |
|
$61.0M |
$4.5M |
$9.4M |
$4.8M |
7.9% |
| Out-of-pocket |
|
$47.5M |
$15.0M |
$23.3M |
$8.3M |
17.5% |
Limitations
This analysis makes important assumptions in its projections:
Forecasts five years of opioid utilization (2015–2019) based on nine years of data (2006–2014).
- In the case of OxyNEO, only three years of data (2012–2014) were available and were used to forecast to 2019.
- In the case of oxycodone CR only two years of data (2013–2014) were available and were used to forecast to 2019.
The breakdown of the national use and sales of opioids (including oxycodone CR) for 2019 was based the breakdown observed in 2013. This distribution may evolve over time and may be slightly different in 2019.
The analysis does not take into account the market entry of additional oxycodone tamper-resistant products supplied by different manufacturers, and the impact that this may have on the price of the tamper-resistant version in 2019.
The analysis does not project the cost implications beyond 2019.
- OxyNEO is expected to lose patent protection in 2026, which would mean that the estimated cost implications are expected to extend over an eight-year period.
Conclusions
It is estimated that the Canadian sales for opioids would be in the range of $592.4 to $602.3 million by 2019, with oxycodone sales ranging from $190.3 to $200.2 million.
The sales for the controlled released version of oxycodone were estimated to be in the range of $14.8 to $24.7 million, depending on the future uptake of this relatively new drug.
- The out-of-pocket market makes up the largest share of the sales, estimated to be in the range of $9.0 to $15.0 million.
- The private payer and the Quebec public payer markets were estimated to be fairly comparable in terms of sales, each estimated to be in the range of $2.7 to $4.6 million.
The cost impact of the TRPDR for the Canadian national market was estimated for 2019 to range from $11.1 to $20.8 million, depending on the future uptake of this relatively new drug as well as assumptions of the switching to hydromorphone LA and the fentanyl patch.
- The out-of-pocket market would be the most impacted, with $5.0 to $10.5 million increased sales.
- The impact on private payer and the Quebec public payer markets were estimated to be similarly. Each would see an increase in sales ranging from $2.9 to $4.9.